145
Heathrow Expansion PRELIMINARY ENVIRONMENTAL INFORMATION REPORT: Chapter 7: Air quality and odour © Heathrow Airport Limited 2019 Volume 1, Chapter 7 Air quality and odour
Heathrow Expansion PRELIMINARY ENVIRONMENTAL INFORMATION REPORT: Chapter 7: Air quality and odour
© Heathrow Airport Limited 2019
Volume 1, Chapter 7
Air quality and odour
Heathrow Expansion PRELIMINARY ENVIRONMENTAL INFORMATION REPORT: Chapter 7: Air quality and odour
© Heathrow Airport Limited 2019
CONTENTS
7. Air quality and odour 7.1
7.1 Introduction 7.1
7.2 Relevant legislation, policy and other important and relevant matters 7.2 Introduction 7.2 Relevant legislation, policy and other important and relevant matters 7.2 Regional and local planning policy 7.8 Other important and relevant matters 7.9
7.3 Scoping and engagement 7.9 Overview 7.9 Scoping Opinion 7.9 Technical engagement 7.16
7.4 Scope of the assessment 7.18 Overview 7.18 Spatial scope and study area 7.18 Temporal scope 7.21 Receptors 7.23 Identification of potential effects 7.24 Effects no longer being considered 7.25
7.5 Embedded environmental measures 7.29
7.6 Methodology for baseline data gathering 7.40 Desk study 7.40
7.7 Assessment methodology for PEIR 7.41 Assessment methodology evolution 7.41 Construction assessment methodology 7.43 Operational assessment methodology 7.47 Cumulative effects 7.53
7.8 Assumptions and limitations of this PEIR 7.53
7.9 Overall baseline 7.56 Current baseline 7.56 Future baseline 7.65
7.10 Assessment of air quality and odour effects 7.66 Introduction 7.66 Construction 7.66 Pollutant concentrations during construction and operation 7.74 EU limit value compliance 7.121 Operational odour 7.127
7.11 Preliminary assessment of significance 7.130
7.12 Assessment of cumulative effects 7.134 Introduction 7.134 Emissions from road traffic 7.134 Emissions from other sources 7.136 Phase 1: c.2022-2026 7.138 Phase 2: c. late 2026-2035 7.138 Phase 3: c.2036-2050 7.139
7.13 Consideration of additional environmental measures and compensation 7.139
7.14 Next steps 7.139
Heathrow Expansion PRELIMINARY ENVIRONMENTAL INFORMATION REPORT: Chapter 7: Air quality and odour
© Heathrow Airport Limited 2019
Introduction 7.139 Baseline 7.139 Assessment 7.139 Engagement 7.140
TABLE OF TABLES
Table 7.1: Legislation relevant to air quality and odour 7.2 Table 7.2: National planning policies relevant to air quality and odour 7.6 Table 7.3: PINS Scoping Opinion 7.10 Table 7.4: Examples of where the air quality objectives should apply (Defra, 2016) 7.23 Table 7.5: Potential effects on air quality and odour receptors scoped in for further assessment7.24 Table 7.6: Effects no longer considered in this PEIR 7.26 Table 7.7: Summary of the embedded environmental measures in the design and how these influence the air quality and odour assessment 7.30 Table 7.8: Summary of the good practice environmental measures and how these influence the air quality and odour assessment 7.35 Table 7.9: Data sources used to inform the air quality and odour assessment 7.40 Table 7.10: Assessment methodology for the PEIR and EIA 7.41 Table 7.11: Sensitivity of area to dust soiling effects on people and properties 7.44 Table 7.12: Sensitivity of area to human health impacts 7.45 Table 7.13: Matrix to determine pathway effectiveness 7.46 Table 7.14: Risk of odour exposure at the specific receptor location 7.47 Table 7.15: Descriptors of odour impact magnitude 7.47 Table 7.16: Impact descriptors for individual receptors – urban road network 7.51 Table 7.17: Impact descriptors for individual receptors – Strategic Road Network 7.52 Table 7.18: UK air quality objectives and pollutants – LAQM in England 7.56 Table 7.19: Automatic air quality monitoring station details and measured annual mean NO2 concentrations (µg/m3) 7.60 Table 7.20: Automatic air quality monitoring station details and measured annual mean PM10 concentrations (µg/m3) 7.62 Table 7.21: Automatic air quality monitoring station details and measured annual mean PM2.5 concentrations (µg/m3) 7.63 Table 7.22: Dust emission magnitude 7.66 Table 7.23: Sensitivity of areas to dust soiling effects and human health effects 7.67 Table 7.24: Risks of dust soiling impacts and human health impacts 7.68 Table 7.25: Construction odour risk-based assessment 7.73 Table 7.26: Dispersion modelling results for Harmondsworth 7.77 Table 7.27: Dispersion modelling results for West Drayton 7.80 Table 7.28: Dispersion modelling results for Sipson 7.83 Table 7.29: Dispersion modelling results for Harlington 7.86 Table 7.30: Dispersion modelling results for Hayes 7.89 Table 7.31: Dispersion modelling results for Cranford Cross 7.91 Table 7.32: Dispersion modelling results for Cranford 7.93 Table 7.33: Dispersion modelling results for Heston 7.95 Table 7.34: Dispersion modelling results for Hounslow (Central and South) 7.97 Table 7.35: Dispersion modelling results for Hounslow (West and Heath) 7.99 Table 7.36: Dispersion modelling results for Feltham North 7.101 Table 7.37: Dispersion modelling results for Bedfont 7.103 Table 7.38: Dispersion modelling results for Stanwell 7.105 Table 7.39: Dispersion modelling results for Stanwell Moor 7.107 Table 7.40: Dispersion modelling results for Poyle 7.109 Table 7.41: Dispersion modelling results for Colnbrook 7.111 Table 7.42: Dispersion modelling results for Brands Hill 7.113 Table 7.43: Dispersion modelling results for Iver and Richings Park 7.116
Heathrow Expansion PRELIMINARY ENVIRONMENTAL INFORMATION REPORT: Chapter 7: Air quality and odour
© Heathrow Airport Limited 2019
Table 7.44: Address points within Core AQO Assessment Area by impact descriptor 7.118 Table 7.45: Address point count by magnitude of change in concentration 7.118 Table 7.46: Local air quality receptors informing significance 7.119 Table 7.47: Overall evaluation of local air quality (NO2) significance 7.119 Table 7.48: NO2 annual mean EU limit value compliance in 2022 7.123 Table 7.49: NO2 annual mean EU limit value compliance in 2027 7.123 Table 7.50: NO2 annual mean EU limit value compliance in 2030 7.124 Table 7.51: Operational odour risk-based assessment 7.129 Table 7.52: Summary of significance of adverse and beneficial effects 7.131 Table 7.53: Air quality, odour and dust CEA screening 7.136 Table 7.54: Developments brought forward for CEA 7.137
TABLE OF GRAPHICS
Graphic 7.1: Tiered assessment of potential effects outside of the Core AQO Assessment Area 7.50 Graphic 7.2: Wind rose for Heathrow Airport meteorological data 2013 – 2017 7.72
APPENDICES
Appendix 7.1: Technical appendix on dispersion modelling
Heathrow Expansion PRELIMINARY ENVIRONMENTAL INFORMATION REPORT: Chapter 7: Air quality and odour
7.1 © Heathrow Airport Limited 2019
7. AIR QUALITY AND ODOUR
7.1 Introduction
7.1.1 This chapter of the Preliminary Environmental Information Report (PEIR) presents
the preliminary results of the assessment of the likely significant effects of the
DCO Project with respect to air quality and odour. It should be read in conjunction
with the project description provided in Chapter 6: DCO Project description and
the relevant parts of the following Chapters:
1. Chapter 8: Biodiversity – for the likely effects on biodiversity
2. Chapter 12: Health – for the likely effects on health
3. Chapter 23: Bibliography
4. Glossary of terms and list of abbreviations.
7.1.2 This chapter describes:
1. The planning policy, legislation and other relevant documentation that has
informed the assessment (Section 7.2: Relevant legislation, policy and
other important and relevant matters)
2. The outcome of consultation and external engagement that has been
undertaken, including how matters relating to air quality and odour within the
Scoping Opinion received in July 2018 have been addressed (Section 7.3:
Scoping and engagement)
3. The scope of the assessment for air quality and odour (Section 7.4: Scope of
the assessment)
4. Embedded measures relevant to air quality and odour (Section 7.5:
Embedded environmental measures)
5. The methods used for the baseline data gathering (Section 7.6: Methodology
for baseline data gathering)
6. The assessment methods used for the PEIR (Section 7.7: Assessment
methodology for PEIR)
7. The assumptions and limitations of the PEIR assessment (Section 7.8:
Assumptions and limitations of this PEIR)
8. The overall baseline (Section 7.9: Overall baseline)
9. The assessment of air quality and odour effects (Section 7.10: Assessment
of air quality and odour effects)
Heathrow Expansion PRELIMINARY ENVIRONMENTAL INFORMATION REPORT: Chapter 7: Air quality and odour
7.2 © Heathrow Airport Limited 2019
10. A summary of significance of positive and negative air quality and odour effects
identified in the PEIR (Section 7.11 Preliminary assessment of
significance)
11. The assessment of cumulative effects (Section 7.12 Assessment of
cumulative effects).
12. Consideration of any additional mitigation required (Section 7.13:
Consideration of additional environmental measures and compensation)
13. An outline of further work to be undertaken for the Environmental Statement
(ES) (Section 7.14: Next steps).
7.1.3 In-combination effects are dealt with in Chapter 22: In-combination effects.
7.2 Relevant legislation, policy and other important and relevant matters
Introduction
7.2.1 This section identifies the legislation, policy and other documentation that has
informed the preliminary assessment of effects with respect to air quality and
odour. Further information on policies relevant to the EIA and their status is
provided in Chapter 2: Legislative and policy overview of this PEIR.
Relevant legislation, policy and other important and relevant matters
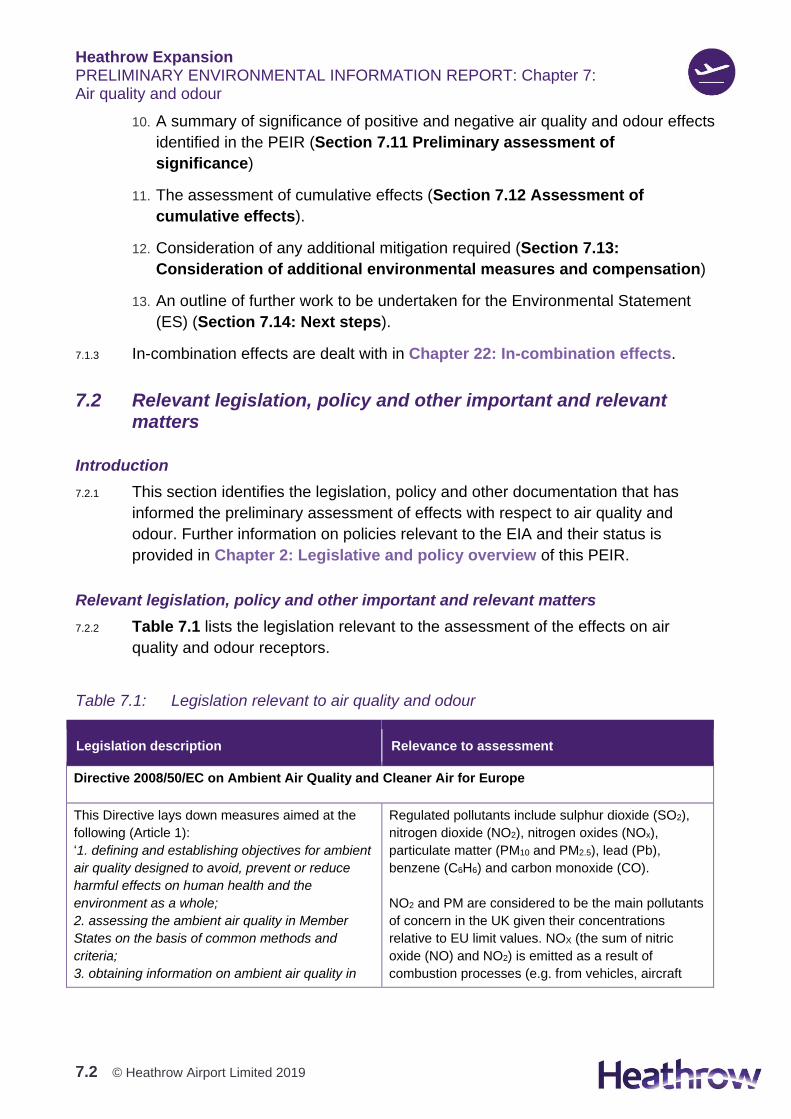
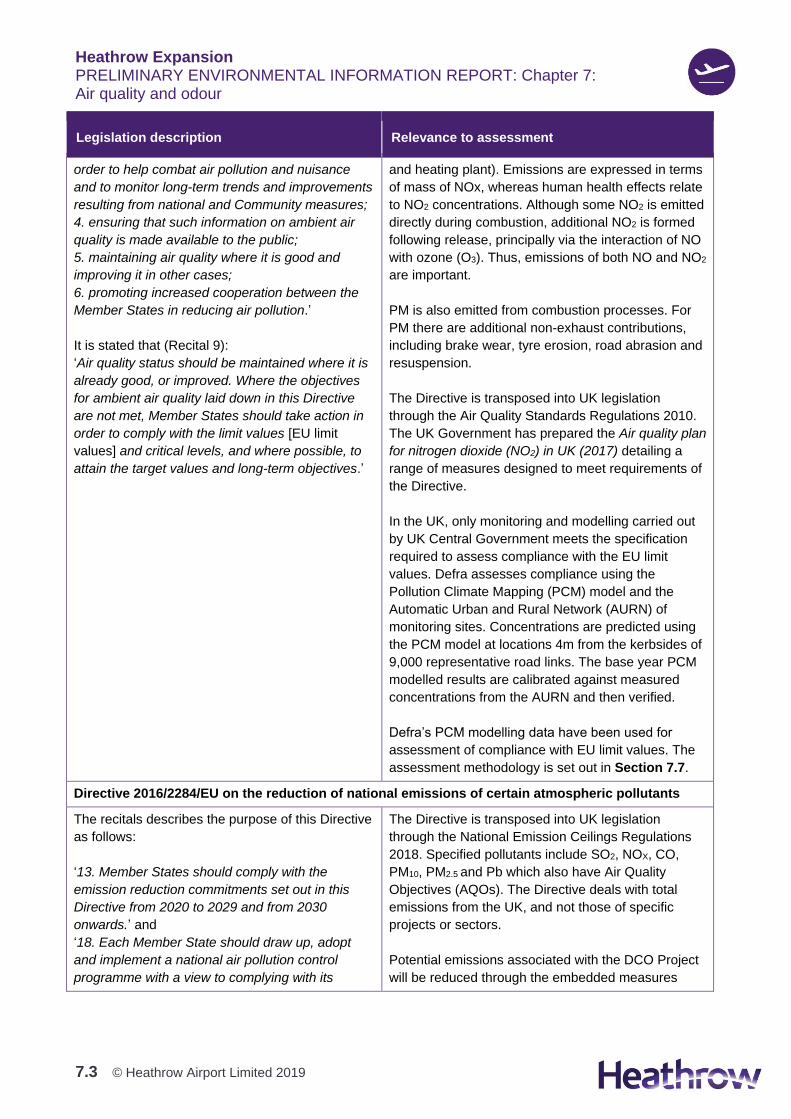
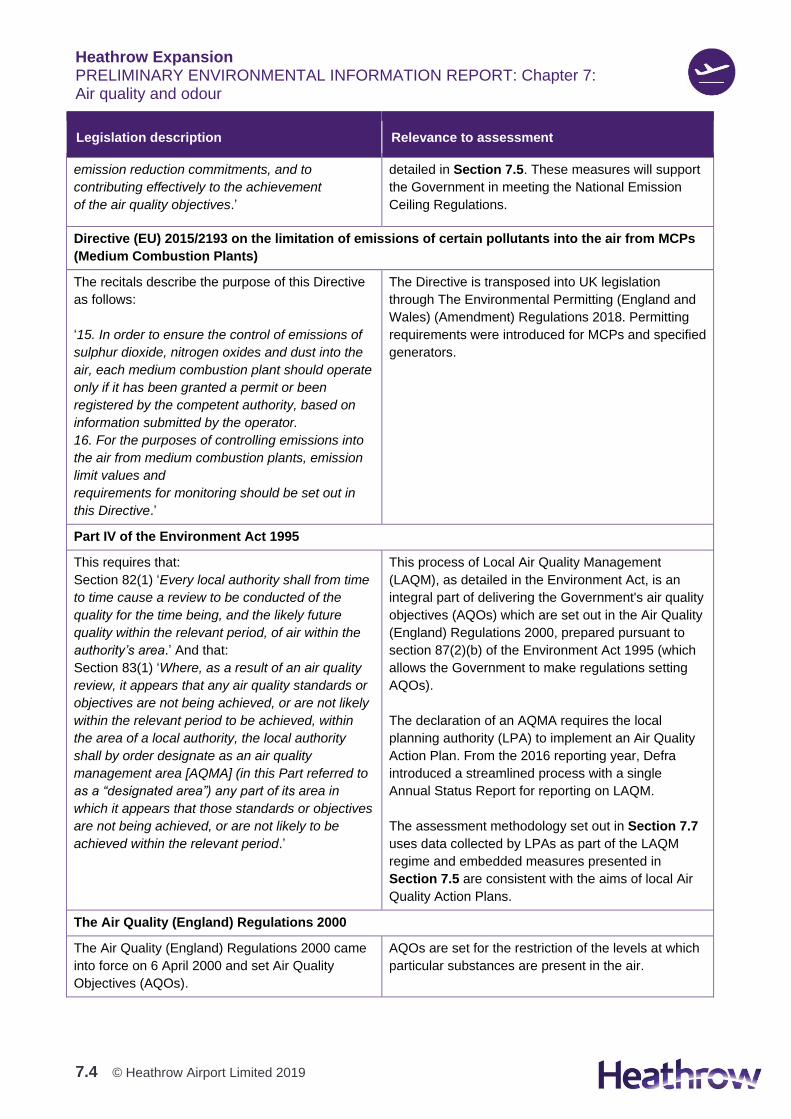
7.2.2 Table 7.1 lists the legislation relevant to the assessment of the effects on air
quality and odour receptors.
Table 7.1: Legislation relevant to air quality and odour
Legislation description Relevance to assessment
Directive 2008/50/EC on Ambient Air Quality and Cleaner Air for Europe
This Directive lays down measures aimed at the
following (Article 1):
‘1. defining and establishing objectives for ambient
air quality designed to avoid, prevent or reduce
harmful effects on human health and the
environment as a whole;
2. assessing the ambient air quality in Member
States on the basis of common methods and
criteria;
3. obtaining information on ambient air quality in
Regulated pollutants include sulphur dioxide (SO2),
nitrogen dioxide (NO2), nitrogen oxides (NOx),
particulate matter (PM10 and PM2.5), lead (Pb),
benzene (C6H6) and carbon monoxide (CO).
NO2 and PM are considered to be the main pollutants
of concern in the UK given their concentrations
relative to EU limit values. NOX (the sum of nitric
oxide (NO) and NO2) is emitted as a result of
combustion processes (e.g. from vehicles, aircraft
Heathrow Expansion PRELIMINARY ENVIRONMENTAL INFORMATION REPORT: Chapter 7: Air quality and odour
7.3 © Heathrow Airport Limited 2019
Legislation description Relevance to assessment
order to help combat air pollution and nuisance
and to monitor long-term trends and improvements
resulting from national and Community measures;
4. ensuring that such information on ambient air
quality is made available to the public;
5. maintaining air quality where it is good and
improving it in other cases;
6. promoting increased cooperation between the
Member States in reducing air pollution.’
It is stated that (Recital 9):
‘Air quality status should be maintained where it is
already good, or improved. Where the objectives
for ambient air quality laid down in this Directive
are not met, Member States should take action in
order to comply with the limit values [EU limit
values] and critical levels, and where possible, to
attain the target values and long-term objectives.’
and heating plant). Emissions are expressed in terms
of mass of NOx, whereas human health effects relate
to NO2 concentrations. Although some NO2 is emitted
directly during combustion, additional NO2 is formed
following release, principally via the interaction of NO
with ozone (O3). Thus, emissions of both NO and NO2
are important.
PM is also emitted from combustion processes. For
PM there are additional non-exhaust contributions,
including brake wear, tyre erosion, road abrasion and
resuspension.
The Directive is transposed into UK legislation
through the Air Quality Standards Regulations 2010.
The UK Government has prepared the Air quality plan
for nitrogen dioxide (NO2) in UK (2017) detailing a
range of measures designed to meet requirements of
the Directive.
In the UK, only monitoring and modelling carried out
by UK Central Government meets the specification
required to assess compliance with the EU limit
values. Defra assesses compliance using the
Pollution Climate Mapping (PCM) model and the
Automatic Urban and Rural Network (AURN) of
monitoring sites. Concentrations are predicted using
the PCM model at locations 4m from the kerbsides of
9,000 representative road links. The base year PCM
modelled results are calibrated against measured
concentrations from the AURN and then verified.
Defra’s PCM modelling data have been used for
assessment of compliance with EU limit values. The
assessment methodology is set out in Section 7.7.
Directive 2016/2284/EU on the reduction of national emissions of certain atmospheric pollutants
The recitals describes the purpose of this Directive
as follows:
‘13. Member States should comply with the
emission reduction commitments set out in this
Directive from 2020 to 2029 and from 2030
onwards.’ and
‘18. Each Member State should draw up, adopt
and implement a national air pollution control
programme with a view to complying with its
The Directive is transposed into UK legislation
through the National Emission Ceilings Regulations
2018. Specified pollutants include SO2, NOX, CO,
PM10, PM2.5 and Pb which also have Air Quality
Objectives (AQOs). The Directive deals with total
emissions from the UK, and not those of specific
projects or sectors.
Potential emissions associated with the DCO Project
will be reduced through the embedded measures
Heathrow Expansion PRELIMINARY ENVIRONMENTAL INFORMATION REPORT: Chapter 7: Air quality and odour
7.4 © Heathrow Airport Limited 2019
Legislation description Relevance to assessment
emission reduction commitments, and to
contributing effectively to the achievement
of the air quality objectives.’
detailed in Section 7.5. These measures will support
the Government in meeting the National Emission
Ceiling Regulations.
Directive (EU) 2015/2193 on the limitation of emissions of certain pollutants into the air from MCPs
(Medium Combustion Plants)
The recitals describe the purpose of this Directive
as follows:
‘15. In order to ensure the control of emissions of
sulphur dioxide, nitrogen oxides and dust into the
air, each medium combustion plant should operate
only if it has been granted a permit or been
registered by the competent authority, based on
information submitted by the operator.
16. For the purposes of controlling emissions into
the air from medium combustion plants, emission
limit values and
requirements for monitoring should be set out in
this Directive.’
The Directive is transposed into UK legislation
through The Environmental Permitting (England and
Wales) (Amendment) Regulations 2018. Permitting
requirements were introduced for MCPs and specified
generators.
Part IV of the Environment Act 1995
This requires that:
Section 82(1) ‘Every local authority shall from time
to time cause a review to be conducted of the
quality for the time being, and the likely future
quality within the relevant period, of air within the
authority’s area.’ And that:
Section 83(1) ‘Where, as a result of an air quality
review, it appears that any air quality standards or
objectives are not being achieved, or are not likely
within the relevant period to be achieved, within
the area of a local authority, the local authority
shall by order designate as an air quality
management area [AQMA] (in this Part referred to
as a “designated area”) any part of its area in
which it appears that those standards or objectives
are not being achieved, or are not likely to be
achieved within the relevant period.’
This process of Local Air Quality Management
(LAQM), as detailed in the Environment Act, is an
integral part of delivering the Government's air quality
objectives (AQOs) which are set out in the Air Quality
(England) Regulations 2000, prepared pursuant to
section 87(2)(b) of the Environment Act 1995 (which
allows the Government to make regulations setting
AQOs).
The declaration of an AQMA requires the local
planning authority (LPA) to implement an Air Quality
Action Plan. From the 2016 reporting year, Defra
introduced a streamlined process with a single
Annual Status Report for reporting on LAQM.
The assessment methodology set out in Section 7.7
uses data collected by LPAs as part of the LAQM
regime and embedded measures presented in
Section 7.5 are consistent with the aims of local Air
Quality Action Plans.
The Air Quality (England) Regulations 2000
The Air Quality (England) Regulations 2000 came
into force on 6 April 2000 and set Air Quality
Objectives (AQOs).
AQOs are set for the restriction of the levels at which
particular substances are present in the air.
Heathrow Expansion PRELIMINARY ENVIRONMENTAL INFORMATION REPORT: Chapter 7: Air quality and odour
7.5 © Heathrow Airport Limited 2019
Legislation description Relevance to assessment
Air quality is assessed in relation to the AQOs. These
are further defined in paragraph 17 of The Air Quality
Strategy for England, Scotland, Wales and Northern
Ireland (Defra, 2007) as “policy targets often
expressed as a maximum ambient concentration not
to be exceeded, either without exception or with a
permitted number of exceedances, within a specified
timescale’.
The assessment methodology is set out in Section
7.7.
The Air Quality Standards Regulations 2010
The Air Quality Standards Regulations 2010 came
into force on 11 June 2010 and transpose
Directive 2008/50/EC into UK legislation. The limit
values in Directive 2008/50/EC are transposed into
the Regulations as Air Quality Standards for
concentrations recorded over a given time period,
with attainment dates in line with the Directive.
Defra’s PCM modelling data have been used for
assessment of compliance with EU limit values. The
assessment methodology is set out in Section 7.7.
The Environmental Protection Act 1990
Under Part III Section 79 (1) the following matters
constitute ‘statutory nuisances’:
(b) smoke emitted from premises so as to be
prejudicial to health or a nuisance;
(c)fumes or gases emitted from premises so as to
be prejudicial to health or a nuisance;
(d) any dust, steam, smell or other effluvia arising
on industrial, trade or business premises and
being prejudicial to health or a nuisance’
Dust emissions from construction activities and odour
emissions from construction and operation activities
are considered in this assessment. The potential and
likelihood of emissions causing nuisance is the key
consideration of the assessment.
National Emission Ceilings Regulations 2018
It is stated in Part 2, regulation 3.(1) that:
‘The Secretary of State must—
(a) by 15th February each year prepare an
inventory of emissions occurring within the United
Kingdom of the pollutants specified in Table 1 of
Schedule 1, for the calendar year before the
previous calendar year;
(b) by 15th March 2019 and every two years after
that date prepare and update a projection of
emissions occurring within the United Kingdom of
the pollutants set out in Table 2 of Schedule 1, for
the years specified in column 3 of that table that
The National Emission Ceilings Regulations 2018
came into force on 1 July 2018 and transpose
Directive 2016/2284/EU on the reduction of national
emissions of certain atmospheric pollutants into UK
legislation. Specified pollutants include SO2, NOX,
CO, PM10, PM2.5 and Pb which also have AQOs.
Potential emissions associated with the DCO Project
will be reduced through the embedded measures
detailed in Section 7.5. These measures will support
the government in meeting the National Emission
Heathrow Expansion PRELIMINARY ENVIRONMENTAL INFORMATION REPORT: Chapter 7: Air quality and odour
7.6 © Heathrow Airport Limited 2019
Legislation description Relevance to assessment
have not yet passed.’
It is stated in Part 4, 9.(1) that:
‘The Secretary of State must prepare and
implement a national air pollution control
programme in order to limit anthropogenic
emissions in accordance with the national
emission reduction commitments.’
Ceiling Regulations.
Total emissions of SO2 (from the Landing and Take-
Off (LTO) cycle), NOX, PM10 and PM2.5 from sources
within the Core AQO Assessment Area will be
reported in the ES for each assessment year when
model inputs are finalised for comparison with the
totals in the NAEI, and the amounts specified in the
National Emission Ceiling Regulations.
The Environmental Permitting (England and Wales) (Amendment) Regulations 2018
These Regulations amend the Environmental
Permitting (England and Wales) Regulations 2016.
Part 2 of these Regulations require operators to
obtain a permit and monitor and manage
emissions to comply with emission limit values.
The 2018 Amendment Regulations incorporate the
EU MCP Directive into legislation and introduce
permitting requirements for MCPs and specified
generators.
Specific emission sources requiring an Environmental
Permit will be detailed in the ES.
7.2.3 Table 7.2 lists the national planning policy relevant to the assessment of the
effects on air quality and odour receptors.
Table 7.2: National planning policies relevant to air quality and odour
Policy description Relevance to assessment
Airports National Policy Statement (ANPS)
The ANPS (Department for Transport, 2018) is the
primary basis for decision making on the
application for development consent for the DCO
Project.
Chapter 2: Legislative and policy overview
provides an explanation of the relevance of the
ANPS to the Project in general terms.
The requirements for the air quality assessment
are detailed in paragraphs 5.32 to 5.34. In
paragraph 5.32 it is stated that:
‘The applicant should undertake an assessment of
the project, to be included as part of the
environmental statement, demonstrating to the
Secretary of State that the construction and
operation of the Northwest Runway will not affect
the UK’s ability to comply with legal obligations.
Failure to demonstrate this will result in refusal of
development consent.’
Potential emissions associated with the DCO Project
will be reduced through the embedded measures
detailed in Section 7.5.
The assessment reports current baseline air quality
conditions in Section 7.9 and forecasts the future
baseline in each key assessment year during the
construction and operation of the DCO Project,
including when at full capacity.
The assessment set out in Section 7.10 has been
carried out to meet the requirements of the ANPS.
Section 7.10 details predicted air quality during
construction, at the time of opening and in other
assessment years, both assuming that the DCO
Project is not built, and taking account of the impact
of the DCO Project. The latest Defra projections of
air quality are used in this assessment. Pollutant
concentrations are considered in relation to AQOs
and EU limit values to consider effects on AQMAs
and in relation to EU limit value compliance. In
particular, Section 7.10 sets out how the DCO
Heathrow Expansion PRELIMINARY ENVIRONMENTAL INFORMATION REPORT: Chapter 7: Air quality and odour
7.7 © Heathrow Airport Limited 2019
Policy description Relevance to assessment
The requirements for measures to reduce air
quality impacts are detailed in paragraphs 5.35 to
5.41. The decision making process is discussed in
paragraphs 5.42 and 5.43. In paragraph 5.42 it is
stated that:
‘The Secretary of State will consider air quality
impacts over the wider area likely to be affected, as
well as in the vicinity of the scheme. In order to
grant development consent, the Secretary of State
will need to be satisfied that, with mitigation, the
scheme would be compliant with legal obligations
that provide for the protection of human health and
the environment.’
Project, including embedded environmental
measures detailed in Section 7.5, will not affect the
UK’s ability to comply with legal obligations, including
EU limit values and AQOs. The conclusions of
significance evaluation are detailed in Section 7.13.
Total pollutant emissions and how these compare to
the National Atmospheric Emissions Inventory
(NAEI) and the levels stipulated in the National
Emissions Ceilings Regulations will be reported in
the ES when plans and model inputs are finalised.
National Policy Statement for National Networks (NN NPS)
Chapter 2: Legislative and policy overview
provides an explanation of the relevance of the NN
NPS to the DCO Project in general terms.
This document details similar requirements for the
air quality assessment to the ANPS in paragraphs
5.6 to 5.9. In paragraph 5.13, it is stated that:
‘The Secretary of State should refuse consent
where, after taking into account mitigation, the air
quality impacts of the scheme will:
- result in a zone/agglomeration which is currently
reported as being compliant with the Air Quality
Directive becoming non-compliant; or
- affect the ability of a non-compliant area to
achieve compliance within the most recent
timescales reported to the European Commission
at the time of the decision.’
The requirements for measures to reduce air
quality impacts are detailed in paragraphs 5.14 and
5.15.
Potential emissions associated with the DCO Project
will be reduced through the embedded measures
detailed in Section 7.5.
The assessment reports current baseline air quality
conditions in Section 7.9 and forecasts the future
baseline in each key assessment year during the
construction and operation of the DCO Project,
including when at full capacity.
Section 7.10 details predicted air quality during
construction, at the time of opening and in other
assessment years, both assuming that the DCO
Project is not built, and taking account of the impact
of the DCO Project. Detailed dispersion modelling
has been undertaken. Pollutant concentrations are
considered in relation to AQOs and EU limit values to
consider effects on AQMAs and relation to EU limit
value compliance. In particular, Section 7.10 sets
out how the DCO Project, including embedded
environmental measures detailed in Section 7.5, will
not affect the UK’s ability to comply with legal
obligations, including EU limit values and AQOs. The
conclusions of significance evaluation are detailed in
Section 7.13.
National Planning Policy Framework (NPPF) 2019
Chapter 2: Legislative and policy overview
provides an explanation of the relevance of the
NPPF (MHCLG, 2019) to the DCO Project in
general terms.
Paragraph 181 details how:
‘Planning policies and decisions should sustain and
contribute towards compliance with relevant limit
The embedded measures considered in the
assessment and presented in Section 7.5 are
consistent with, and support the aims of, the local Air
Quality Action Plans prepared following the
declaration of AQMAs.
Section 7.10 details predicted air quality during
construction, at the time of opening and in other
Heathrow Expansion PRELIMINARY ENVIRONMENTAL INFORMATION REPORT: Chapter 7: Air quality and odour
7.8 © Heathrow Airport Limited 2019
Policy description Relevance to assessment
values or national objectives for pollutants, taking
into account the presence of Air Quality
Management Areas and Clean Air Zones, and the
cumulative impacts from individual sites in local
areas. Opportunities to improve air quality or
mitigate impacts should be identified, such as
through traffic and travel management, and green
infrastructure provision and enhancement.’
Of relevance to odour, it is stated in paragraph 180
that:
‘Planning policies and decisions should also ensure
that new development is appropriate for its location
taking into account the likely effects (including
cumulative effects) of pollution on health, living
conditions and the natural environment’.
assessment years, both assuming that the DCO
Project is not built, and taking account of the impact
of the DCO Project. Detailed dispersion modelling
has been undertaken. Pollutant concentrations are
considered in relation to AQOs and EU limit values to
consider effects on AQMAs and relation to EU limit
value compliance. Section 7.10 also considers
potential odour impacts associated with the DCO
Project.
Regional and local planning policy
7.2.4 Appendix 2.1: Regional and local planning policy and other important and
relevant matters, Volume 3 presents the full list of the regional and local planning
policies relevant to the assessment of the effects on air quality and odour
receptors.
7.2.5 The local planning policies of the Greater London Authority (GLA) and the
following LPAs have been considered given their proximity to the Airport the
potential for changes in traffic flows on roads within their administrative areas:
1. London Borough of Hillingdon
2. London Borough of Hounslow
3. Spelthorne Borough Council
4. Slough Borough Council
5. Runnymede District Council
6. South Bucks District Council
7. London Borough of Richmond Upon Thames
8. Royal Borough of Windsor and Maidenhead
9. London Borough of Ealing
10. London Borough of Hammersmith and Fulham
11. Royal Borough of Kensington and Chelsea
Heathrow Expansion PRELIMINARY ENVIRONMENTAL INFORMATION REPORT: Chapter 7: Air quality and odour
7.9 © Heathrow Airport Limited 2019
12. London Borough of Wandsworth
13. Westminster City Council
14. Elmbridge Borough Council.
Other important and relevant matters
7.2.6 A summary of other documentation relevant to the assessment undertaken in air
quality and odour is provided within Appendix 2.1. Air quality Action Plans
produced by the LPAs referenced in paragraph 7.2.5 are included given the
potential for changes in traffic flows on roads within their administrative areas.
7.3 Scoping and engagement
Overview
7.3.1 This section describes the matters raised in relation to air quality and odour in the
Scoping Opinion and how the assessment has responded to those matters. It also
provides details of the ongoing technical engagement that has been undertaken
with stakeholders and individuals. An overview of engagement undertaken can be
found in Section 1.5 of Chapter 1: Introduction.
7.3.2 Engagement has taken the form of discussions and meetings and is summarised
in the following sections.
Scoping Opinion
7.3.3 A Scoping Report requesting a Scoping Opinion was submitted to the Secretary of
State, administered by the Planning Inspectorate (PINS) on behalf of the Secretary
of State on 21 May 2018. The Scoping Report set out the proposed air quality and
odour assessment methodologies and outlined the baseline data collected to date
and proposed for the ES.
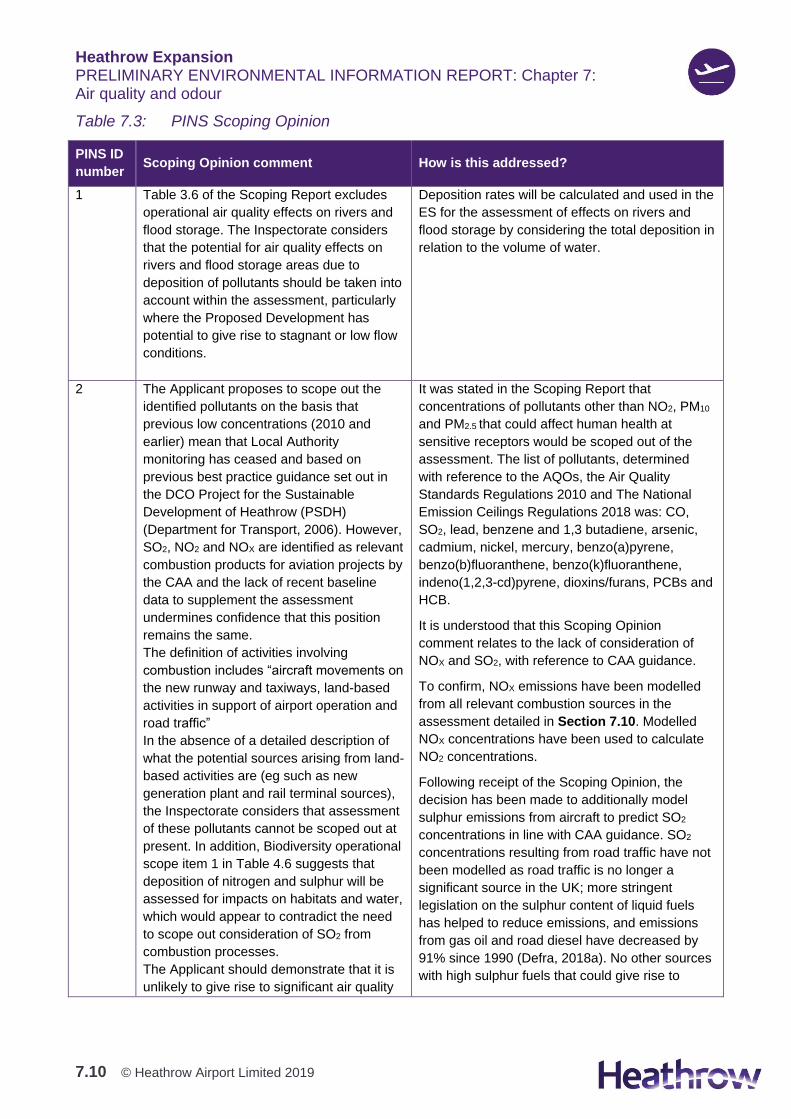
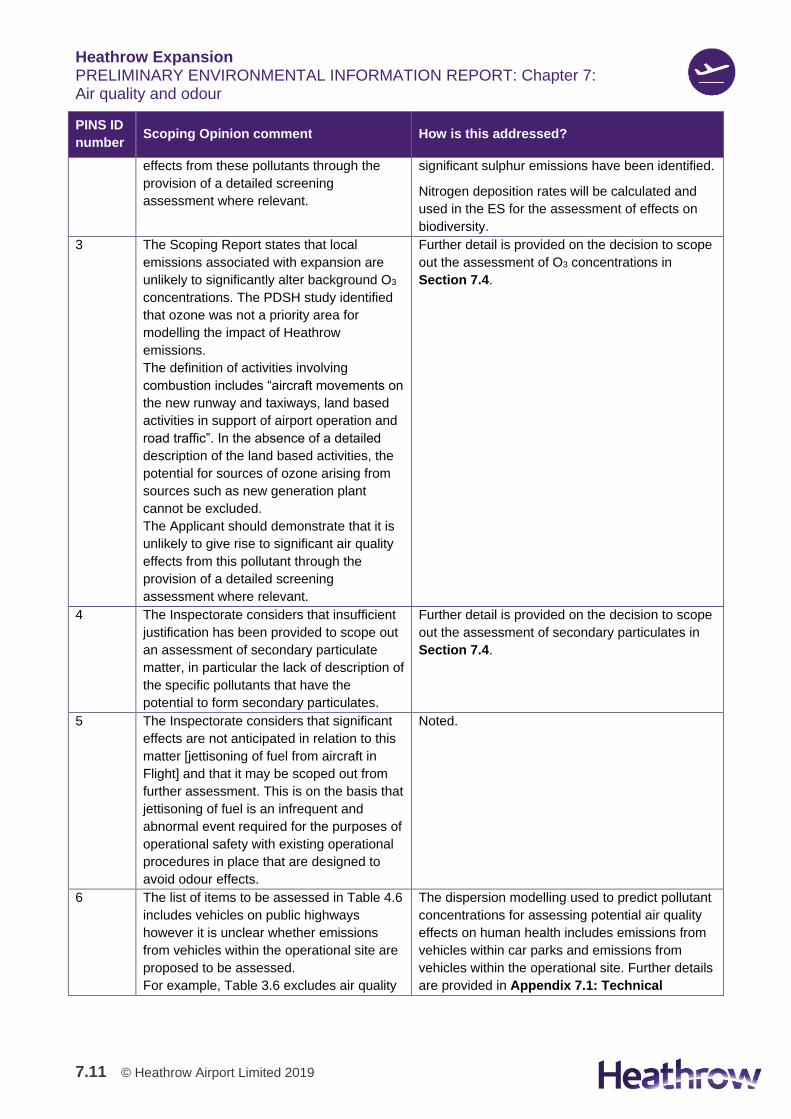
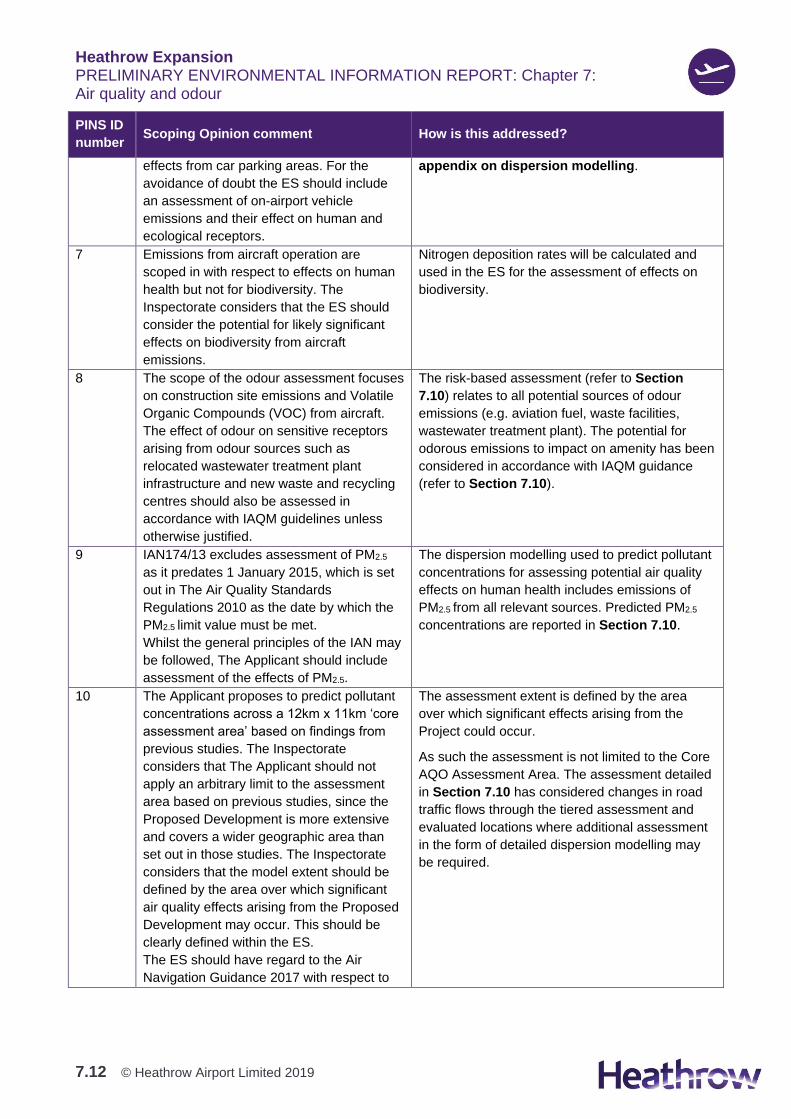
7.3.4 A Scoping Opinion was adopted by PINS on behalf of the Secretary of State on 2
July 2018. Table 7.3 sets out the comments received in Section 4 of the PINS
Scoping Opinion (‘Aspect based scoping tables’) for air quality and odour and how
they have been addressed in this PEIR. A full list of the PINS Scoping Opinion
comments and responses is provided in Appendix 5.1: Response to the
Scoping Opinion. The information provided in the PEIR is preliminary and
therefore not all the Scoping Opinion comments have been able to be addressed
at this stage, however all comments will be addressed within the ES.
Heathrow Expansion PRELIMINARY ENVIRONMENTAL INFORMATION REPORT: Chapter 7: Air quality and odour
7.10 © Heathrow Airport Limited 2019
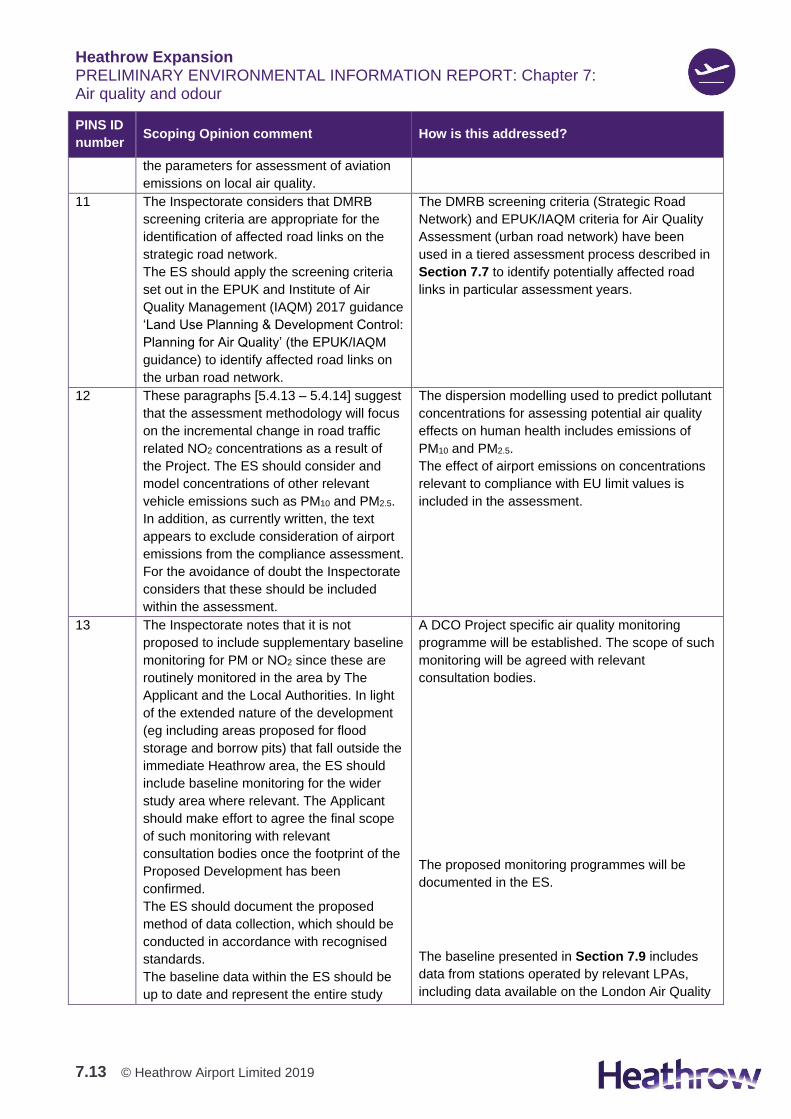
Table 7.3: PINS Scoping Opinion
PINS ID
number Scoping Opinion comment How is this addressed?
1 Table 3.6 of the Scoping Report excludes
operational air quality effects on rivers and
flood storage. The Inspectorate considers
that the potential for air quality effects on
rivers and flood storage areas due to
deposition of pollutants should be taken into
account within the assessment, particularly
where the Proposed Development has
potential to give rise to stagnant or low flow
conditions.
Deposition rates will be calculated and used in the
ES for the assessment of effects on rivers and
flood storage by considering the total deposition in
relation to the volume of water.
2 The Applicant proposes to scope out the
identified pollutants on the basis that
previous low concentrations (2010 and
earlier) mean that Local Authority
monitoring has ceased and based on
previous best practice guidance set out in
the DCO Project for the Sustainable
Development of Heathrow (PSDH)
(Department for Transport, 2006). However,
SO2, NO2 and NOX are identified as relevant
combustion products for aviation projects by
the CAA and the lack of recent baseline
data to supplement the assessment
undermines confidence that this position
remains the same.
The definition of activities involving
combustion includes “aircraft movements on
the new runway and taxiways, land-based
activities in support of airport operation and
road traffic”
In the absence of a detailed description of
what the potential sources arising from land-
based activities are (eg such as new
generation plant and rail terminal sources),
the Inspectorate considers that assessment
of these pollutants cannot be scoped out at
present. In addition, Biodiversity operational
scope item 1 in Table 4.6 suggests that
deposition of nitrogen and sulphur will be
assessed for impacts on habitats and water,
which would appear to contradict the need
to scope out consideration of SO2 from
combustion processes.
The Applicant should demonstrate that it is
unlikely to give rise to significant air quality
It was stated in the Scoping Report that
concentrations of pollutants other than NO2, PM10
and PM2.5 that could affect human health at
sensitive receptors would be scoped out of the
assessment. The list of pollutants, determined
with reference to the AQOs, the Air Quality
Standards Regulations 2010 and The National
Emission Ceilings Regulations 2018 was: CO,
SO2, lead, benzene and 1,3 butadiene, arsenic,
cadmium, nickel, mercury, benzo(a)pyrene,
benzo(b)fluoranthene, benzo(k)fluoranthene,
indeno(1,2,3-cd)pyrene, dioxins/furans, PCBs and
HCB.
It is understood that this Scoping Opinion
comment relates to the lack of consideration of
NOX and SO2, with reference to CAA guidance.
To confirm, NOX emissions have been modelled
from all relevant combustion sources in the
assessment detailed in Section 7.10. Modelled
NOX concentrations have been used to calculate
NO2 concentrations.
Following receipt of the Scoping Opinion, the
decision has been made to additionally model
sulphur emissions from aircraft to predict SO2
concentrations in line with CAA guidance. SO2
concentrations resulting from road traffic have not
been modelled as road traffic is no longer a
significant source in the UK; more stringent
legislation on the sulphur content of liquid fuels
has helped to reduce emissions, and emissions
from gas oil and road diesel have decreased by
91% since 1990 (Defra, 2018a). No other sources
with high sulphur fuels that could give rise to
Heathrow Expansion PRELIMINARY ENVIRONMENTAL INFORMATION REPORT: Chapter 7: Air quality and odour
7.11 © Heathrow Airport Limited 2019
PINS ID
number Scoping Opinion comment How is this addressed?
effects from these pollutants through the
provision of a detailed screening
assessment where relevant.
significant sulphur emissions have been identified.
Nitrogen deposition rates will be calculated and
used in the ES for the assessment of effects on
biodiversity.
3 The Scoping Report states that local
emissions associated with expansion are
unlikely to significantly alter background O3
concentrations. The PDSH study identified
that ozone was not a priority area for
modelling the impact of Heathrow
emissions.
The definition of activities involving
combustion includes “aircraft movements on
the new runway and taxiways, land based
activities in support of airport operation and
road traffic”. In the absence of a detailed
description of the land based activities, the
potential for sources of ozone arising from
sources such as new generation plant
cannot be excluded.
The Applicant should demonstrate that it is
unlikely to give rise to significant air quality
effects from this pollutant through the
provision of a detailed screening
assessment where relevant.
Further detail is provided on the decision to scope
out the assessment of O3 concentrations in
Section 7.4.
4 The Inspectorate considers that insufficient
justification has been provided to scope out
an assessment of secondary particulate
matter, in particular the lack of description of
the specific pollutants that have the
potential to form secondary particulates.
Further detail is provided on the decision to scope
out the assessment of secondary particulates in
Section 7.4.
5 The Inspectorate considers that significant
effects are not anticipated in relation to this
matter [jettisoning of fuel from aircraft in
Flight] and that it may be scoped out from
further assessment. This is on the basis that
jettisoning of fuel is an infrequent and
abnormal event required for the purposes of
operational safety with existing operational
procedures in place that are designed to
avoid odour effects.
Noted.
6 The list of items to be assessed in Table 4.6
includes vehicles on public highways
however it is unclear whether emissions
from vehicles within the operational site are
proposed to be assessed.
For example, Table 3.6 excludes air quality
The dispersion modelling used to predict pollutant
concentrations for assessing potential air quality
effects on human health includes emissions from
vehicles within car parks and emissions from
vehicles within the operational site. Further details
are provided in Appendix 7.1: Technical
Heathrow Expansion PRELIMINARY ENVIRONMENTAL INFORMATION REPORT: Chapter 7: Air quality and odour
7.12 © Heathrow Airport Limited 2019
PINS ID
number Scoping Opinion comment How is this addressed?
effects from car parking areas. For the
avoidance of doubt the ES should include
an assessment of on-airport vehicle
emissions and their effect on human and
ecological receptors.
appendix on dispersion modelling.
7 Emissions from aircraft operation are
scoped in with respect to effects on human
health but not for biodiversity. The
Inspectorate considers that the ES should
consider the potential for likely significant
effects on biodiversity from aircraft
emissions.
Nitrogen deposition rates will be calculated and
used in the ES for the assessment of effects on
biodiversity.
8 The scope of the odour assessment focuses
on construction site emissions and Volatile
Organic Compounds (VOC) from aircraft.
The effect of odour on sensitive receptors
arising from odour sources such as
relocated wastewater treatment plant
infrastructure and new waste and recycling
centres should also be assessed in
accordance with IAQM guidelines unless
otherwise justified.
The risk-based assessment (refer to Section
7.10) relates to all potential sources of odour
emissions (e.g. aviation fuel, waste facilities,
wastewater treatment plant). The potential for
odorous emissions to impact on amenity has been
considered in accordance with IAQM guidance
(refer to Section 7.10).
9 IAN174/13 excludes assessment of PM2.5
as it predates 1 January 2015, which is set
out in The Air Quality Standards
Regulations 2010 as the date by which the
PM2.5 limit value must be met.
Whilst the general principles of the IAN may
be followed, The Applicant should include
assessment of the effects of PM2.5.
The dispersion modelling used to predict pollutant
concentrations for assessing potential air quality
effects on human health includes emissions of
PM2.5 from all relevant sources. Predicted PM2.5
concentrations are reported in Section 7.10.
10 The Applicant proposes to predict pollutant
concentrations across a 12km x 11km ‘core
assessment area’ based on findings from
previous studies. The Inspectorate
considers that The Applicant should not
apply an arbitrary limit to the assessment
area based on previous studies, since the
Proposed Development is more extensive
and covers a wider geographic area than
set out in those studies. The Inspectorate
considers that the model extent should be
defined by the area over which significant
air quality effects arising from the Proposed
Development may occur. This should be
clearly defined within the ES.
The ES should have regard to the Air
Navigation Guidance 2017 with respect to
The assessment extent is defined by the area
over which significant effects arising from the
Project could occur.
As such the assessment is not limited to the Core
AQO Assessment Area. The assessment detailed
in Section 7.10 has considered changes in road
traffic flows through the tiered assessment and
evaluated locations where additional assessment
in the form of detailed dispersion modelling may
be required.
Heathrow Expansion PRELIMINARY ENVIRONMENTAL INFORMATION REPORT: Chapter 7: Air quality and odour
7.13 © Heathrow Airport Limited 2019
PINS ID
number Scoping Opinion comment How is this addressed?
the parameters for assessment of aviation
emissions on local air quality.
11 The Inspectorate considers that DMRB
screening criteria are appropriate for the
identification of affected road links on the
strategic road network.
The ES should apply the screening criteria
set out in the EPUK and Institute of Air
Quality Management (IAQM) 2017 guidance
‘Land Use Planning & Development Control:
Planning for Air Quality’ (the EPUK/IAQM
guidance) to identify affected road links on
the urban road network.
The DMRB screening criteria (Strategic Road
Network) and EPUK/IAQM criteria for Air Quality
Assessment (urban road network) have been
used in a tiered assessment process described in
Section 7.7 to identify potentially affected road
links in particular assessment years.
12 These paragraphs [5.4.13 – 5.4.14] suggest
that the assessment methodology will focus
on the incremental change in road traffic
related NO2 concentrations as a result of
the Project. The ES should consider and
model concentrations of other relevant
vehicle emissions such as PM10 and PM2.5.
In addition, as currently written, the text
appears to exclude consideration of airport
emissions from the compliance assessment.
For the avoidance of doubt the Inspectorate
considers that these should be included
within the assessment.
The dispersion modelling used to predict pollutant
concentrations for assessing potential air quality
effects on human health includes emissions of
PM10 and PM2.5.
The effect of airport emissions on concentrations
relevant to compliance with EU limit values is
included in the assessment.
13 The Inspectorate notes that it is not
proposed to include supplementary baseline
monitoring for PM or NO2 since these are
routinely monitored in the area by The
Applicant and the Local Authorities. In light
of the extended nature of the development
(eg including areas proposed for flood
storage and borrow pits) that fall outside the
immediate Heathrow area, the ES should
include baseline monitoring for the wider
study area where relevant. The Applicant
should make effort to agree the final scope
of such monitoring with relevant
consultation bodies once the footprint of the
Proposed Development has been
confirmed.
The ES should document the proposed
method of data collection, which should be
conducted in accordance with recognised
standards.
The baseline data within the ES should be
up to date and represent the entire study
A DCO Project specific air quality monitoring
programme will be established. The scope of such
monitoring will be agreed with relevant
consultation bodies.
The proposed monitoring programmes will be
documented in the ES.
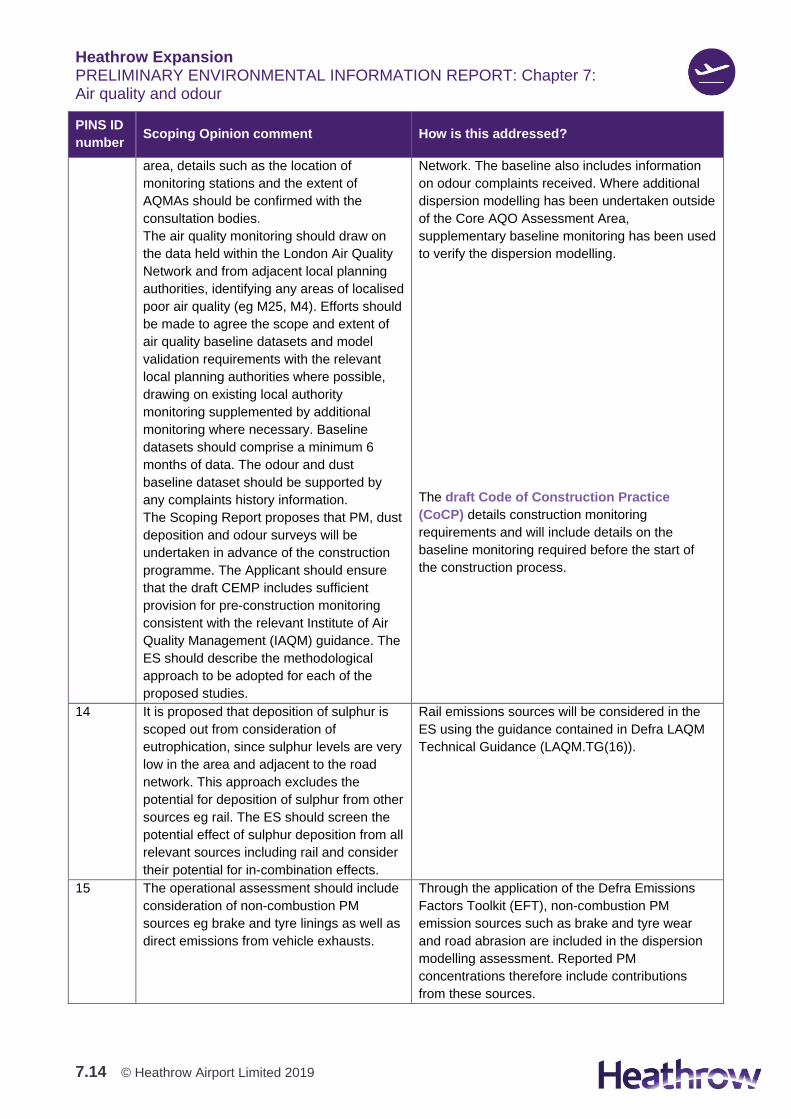
The baseline presented in Section 7.9 includes
data from stations operated by relevant LPAs,
including data available on the London Air Quality
Heathrow Expansion PRELIMINARY ENVIRONMENTAL INFORMATION REPORT: Chapter 7: Air quality and odour
7.14 © Heathrow Airport Limited 2019
PINS ID
number Scoping Opinion comment How is this addressed?
area, details such as the location of
monitoring stations and the extent of
AQMAs should be confirmed with the
consultation bodies.
The air quality monitoring should draw on
the data held within the London Air Quality
Network and from adjacent local planning
authorities, identifying any areas of localised
poor air quality (eg M25, M4). Efforts should
be made to agree the scope and extent of
air quality baseline datasets and model
validation requirements with the relevant
local planning authorities where possible,
drawing on existing local authority
monitoring supplemented by additional
monitoring where necessary. Baseline
datasets should comprise a minimum 6
months of data. The odour and dust
baseline dataset should be supported by
any complaints history information.
The Scoping Report proposes that PM, dust
deposition and odour surveys will be
undertaken in advance of the construction
programme. The Applicant should ensure
that the draft CEMP includes sufficient
provision for pre-construction monitoring
consistent with the relevant Institute of Air
Quality Management (IAQM) guidance. The
ES should describe the methodological
approach to be adopted for each of the
proposed studies.
Network. The baseline also includes information
on odour complaints received. Where additional
dispersion modelling has been undertaken outside
of the Core AQO Assessment Area,
supplementary baseline monitoring has been used
to verify the dispersion modelling.
The draft Code of Construction Practice
(CoCP) details construction monitoring
requirements and will include details on the
baseline monitoring required before the start of
the construction process.
14 It is proposed that deposition of sulphur is
scoped out from consideration of
eutrophication, since sulphur levels are very
low in the area and adjacent to the road
network. This approach excludes the
potential for deposition of sulphur from other
sources eg rail. The ES should screen the
potential effect of sulphur deposition from all
relevant sources including rail and consider
their potential for in-combination effects.
Rail emissions sources will be considered in the
ES using the guidance contained in Defra LAQM
Technical Guidance (LAQM.TG(16)).
15 The operational assessment should include
consideration of non-combustion PM
sources eg brake and tyre linings as well as
direct emissions from vehicle exhausts.
Through the application of the Defra Emissions
Factors Toolkit (EFT), non-combustion PM
emission sources such as brake and tyre wear
and road abrasion are included in the dispersion
modelling assessment. Reported PM
concentrations therefore include contributions
from these sources.
Heathrow Expansion PRELIMINARY ENVIRONMENTAL INFORMATION REPORT: Chapter 7: Air quality and odour
7.15 © Heathrow Airport Limited 2019
PINS ID
number Scoping Opinion comment How is this addressed?
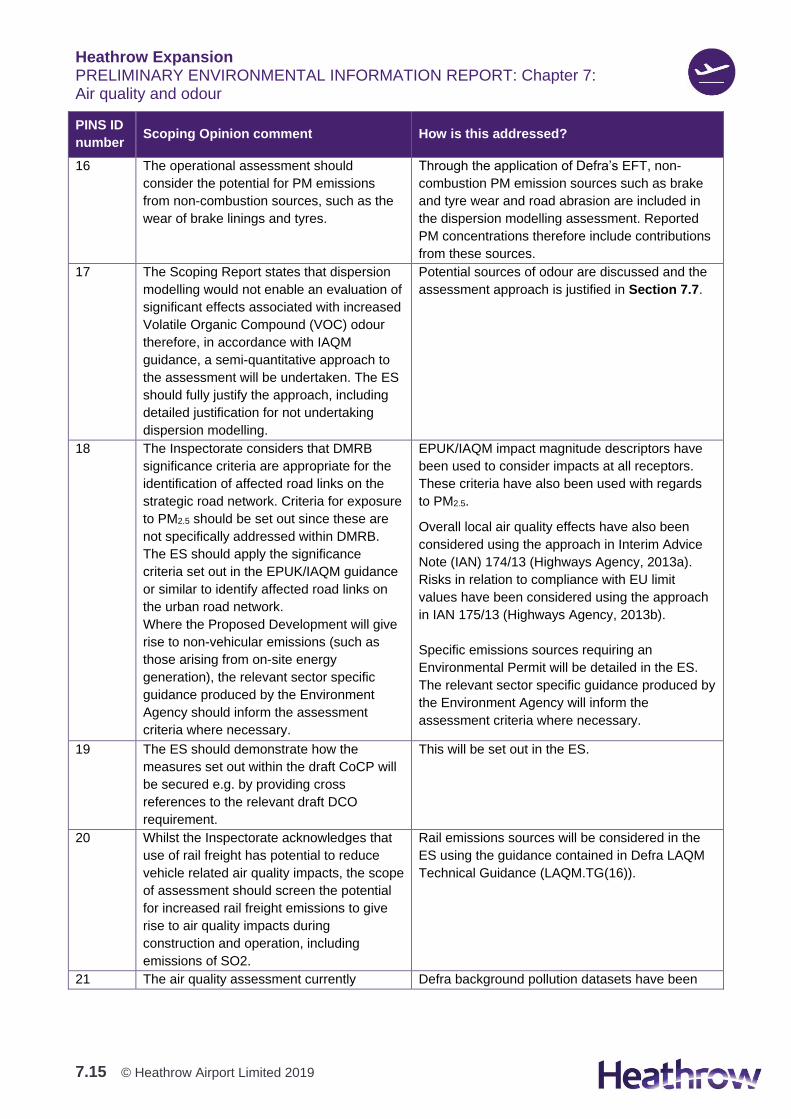
16 The operational assessment should
consider the potential for PM emissions
from non-combustion sources, such as the
wear of brake linings and tyres.
Through the application of Defra’s EFT, non-
combustion PM emission sources such as brake
and tyre wear and road abrasion are included in
the dispersion modelling assessment. Reported
PM concentrations therefore include contributions
from these sources.
17 The Scoping Report states that dispersion
modelling would not enable an evaluation of
significant effects associated with increased
Volatile Organic Compound (VOC) odour
therefore, in accordance with IAQM
guidance, a semi-quantitative approach to
the assessment will be undertaken. The ES
should fully justify the approach, including
detailed justification for not undertaking
dispersion modelling.
Potential sources of odour are discussed and the
assessment approach is justified in Section 7.7.
18 The Inspectorate considers that DMRB
significance criteria are appropriate for the
identification of affected road links on the
strategic road network. Criteria for exposure
to PM2.5 should be set out since these are
not specifically addressed within DMRB.
The ES should apply the significance
criteria set out in the EPUK/IAQM guidance
or similar to identify affected road links on
the urban road network.
Where the Proposed Development will give
rise to non-vehicular emissions (such as
those arising from on-site energy
generation), the relevant sector specific
guidance produced by the Environment
Agency should inform the assessment
criteria where necessary.
EPUK/IAQM impact magnitude descriptors have
been used to consider impacts at all receptors.
These criteria have also been used with regards
to PM2.5.
Overall local air quality effects have also been
considered using the approach in Interim Advice
Note (IAN) 174/13 (Highways Agency, 2013a).
Risks in relation to compliance with EU limit
values have been considered using the approach
in IAN 175/13 (Highways Agency, 2013b).
Specific emissions sources requiring an
Environmental Permit will be detailed in the ES.
The relevant sector specific guidance produced by
the Environment Agency will inform the
assessment criteria where necessary.
19 The ES should demonstrate how the
measures set out within the draft CoCP will
be secured e.g. by providing cross
references to the relevant draft DCO
requirement.
This will be set out in the ES.
20 Whilst the Inspectorate acknowledges that
use of rail freight has potential to reduce
vehicle related air quality impacts, the scope
of assessment should screen the potential
for increased rail freight emissions to give
rise to air quality impacts during
construction and operation, including
emissions of SO2.
Rail emissions sources will be considered in the
ES using the guidance contained in Defra LAQM
Technical Guidance (LAQM.TG(16)).
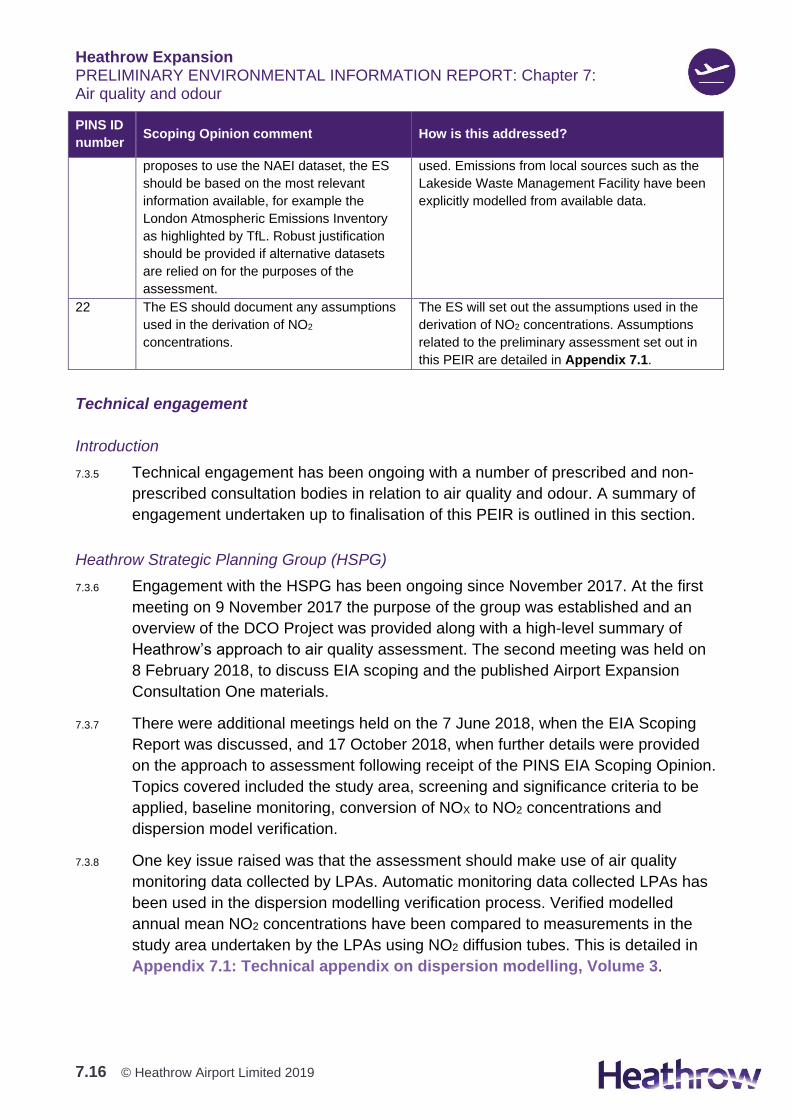
21 The air quality assessment currently Defra background pollution datasets have been
Heathrow Expansion PRELIMINARY ENVIRONMENTAL INFORMATION REPORT: Chapter 7: Air quality and odour
7.16 © Heathrow Airport Limited 2019
PINS ID
number Scoping Opinion comment How is this addressed?
proposes to use the NAEI dataset, the ES
should be based on the most relevant
information available, for example the
London Atmospheric Emissions Inventory
as highlighted by TfL. Robust justification
should be provided if alternative datasets
are relied on for the purposes of the
assessment.
used. Emissions from local sources such as the
Lakeside Waste Management Facility have been
explicitly modelled from available data.
22 The ES should document any assumptions
used in the derivation of NO2
concentrations.
The ES will set out the assumptions used in the
derivation of NO2 concentrations. Assumptions
related to the preliminary assessment set out in
this PEIR are detailed in Appendix 7.1.
Technical engagement
Introduction
7.3.5 Technical engagement has been ongoing with a number of prescribed and non-
prescribed consultation bodies in relation to air quality and odour. A summary of
engagement undertaken up to finalisation of this PEIR is outlined in this section.
Heathrow Strategic Planning Group (HSPG)
7.3.6 Engagement with the HSPG has been ongoing since November 2017. At the first
meeting on 9 November 2017 the purpose of the group was established and an
overview of the DCO Project was provided along with a high-level summary of
Heathrow’s approach to air quality assessment. The second meeting was held on
8 February 2018, to discuss EIA scoping and the published Airport Expansion
Consultation One materials.
7.3.7 There were additional meetings held on the 7 June 2018, when the EIA Scoping
Report was discussed, and 17 October 2018, when further details were provided
on the approach to assessment following receipt of the PINS EIA Scoping Opinion.
Topics covered included the study area, screening and significance criteria to be
applied, baseline monitoring, conversion of NOX to NO2 concentrations and
dispersion model verification.
7.3.8 One key issue raised was that the assessment should make use of air quality
monitoring data collected by LPAs. Automatic monitoring data collected LPAs has
been used in the dispersion modelling verification process. Verified modelled
annual mean NO2 concentrations have been compared to measurements in the
study area undertaken by the LPAs using NO2 diffusion tubes. This is detailed in
Appendix 7.1: Technical appendix on dispersion modelling, Volume 3.
Heathrow Expansion PRELIMINARY ENVIRONMENTAL INFORMATION REPORT: Chapter 7: Air quality and odour
7.17 © Heathrow Airport Limited 2019
7.3.9 South Bucks District Council and Buckinghamshire County Council raised the
issue of impacts on designated ecological sites (e.g. Burnham Beeches Special
Area of Conservation) and that impacts should be assessed where traffic data
indicate that there may be the potential for significant adverse effects. As such, an
assessment will be carried out as part of the EIA, and detailed in the ES, where
predicted traffic data and screening criteria indicate that trip generation could
potentially result in significant effects. The effect of the meteorological data used in
terms of worst-case impacts on receptors in different areas was also discussed.
Dispersion modelling has been carried out with data from 2015, 2016 and 2017.
2017 meteorological data was shown to lead to the highest overall concentrations
in the study area. Results are therefore reported for 2017 to illustrate the likely
effects of the DCO Project.
Highways England
7.3.10 An initial meeting was held on 7 September 2017. This was followed by a meeting
to discuss the scope of the assessment which took place on 8 March 2018.
7.3.11 Reference was made to current government guidance that is available. The
Highways Agency (now Highways England) Design Manual for Roads and Bridges
(DMRB) (Highways Agency, 2007) contains guidance that can be used for
screening of roads that are likely to be affected by proposals. Interim Advice Note
174/13 (Highways Agency, 2013a) provides guidance on the evaluation of
significance for Highways Agency schemes. Interim Advice Note 175/13
(Highways Agency, 2013b) provides guidance on the assessment of compliance
with the EU limit value.
7.3.12 The two IANs have been used in determination of the nature of effects at receptors
on the Strategic Road Network, and in relation to compliance with EU limit values.
Transport for London (TfL)
7.3.13 An initial meeting was held on 17 September 2018. An overview of the DCO
Project was provided along with a high-level summary of the approach to the air
quality assessment.
7.3.14 Further details on the approach to assessment were provided at a meeting held on
30 October 2018. Topics covered included the study area, screening and
significance criteria to be applied, baseline monitoring, conversion of NOX to NO2
concentrations and dispersion model verification.
7.3.15 Dispersion modelling was discussed in more detail in the meeting of 12 February
2019. Topics covered included the approach to background pollutant
concentrations, model verification and sensitivity tests.
Heathrow Expansion PRELIMINARY ENVIRONMENTAL INFORMATION REPORT: Chapter 7: Air quality and odour
7.18 © Heathrow Airport Limited 2019
Environment Agency
7.3.16 A meeting was held with the Environment Agency on 23 April 2018. The proposed
scope of assessment was presented. It was confirmed that the role of the
Environment Agency as a statutory consultee will not cover air quality, however it
will need to be consulted should any particular aspect of the DCO Project require
an Environmental Permit. Specific emissions sources requiring an Environmental
Permit will be detailed in the ES.
Natural England
7.3.17 Engagement with Natural England has included discussion in relation to potential
changes in concentrations and deposition rates of NOX, potentially resulting in
habitat degradation. Engagement and consideration of this effect is discussed in
more detail in in Chapter 8 of this PEIR.
7.4 Scope of the assessment
Overview
7.4.1 This section describes the spatial and temporal scope for the assessment as it
applies to air quality and odour and outlines the receptors on which assessment
has been undertaken.
7.4.2 This scope has been developed as the DCO Project has evolved and responds to
feedback received to date as detailed in Section 7.3. The information presented in
the PEIR is by its nature preliminary and should not be considered a ‘draft’ ES (in
accordance with PINS Advice Note 7). Further scope refinement may be required
to take full account of the preferred DCO Project design and subsequent
engagement.
Spatial scope and study area
Construction dust
7.4.3 The study area for construction dust effects has been informed by Greater London
Authority (GLA) (2014) and IAQM Guidance on the assessment of dust from
demolition and construction (IAQM, 2014). These guidance documents are
considered to represent best practice. Assessment has been carried out for all
individual work sites where there is a human receptor within:
1. 350m of the boundary of the relevant site
2. 50m of a route(s) used by construction vehicles on the public highway or haul
routes, up to 500m from the site entrance(s).
Heathrow Expansion PRELIMINARY ENVIRONMENTAL INFORMATION REPORT: Chapter 7: Air quality and odour
7.19 © Heathrow Airport Limited 2019
Odour
7.4.4 It is recognised that different sources of odour will affect receptors over different
distances due to the varying strength and nature of emissions. Assessment has
been carried out for odour sources associated with the DCO Project that could
potentially have an impact on receptors (during the construction and operation
phases). The assessment has considered the odour potential (in relation to the
hedonic tone, the level of pleasure, or displeasure, that an odour creates) and
nature of the odour emission source (e.g. land preparation, aircraft movements),
the pathway for odour flux to receptor (e.g. distance and direction in relation to
prevailing wind direction), and analysis of odour complaints received in relation to
present operations. The assessment has been carried out in accordance with
IAQM guidance (2018), which is considered to represent best practice.
7.4.5 Hedonic tone is scored on a nine-point scale ranging from very pleasant (score of
+4, e.g. bakery smell) through 0 (neutral – neither offensive nor inoffensive) to
highly unpleasant (score of -4, e.g. rotting flesh).
7.4.6 There are no prescribed distance criteria in relation to odour emissions. Based on
professional judgement and supported by odour complaint data, therefore, this
assessment has considered impacts within each community area, on the basis of
distances from sources, which are considered to be excavated landfill sites during
construction and emissions from the North West Runway and associated stands
and taxiways during the operational phase of the DCO Project. The following
distance bands have been used to define the effectiveness of the pathway:
1. Receptors within 350m of the source
2. Receptors 350m-1km from the source
3. Receptors over 1 km from the source.
Assessment against Air Quality Objectives
7.4.7 Atmospheric dispersion modelling to predict pollutant concentrations has been
carried out for two separate model domains in order to focus the assessment on
the determination of likely significant effects:
1. The Core AQO Assessment Area is where pollutant concentrations have been
predicted for consideration against the AQOs at a selection of representative
receptors. Previous dispersion modelling studies that have been carried out,
including those undertaken on behalf of Heathrow (Amec, 2014) and by the
Airports Commission (Jacobs, 2015), show that this area includes the locations
where changes in local air quality (due to airfield, aircraft and road traffic
emissions) are likely to be greatest. The extent has also been determined on
Heathrow Expansion PRELIMINARY ENVIRONMENTAL INFORMATION REPORT: Chapter 7: Air quality and odour
7.20 © Heathrow Airport Limited 2019
the basis of community areas in which the magnitude of impacts has been
assessed. This is shown in Figure 7.1, Volume 2.
2. At receptors on specific road links outside of the Core AQO Assessment Area
where an initial assessment indicates that significant effects are possible.
These links have been determined using a tiered assessment approach
(described in Section 7.7) which takes account of changes in the number of
road traffic movements and the relative emissions in each assessment year. In
respect of emissions from aircraft, aircraft on approach and departure from
Heathrow have a limited impact on ground-level pollutant concentrations
beyond the Airport boundary, as aircraft are so high that emissions are diluted
by atmospheric diffusion before reaching the ground. Impacts outside of the
Core AQO Assessment Area will therefore be dictated by potential changes in
the number of airport-related road traffic movements and their associated
emissions. Impacts in relation to changes to pollutant concentrations smaller
than those reported in this assessment across a wider area are discussed in
Chapter 12.
7.4.8 At the initial stage of the tiered assessment approach, road links on the Highways
England Strategic Road Network outside of the Core AQO Assessment Area have
been considered to be potentially affected by the DCO Project if any of the
following criteria detailed in the DMRB (Highways Agency, 2007) apply:
1. Daily traffic flows will change by 1,000 Annual Average Daily Traffic (AADT) or
more
2. HDV flows will change by 200 AADT or more
3. Daily average speed will change by 10km/hr or more
4. Peak hour speed will change by 20km/hr or more.
7.4.9 At the initial stage of the tiered assessment, road links on the urban road network
(all other roads) outside of the Core AQO Assessment Area have been considered
to be potentially affected by the DCO Project if any of the following criteria detailed
in the EPUK/IAQM guidance (2017) apply:
1. A change of Light Duty Vehicle (LDV) flows (which includes cars) of:
a. More than 100 AADT within or adjacent to an AQMA
b. More than 500 AADT elsewhere.
2. A change of Heavy Duty Vehicle (HDV) flows of:
a. More than 25 AADT within or adjacent to an AQMA
b. More than 100 AADT elsewhere.
Heathrow Expansion PRELIMINARY ENVIRONMENTAL INFORMATION REPORT: Chapter 7: Air quality and odour
7.21 © Heathrow Airport Limited 2019
7.4.10 Further details on road traffic modelling (which has provided the vehicle data that
have been used to determine if the criteria have been met) can be found in
Chapter 19: Transport network users.
Assessment of compliance with EU limit values
7.4.11 Road links where compliance with EU limit values is assessed are considered
separately.
7.4.12 NO2 concentrations have been considered at all key PCM assessment locations
within the Core AQO Assessment Area that has been defined in Section 7.4.
Additional PCM locations on the A4 and A40 between the Airport and Central
London where any changes in road traffic could potentially affect the compliance
status of the Greater London agglomeration zone (the relevant zone in which
compliance with EU limit values is assessed) have also been considered. The
assessment considers locations assessed in work carried out on behalf of the
Department for Transport (2017). These are shown in Figure 7.2, Volume 2. The
assessment methodology focuses on the increment in road traffic related pollutant
concentrations at PCM locations as a result of the DCO Project.
Temporal scope
Introduction
7.4.13 The DCO Project will be developed in a phased approach meaning that in some
periods and/or some locations both construction and operational activities will take
place in parallel. Three phases have been identified to broadly correspond with the
most prevalent activities that will arise as a result of the DCO Project.
7.4.14 A number of years have been selected for assessment within each phase, the
approach for which is described in Chapter 5: Approach to the EIA.
7.4.15 The assessment of air quality and odour assesses the following years for this
PEIR:
Phase 1 (c. 2022 – 2026)
1. c.2022-2026 – assessment of construction dust risk has been carried out for each
half year time slice to provide information on the ongoing construction activities
through the phase.
2. 2022 – first year of capacity release of additional ATMs and year in which enabling
works and construction sites are established. Dispersion modelling has been
carried out to predict pollutant concentrations at sensitive receptors in this year as
concentrations are expected to be at their highest in the phase as road traffic
emission factors and background pollutant concentrations are expected to decrease
Heathrow Expansion PRELIMINARY ENVIRONMENTAL INFORMATION REPORT: Chapter 7: Air quality and odour
7.22 © Heathrow Airport Limited 2019
each year. Emissions from construction traffic and ongoing operation are included
in the assessment.
Phase 2 (c. late 2026 – 2033)
1. 2027 – the first full calendar year when the North West Runway is operational.
During this year construction activities will be ongoing, although construction traffic
is not accounted for in the current version of the road traffic model, however the
likelihood of significant effects is not expected to differ from that presented in this
assessment as construction traffic volumes will be substantially lower than during
the earthworks peak. Construction traffic during Phase 2 will be accounted for in the
ES. Dispersion modelling has been carried out to predict pollutant concentrations at
sensitive receptors in this year. Pollutant concentrations at sensitive receptors are
expected to be higher than subsequent years despite increases in ATMs as road
traffic is the major determining factor of concentrations at roadside locations. Road
traffic emission factors and background pollutant concentrations are expected to
decrease each year. Assessment of construction dust risk has been carried out for
this year.
2. 2030 – The first date which applies for the ANPS surface access targets. Dispersion
modelling has been carried out to predict pollutant concentrations at sensitive
receptors in this year in order to demonstrate the impacts of the progressive
development of infrastructure.
Phase 3 (c. 2034 – 2050)
1. 2035 – referred to as the ANPS capacity year, where the annual number of ATMs at
the Airport is assumed to reach 740k. As with Phase 2, construction traffic is also
not accounted for in the current version of the road traffic model, but will be
accounted for in the ES. Dispersion modelling has been carried out to predict
pollutant concentrations at sensitive receptors in this year. The assessment uses
the latest available year of published road traffic emission factors and background
pollutant concentrations (2030). Therefore this will represent a worst-case
assessment for Phase 3 in terms of pollutant concentrations at receptors. Vehicle
emissions and background pollutant concentrations are expected to decline further
after 2030 as low and zero emissions technologies permeate the road fleet; this is
not accounted for in the calculation of emissions and subsequent dispersion
modelling for 2035.
2. 2050 – Year of maximum capacity, where the annual number of ATMs at the Airport
reaches 756k. Impacts in this year are considered qualitatively as road traffic
emission factors and background pollutant concentrations are only available up to
2030 and, therefore, it is not considered possible to make robust predictions for
2050.
Heathrow Expansion PRELIMINARY ENVIRONMENTAL INFORMATION REPORT: Chapter 7: Air quality and odour
7.23 © Heathrow Airport Limited 2019
Receptors
7.4.16 The spatial and temporal scope of the assessment enables the identification of
receptors which may experience a change as a result of the DCO Project.
7.4.17 Defra guidance on LAQM (LAQM.TG(16)) makes clear that exceedances of the
health-based AQOs should be assessed at outdoor locations where members of
the general public are regularly present over the averaging time of the objective.
Workplaces are excluded, as explained in Table 7.4, which provides an indication
of those locations that may or may not be relevant for each averaging period.
7.4.18 Where detailed assessment has been undertaken (within the Core AQO
Assessment Area and in other discrete additional areas where traffic data
indicates that detailed assessment is required) pollutant concentrations have been
modelled at a selection of relevant receptors to assess effects within each
community area.
7.4.19 Model outputs have also been interpolated to determine the total concentrations,
changes in concentrations and impact descriptors at all residential addresses in
the Ordance Survey AddressBase data within the Core AQO Assessment Area.
This process has enabled values to be determined for 145,452 residential
properties. It is worth noting that the location attributes of AddressBase address
points are not necessarily on the façade of properties facing the emission sources
and are generally at the centre of the relevant building. The results that would be
determined if exact property façade locations were used would not be expected to
be significantly different from those presented in this assessment.
7.4.20 The list of receptors will be kept under review as supplementary information is
obtained during baseline surveys and other forms of data collection by other
aspects and will be reflected in the final ES.
7.4.21 Where emissions that have a potential to cause a nuisance are considered (dust
and odour), commercial premises are also considered as sensitive receptors.
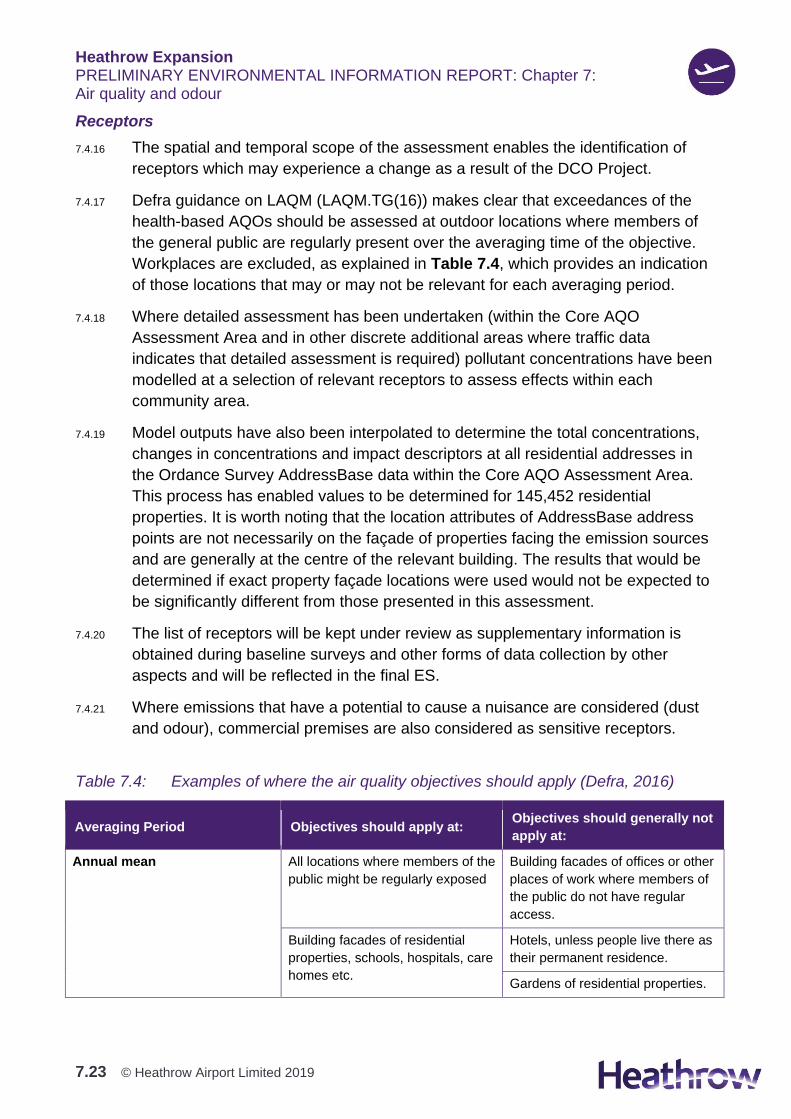
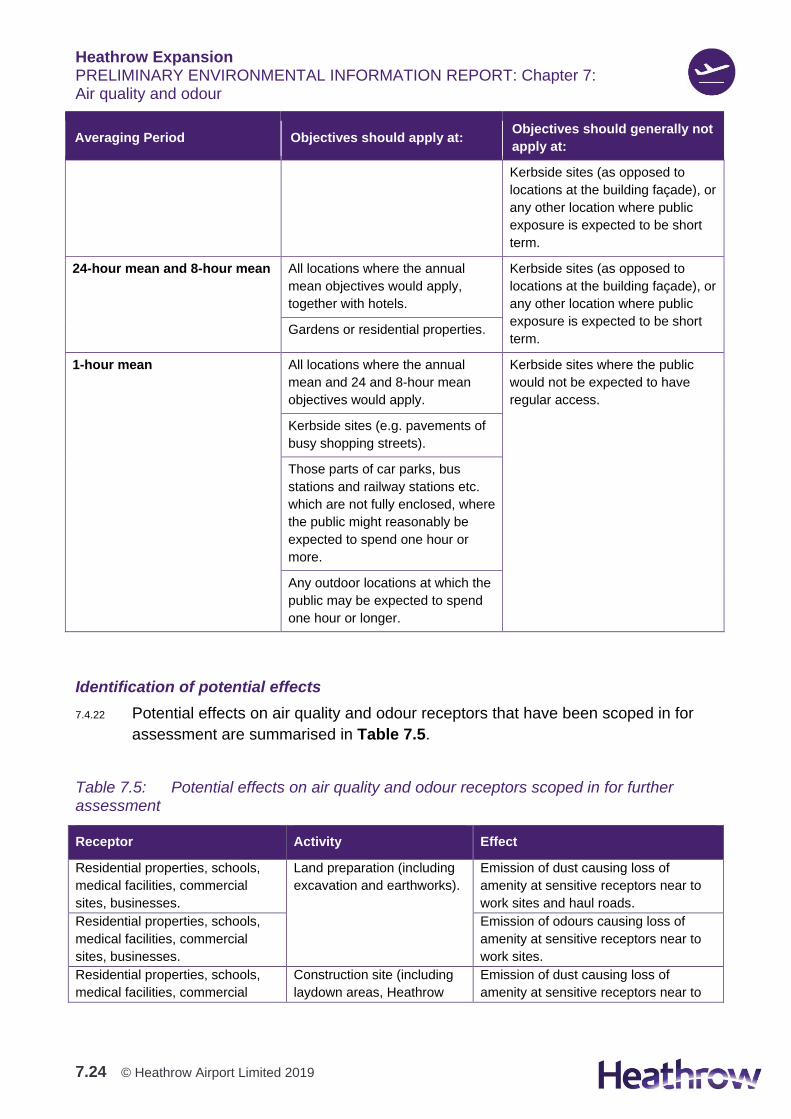
Table 7.4: Examples of where the air quality objectives should apply (Defra, 2016)
Averaging Period Objectives should apply at: Objectives should generally not
apply at:
Annual mean All locations where members of the
public might be regularly exposed
Building facades of offices or other
places of work where members of
the public do not have regular
access.
Building facades of residential
properties, schools, hospitals, care
homes etc.
Hotels, unless people live there as
their permanent residence.
Gardens of residential properties.
Heathrow Expansion PRELIMINARY ENVIRONMENTAL INFORMATION REPORT: Chapter 7: Air quality and odour
7.24 © Heathrow Airport Limited 2019
Averaging Period Objectives should apply at: Objectives should generally not
apply at:
Kerbside sites (as opposed to
locations at the building façade), or
any other location where public
exposure is expected to be short
term.
24-hour mean and 8-hour mean All locations where the annual
mean objectives would apply,
together with hotels.
Kerbside sites (as opposed to
locations at the building façade), or
any other location where public
exposure is expected to be short
term. Gardens or residential properties.
1-hour mean All locations where the annual
mean and 24 and 8-hour mean
objectives would apply.
Kerbside sites where the public
would not be expected to have
regular access.
Kerbside sites (e.g. pavements of
busy shopping streets).
Those parts of car parks, bus
stations and railway stations etc.
which are not fully enclosed, where
the public might reasonably be
expected to spend one hour or
more.
Any outdoor locations at which the
public may be expected to spend
one hour or longer.
Identification of potential effects
7.4.22 Potential effects on air quality and odour receptors that have been scoped in for
assessment are summarised in Table 7.5.
Table 7.5: Potential effects on air quality and odour receptors scoped in for further assessment
Receptor Activity Effect
Residential properties, schools,
medical facilities, commercial
sites, businesses.
Land preparation (including
excavation and earthworks).
Emission of dust causing loss of
amenity at sensitive receptors near to
work sites and haul roads.
Residential properties, schools,
medical facilities, commercial
sites, businesses.
Emission of odours causing loss of
amenity at sensitive receptors near to
work sites.
Residential properties, schools,
medical facilities, commercial
Construction site (including
laydown areas, Heathrow
Emission of dust causing loss of
amenity at sensitive receptors near to
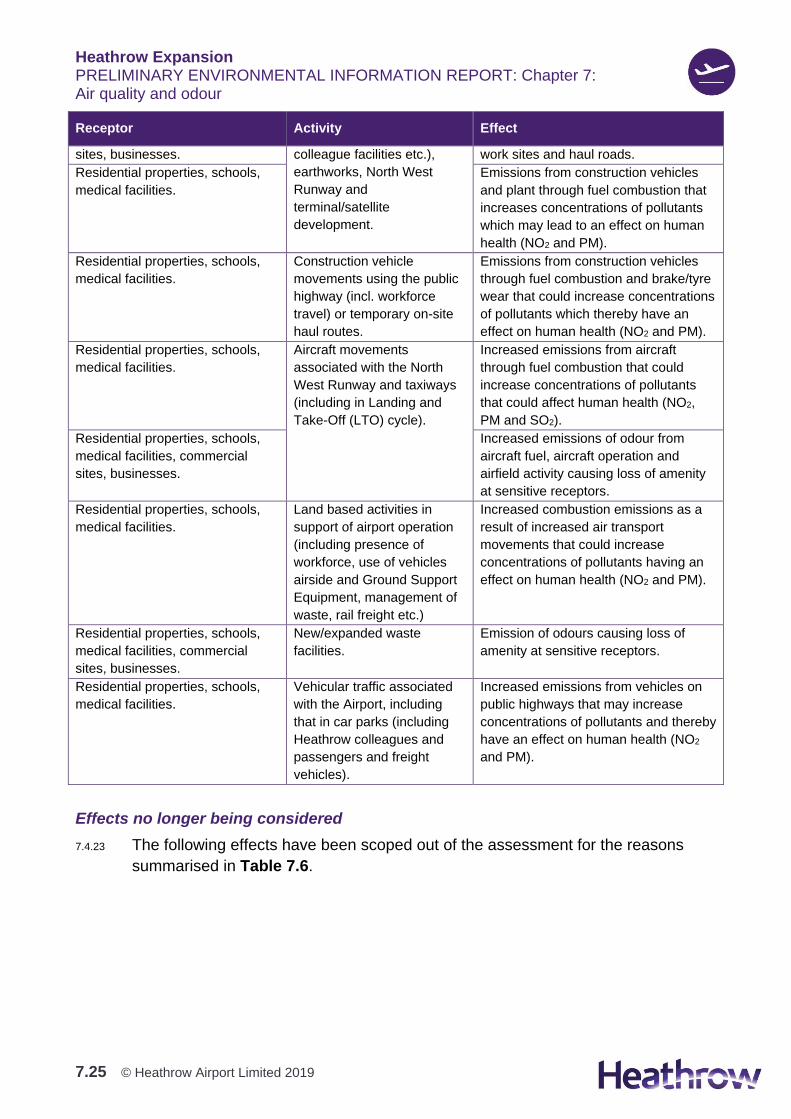
Heathrow Expansion PRELIMINARY ENVIRONMENTAL INFORMATION REPORT: Chapter 7: Air quality and odour
7.25 © Heathrow Airport Limited 2019
Receptor Activity Effect
sites, businesses. colleague facilities etc.),
earthworks, North West
Runway and
terminal/satellite
development.
work sites and haul roads.
Residential properties, schools,
medical facilities.
Emissions from construction vehicles
and plant through fuel combustion that
increases concentrations of pollutants
which may lead to an effect on human
health (NO2 and PM).
Residential properties, schools,
medical facilities.
Construction vehicle
movements using the public
highway (incl. workforce
travel) or temporary on-site
haul routes.
Emissions from construction vehicles
through fuel combustion and brake/tyre
wear that could increase concentrations
of pollutants which thereby have an
effect on human health (NO2 and PM).
Residential properties, schools,
medical facilities.
Aircraft movements
associated with the North
West Runway and taxiways
(including in Landing and
Take-Off (LTO) cycle).
Increased emissions from aircraft
through fuel combustion that could
increase concentrations of pollutants
that could affect human health (NO2,
PM and SO2).
Residential properties, schools,
medical facilities, commercial
sites, businesses.
Increased emissions of odour from
aircraft fuel, aircraft operation and
airfield activity causing loss of amenity
at sensitive receptors.
Residential properties, schools,
medical facilities.
Land based activities in
support of airport operation
(including presence of
workforce, use of vehicles
airside and Ground Support
Equipment, management of
waste, rail freight etc.)
Increased combustion emissions as a
result of increased air transport
movements that could increase
concentrations of pollutants having an
effect on human health (NO2 and PM).
Residential properties, schools,
medical facilities, commercial
sites, businesses.
New/expanded waste
facilities.
Emission of odours causing loss of
amenity at sensitive receptors.
Residential properties, schools,
medical facilities.
Vehicular traffic associated
with the Airport, including
that in car parks (including
Heathrow colleagues and
passengers and freight
vehicles).
Increased emissions from vehicles on
public highways that may increase
concentrations of pollutants and thereby
have an effect on human health (NO2
and PM).
Effects no longer being considered
7.4.23 The following effects have been scoped out of the assessment for the reasons
summarised in Table 7.6.
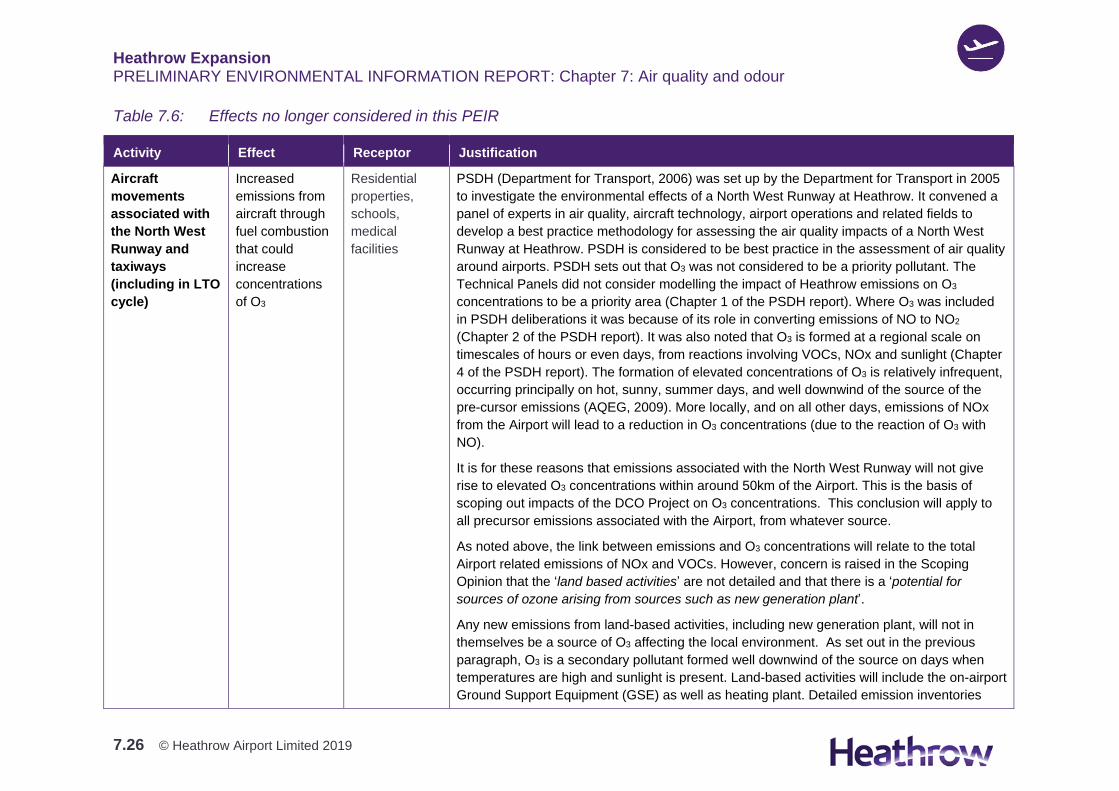
Heathrow Expansion PRELIMINARY ENVIRONMENTAL INFORMATION REPORT: Chapter 7: Air quality and odour
7.26 © Heathrow Airport Limited 2019
Table 7.6: Effects no longer considered in this PEIR
Activity Effect Receptor Justification
Aircraft
movements
associated with
the North West
Runway and
taxiways
(including in LTO
cycle)
Increased
emissions from
aircraft through
fuel combustion
that could
increase
concentrations
of O3
Residential
properties,
schools,
medical
facilities
PSDH (Department for Transport, 2006) was set up by the Department for Transport in 2005
to investigate the environmental effects of a North West Runway at Heathrow. It convened a
panel of experts in air quality, aircraft technology, airport operations and related fields to
develop a best practice methodology for assessing the air quality impacts of a North West
Runway at Heathrow. PSDH is considered to be best practice in the assessment of air quality
around airports. PSDH sets out that O3 was not considered to be a priority pollutant. The
Technical Panels did not consider modelling the impact of Heathrow emissions on O3
concentrations to be a priority area (Chapter 1 of the PSDH report). Where O3 was included
in PSDH deliberations it was because of its role in converting emissions of NO to NO2
(Chapter 2 of the PSDH report). It was also noted that O3 is formed at a regional scale on
timescales of hours or even days, from reactions involving VOCs, NOx and sunlight (Chapter
4 of the PSDH report). The formation of elevated concentrations of O3 is relatively infrequent,
occurring principally on hot, sunny, summer days, and well downwind of the source of the
pre-cursor emissions (AQEG, 2009). More locally, and on all other days, emissions of NOx
from the Airport will lead to a reduction in O3 concentrations (due to the reaction of O3 with
NO).
It is for these reasons that emissions associated with the North West Runway will not give
rise to elevated O3 concentrations within around 50km of the Airport. This is the basis of
scoping out impacts of the DCO Project on O3 concentrations. This conclusion will apply to
all precursor emissions associated with the Airport, from whatever source.
As noted above, the link between emissions and O3 concentrations will relate to the total
Airport related emissions of NOx and VOCs. However, concern is raised in the Scoping
Opinion that the ‘land based activities’ are not detailed and that there is a ‘potential for
sources of ozone arising from sources such as new generation plant’.
Any new emissions from land-based activities, including new generation plant, will not in
themselves be a source of O3 affecting the local environment. As set out in the previous
paragraph, O3 is a secondary pollutant formed well downwind of the source on days when
temperatures are high and sunlight is present. Land-based activities will include the on-airport
Ground Support Equipment (GSE) as well as heating plant. Detailed emission inventories
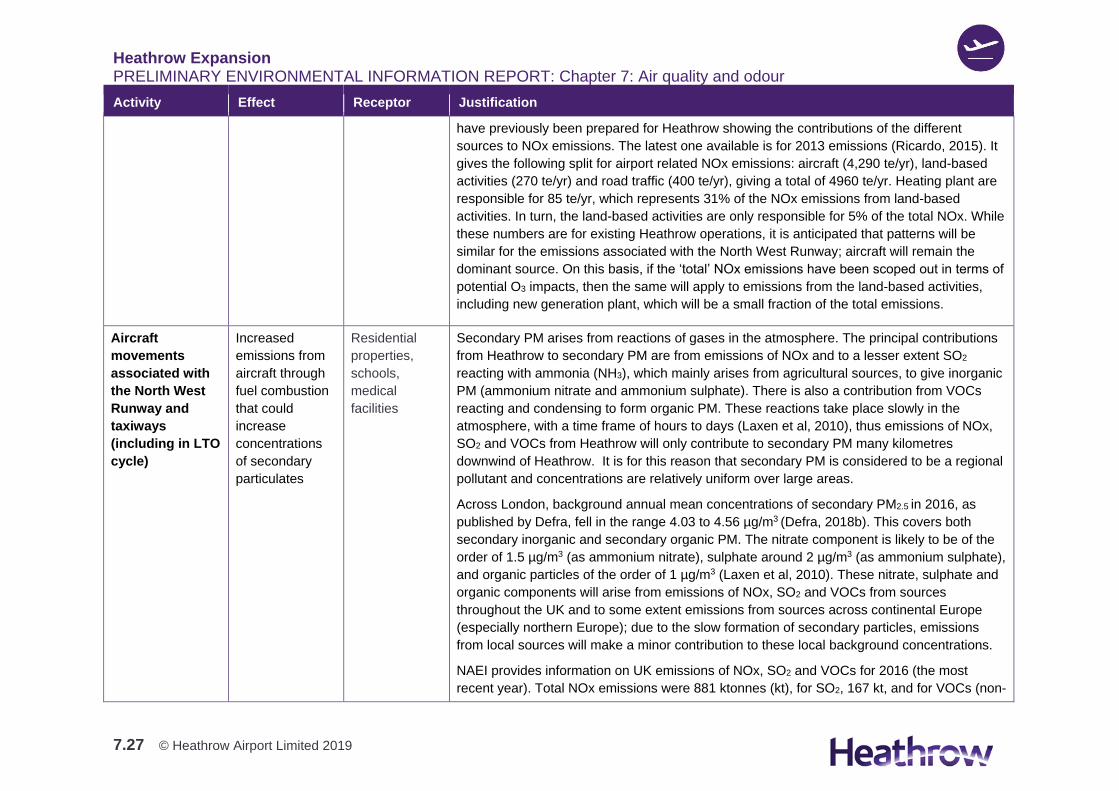
Heathrow Expansion PRELIMINARY ENVIRONMENTAL INFORMATION REPORT: Chapter 7: Air quality and odour
7.27 © Heathrow Airport Limited 2019
Activity Effect Receptor Justification
have previously been prepared for Heathrow showing the contributions of the different
sources to NOx emissions. The latest one available is for 2013 emissions (Ricardo, 2015). It
gives the following split for airport related NOx emissions: aircraft (4,290 te/yr), land-based
activities (270 te/yr) and road traffic (400 te/yr), giving a total of 4960 te/yr. Heating plant are
responsible for 85 te/yr, which represents 31% of the NOx emissions from land-based
activities. In turn, the land-based activities are only responsible for 5% of the total NOx. While
these numbers are for existing Heathrow operations, it is anticipated that patterns will be
similar for the emissions associated with the North West Runway; aircraft will remain the
dominant source. On this basis, if the ‘total’ NOx emissions have been scoped out in terms of
potential O3 impacts, then the same will apply to emissions from the land-based activities,
including new generation plant, which will be a small fraction of the total emissions.
Aircraft
movements
associated with
the North West
Runway and
taxiways
(including in LTO
cycle)
Increased
emissions from
aircraft through
fuel combustion
that could
increase
concentrations
of secondary
particulates
Residential
properties,
schools,
medical
facilities
Secondary PM arises from reactions of gases in the atmosphere. The principal contributions
from Heathrow to secondary PM are from emissions of NOx and to a lesser extent SO2
reacting with ammonia (NH3), which mainly arises from agricultural sources, to give inorganic
PM (ammonium nitrate and ammonium sulphate). There is also a contribution from VOCs
reacting and condensing to form organic PM. These reactions take place slowly in the
atmosphere, with a time frame of hours to days (Laxen et al, 2010), thus emissions of NOx,
SO2 and VOCs from Heathrow will only contribute to secondary PM many kilometres
downwind of Heathrow. It is for this reason that secondary PM is considered to be a regional
pollutant and concentrations are relatively uniform over large areas.
Across London, background annual mean concentrations of secondary PM2.5 in 2016, as
published by Defra, fell in the range 4.03 to 4.56 µg/m3 (Defra, 2018b). This covers both
secondary inorganic and secondary organic PM. The nitrate component is likely to be of the
order of 1.5 µg/m3 (as ammonium nitrate), sulphate around 2 µg/m3 (as ammonium sulphate),
and organic particles of the order of 1 µg/m3 (Laxen et al, 2010). These nitrate, sulphate and
organic components will arise from emissions of NOx, SO2 and VOCs from sources
throughout the UK and to some extent emissions from sources across continental Europe
(especially northern Europe); due to the slow formation of secondary particles, emissions
from local sources will make a minor contribution to these local background concentrations.
NAEI provides information on UK emissions of NOx, SO2 and VOCs for 2016 (the most
recent year). Total NOx emissions were 881 ktonnes (kt), for SO2, 167 kt, and for VOCs (non-
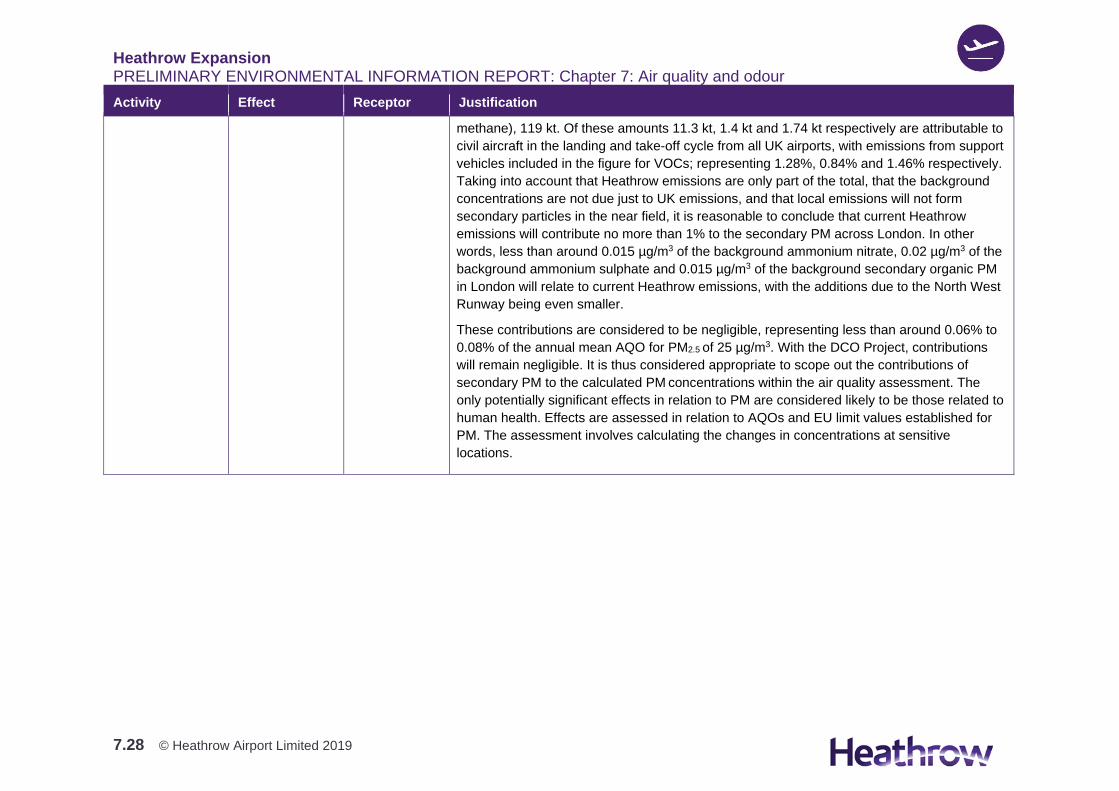
Heathrow Expansion PRELIMINARY ENVIRONMENTAL INFORMATION REPORT: Chapter 7: Air quality and odour
7.28 © Heathrow Airport Limited 2019
Activity Effect Receptor Justification
methane), 119 kt. Of these amounts 11.3 kt, 1.4 kt and 1.74 kt respectively are attributable to
civil aircraft in the landing and take-off cycle from all UK airports, with emissions from support
vehicles included in the figure for VOCs; representing 1.28%, 0.84% and 1.46% respectively.
Taking into account that Heathrow emissions are only part of the total, that the background
concentrations are not due just to UK emissions, and that local emissions will not form
secondary particles in the near field, it is reasonable to conclude that current Heathrow
emissions will contribute no more than 1% to the secondary PM across London. In other
words, less than around 0.015 µg/m3 of the background ammonium nitrate, 0.02 µg/m3 of the
background ammonium sulphate and 0.015 µg/m3 of the background secondary organic PM
in London will relate to current Heathrow emissions, with the additions due to the North West
Runway being even smaller.
These contributions are considered to be negligible, representing less than around 0.06% to
0.08% of the annual mean AQO for PM2.5 of 25 µg/m3. With the DCO Project, contributions
will remain negligible. It is thus considered appropriate to scope out the contributions of
secondary PM to the calculated PM concentrations within the air quality assessment. The
only potentially significant effects in relation to PM are considered likely to be those related to
human health. Effects are assessed in relation to AQOs and EU limit values established for
PM. The assessment involves calculating the changes in concentrations at sensitive
locations.
Heathrow Expansion PRELIMINARY ENVIRONMENTAL INFORMATION REPORT: Chapter 7: Air quality and odour
7.29 © Heathrow Airport Limited 2019
7.5 Embedded environmental measures
7.5.1 The DCO Project will consider a number of environmental measures to avoid or
reduce likely significant effects. This approach is described in Chapter 5. Some of
these environmental measures have been embedded into the DCO Project design.
Those embedded environmental measures that influence the assessment of air
quality and odour are set out in Table 7.7.
7.5.2 Good practice environmental measures would occur with or without input from the
EIA feeding into the design process. They include actions that would be
undertaken to meet other existing legislative requirements, or that are considered
to be standard practices. These will be a continuation of the measures detailed in
the current Emissions Strategy and Action Plan (Heathrow, 2018). Those good
practice environmental measures that influence the assessment of air quality and
odour are set out in Table 7.8.
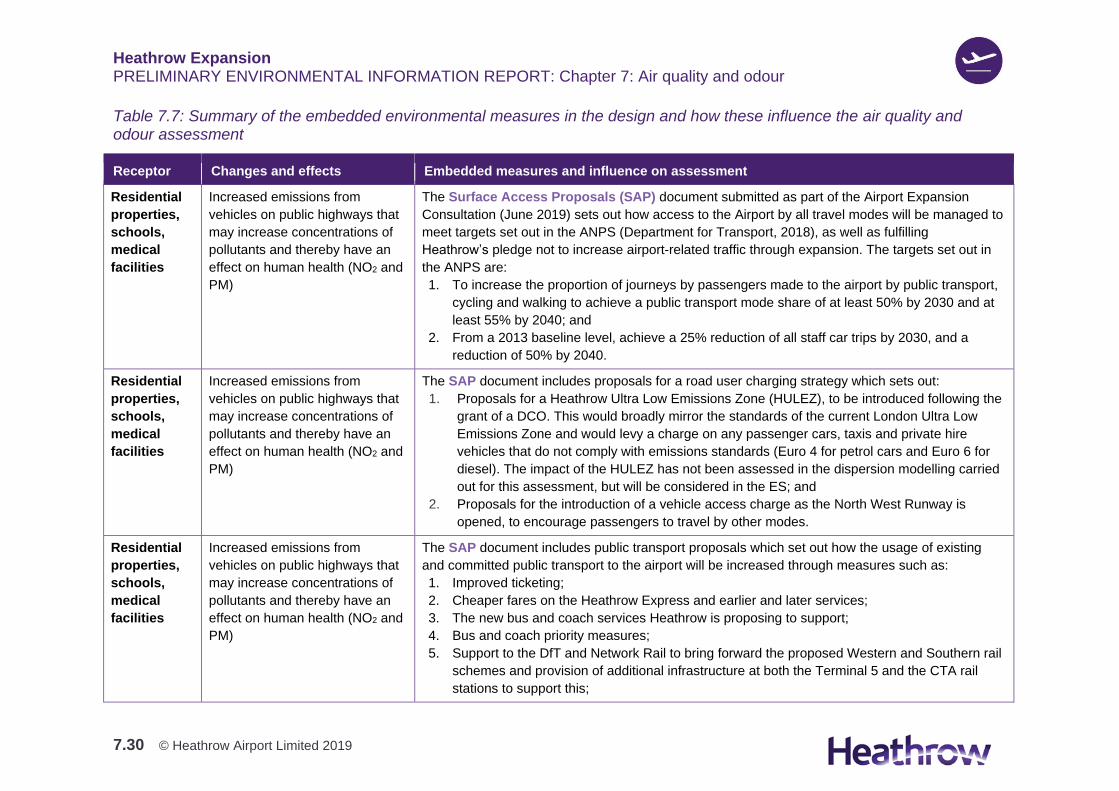
Heathrow Expansion PRELIMINARY ENVIRONMENTAL INFORMATION REPORT: Chapter 7: Air quality and odour
7.30 © Heathrow Airport Limited 2019
Table 7.7: Summary of the embedded environmental measures in the design and how these influence the air quality and odour assessment
Receptor Changes and effects Embedded measures and influence on assessment
Residential
properties,
schools,
medical
facilities
Increased emissions from
vehicles on public highways that
may increase concentrations of
pollutants and thereby have an
effect on human health (NO2 and
PM)
The Surface Access Proposals (SAP) document submitted as part of the Airport Expansion
Consultation (June 2019) sets out how access to the Airport by all travel modes will be managed to
meet targets set out in the ANPS (Department for Transport, 2018), as well as fulfilling
Heathrow’s pledge not to increase airport-related traffic through expansion. The targets set out in
the ANPS are:
1. To increase the proportion of journeys by passengers made to the airport by public transport,
cycling and walking to achieve a public transport mode share of at least 50% by 2030 and at
least 55% by 2040; and
2. From a 2013 baseline level, achieve a 25% reduction of all staff car trips by 2030, and a
reduction of 50% by 2040.
Residential
properties,
schools,
medical
facilities
Increased emissions from
vehicles on public highways that
may increase concentrations of
pollutants and thereby have an
effect on human health (NO2 and
PM)
The SAP document includes proposals for a road user charging strategy which sets out:
1. Proposals for a Heathrow Ultra Low Emissions Zone (HULEZ), to be introduced following the
grant of a DCO. This would broadly mirror the standards of the current London Ultra Low
Emissions Zone and would levy a charge on any passenger cars, taxis and private hire
vehicles that do not comply with emissions standards (Euro 4 for petrol cars and Euro 6 for
diesel). The impact of the HULEZ has not been assessed in the dispersion modelling carried
out for this assessment, but will be considered in the ES; and
2. Proposals for the introduction of a vehicle access charge as the North West Runway is
opened, to encourage passengers to travel by other modes.
Residential
properties,
schools,
medical
facilities
Increased emissions from
vehicles on public highways that
may increase concentrations of
pollutants and thereby have an
effect on human health (NO2 and
PM)
The SAP document includes public transport proposals which set out how the usage of existing
and committed public transport to the airport will be increased through measures such as:
1. Improved ticketing;
2. Cheaper fares on the Heathrow Express and earlier and later services;
3. The new bus and coach services Heathrow is proposing to support;
4. Bus and coach priority measures;
5. Support to the DfT and Network Rail to bring forward the proposed Western and Southern rail
schemes and provision of additional infrastructure at both the Terminal 5 and the CTA rail
stations to support this;
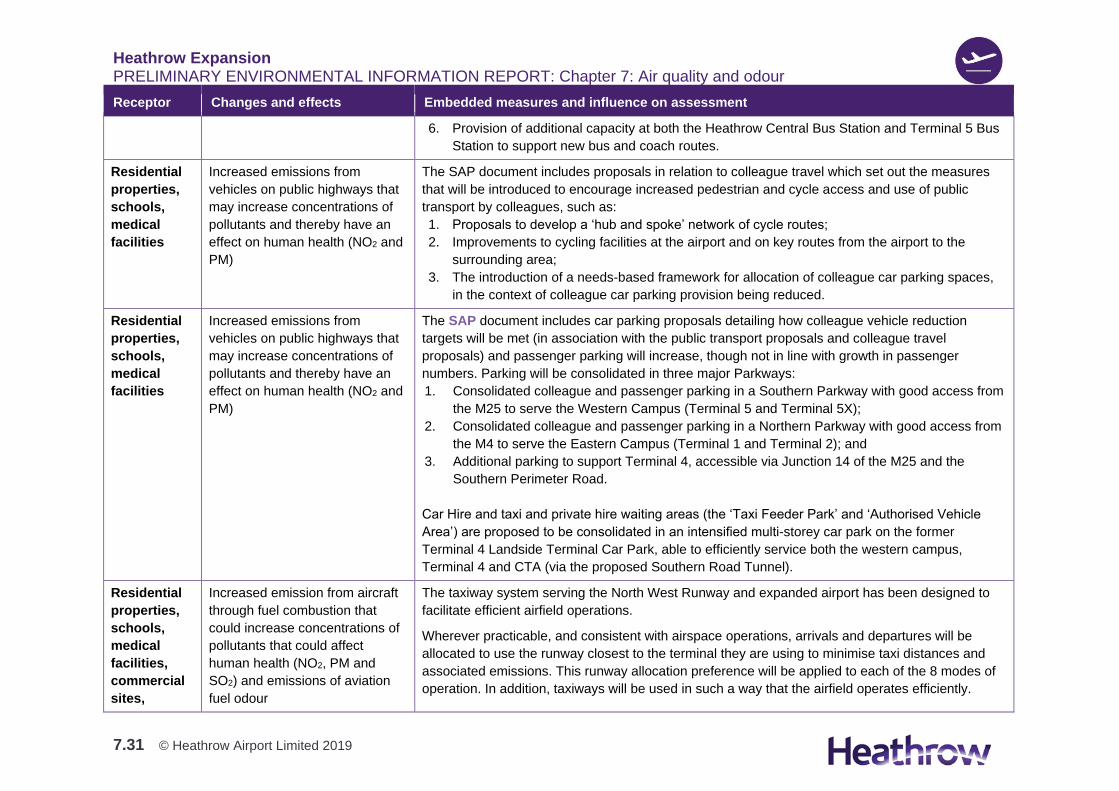
Heathrow Expansion PRELIMINARY ENVIRONMENTAL INFORMATION REPORT: Chapter 7: Air quality and odour
7.31 © Heathrow Airport Limited 2019
Receptor Changes and effects Embedded measures and influence on assessment
6. Provision of additional capacity at both the Heathrow Central Bus Station and Terminal 5 Bus
Station to support new bus and coach routes.
Residential
properties,
schools,
medical
facilities
Increased emissions from
vehicles on public highways that
may increase concentrations of
pollutants and thereby have an
effect on human health (NO2 and
PM)
The SAP document includes proposals in relation to colleague travel which set out the measures
that will be introduced to encourage increased pedestrian and cycle access and use of public
transport by colleagues, such as:
1. Proposals to develop a ‘hub and spoke’ network of cycle routes;
2. Improvements to cycling facilities at the airport and on key routes from the airport to the
surrounding area;
3. The introduction of a needs-based framework for allocation of colleague car parking spaces,
in the context of colleague car parking provision being reduced.
Residential
properties,
schools,
medical
facilities
Increased emissions from
vehicles on public highways that
may increase concentrations of
pollutants and thereby have an
effect on human health (NO2 and
PM)
The SAP document includes car parking proposals detailing how colleague vehicle reduction
targets will be met (in association with the public transport proposals and colleague travel
proposals) and passenger parking will increase, though not in line with growth in passenger
numbers. Parking will be consolidated in three major Parkways:
1. Consolidated colleague and passenger parking in a Southern Parkway with good access from
the M25 to serve the Western Campus (Terminal 5 and Terminal 5X);
2. Consolidated colleague and passenger parking in a Northern Parkway with good access from
the M4 to serve the Eastern Campus (Terminal 1 and Terminal 2); and
3. Additional parking to support Terminal 4, accessible via Junction 14 of the M25 and the
Southern Perimeter Road.
Car Hire and taxi and private hire waiting areas (the ‘Taxi Feeder Park’ and ‘Authorised Vehicle
Area’) are proposed to be consolidated in an intensified multi-storey car park on the former
Terminal 4 Landside Terminal Car Park, able to efficiently service both the western campus,
Terminal 4 and CTA (via the proposed Southern Road Tunnel).
Residential
properties,
schools,
medical
facilities,
commercial
sites,
Increased emission from aircraft
through fuel combustion that
could increase concentrations of
pollutants that could affect
human health (NO2, PM and
SO2) and emissions of aviation
fuel odour
The taxiway system serving the North West Runway and expanded airport has been designed to
facilitate efficient airfield operations.
Wherever practicable, and consistent with airspace operations, arrivals and departures will be
allocated to use the runway closest to the terminal they are using to minimise taxi distances and
associated emissions. This runway allocation preference will be applied to each of the 8 modes of
operation. In addition, taxiways will be used in such a way that the airfield operates efficiently.
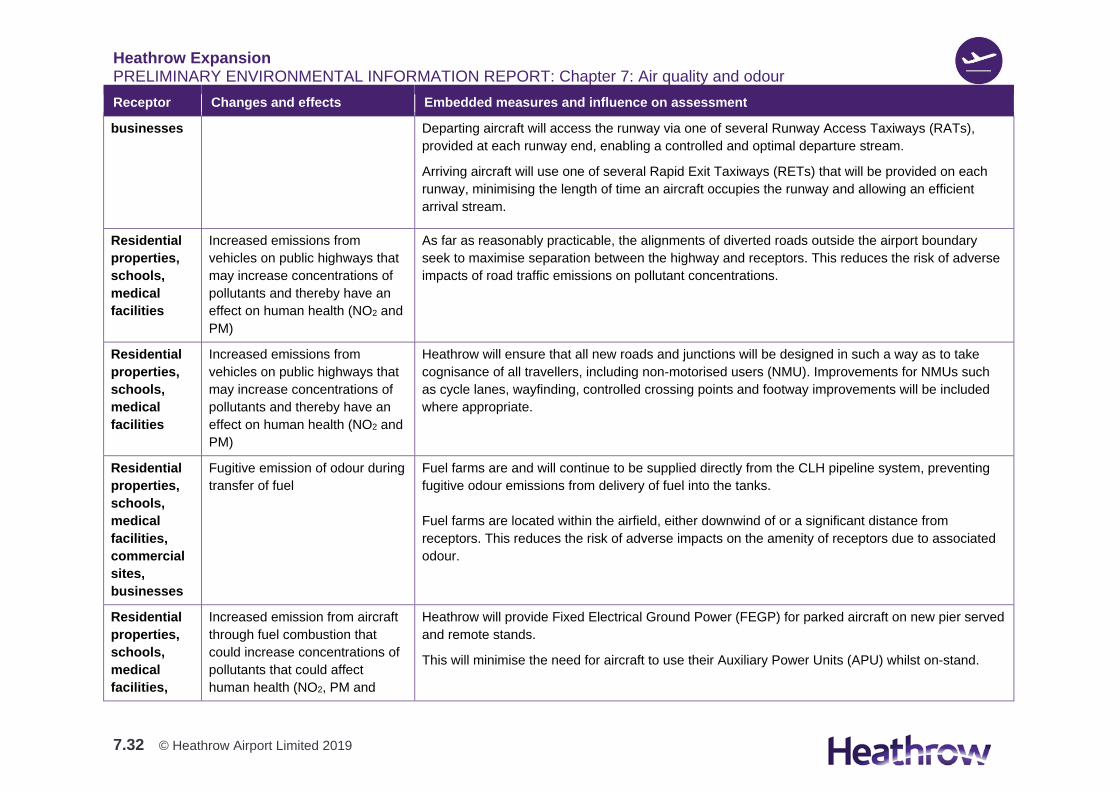
Heathrow Expansion PRELIMINARY ENVIRONMENTAL INFORMATION REPORT: Chapter 7: Air quality and odour
7.32 © Heathrow Airport Limited 2019
Receptor Changes and effects Embedded measures and influence on assessment
businesses Departing aircraft will access the runway via one of several Runway Access Taxiways (RATs),
provided at each runway end, enabling a controlled and optimal departure stream.
Arriving aircraft will use one of several Rapid Exit Taxiways (RETs) that will be provided on each
runway, minimising the length of time an aircraft occupies the runway and allowing an efficient
arrival stream.
Residential
properties,
schools,
medical
facilities
Increased emissions from
vehicles on public highways that
may increase concentrations of
pollutants and thereby have an
effect on human health (NO2 and
PM)
As far as reasonably practicable, the alignments of diverted roads outside the airport boundary
seek to maximise separation between the highway and receptors. This reduces the risk of adverse
impacts of road traffic emissions on pollutant concentrations.
Residential
properties,
schools,
medical
facilities
Increased emissions from
vehicles on public highways that
may increase concentrations of
pollutants and thereby have an
effect on human health (NO2 and
PM)
Heathrow will ensure that all new roads and junctions will be designed in such a way as to take
cognisance of all travellers, including non-motorised users (NMU). Improvements for NMUs such
as cycle lanes, wayfinding, controlled crossing points and footway improvements will be included
where appropriate.
Residential
properties,
schools,
medical
facilities,
commercial
sites,
businesses
Fugitive emission of odour during
transfer of fuel
Fuel farms are and will continue to be supplied directly from the CLH pipeline system, preventing
fugitive odour emissions from delivery of fuel into the tanks.
Fuel farms are located within the airfield, either downwind of or a significant distance from
receptors. This reduces the risk of adverse impacts on the amenity of receptors due to associated
odour.
Residential
properties,
schools,
medical
facilities,
Increased emission from aircraft
through fuel combustion that
could increase concentrations of
pollutants that could affect
human health (NO2, PM and
Heathrow will provide Fixed Electrical Ground Power (FEGP) for parked aircraft on new pier served
and remote stands.
This will minimise the need for aircraft to use their Auxiliary Power Units (APU) whilst on-stand.
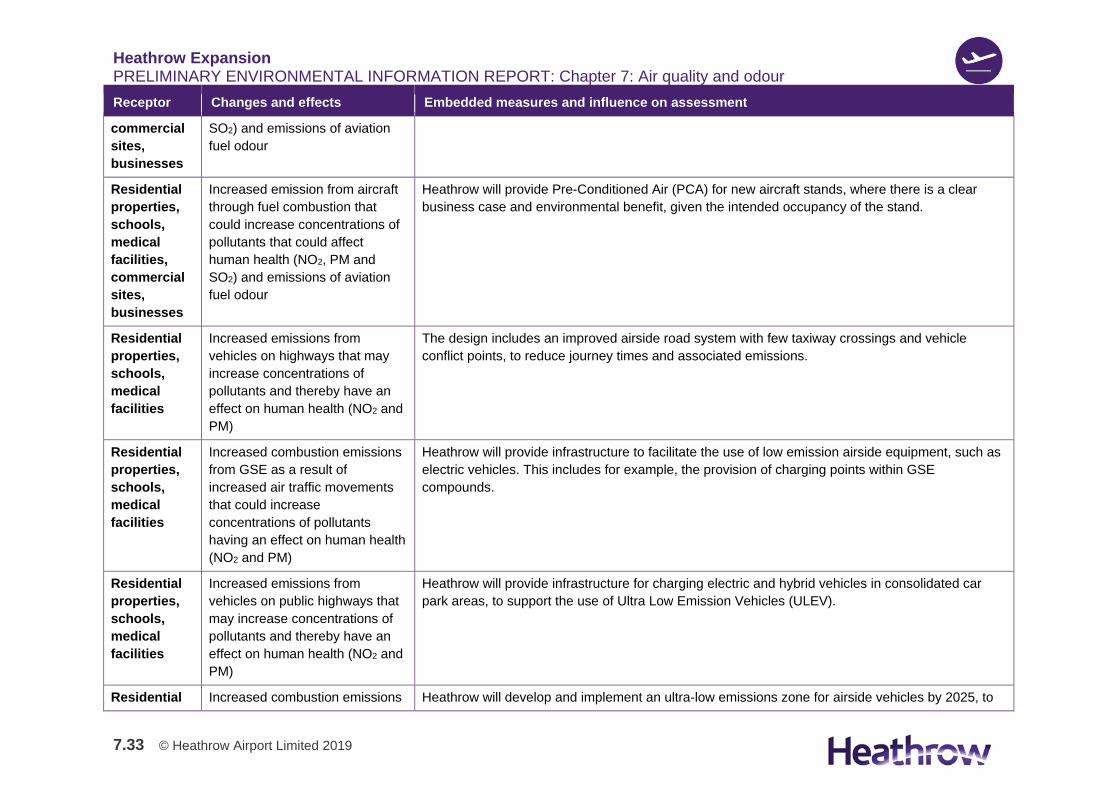
Heathrow Expansion PRELIMINARY ENVIRONMENTAL INFORMATION REPORT: Chapter 7: Air quality and odour
7.33 © Heathrow Airport Limited 2019
Receptor Changes and effects Embedded measures and influence on assessment
commercial
sites,
businesses
SO2) and emissions of aviation
fuel odour
Residential
properties,
schools,
medical
facilities,
commercial
sites,
businesses
Increased emission from aircraft
through fuel combustion that
could increase concentrations of
pollutants that could affect
human health (NO2, PM and
SO2) and emissions of aviation
fuel odour
Heathrow will provide Pre-Conditioned Air (PCA) for new aircraft stands, where there is a clear
business case and environmental benefit, given the intended occupancy of the stand.
Residential
properties,
schools,
medical
facilities
Increased emissions from
vehicles on highways that may
increase concentrations of
pollutants and thereby have an
effect on human health (NO2 and
PM)
The design includes an improved airside road system with few taxiway crossings and vehicle
conflict points, to reduce journey times and associated emissions.
Residential
properties,
schools,
medical
facilities
Increased combustion emissions
from GSE as a result of
increased air traffic movements
that could increase
concentrations of pollutants
having an effect on human health
(NO2 and PM)
Heathrow will provide infrastructure to facilitate the use of low emission airside equipment, such as
electric vehicles. This includes for example, the provision of charging points within GSE
compounds.
Residential
properties,
schools,
medical
facilities
Increased emissions from
vehicles on public highways that
may increase concentrations of
pollutants and thereby have an
effect on human health (NO2 and
PM)
Heathrow will provide infrastructure for charging electric and hybrid vehicles in consolidated car
park areas, to support the use of Ultra Low Emission Vehicles (ULEV).
Residential Increased combustion emissions Heathrow will develop and implement an ultra-low emissions zone for airside vehicles by 2025, to
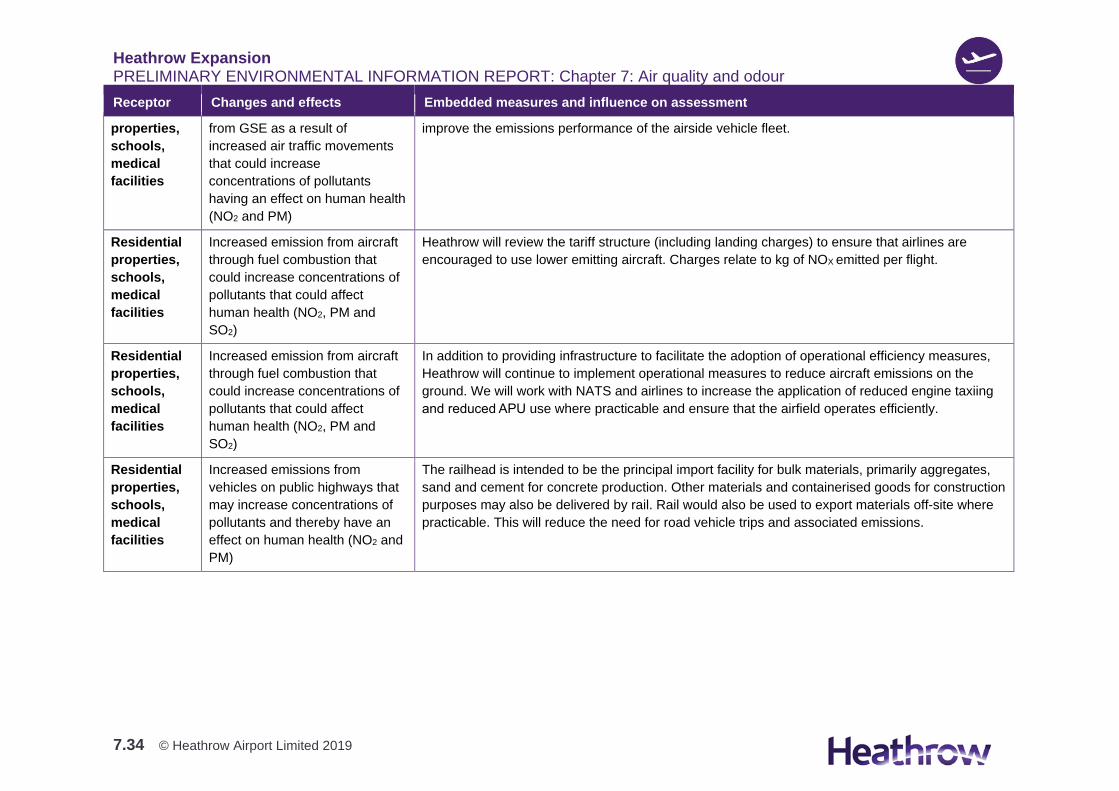
Heathrow Expansion PRELIMINARY ENVIRONMENTAL INFORMATION REPORT: Chapter 7: Air quality and odour
7.34 © Heathrow Airport Limited 2019
Receptor Changes and effects Embedded measures and influence on assessment
properties,
schools,
medical
facilities
from GSE as a result of
increased air traffic movements
that could increase
concentrations of pollutants
having an effect on human health
(NO2 and PM)
improve the emissions performance of the airside vehicle fleet.
Residential
properties,
schools,
medical
facilities
Increased emission from aircraft
through fuel combustion that
could increase concentrations of
pollutants that could affect
human health (NO2, PM and
SO2)
Heathrow will review the tariff structure (including landing charges) to ensure that airlines are
encouraged to use lower emitting aircraft. Charges relate to kg of NOX emitted per flight.
Residential
properties,
schools,
medical
facilities
Increased emission from aircraft
through fuel combustion that
could increase concentrations of
pollutants that could affect
human health (NO2, PM and
SO2)
In addition to providing infrastructure to facilitate the adoption of operational efficiency measures,
Heathrow will continue to implement operational measures to reduce aircraft emissions on the
ground. We will work with NATS and airlines to increase the application of reduced engine taxiing
and reduced APU use where practicable and ensure that the airfield operates efficiently.
Residential
properties,
schools,
medical
facilities
Increased emissions from
vehicles on public highways that
may increase concentrations of
pollutants and thereby have an
effect on human health (NO2 and
PM)
The railhead is intended to be the principal import facility for bulk materials, primarily aggregates,
sand and cement for concrete production. Other materials and containerised goods for construction
purposes may also be delivered by rail. Rail would also be used to export materials off-site where
practicable. This will reduce the need for road vehicle trips and associated emissions.
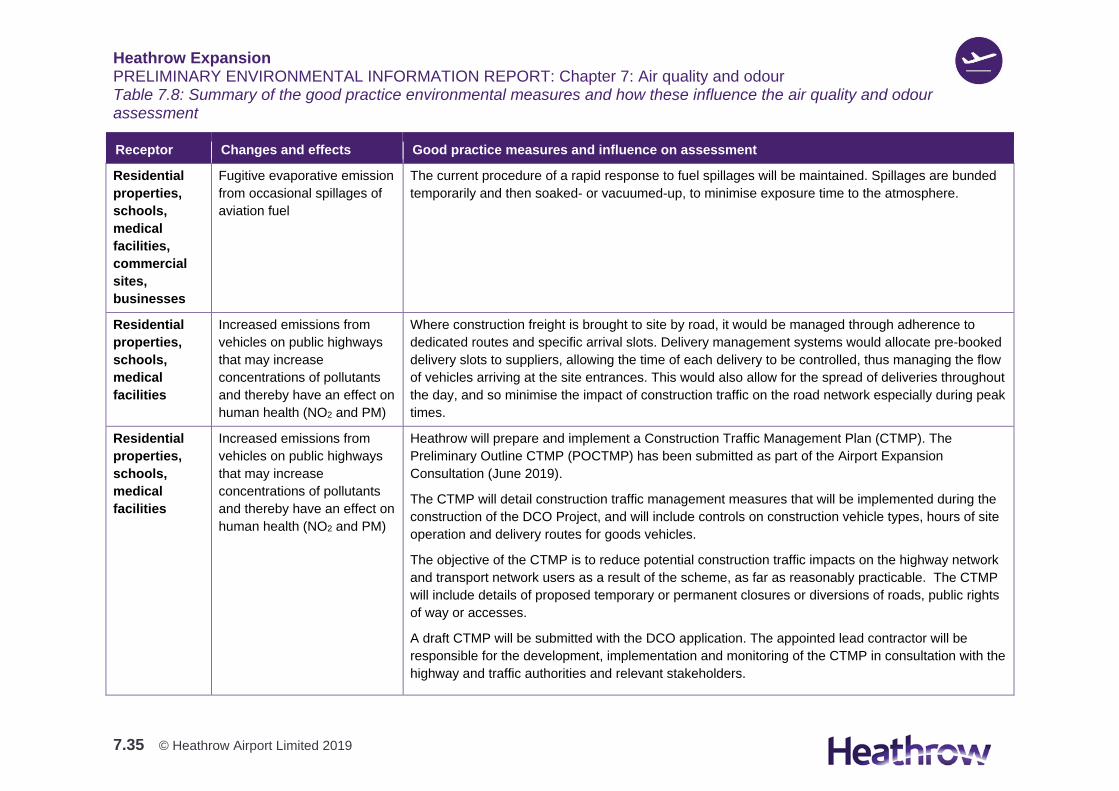
Heathrow Expansion PRELIMINARY ENVIRONMENTAL INFORMATION REPORT: Chapter 7: Air quality and odour
7.35 © Heathrow Airport Limited 2019
Table 7.8: Summary of the good practice environmental measures and how these influence the air quality and odour assessment
Receptor Changes and effects Good practice measures and influence on assessment
Residential
properties,
schools,
medical
facilities,
commercial
sites,
businesses
Fugitive evaporative emission
from occasional spillages of
aviation fuel
The current procedure of a rapid response to fuel spillages will be maintained. Spillages are bunded
temporarily and then soaked- or vacuumed-up, to minimise exposure time to the atmosphere.
Residential
properties,
schools,
medical
facilities
Increased emissions from
vehicles on public highways
that may increase
concentrations of pollutants
and thereby have an effect on
human health (NO2 and PM)
Where construction freight is brought to site by road, it would be managed through adherence to
dedicated routes and specific arrival slots. Delivery management systems would allocate pre-booked
delivery slots to suppliers, allowing the time of each delivery to be controlled, thus managing the flow
of vehicles arriving at the site entrances. This would also allow for the spread of deliveries throughout
the day, and so minimise the impact of construction traffic on the road network especially during peak
times.
Residential
properties,
schools,
medical
facilities
Increased emissions from
vehicles on public highways
that may increase
concentrations of pollutants
and thereby have an effect on
human health (NO2 and PM)
Heathrow will prepare and implement a Construction Traffic Management Plan (CTMP). The
Preliminary Outline CTMP (POCTMP) has been submitted as part of the Airport Expansion
Consultation (June 2019).
The CTMP will detail construction traffic management measures that will be implemented during the
construction of the DCO Project, and will include controls on construction vehicle types, hours of site
operation and delivery routes for goods vehicles.
The objective of the CTMP is to reduce potential construction traffic impacts on the highway network
and transport network users as a result of the scheme, as far as reasonably practicable. The CTMP
will include details of proposed temporary or permanent closures or diversions of roads, public rights
of way or accesses.
A draft CTMP will be submitted with the DCO application. The appointed lead contractor will be
responsible for the development, implementation and monitoring of the CTMP in consultation with the
highway and traffic authorities and relevant stakeholders.
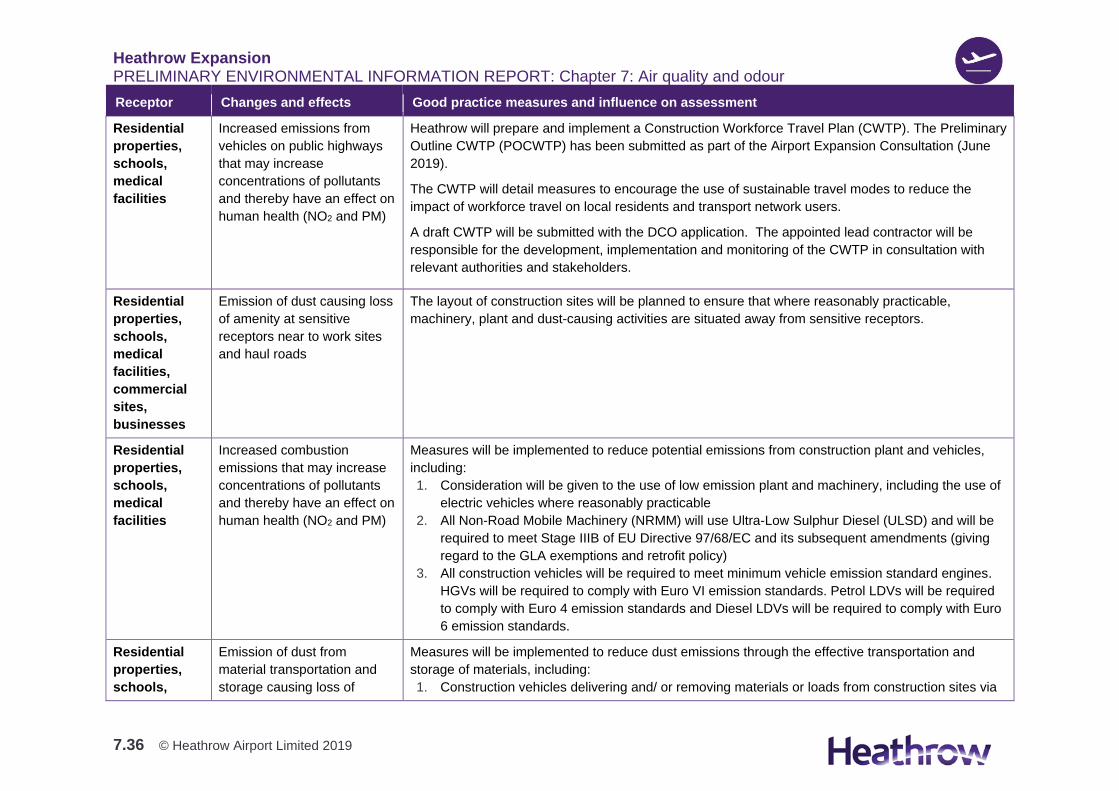
Heathrow Expansion PRELIMINARY ENVIRONMENTAL INFORMATION REPORT: Chapter 7: Air quality and odour
7.36 © Heathrow Airport Limited 2019
Receptor Changes and effects Good practice measures and influence on assessment
Residential
properties,
schools,
medical
facilities
Increased emissions from
vehicles on public highways
that may increase
concentrations of pollutants
and thereby have an effect on
human health (NO2 and PM)
Heathrow will prepare and implement a Construction Workforce Travel Plan (CWTP). The Preliminary
Outline CWTP (POCWTP) has been submitted as part of the Airport Expansion Consultation (June
2019).
The CWTP will detail measures to encourage the use of sustainable travel modes to reduce the
impact of workforce travel on local residents and transport network users.
A draft CWTP will be submitted with the DCO application. The appointed lead contractor will be
responsible for the development, implementation and monitoring of the CWTP in consultation with
relevant authorities and stakeholders.
Residential
properties,
schools,
medical
facilities,
commercial
sites,
businesses
Emission of dust causing loss
of amenity at sensitive
receptors near to work sites
and haul roads
The layout of construction sites will be planned to ensure that where reasonably practicable,
machinery, plant and dust-causing activities are situated away from sensitive receptors.
Residential
properties,
schools,
medical
facilities
Increased combustion
emissions that may increase
concentrations of pollutants
and thereby have an effect on
human health (NO2 and PM)
Measures will be implemented to reduce potential emissions from construction plant and vehicles,
including:
1. Consideration will be given to the use of low emission plant and machinery, including the use of
electric vehicles where reasonably practicable
2. All Non-Road Mobile Machinery (NRMM) will use Ultra-Low Sulphur Diesel (ULSD) and will be
required to meet Stage IIIB of EU Directive 97/68/EC and its subsequent amendments (giving
regard to the GLA exemptions and retrofit policy)
3. All construction vehicles will be required to meet minimum vehicle emission standard engines.
HGVs will be required to comply with Euro VI emission standards. Petrol LDVs will be required
to comply with Euro 4 emission standards and Diesel LDVs will be required to comply with Euro
6 emission standards.
Residential
properties,
schools,
Emission of dust from
material transportation and
storage causing loss of
Measures will be implemented to reduce dust emissions through the effective transportation and
storage of materials, including:
1. Construction vehicles delivering and/ or removing materials or loads from construction sites via
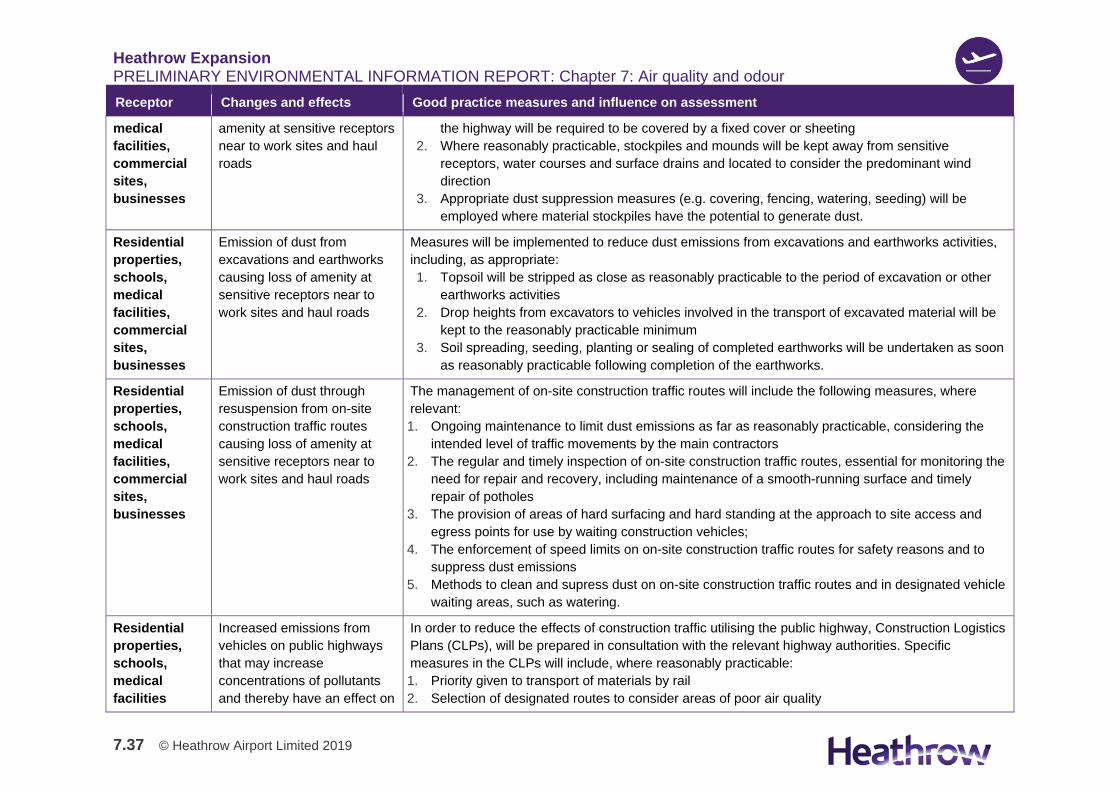
Heathrow Expansion PRELIMINARY ENVIRONMENTAL INFORMATION REPORT: Chapter 7: Air quality and odour
7.37 © Heathrow Airport Limited 2019
Receptor Changes and effects Good practice measures and influence on assessment
medical
facilities,
commercial
sites,
businesses
amenity at sensitive receptors
near to work sites and haul
roads
the highway will be required to be covered by a fixed cover or sheeting
2. Where reasonably practicable, stockpiles and mounds will be kept away from sensitive
receptors, water courses and surface drains and located to consider the predominant wind
direction
3. Appropriate dust suppression measures (e.g. covering, fencing, watering, seeding) will be
employed where material stockpiles have the potential to generate dust.
Residential
properties,
schools,
medical
facilities,
commercial
sites,
businesses
Emission of dust from
excavations and earthworks
causing loss of amenity at
sensitive receptors near to
work sites and haul roads
Measures will be implemented to reduce dust emissions from excavations and earthworks activities,
including, as appropriate:
1. Topsoil will be stripped as close as reasonably practicable to the period of excavation or other
earthworks activities
2. Drop heights from excavators to vehicles involved in the transport of excavated material will be
kept to the reasonably practicable minimum
3. Soil spreading, seeding, planting or sealing of completed earthworks will be undertaken as soon
as reasonably practicable following completion of the earthworks.
Residential
properties,
schools,
medical
facilities,
commercial
sites,
businesses
Emission of dust through
resuspension from on-site
construction traffic routes
causing loss of amenity at
sensitive receptors near to
work sites and haul roads
The management of on-site construction traffic routes will include the following measures, where
relevant:
1. Ongoing maintenance to limit dust emissions as far as reasonably practicable, considering the
intended level of traffic movements by the main contractors
2. The regular and timely inspection of on-site construction traffic routes, essential for monitoring the
need for repair and recovery, including maintenance of a smooth-running surface and timely
repair of potholes
3. The provision of areas of hard surfacing and hard standing at the approach to site access and
egress points for use by waiting construction vehicles;
4. The enforcement of speed limits on on-site construction traffic routes for safety reasons and to
suppress dust emissions
5. Methods to clean and supress dust on on-site construction traffic routes and in designated vehicle
waiting areas, such as watering.
Residential
properties,
schools,
medical
facilities
Increased emissions from
vehicles on public highways
that may increase
concentrations of pollutants
and thereby have an effect on
In order to reduce the effects of construction traffic utilising the public highway, Construction Logistics
Plans (CLPs), will be prepared in consultation with the relevant highway authorities. Specific
measures in the CLPs will include, where reasonably practicable:
1. Priority given to transport of materials by rail
2. Selection of designated routes to consider areas of poor air quality
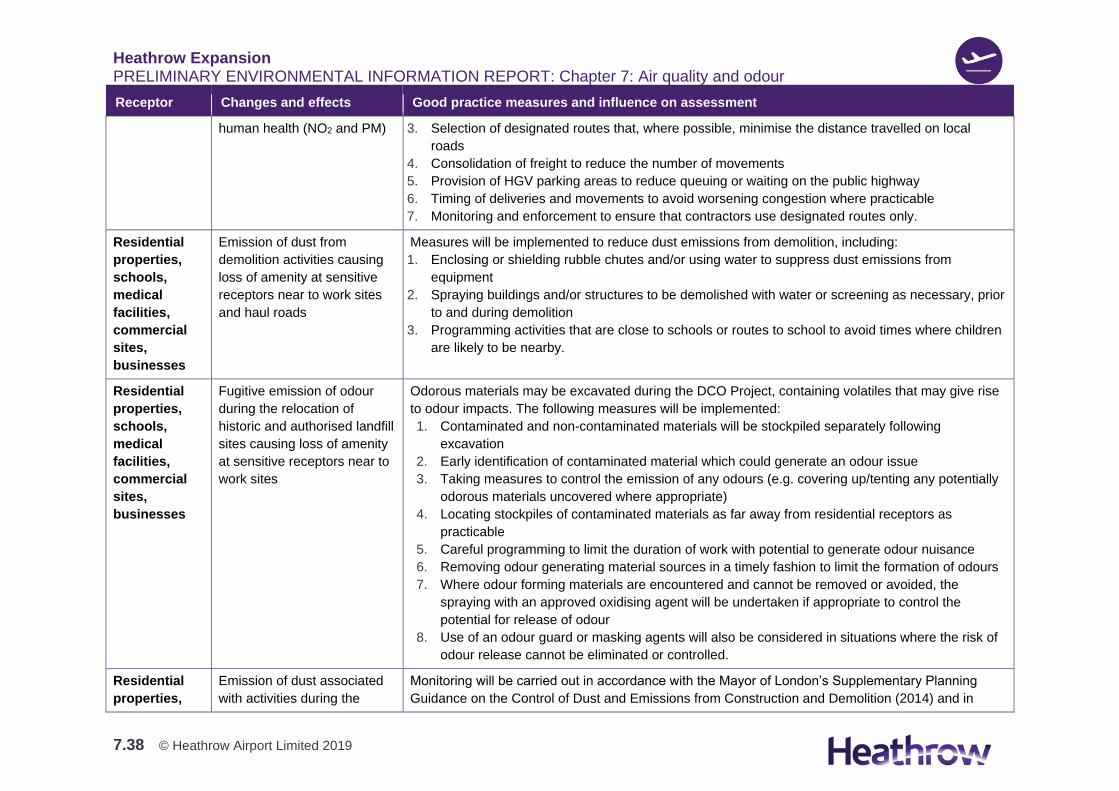
Heathrow Expansion PRELIMINARY ENVIRONMENTAL INFORMATION REPORT: Chapter 7: Air quality and odour
7.38 © Heathrow Airport Limited 2019
Receptor Changes and effects Good practice measures and influence on assessment
human health (NO2 and PM) 3. Selection of designated routes that, where possible, minimise the distance travelled on local
roads
4. Consolidation of freight to reduce the number of movements
5. Provision of HGV parking areas to reduce queuing or waiting on the public highway
6. Timing of deliveries and movements to avoid worsening congestion where practicable
7. Monitoring and enforcement to ensure that contractors use designated routes only.
Residential
properties,
schools,
medical
facilities,
commercial
sites,
businesses
Emission of dust from
demolition activities causing
loss of amenity at sensitive
receptors near to work sites
and haul roads
Measures will be implemented to reduce dust emissions from demolition, including:
1. Enclosing or shielding rubble chutes and/or using water to suppress dust emissions from
equipment
2. Spraying buildings and/or structures to be demolished with water or screening as necessary, prior
to and during demolition
3. Programming activities that are close to schools or routes to school to avoid times where children
are likely to be nearby.
Residential
properties,
schools,
medical
facilities,
commercial
sites,
businesses
Fugitive emission of odour
during the relocation of
historic and authorised landfill
sites causing loss of amenity
at sensitive receptors near to
work sites
Odorous materials may be excavated during the DCO Project, containing volatiles that may give rise
to odour impacts. The following measures will be implemented:
1. Contaminated and non-contaminated materials will be stockpiled separately following
excavation
2. Early identification of contaminated material which could generate an odour issue
3. Taking measures to control the emission of any odours (e.g. covering up/tenting any potentially
odorous materials uncovered where appropriate)
4. Locating stockpiles of contaminated materials as far away from residential receptors as
practicable
5. Careful programming to limit the duration of work with potential to generate odour nuisance
6. Removing odour generating material sources in a timely fashion to limit the formation of odours
7. Where odour forming materials are encountered and cannot be removed or avoided, the
spraying with an approved oxidising agent will be undertaken if appropriate to control the
potential for release of odour
8. Use of an odour guard or masking agents will also be considered in situations where the risk of
odour release cannot be eliminated or controlled.
Residential
properties,
Emission of dust associated
with activities during the
Monitoring will be carried out in accordance with the Mayor of London’s Supplementary Planning
Guidance on the Control of Dust and Emissions from Construction and Demolition (2014) and in
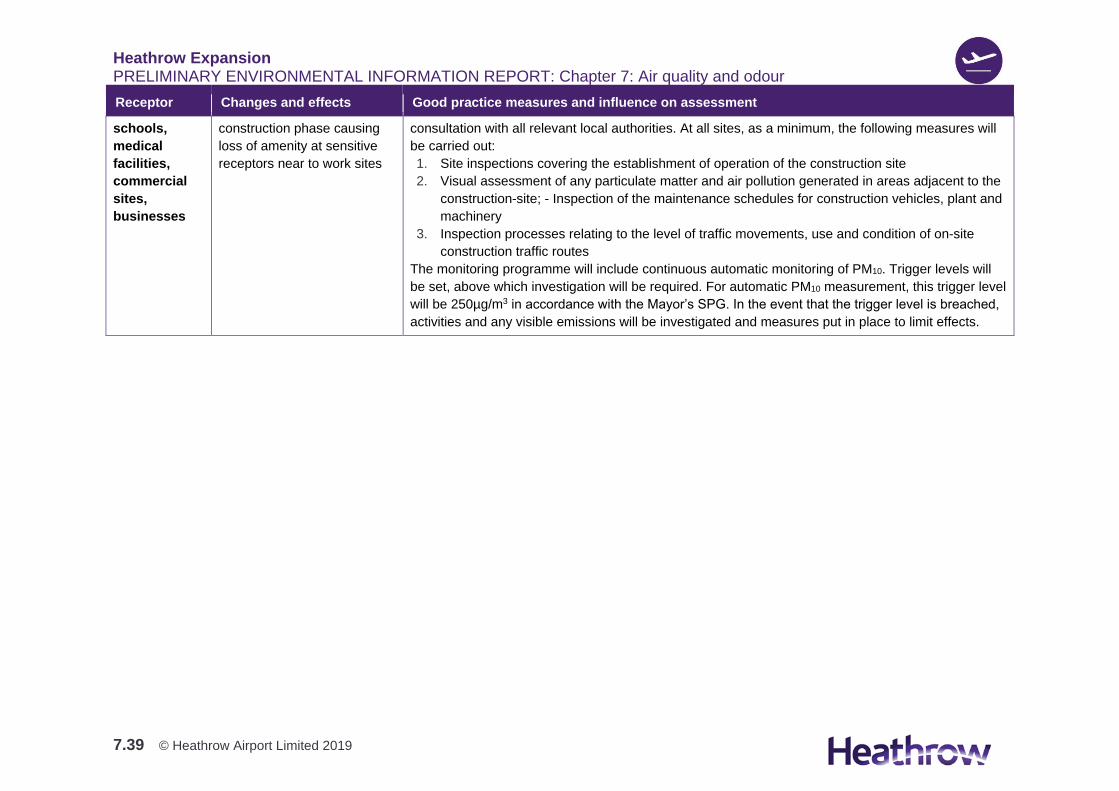
Heathrow Expansion PRELIMINARY ENVIRONMENTAL INFORMATION REPORT: Chapter 7: Air quality and odour
7.39 © Heathrow Airport Limited 2019
Receptor Changes and effects Good practice measures and influence on assessment
schools,
medical
facilities,
commercial
sites,
businesses
construction phase causing
loss of amenity at sensitive
receptors near to work sites
consultation with all relevant local authorities. At all sites, as a minimum, the following measures will
be carried out:
1. Site inspections covering the establishment of operation of the construction site
2. Visual assessment of any particulate matter and air pollution generated in areas adjacent to the
construction-site; - Inspection of the maintenance schedules for construction vehicles, plant and
machinery
3. Inspection processes relating to the level of traffic movements, use and condition of on-site
construction traffic routes
The monitoring programme will include continuous automatic monitoring of PM10. Trigger levels will
be set, above which investigation will be required. For automatic PM10 measurement, this trigger level
will be 250µg/m3 in accordance with the Mayor’s SPG. In the event that the trigger level is breached,
activities and any visible emissions will be investigated and measures put in place to limit effects.
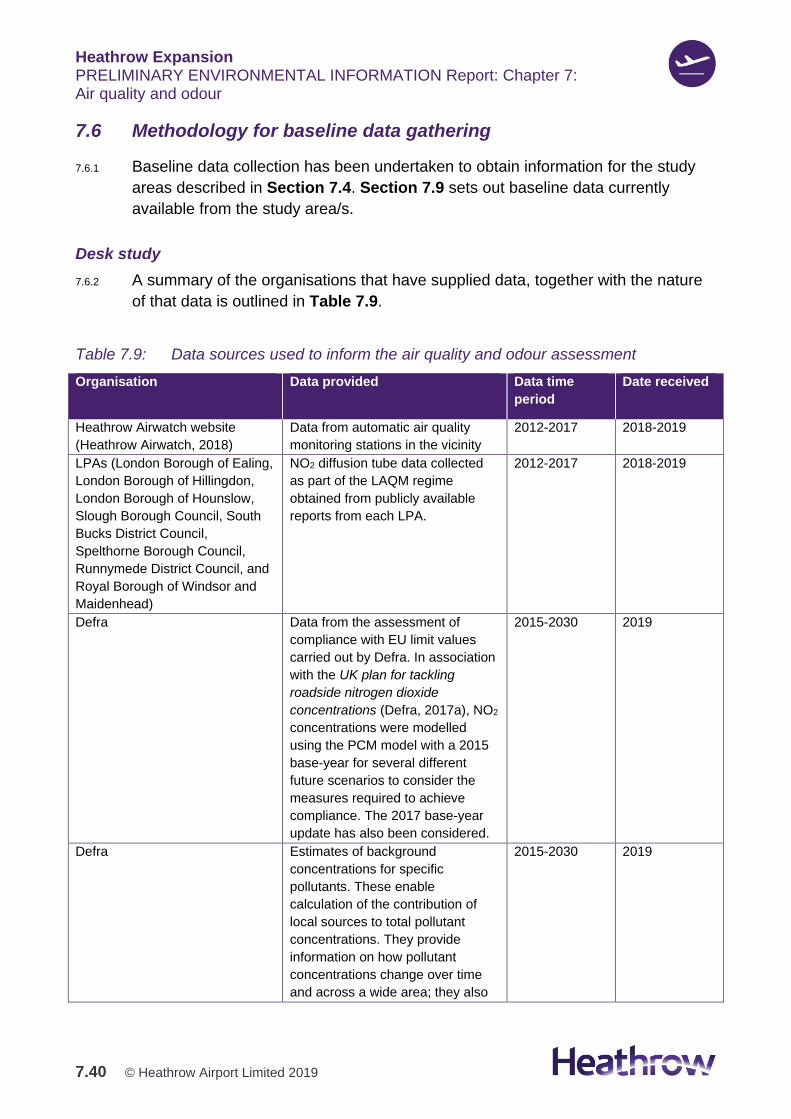
Heathrow Expansion PRELIMINARY ENVIRONMENTAL INFORMATION Report: Chapter 7: Air quality and odour
7.40 © Heathrow Airport Limited 2019
7.6 Methodology for baseline data gathering
7.6.1 Baseline data collection has been undertaken to obtain information for the study
areas described in Section 7.4. Section 7.9 sets out baseline data currently
available from the study area/s.
Desk study
7.6.2 A summary of the organisations that have supplied data, together with the nature
of that data is outlined in Table 7.9.
Table 7.9: Data sources used to inform the air quality and odour assessment
Organisation Data provided Data time
period
Date received
Heathrow Airwatch website
(Heathrow Airwatch, 2018)
Data from automatic air quality
monitoring stations in the vicinity
2012-2017 2018-2019
LPAs (London Borough of Ealing,
London Borough of Hillingdon,
London Borough of Hounslow,
Slough Borough Council, South
Bucks District Council,
Spelthorne Borough Council,
Runnymede District Council, and
Royal Borough of Windsor and
Maidenhead)
NO2 diffusion tube data collected
as part of the LAQM regime
obtained from publicly available
reports from each LPA.
2012-2017 2018-2019
Defra Data from the assessment of
compliance with EU limit values
carried out by Defra. In association
with the UK plan for tackling
roadside nitrogen dioxide
concentrations (Defra, 2017a), NO2
concentrations were modelled
using the PCM model with a 2015
base-year for several different
future scenarios to consider the
measures required to achieve
compliance. The 2017 base-year
update has also been considered.
2015-2030 2019
Defra Estimates of background
concentrations for specific
pollutants. These enable
calculation of the contribution of
local sources to total pollutant
concentrations. They provide
information on how pollutant
concentrations change over time
and across a wide area; they also
2015-2030 2019
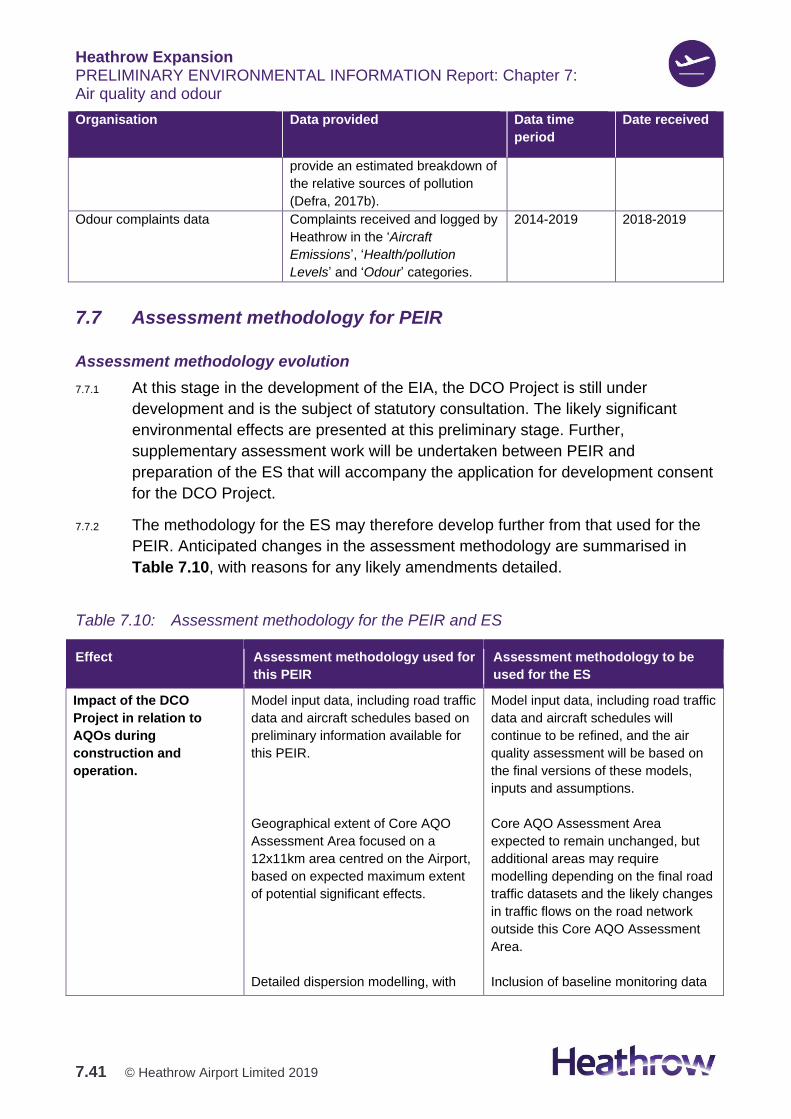
Heathrow Expansion PRELIMINARY ENVIRONMENTAL INFORMATION Report: Chapter 7: Air quality and odour
7.41 © Heathrow Airport Limited 2019
Organisation Data provided Data time
period
Date received
provide an estimated breakdown of
the relative sources of pollution
(Defra, 2017b).
Odour complaints data Complaints received and logged by
Heathrow in the ‘Aircraft
Emissions’, ‘Health/pollution
Levels’ and ‘Odour’ categories.
2014-2019 2018-2019
7.7 Assessment methodology for PEIR
Assessment methodology evolution
7.7.1 At this stage in the development of the EIA, the DCO Project is still under
development and is the subject of statutory consultation. The likely significant
environmental effects are presented at this preliminary stage. Further,
supplementary assessment work will be undertaken between PEIR and
preparation of the ES that will accompany the application for development consent
for the DCO Project.
7.7.2 The methodology for the ES may therefore develop further from that used for the
PEIR. Anticipated changes in the assessment methodology are summarised in
Table 7.10, with reasons for any likely amendments detailed.
Table 7.10: Assessment methodology for the PEIR and ES
Effect Assessment methodology used for
this PEIR
Assessment methodology to be
used for the ES
Impact of the DCO
Project in relation to
AQOs during
construction and
operation.
Model input data, including road traffic
data and aircraft schedules based on
preliminary information available for
this PEIR.
Geographical extent of Core AQO
Assessment Area focused on a
12x11km area centred on the Airport,
based on expected maximum extent
of potential significant effects.
Detailed dispersion modelling, with
Model input data, including road traffic
data and aircraft schedules will
continue to be refined, and the air
quality assessment will be based on
the final versions of these models,
inputs and assumptions.
Core AQO Assessment Area
expected to remain unchanged, but
additional areas may require
modelling depending on the final road
traffic datasets and the likely changes
in traffic flows on the road network
outside this Core AQO Assessment
Area.
Inclusion of baseline monitoring data
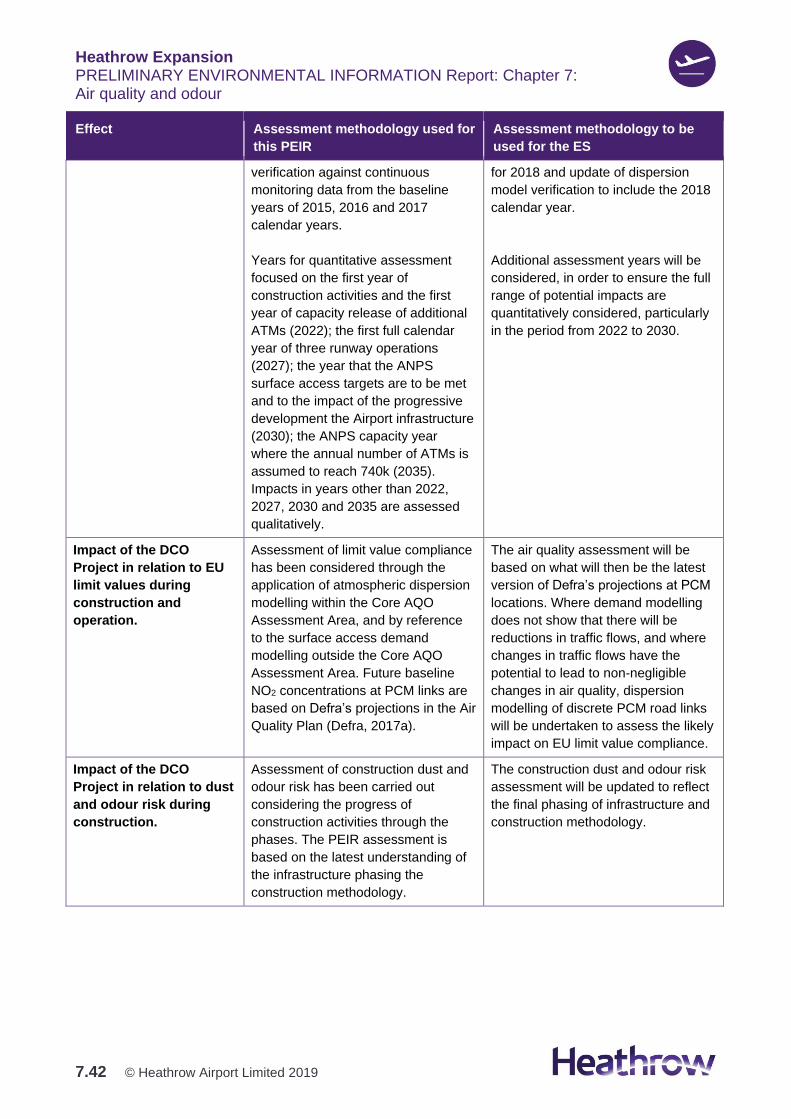
Heathrow Expansion PRELIMINARY ENVIRONMENTAL INFORMATION Report: Chapter 7: Air quality and odour
7.42 © Heathrow Airport Limited 2019
Effect Assessment methodology used for
this PEIR
Assessment methodology to be
used for the ES
verification against continuous
monitoring data from the baseline
years of 2015, 2016 and 2017
calendar years.
Years for quantitative assessment
focused on the first year of
construction activities and the first
year of capacity release of additional
ATMs (2022); the first full calendar
year of three runway operations
(2027); the year that the ANPS
surface access targets are to be met
and to the impact of the progressive
development the Airport infrastructure
(2030); the ANPS capacity year
where the annual number of ATMs is
assumed to reach 740k (2035).
Impacts in years other than 2022,
2027, 2030 and 2035 are assessed
qualitatively.
for 2018 and update of dispersion
model verification to include the 2018
calendar year.
Additional assessment years will be
considered, in order to ensure the full
range of potential impacts are
quantitatively considered, particularly
in the period from 2022 to 2030.
Impact of the DCO
Project in relation to EU
limit values during
construction and
operation.
Assessment of limit value compliance
has been considered through the
application of atmospheric dispersion
modelling within the Core AQO
Assessment Area, and by reference
to the surface access demand
modelling outside the Core AQO
Assessment Area. Future baseline
NO2 concentrations at PCM links are
based on Defra’s projections in the Air
Quality Plan (Defra, 2017a).
The air quality assessment will be
based on what will then be the latest
version of Defra’s projections at PCM
locations. Where demand modelling
does not show that there will be
reductions in traffic flows, and where
changes in traffic flows have the
potential to lead to non-negligible
changes in air quality, dispersion
modelling of discrete PCM road links
will be undertaken to assess the likely
impact on EU limit value compliance.
Impact of the DCO
Project in relation to dust
and odour risk during
construction.
Assessment of construction dust and
odour risk has been carried out
considering the progress of
construction activities through the
phases. The PEIR assessment is
based on the latest understanding of
the infrastructure phasing the
construction methodology.
The construction dust and odour risk
assessment will be updated to reflect
the final phasing of infrastructure and
construction methodology.
Heathrow Expansion PRELIMINARY ENVIRONMENTAL INFORMATION Report: Chapter 7: Air quality and odour
7.43 © Heathrow Airport Limited 2019
Construction assessment methodology
Demolition and construction dust
Overview
7.7.3 The GLA (2014) and the IAQM (2014) have developed guidance regarding the
assessment of the effects of construction on air quality and the determination of
their significance, which have been used to assess construction effects. The
significance of construction effects is assessed by considering the risk of
annoyance due to dust soiling as well as the risk of health effects due to any
significant increases to PM10 or PM2.5.
7.7.4 In the absence of suitable control measures, construction activities can result in
regular and persistent dust emissions, which may affect local amenity and quality
of life. The level of concern amongst local communities, and potential for
annoyance, is related to the existing baseline dust levels, the number and
proximity of residential areas to the site, and the exact nature of the activities
on-site. The degree of actual annoyance would also depend on factors such as the
rate of dust deposition, and the application of environmental measures on site.
7.7.5 Dust complaints are usually associated with periods of peak deposition, occurring
during particular weather conditions. There is a ‘normal’ level of dust deposition in
every community and it is only when the rate of deposition is high relative to the
norm that complaints tend to occur. The guidance sets out the factors influencing
annoyance, which includes the effects of dust on a community. The risk of
demolition and construction activities causing exceedance of PM10 AQOs is also
considered.
7.7.6 Site activities have been divided into four types to reflect their different potential
effects:
1. Demolition – an activity involved with the removal of an existing structure or
structures
2. Earthworks – the processes of soil-stripping, ground-levelling, excavation and
landscaping
3. Construction – an activity involved in the provision of a new structure
4. Vehicle movements – which can cause trackout (the transport of dust and dirt
from the site onto the public road network). This arises when lorries leave site
with dusty materials or transfer dust and dirt onto the road having travelled over
muddy ground on-site.
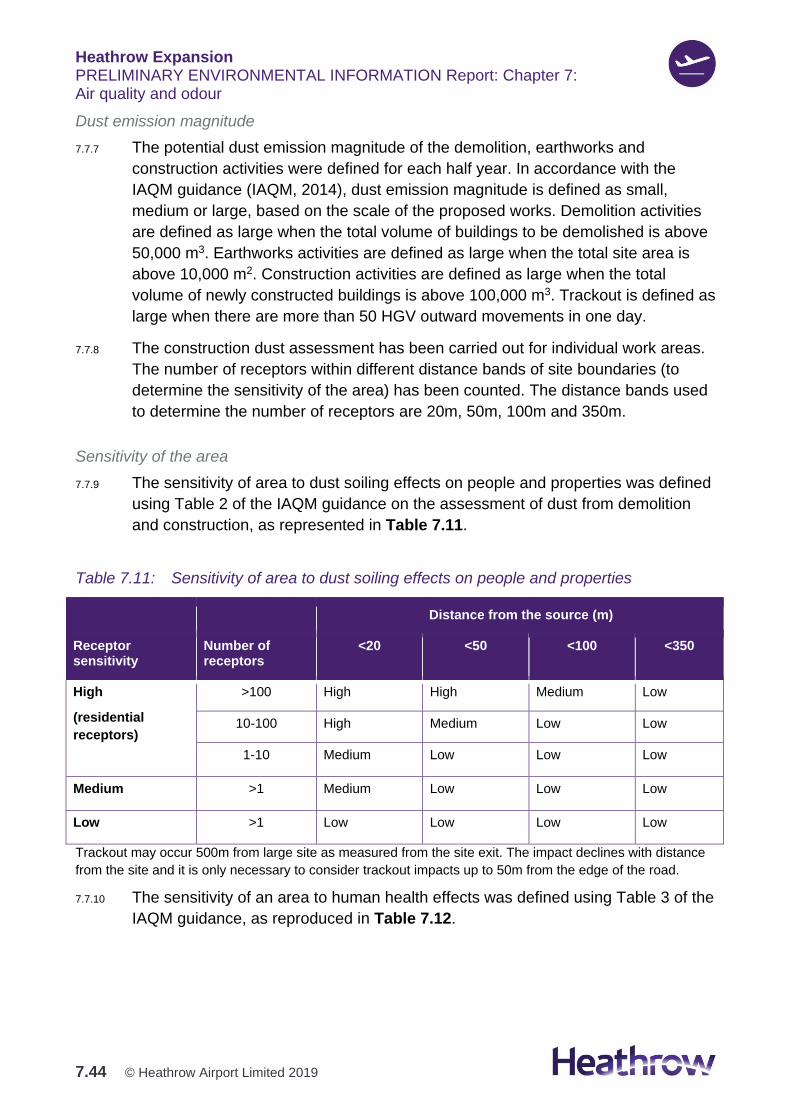
Heathrow Expansion PRELIMINARY ENVIRONMENTAL INFORMATION Report: Chapter 7: Air quality and odour
7.44 © Heathrow Airport Limited 2019
Dust emission magnitude
7.7.7 The potential dust emission magnitude of the demolition, earthworks and
construction activities were defined for each half year. In accordance with the
IAQM guidance (IAQM, 2014), dust emission magnitude is defined as small,
medium or large, based on the scale of the proposed works. Demolition activities
are defined as large when the total volume of buildings to be demolished is above
50,000 m3. Earthworks activities are defined as large when the total site area is
above 10,000 m2. Construction activities are defined as large when the total
volume of newly constructed buildings is above 100,000 m3. Trackout is defined as
large when there are more than 50 HGV outward movements in one day.
7.7.8 The construction dust assessment has been carried out for individual work areas.
The number of receptors within different distance bands of site boundaries (to
determine the sensitivity of the area) has been counted. The distance bands used
to determine the number of receptors are 20m, 50m, 100m and 350m.
Sensitivity of the area
7.7.9 The sensitivity of area to dust soiling effects on people and properties was defined
using Table 2 of the IAQM guidance on the assessment of dust from demolition
and construction, as represented in Table 7.11.
Table 7.11: Sensitivity of area to dust soiling effects on people and properties
Distance from the source (m)
Receptor sensitivity
Number of receptors
<20 <50 <100 <350
High
(residential
receptors)
>100 High High Medium Low
10-100 High Medium Low Low
1-10 Medium Low Low Low
Medium >1 Medium Low Low Low
Low >1 Low Low Low Low
Trackout may occur 500m from large site as measured from the site exit. The impact declines with distance
from the site and it is only necessary to consider trackout impacts up to 50m from the edge of the road.
7.7.10 The sensitivity of an area to human health effects was defined using Table 3 of the
IAQM guidance, as reproduced in Table 7.12.
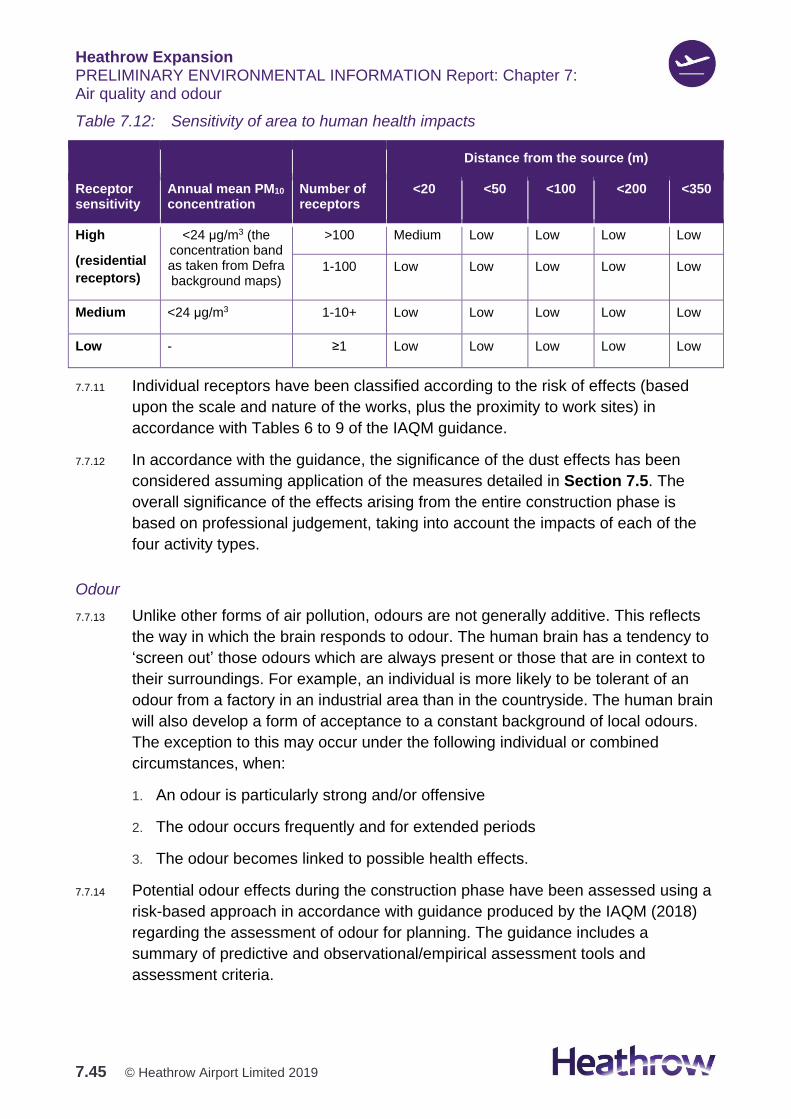
Heathrow Expansion PRELIMINARY ENVIRONMENTAL INFORMATION Report: Chapter 7: Air quality and odour
7.45 © Heathrow Airport Limited 2019
Table 7.12: Sensitivity of area to human health impacts
Distance from the source (m)
Receptor sensitivity
Annual mean PM10 concentration
Number of receptors
<20 <50 <100 <200 <350
High
(residential
receptors)
<24 μg/m3 (the concentration band as taken from Defra background maps)
>100 Medium Low Low Low Low
1-100 Low Low Low Low Low
Medium <24 μg/m3 1-10+ Low Low Low Low Low
Low - ≥1 Low Low Low Low Low
7.7.11 Individual receptors have been classified according to the risk of effects (based
upon the scale and nature of the works, plus the proximity to work sites) in
accordance with Tables 6 to 9 of the IAQM guidance.
7.7.12 In accordance with the guidance, the significance of the dust effects has been
considered assuming application of the measures detailed in Section 7.5. The
overall significance of the effects arising from the entire construction phase is
based on professional judgement, taking into account the impacts of each of the
four activity types.
Odour
7.7.13 Unlike other forms of air pollution, odours are not generally additive. This reflects
the way in which the brain responds to odour. The human brain has a tendency to
‘screen out’ those odours which are always present or those that are in context to
their surroundings. For example, an individual is more likely to be tolerant of an
odour from a factory in an industrial area than in the countryside. The human brain
will also develop a form of acceptance to a constant background of local odours.
The exception to this may occur under the following individual or combined
circumstances, when:
1. An odour is particularly strong and/or offensive
2. The odour occurs frequently and for extended periods
3. The odour becomes linked to possible health effects.
7.7.14 Potential odour effects during the construction phase have been assessed using a
risk-based approach in accordance with guidance produced by the IAQM (2018)
regarding the assessment of odour for planning. The guidance includes a
summary of predictive and observational/empirical assessment tools and
assessment criteria.
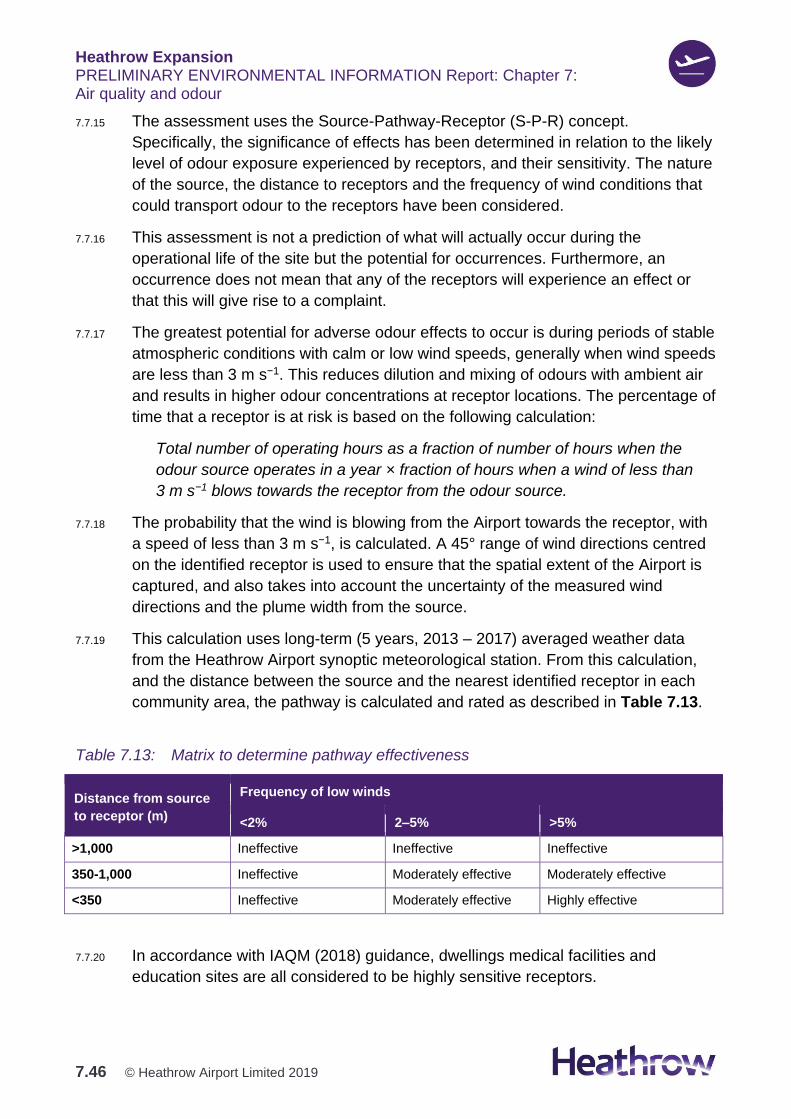
Heathrow Expansion PRELIMINARY ENVIRONMENTAL INFORMATION Report: Chapter 7: Air quality and odour
7.46 © Heathrow Airport Limited 2019
7.7.15 The assessment uses the Source-Pathway-Receptor (S-P-R) concept.
Specifically, the significance of effects has been determined in relation to the likely
level of odour exposure experienced by receptors, and their sensitivity. The nature
of the source, the distance to receptors and the frequency of wind conditions that
could transport odour to the receptors have been considered.
7.7.16 This assessment is not a prediction of what will actually occur during the
operational life of the site but the potential for occurrences. Furthermore, an
occurrence does not mean that any of the receptors will experience an effect or
that this will give rise to a complaint.
7.7.17 The greatest potential for adverse odour effects to occur is during periods of stable
atmospheric conditions with calm or low wind speeds, generally when wind speeds
are less than 3 m s−1. This reduces dilution and mixing of odours with ambient air
and results in higher odour concentrations at receptor locations. The percentage of
time that a receptor is at risk is based on the following calculation:
Total number of operating hours as a fraction of number of hours when the
odour source operates in a year × fraction of hours when a wind of less than
3 m s−1 blows towards the receptor from the odour source.
7.7.18 The probability that the wind is blowing from the Airport towards the receptor, with
a speed of less than 3 m s−1, is calculated. A 45° range of wind directions centred
on the identified receptor is used to ensure that the spatial extent of the Airport is
captured, and also takes into account the uncertainty of the measured wind
directions and the plume width from the source.
7.7.19 This calculation uses long-term (5 years, 2013 – 2017) averaged weather data
from the Heathrow Airport synoptic meteorological station. From this calculation,
and the distance between the source and the nearest identified receptor in each
community area, the pathway is calculated and rated as described in Table 7.13.
Table 7.13: Matrix to determine pathway effectiveness
Distance from source
to receptor (m)
Frequency of low winds
<2% 2–5% >5%
>1,000 Ineffective Ineffective Ineffective
350-1,000 Ineffective Moderately effective Moderately effective
<350 Ineffective Moderately effective Highly effective
7.7.20 In accordance with IAQM (2018) guidance, dwellings medical facilities and
education sites are all considered to be highly sensitive receptors.
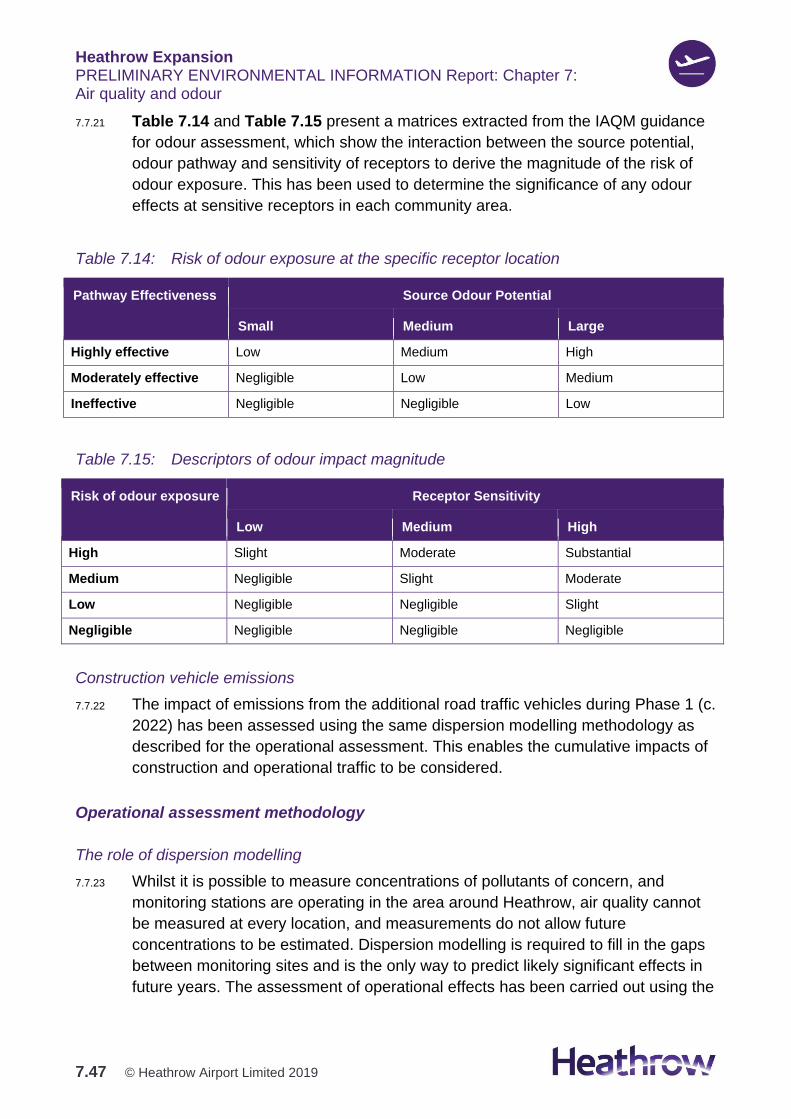
Heathrow Expansion PRELIMINARY ENVIRONMENTAL INFORMATION Report: Chapter 7: Air quality and odour
7.47 © Heathrow Airport Limited 2019
7.7.21 Table 7.14 and Table 7.15 present a matrices extracted from the IAQM guidance
for odour assessment, which show the interaction between the source potential,
odour pathway and sensitivity of receptors to derive the magnitude of the risk of
odour exposure. This has been used to determine the significance of any odour
effects at sensitive receptors in each community area.
Table 7.14: Risk of odour exposure at the specific receptor location
Pathway Effectiveness Source Odour Potential
Small Medium Large
Highly effective Low Medium High
Moderately effective Negligible Low Medium
Ineffective Negligible Negligible Low
Table 7.15: Descriptors of odour impact magnitude
Risk of odour exposure Receptor Sensitivity
Low Medium High
High Slight Moderate Substantial
Medium Negligible Slight Moderate
Low Negligible Negligible Slight
Negligible Negligible Negligible Negligible
Construction vehicle emissions
7.7.22 The impact of emissions from the additional road traffic vehicles during Phase 1 (c.
2022) has been assessed using the same dispersion modelling methodology as
described for the operational assessment. This enables the cumulative impacts of
construction and operational traffic to be considered.
Operational assessment methodology
The role of dispersion modelling
7.7.23 Whilst it is possible to measure concentrations of pollutants of concern, and
monitoring stations are operating in the area around Heathrow, air quality cannot
be measured at every location, and measurements do not allow future
concentrations to be estimated. Dispersion modelling is required to fill in the gaps
between monitoring sites and is the only way to predict likely significant effects in
future years. The assessment of operational effects has been carried out using the
Heathrow Expansion PRELIMINARY ENVIRONMENTAL INFORMATION Report: Chapter 7: Air quality and odour
7.48 © Heathrow Airport Limited 2019
Cambridge Environmental Research Consultants (CERC) ADMS-Airport (airport
sources), ADMS-Roads (road traffic emissions) and ADMS-5 (stationary
combustion sources) dispersion models. Dispersion modelling has the following
benefits:
1. It can fill in the spatial gaps between monitors, allowing air quality to be
assessed at all locations of interest
2. It makes it possible to see which sources are responsible for pollution and for
how much (‘source apportionment’)
3. It provides a basis for forecasting future air quality. Even for the future
baseline, there will be changes in the number and types of aircraft using the
Airport, for example. In addition, where there are proposals for changes to
airport infrastructure, such as a North West Runway, modelling is necessary to
understand the likely effects of such developments.
7.7.24 The assessment will largely follow the recommendations of PSDH (Department for
Transport, 2006), which is considered to be best practice in the assessment of air
quality around airports.
Detailed dispersion modelling
7.7.25 The detailed dispersion modelling process has included three key stages, which
are described further in Appendix 7.1.
1. For each modelled scenario, an emissions inventory has been developed to
calculate how much pollution is emitted from the different sources, based on
recorded activity levels and forecast future activity (including ATMs). In
addition, estimates have been included of the ‘background’ contribution in the
assessment year (i.e. the contribution from all sources not modelled explicitly).
Road traffic volume and speeds have been taken from the Heathrow Highway
Assignment and Surface Access Model (HHASAM). Road traffic emission
factors have been taken from the Defra EFT (version 8.0.1). NOX emissions
have also been calculated using the Calculator Using Realistic Emissions for
Diesels (CURED) sensitivity test which accounts for potential under-estimation
of emissions in the EFT from diesel vehicles from 2020
2. Detailed dispersion modelling has been used to calculate how the emissions
are carried through the air, due to meteorological conditions such as wind
speed and direction, to determine the concentrations of pollution in the air
3. These modelled concentrations have then been compared with the local
monitoring data in the model verification process as a check on the accuracy of
the model.
Heathrow Expansion PRELIMINARY ENVIRONMENTAL INFORMATION Report: Chapter 7: Air quality and odour
7.49 © Heathrow Airport Limited 2019
7.7.26 EFT version 9.0 (Defra, 2019a) was published in May 2019 during the production
of this chapter. It has not therefore been possible to incorporate the updated
emission factors in this assessment. The new version of the EFT utilises bespoke
vehicle fleet information and projections for London provided by TfL, taking
account of Ultra-Low Emission Zone (ULEZ) commencing in 2019. Average
pollutant emission rates in London therefore reduce more rapidly in the new
version of the EFT, and the results presented here are therefore considered to be
conservative. The latest available EFT will be used in the assessment reported in
the ES.
7.7.27 Annual mean concentrations of NOX, NO2, PM10, PM2.5 and SO2 have been
predicted. Shorter-period concentrations, which feature in some EU limit values
and AQOs, have been derived from annual mean values, using relationships that
have been recommended in technical guidance for LPA LAQM Review and
Assessment (Defra, 2016).
7.7.28 Concentrations have been calculated on a fine spatial grid throughout the Core
AQO Assessment Area. Concentrations have also been predicted at specific
receptor points within the Core AQO Assessment Area. This enables a more
detailed examination of concentration changes at particular sensitive receptor
locations. This set of receptors includes current monitoring sites close to the
Airport and other off-airport locations with relevant public exposure.
Tiered assessment of potential effects outside of the Core AQO Assessment Area
7.7.29 In order to determine potentially significant effects outside of the Core AQO
Assessment Area, which are related to the scale of changes in road traffic
associated with the DCO Project, a tiered approach to assessment has been used.
This approach has been used to determine discrete road links where changes in
road traffic could potentially lead to increases in pollution that cannot be
considered negligible / imperceptible, and that therefore require further
assessment using detailed dispersion modelling, in addition to that carried out for
the Core AQO Assessment Area. This assessment uses data from the HHASAM
Fully Modelled Area (FMA), defined as the geographic area of HHASAM in which
all trip movements are represented. The process of assessment is detailed in
Graphic 7.1.
7.7.30 Dispersion modelling has been used to determine an indicative relationship
between emissions and concentrations. NOX emission rates for each year have
been determined using the CURED tool (Air Quality Consultants, 2018). This has
been carried out using Outer London emission factors, and a speed of 20kph for
both LDVs and HDVs separately. The ADMS-Roads dispersion model has been
run with a unitary NOX emission rate (0.001g/s) to determine the resultant annual
mean NOX concentration at a receptor 4m from a 1km link (representative of a
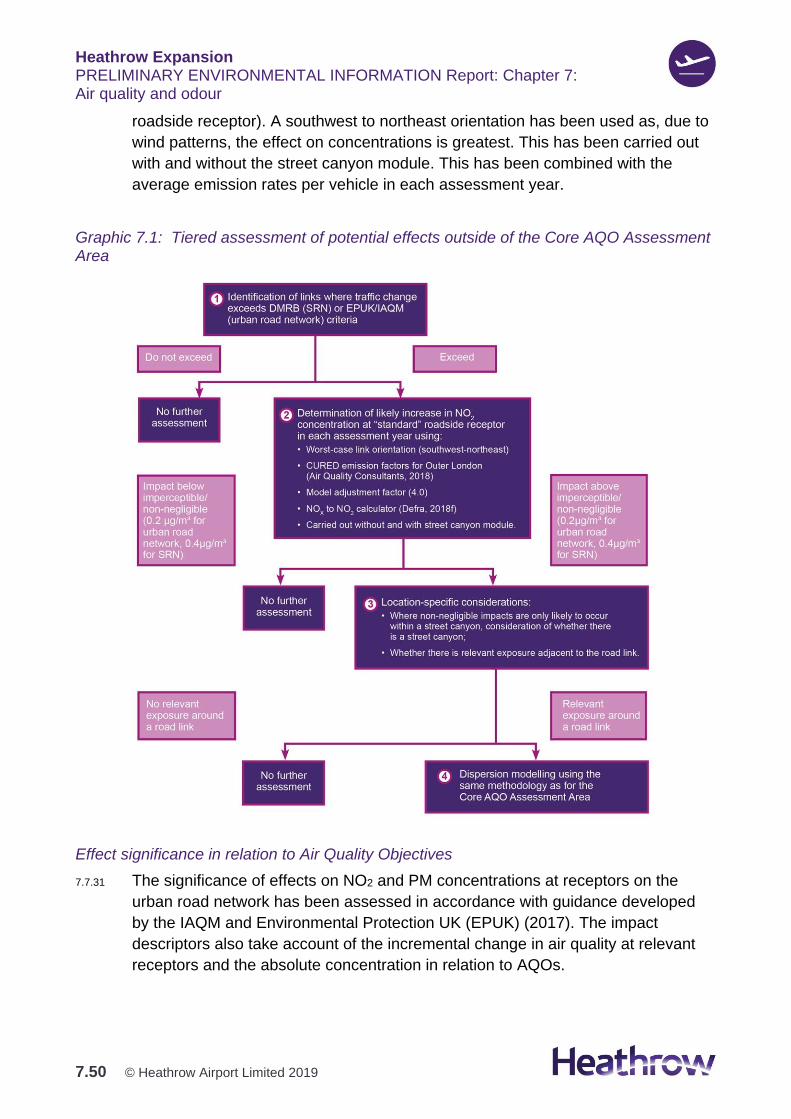
Heathrow Expansion PRELIMINARY ENVIRONMENTAL INFORMATION Report: Chapter 7: Air quality and odour
7.50 © Heathrow Airport Limited 2019
roadside receptor). A southwest to northeast orientation has been used as, due to
wind patterns, the effect on concentrations is greatest. This has been carried out
with and without the street canyon module. This has been combined with the
average emission rates per vehicle in each assessment year.
Graphic 7.1: Tiered assessment of potential effects outside of the Core AQO Assessment Area
Effect significance in relation to Air Quality Objectives
7.7.31 The significance of effects on NO2 and PM concentrations at receptors on the
urban road network has been assessed in accordance with guidance developed
by the IAQM and Environmental Protection UK (EPUK) (2017). The impact
descriptors also take account of the incremental change in air quality at relevant
receptors and the absolute concentration in relation to AQOs.
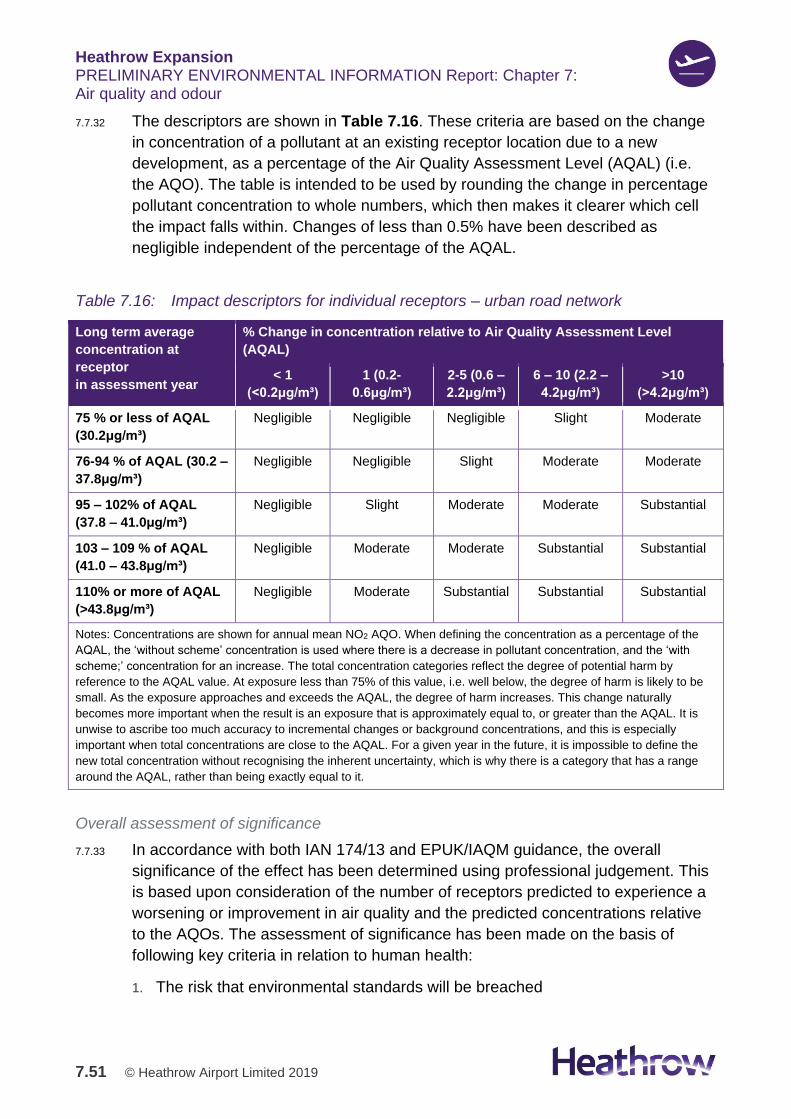
Heathrow Expansion PRELIMINARY ENVIRONMENTAL INFORMATION Report: Chapter 7: Air quality and odour
7.51 © Heathrow Airport Limited 2019
7.7.32 The descriptors are shown in Table 7.16. These criteria are based on the change
in concentration of a pollutant at an existing receptor location due to a new
development, as a percentage of the Air Quality Assessment Level (AQAL) (i.e.
the AQO). The table is intended to be used by rounding the change in percentage
pollutant concentration to whole numbers, which then makes it clearer which cell
the impact falls within. Changes of less than 0.5% have been described as
negligible independent of the percentage of the AQAL.
Table 7.16: Impact descriptors for individual receptors – urban road network
Long term average
concentration at
receptor
in assessment year
% Change in concentration relative to Air Quality Assessment Level
(AQAL)
< 1
(<0.2μg/m³)
1 (0.2-
0.6μg/m³)
2-5 (0.6 –
2.2μg/m³)
6 – 10 (2.2 –
4.2μg/m³)
>10
(>4.2μg/m³)
75 % or less of AQAL
(30.2μg/m³)
Negligible Negligible Negligible Slight Moderate
76-94 % of AQAL (30.2 –
37.8μg/m³)
Negligible Negligible Slight Moderate Moderate
95 – 102% of AQAL
(37.8 – 41.0μg/m³)
Negligible Slight Moderate Moderate Substantial
103 – 109 % of AQAL
(41.0 – 43.8μg/m³)
Negligible Moderate Moderate Substantial Substantial
110% or more of AQAL
(>43.8μg/m³)
Negligible Moderate Substantial Substantial Substantial
Notes: Concentrations are shown for annual mean NO2 AQO. When defining the concentration as a percentage of the
AQAL, the ‘without scheme’ concentration is used where there is a decrease in pollutant concentration, and the ‘with
scheme;’ concentration for an increase. The total concentration categories reflect the degree of potential harm by
reference to the AQAL value. At exposure less than 75% of this value, i.e. well below, the degree of harm is likely to be
small. As the exposure approaches and exceeds the AQAL, the degree of harm increases. This change naturally
becomes more important when the result is an exposure that is approximately equal to, or greater than the AQAL. It is
unwise to ascribe too much accuracy to incremental changes or background concentrations, and this is especially
important when total concentrations are close to the AQAL. For a given year in the future, it is impossible to define the
new total concentration without recognising the inherent uncertainty, which is why there is a category that has a range
around the AQAL, rather than being exactly equal to it.
Overall assessment of significance
7.7.33 In accordance with both IAN 174/13 and EPUK/IAQM guidance, the overall
significance of the effect has been determined using professional judgement. This
is based upon consideration of the number of receptors predicted to experience a
worsening or improvement in air quality and the predicted concentrations relative
to the AQOs. The assessment of significance has been made on the basis of
following key criteria in relation to human health:
1. The risk that environmental standards will be breached
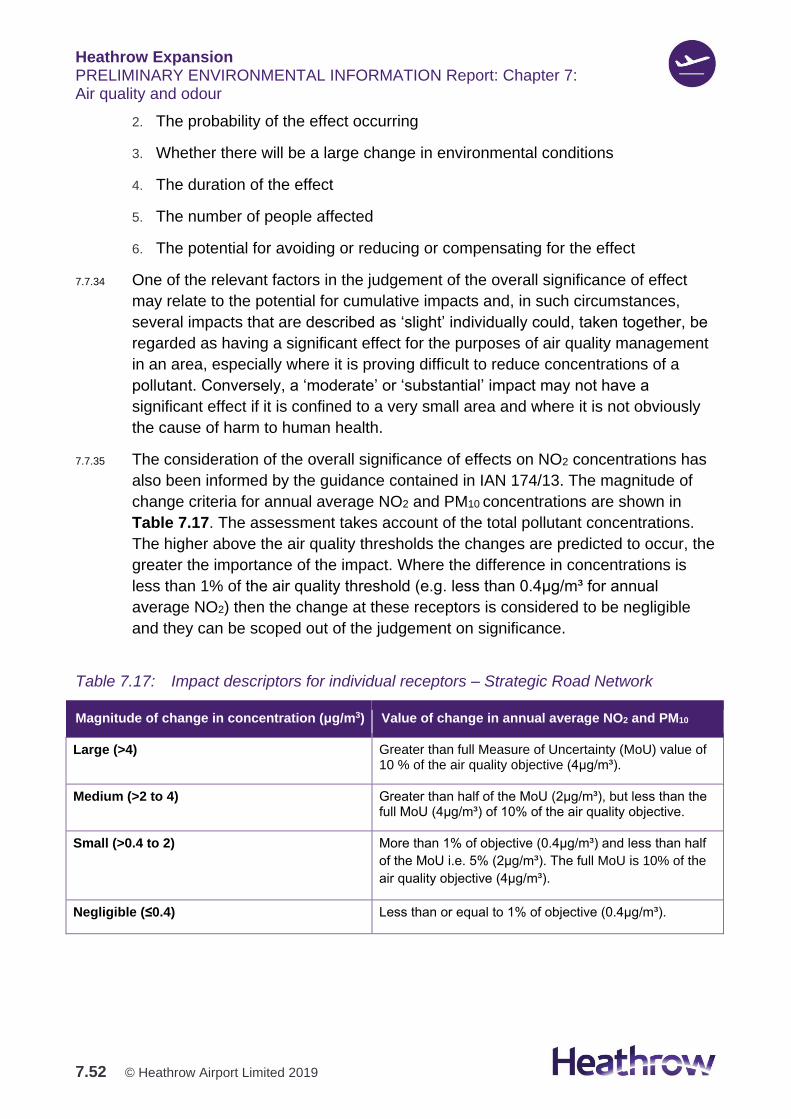
Heathrow Expansion PRELIMINARY ENVIRONMENTAL INFORMATION Report: Chapter 7: Air quality and odour
7.52 © Heathrow Airport Limited 2019
2. The probability of the effect occurring
3. Whether there will be a large change in environmental conditions
4. The duration of the effect
5. The number of people affected
6. The potential for avoiding or reducing or compensating for the effect
7.7.34 One of the relevant factors in the judgement of the overall significance of effect
may relate to the potential for cumulative impacts and, in such circumstances,
several impacts that are described as ‘slight’ individually could, taken together, be
regarded as having a significant effect for the purposes of air quality management
in an area, especially where it is proving difficult to reduce concentrations of a
pollutant. Conversely, a ‘moderate’ or ‘substantial’ impact may not have a
significant effect if it is confined to a very small area and where it is not obviously
the cause of harm to human health.
7.7.35 The consideration of the overall significance of effects on NO2 concentrations has
also been informed by the guidance contained in IAN 174/13. The magnitude of
change criteria for annual average NO2 and PM10 concentrations are shown in
Table 7.17. The assessment takes account of the total pollutant concentrations.
The higher above the air quality thresholds the changes are predicted to occur, the
greater the importance of the impact. Where the difference in concentrations is
less than 1% of the air quality threshold (e.g. less than 0.4μg/m³ for annual
average NO2) then the change at these receptors is considered to be negligible
and they can be scoped out of the judgement on significance.
Table 7.17: Impact descriptors for individual receptors – Strategic Road Network
Magnitude of change in concentration (μg/m3) Value of change in annual average NO2 and PM10
Large (>4) Greater than full Measure of Uncertainty (MoU) value of 10 % of the air quality objective (4μg/m³).
Medium (>2 to 4) Greater than half of the MoU (2μg/m³), but less than the full MoU (4μg/m³) of 10% of the air quality objective.
Small (>0.4 to 2) More than 1% of objective (0.4μg/m³) and less than half
of the MoU i.e. 5% (2μg/m³). The full MoU is 10% of the
air quality objective (4μg/m³).
Negligible (≤0.4) Less than or equal to 1% of objective (0.4μg/m³).
Heathrow Expansion PRELIMINARY ENVIRONMENTAL INFORMATION Report: Chapter 7: Air quality and odour
7.53 © Heathrow Airport Limited 2019
Odour emissions and potential annoyance
7.7.36 Odour perception and its potential to cause annoyance is subjective and is
strongly dependent on the nature of the odour and the sensitivity or tolerance of
those exposed. As such, a semi-quantitative odour assessment has been
undertaken and reported in accordance with IAQM guidance (IAQM, 2018), as
referenced in relation to odour emissions associated with construction activities.
7.7.37 This considers the number and location of odour complaints received at Heathrow
under the current layout and likely changes following expansion. The odour source
(e.g. aircraft movements), the pathway for odour flux to receptor (e.g. distance and
direction in relation to prevailing wind direction) and receptor sensitivity have been
considered.
Assessment of the effect of the DCO Project on compliance with EU limit values
7.7.38 The impact of the DCO Project has been considered at key PCM assessment
locations. These PCM locations are shown in Figure 7.2, Volume 2.
7.7.39 Concentrations within the Core AQO Assessment Area have been predicted using
dispersion modelling under the future baseline scenario and the scenario with the
DCO Project, for each assessment year at each assessment location. This
enables the increment in NO2 concentration predicted as a result of the
development to be calculated. The increment in NO2 concentration resulting from
the DCO Project has been added to the concentration predicted using the PCM
model to determine a total NO2 concentration which can be used to consider
compliance. The total NO2 concentration predicted in this way has been compared
to the highest concentration predicted in the Greater London agglomeration zone
for that assessment year. This is consistent with the approach detailed in IAN
175/13 (Highways Agency, 2013b).
7.7.40 Outside the Core AQO Assessment Area the impact of the DCO Project on
pollutant concentrations towards Central London has been considered by
reference to predictions of airport-related traffic demand coming from those areas.
Cumulative effects
7.7.41 Cumulative air quality and odour effects resulting from the combination of effects
from the DCO Project and other developments will be assessed in accordance
with the approach set out in Section 5.8: Cumulative effects assessment.
7.8 Assumptions and limitations of this PEIR
7.8.1 The modelling and prediction of air quality inevitably requires a large number of
assumptions to be made, and it is important to highlight the associated uncertainty
and limitations and how their effect has been reduced. Assumptions are
Heathrow Expansion PRELIMINARY ENVIRONMENTAL INFORMATION Report: Chapter 7: Air quality and odour
7.54 © Heathrow Airport Limited 2019
unavoidable in air quality assessments and, wherever appropriate, a realistic
worst-case approach has been applied to ensure that predicted air quality impacts
with the DCO Project are not under-stated.
7.8.2 This section summarises the assumptions applied. More detail is available in
Appendix 7.1.
7.8.3 There are many components that contribute to the uncertainty of modelling
predictions. The emissions dispersion models used are dependent upon the input
data, which will have inherent uncertainties associated with them. There are then
additional uncertainties, as models are required to simplify complex atmospheric
conditions and interactions into a series of algorithms.
7.8.4 Assumptions relating to airside emissions include: necessary simplification of the
aircraft fleet into categories for emissions purposes; assumptions on future fleet
mix; assumptions on times that aircraft engines and APUs are operational and
their thrust settings when operational; assumptions on pollutant emission rates;
and assumptions relating to emissions from other sources such as heating plant
and airside vehicles.
7.8.5 HHASAM has been developed to assess the future operation of the road network.
Outputs from several of the other models within the modelling suite feed into
HHASAM, allowing for as robust an analysis as possible. Full details of the
modelling suite are available in the Preliminary Transport Information Report
(PTIR). In keeping with other strategic highway models, HHASAM estimates the
likely route choice of vehicles and predicts the resulting average levels of demand
on and operation of the highway network. Comparing forecast traffic flows
between scenarios gives an indication of the likely direction and scale of change in
demand and network operation. The air quality assessment has used outputs from
HHASAM v2.0. This is calibrated to a 2015 base year as this is the year for which
most of the demand and traffic count data that is required for the model
development was collected.
7.8.6 The development of HHASAM v2.0 has followed guidance set out in the DfT’s
WebTAG Unit M3.1, adopting and enhanced with best practice as far as
practicable. HHASAM v2.0 is considered to be suitable for refining Future Baseline
forecasts and developing initial 'With DCO Project' forecasts to provide traffic
information for the PTIR and PEIR. It is envisaged that HHASAM v2.0 will undergo
further refinement prior to the Application submission for the DCO Project.
7.8.7 As with the use of all strategic highway assignment model outputs in air quality
assessments, assumptions have been made in the use of HHASAM outputs for
this assessment. These include the use of AADT flows rather than more detailed
period breakdowns, and the use of relatively long sections of road to represent
actual driving conditions that may change over small distances. HHASAM outputs
Heathrow Expansion PRELIMINARY ENVIRONMENTAL INFORMATION Report: Chapter 7: Air quality and odour
7.55 © Heathrow Airport Limited 2019
do not provide splits of buses / coaches, splits of rigid / articulated HGVs, splits of
taxi/Private Hire Vehicle flows and motorcycle flows, as such HHASAM outputs
have been supplemented by the fleet splits assumed in the Defra EFT to enable
robust predictions of pollutant emissions.
7.8.8 There are additional limitations associated with the traffic data used for the 2022
assessment, due to the way in which flows were derived, by overlay of
construction traffic rather than construction traffic being included in HHASAM. The
full impacts of the CTMP and CWTP have not been accounted for in this
approach. The road traffic flows used in this assessment are therefore considered
to be worst-case for this assessment year. Construction traffic will be modelled
using the refined version of HHASAM for the ES and the CTMP and CWTP will be
accounted for.
7.8.9 Further assumptions are required to process dispersion model outputs. Industry
standard tools, such as the Defra background maps and NOx to NO2 calculator
have been used. The background maps provide concentrations at a limited (1 km)
resolution (which have then been interpolated), are likely to over-estimate rail
emissions on the Great Western Mainline, and also have limitations in terms of
what emission sources can be removed from them, although a worst-case
approach with some limited double-counting of emissions has been adopted. The
NOx to NO2 calculator uses primary NO2 (fNO2) values for road traffic emissions
that are considered likely to be unrealistic, although these are largely accounted
for through secondary adjustment of the modelled NO2 concentrations. Inputs to
these tools necessarily have to be simplified when considering impacts over large
area such as the Core AQO Assessment Area to avoid step changes in modelled
concentrations (e.g. the selection of a LPA area when using the NOx to NO2
calculator), which introduces some limitation in the consideration of changes in
parameters between different areas.
7.8.10 An important stage in the process is model verification, which involves comparing
the model output with measured concentrations to provide confidence in base year
predictions and predictions of future air quality. It is recognised that all air quality
monitors have inherent measurement uncertainties, however, the number of
monitoring stations in the area is considered to enable a robust model verification
process to be carried out.
7.8.11 Overall, it is considered that, given the approach taken to make the required
assumptions in this assessment, the conclusions drawn are robust. These
assumptions will be revisited as necessary in the assessment carried out for the
ES.
Heathrow Expansion PRELIMINARY ENVIRONMENTAL INFORMATION Report: Chapter 7: Air quality and odour
7.56 © Heathrow Airport Limited 2019
7.9 Overall baseline
Current baseline
Ambient air quality
7.9.1 Air quality in the Heathrow area has been routinely assessed for the last two
decades, through both ambient air quality monitoring and modelling studies.
Previous dispersion modelling (Ricardo-AEA, 2015) has shown that in the area
outside of the Airport boundary, the main sources of pollution that influence air
quality are non-airport-related. Emissions source apportionment showed that, in
decreasing order of influence, pollutant concentrations beyond the Airport
boundary are affected by:
1. The ambient background (pollutants transported from elsewhere, including
London and northern Europe)
2. Non-airport-related road traffic (trips in the modelled area not starting or ending
at the Airport)
3. Airport-related road traffic (trips starting at or ending at the Airport)
4. Emissions from on-airport activities, including aircraft on the ground and in the
LTO cycle
Local air quality management
7.9.2 As explained in Table 7.1, each LPA is required to assess air quality within the
administrative area and declare an AQMA where an AQO is expected to be
exceeded. The AQOs that apply in the LAQM process are detailed in Table 7.18.
Table 7.18: UK air quality objectives and pollutants – LAQM in England
Pollutant Concentration Measured as
Benzene 16.25 µg/m3 Running annual mean
5.00 µg/m3 Annual mean
1,3-Butadiene 2.25 µg/m3 Running annual mean
Carbon monoxide 10.0mg/m3 Running 8-hour mean
Lead 0.25µg/m3 Annual mean
Nitrogen dioxide 200µg/m3 not to be exceeded more
than 18 times a year
1-hour mean
40µg/m3 Annual mean
Particulate Matter (PM10) 50µg/m3, not to be exceeded more 24-hour mean
Heathrow Expansion PRELIMINARY ENVIRONMENTAL INFORMATION Report: Chapter 7: Air quality and odour
7.57 © Heathrow Airport Limited 2019
Pollutant Concentration Measured as
than 35 times a year
40µg/m3 Annual mean
Particulate Matter (PM2.5) 25µg/m3 Annual mean
Sulphur dioxide 350µg/m3, not to be exceeded more
than 24 times a year
1-hour mean
125µg/m3, not to be exceeded more
than 3 times a year
24-hour mean
266µg/m3, not to be exceeded more
than 35 times a year
15-minute mean
7.9.3 As part of the LAQM Review and Assessment process, several AQMAs have been
declared in the area. These AQMAs were declared because annual average
concentrations of NO2 were found to be above the annual mean AQO of 40 µg/m3
at certain locations, including those close to busy roads and motorways. However,
the NO2 annual mean AQO is not exceeded everywhere in each AQMA.
7.9.4 The London Borough of Hillingdon declared an AQMA in 2001, which was then
extended in 2003 to cover all parts of the borough south of the Chiltern-
Marylebone railway line. Heathrow sits within the southern part of this AQMA. The
councils of London Borough of Hounslow, Spelthorne Borough Council, Slough
Borough Council, South Bucks District Council and Runnymede District Council
have declared AQMAs in their boroughs. London Borough of Hounslow
amalgamated four existing AQMAs into one AQMA to encompass the whole
Borough and Spelthorne Borough Council declared the whole Borough as an
AQMA. Slough Borough Council has declared four AQMAs; including AQMA No.2
which encompasses the A4 London Road east of junction 5 of the M4 motorway
as far as Sutton Lane, in Brands Hill, approximately 3km to the west of Heathrow.
South Bucks District Council has an AQMA covering the whole parish of Iver.
Runnymede District Council currently has two AQMAs, including the M25 AQMA
where the M25 crosses over Vicarage Road / High Street Egham, approximately
4km to the southwest of Heathrow. These AQMAs are shown in Figure 7.3,
Volume 2.
7.9.5 Concentrations of the other significant air pollutants that can affect public health,
including PM10 and PM2.5, already meet the AQOs and are forecast to continue to
do so into the future.
Heathrow Expansion PRELIMINARY ENVIRONMENTAL INFORMATION Report: Chapter 7: Air quality and odour
7.58 © Heathrow Airport Limited 2019
Air quality monitoring
Automatic monitoring
7.9.6 The Heathrow Air Quality Working Group (a partnership between Heathrow,
London Borough of Hillingdon, London Borough of Hounslow, Slough Borough
Council, Spelthorne Borough Council, the GLA, TfL and the Environment Agency)
works collaboratively to monitor, share and publish data from 22 continuous air
quality monitoring stations within approximately 20 kilometres (km) of Heathrow.
The data collected can be found on the Heathrow Airwatch (2019) website.
7.9.7 One of these monitoring stations is located within the Airport boundary (called
LHR2), and several of these are located immediately within the vicinity of
Heathrow (Heathrow Oaks Road, Heathrow Green Gates, Sipson, Oxford Avenue,
Cranford and Hatton Cross). Details of the monitoring stations in the area
surrounding Heathrow and within the Core AQO Assessment Area, along with
measured annual mean concentrations of NO2, PM10 and PM2.5 from 2014 – 2017,
are provided in Table 7.19 to Table 7.21. Monitoring station locations are provided
in Figure 7.4, Volume 2.
7.9.8 These data confirm that PM10 concentrations do not exceed the annual AQO. The
highest PM10 annual mean concentration recorded in the 2014 – 2017 period was
34µg/m3 at Hillingdon Hayes in 2014. The 24-hour AQO (50µg/m3 not to be
exceeded more than 35 times/year) was exceeded once in 2014 at Hillingdon
Hayes (46 exceedances of the 24-hour AQO).
7.9.9 NO2 concentrations exceed the annual mean AQO at two roadside monitoring
sites (London Hillingdon and Hillingdon Hayes), but the concentration is below
40µg/m3 at other roadside sites, and background locations. The highest NO2
annual mean concentration recorded in the 2014 – 2017 period was 58µg/m3 in
2014 at London Hillingdon. The NO2 1-hour mean objective (200µg/m3 not to be
exceeded more than 18 times / year) was not exceeded in this period as the
highest number of exceedances was 12, in 2017 at Hillingdon Hayes and LHR2.
7.9.10 Over the four years, several sites have shown a downward trend in NO2
concentrations, with a strong downward trend at the Feltham roadside monitoring
site. There have been downward trends at the Oaks Road, London Hillingdon and
Colnbrook suburban/urban background monitoring sites. Concentrations have
remained relatively constant at the other sites.
7.9.11 There have been downward trends in PM10 concentration at all stations with the
exception of Hillingdon Harmondsworth and Hillingdon Hayes, where
concentrations have remained relatively constant. There have been downward
trends in PM2.5 concentration at the majority of stations. The highest annual mean
recorded was 14µg/m3 in 2014 at London Harlington.
Heathrow Expansion PRELIMINARY ENVIRONMENTAL INFORMATION Report: Chapter 7: Air quality and odour
7.59 © Heathrow Airport Limited 2019
Nitrogen dioxide diffusion tubes
7.9.12 NO2 diffusion tube monitoring data is available at a much larger number of sites
than the continuous air quality monitoring stations. Data have been taken from the
2017 LAQM Annual Status Reports (ASRs) produced by each LPA. The data is
summarised in Figure 7.5, Volume 2.
7.9.13 The pattern seen at automatic monitoring stations is repeated. NO2 concentrations
exceed the annual mean AQO at some roadside monitoring sites, but the
concentration is below 40µg/m3 at other roadside sites, and background locations.
Other pollutants
7.9.14 Concentrations of CO, SO2 and benzene were previously monitored in the London
Borough of Hillingdon. Successive LAQM reports (London Borough of Hillingdon,
2007; London Borough of Hillingdon, 2008, London Borough of Hillingdon, 2009)
confirmed that all of the relevant AQOs for these pollutants had been achieved
and therefore there was no risk of the AQOs being exceeded.
7.9.15 In 2007, the maximum daily running 8-hour CO mean at all monitoring stations
was well below 1µg/m3 (0.3 to 0.5µg/m3), compared to the AQO of 10µg/m3. The
1-hour mean, 24-hour mean and 15-minute mean SO2 AQOs were all achieved
and the annual mean benzene concentrations at all diffusion tube monitoring sites
was around 2µg/m3 (1.9 to 2.2µg/m3), compared to the AQO of 5µg/m3.
7.9.16 As concentrations of these pollutants were so low in the area, monitoring was
discontinued and no recent data is available. Monitoring of CO was discontinued
at the AURN sites in London Borough of Hillingdon in 2007 and 2008. Benzene
monitoring was discontinued in 2010 (London Borough of Hillingdon, 2011).
Monitoring of SO2 concentrations at the London Hillingdon AURN monitoring
station was discontinued in 2007 (Defra, 2018h).
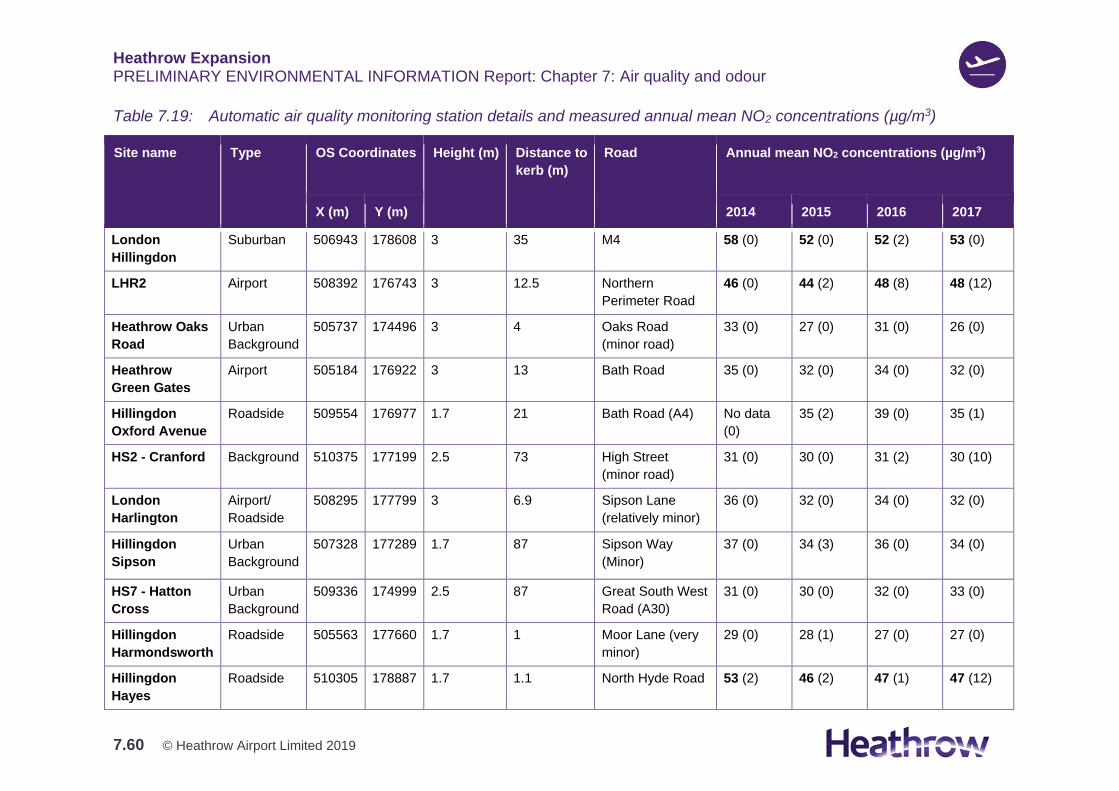
Heathrow Expansion PRELIMINARY ENVIRONMENTAL INFORMATION Report: Chapter 7: Air quality and odour
7.60 © Heathrow Airport Limited 2019
Table 7.19: Automatic air quality monitoring station details and measured annual mean NO2 concentrations (µg/m3)
Site name Type OS Coordinates Height (m) Distance to
kerb (m)
Road Annual mean NO2 concentrations (µg/m3)
X (m) Y (m) 2014 2015 2016 2017
London
Hillingdon
Suburban 506943 178608 3 35 M4 58 (0) 52 (0) 52 (2) 53 (0)
LHR2 Airport 508392 176743 3 12.5 Northern
Perimeter Road
46 (0) 44 (2) 48 (8) 48 (12)
Heathrow Oaks
Road
Urban
Background
505737 174496 3 4 Oaks Road
(minor road)
33 (0) 27 (0) 31 (0) 26 (0)
Heathrow
Green Gates
Airport 505184 176922 3 13 Bath Road 35 (0) 32 (0) 34 (0) 32 (0)
Hillingdon
Oxford Avenue
Roadside 509554 176977 1.7 21 Bath Road (A4) No data
(0)
35 (2) 39 (0) 35 (1)
HS2 - Cranford Background 510375 177199 2.5 73 High Street
(minor road)
31 (0) 30 (0) 31 (2) 30 (10)
London
Harlington
Airport/
Roadside
508295 177799 3 6.9 Sipson Lane
(relatively minor)
36 (0) 32 (0) 34 (0) 32 (0)
Hillingdon
Sipson
Urban
Background
507328 177289 1.7 87 Sipson Way
(Minor)
37 (0) 34 (3) 36 (0) 34 (0)
HS7 - Hatton
Cross
Urban
Background
509336 174999 2.5 87 Great South West
Road (A30)
31 (0) 30 (0) 32 (0) 33 (0)
Hillingdon
Harmondsworth
Roadside 505563 177660 1.7 1 Moor Lane (very
minor)
29 (0) 28 (1) 27 (0) 27 (0)
Hillingdon
Hayes
Roadside 510305 178887 1.7 1.1 North Hyde Road 53 (2) 46 (2) 47 (1) 47 (12)
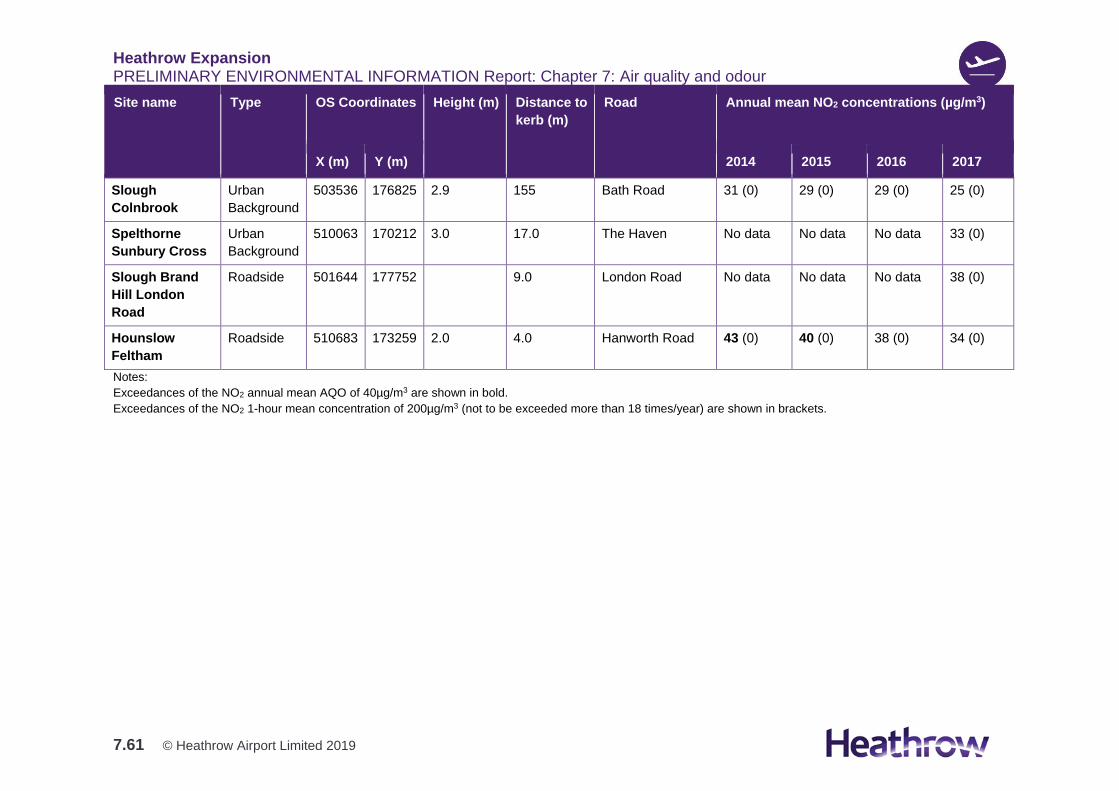
Heathrow Expansion PRELIMINARY ENVIRONMENTAL INFORMATION Report: Chapter 7: Air quality and odour
7.61 © Heathrow Airport Limited 2019
Site name Type OS Coordinates Height (m) Distance to
kerb (m)
Road Annual mean NO2 concentrations (µg/m3)
X (m) Y (m) 2014 2015 2016 2017
Slough
Colnbrook
Urban
Background
503536 176825 2.9 155 Bath Road 31 (0) 29 (0) 29 (0) 25 (0)
Spelthorne
Sunbury Cross
Urban
Background
510063 170212 3.0 17.0 The Haven No data No data No data 33 (0)
Slough Brand
Hill London
Road
Roadside 501644 177752 9.0 London Road No data No data No data 38 (0)
Hounslow
Feltham
Roadside 510683 173259 2.0 4.0 Hanworth Road 43 (0) 40 (0) 38 (0) 34 (0)
Notes:
Exceedances of the NO2 annual mean AQO of 40µg/m3 are shown in bold.
Exceedances of the NO2 1-hour mean concentration of 200µg/m3 (not to be exceeded more than 18 times/year) are shown in brackets.
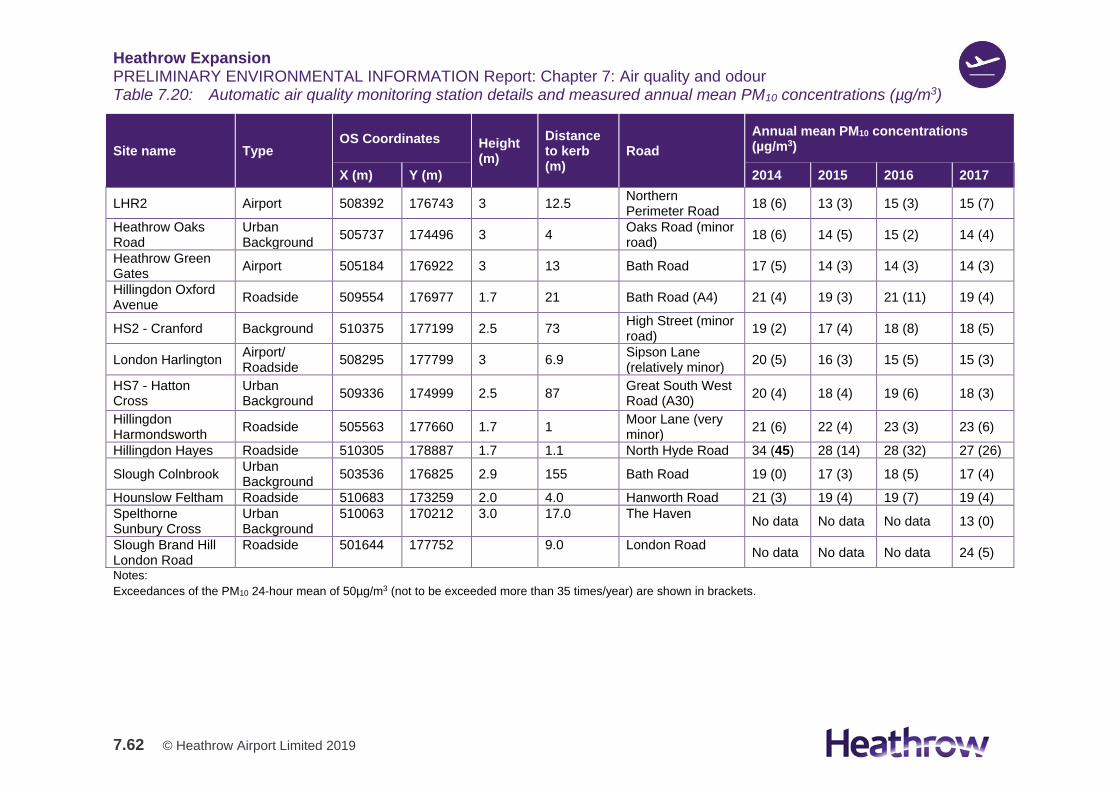
Heathrow Expansion PRELIMINARY ENVIRONMENTAL INFORMATION Report: Chapter 7: Air quality and odour
7.62 © Heathrow Airport Limited 2019
Table 7.20: Automatic air quality monitoring station details and measured annual mean PM10 concentrations (µg/m3)
Site name Type OS Coordinates Height
(m)
Distance to kerb (m)
Road
Annual mean PM10 concentrations (µg/m3)
X (m) Y (m) 2014 2015 2016 2017
LHR2 Airport 508392 176743 3 12.5 Northern Perimeter Road
18 (6) 13 (3) 15 (3) 15 (7)
Heathrow Oaks Road
Urban Background
505737 174496 3 4 Oaks Road (minor road)
18 (6) 14 (5) 15 (2) 14 (4)
Heathrow Green Gates
Airport 505184 176922 3 13 Bath Road 17 (5) 14 (3) 14 (3) 14 (3)
Hillingdon Oxford Avenue
Roadside 509554 176977 1.7 21 Bath Road (A4) 21 (4) 19 (3) 21 (11) 19 (4)
HS2 - Cranford Background 510375 177199 2.5 73 High Street (minor road)
19 (2) 17 (4) 18 (8) 18 (5)
London Harlington Airport/ Roadside
508295 177799 3 6.9 Sipson Lane (relatively minor)
20 (5) 16 (3) 15 (5) 15 (3)
HS7 - Hatton Cross
Urban Background
509336 174999 2.5 87 Great South West Road (A30)
20 (4) 18 (4) 19 (6) 18 (3)
Hillingdon Harmondsworth
Roadside 505563 177660 1.7 1 Moor Lane (very minor)
21 (6) 22 (4) 23 (3) 23 (6)
Hillingdon Hayes Roadside 510305 178887 1.7 1.1 North Hyde Road 34 (45) 28 (14) 28 (32) 27 (26)
Slough Colnbrook Urban Background
503536 176825 2.9 155 Bath Road 19 (0) 17 (3) 18 (5) 17 (4)
Hounslow Feltham Roadside 510683 173259 2.0 4.0 Hanworth Road 21 (3) 19 (4) 19 (7) 19 (4)
Spelthorne Sunbury Cross
Urban Background
510063 170212 3.0 17.0 The Haven No data No data No data 13 (0)
Slough Brand Hill London Road
Roadside 501644 177752 9.0 London Road No data No data No data 24 (5)
Notes:
Exceedances of the PM10 24-hour mean of 50µg/m3 (not to be exceeded more than 35 times/year) are shown in brackets.
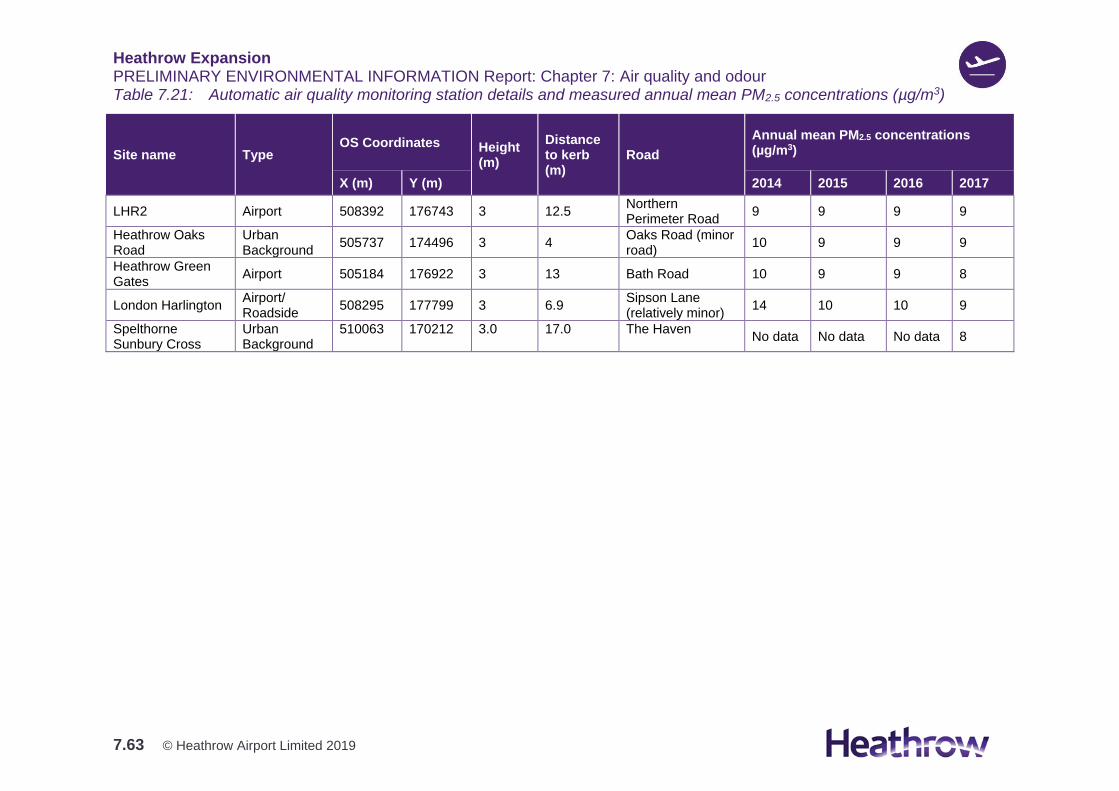
Heathrow Expansion PRELIMINARY ENVIRONMENTAL INFORMATION Report: Chapter 7: Air quality and odour
7.63 © Heathrow Airport Limited 2019
Table 7.21: Automatic air quality monitoring station details and measured annual mean PM2.5 concentrations (µg/m3)
Site name Type OS Coordinates Height
(m)
Distance to kerb (m)
Road
Annual mean PM2.5 concentrations (µg/m3)
X (m) Y (m) 2014 2015 2016 2017
LHR2 Airport 508392 176743 3 12.5 Northern Perimeter Road
9 9 9 9
Heathrow Oaks Road
Urban Background
505737 174496 3 4 Oaks Road (minor road)
10 9 9 9
Heathrow Green Gates
Airport 505184 176922 3 13 Bath Road 10 9 9 8
London Harlington Airport/ Roadside
508295 177799 3 6.9 Sipson Lane (relatively minor)
14 10 10 9
Spelthorne Sunbury Cross
Urban Background
510063 170212 3.0 17.0 The Haven No data No data No data 8
Heathrow Expansion PRELIMINARY ENVIRONMENTAL INFORMATION Report: Chapter 7: Air quality and odour
7.64 © Heathrow Airport Limited 2019
Dust deposition
7.9.17 Ambient dust deposition rates are not monitored extensively in the UK. Monitoring
that is undertaken is usually connected with specific activities such as mining and
mineral extraction operations or specific large-scale construction programmes.
Dust monitoring may also be undertaken to investigate specific complaints
received by LPAs, who are then required to investigate dust nuisance under the
Environmental Protection Act 1990.
7.9.18 Dust deposition rates are not currently monitored in the Heathrow area. Current
dust levels in the areas potentially affected by the DCO Project are expected to be
well below annoyance levels due to the nature of land uses in the area and lack of
likely emission sources. Monitoring of baseline PM and dust deposition levels will
be undertaken in advance of commencement of the construction programme.
Odour
7.9.19 Similar to dust deposition rates, odour levels are not routinely monitored in the UK.
Baseline odour surveys will be undertaken in advance of commencement of the
construction programme and the assessment will be informed by data on any
complaints received in relation to existing airport activities.
7.9.20 Heathrow operates a system to receive and record complaints from members of
the public. The majority of complaints received relate to aircraft noise, but
complaints related to other issues are also logged in categories including ‘Aircraft
Emissions’, ‘Health / pollution Levels’ and ‘Odour’.
7.9.21 Complaints from July 2014 to November 2018 have been considered. In the
52 months for which complaints data were available, 47 complaints from 42
different complainants / locations were received where the complainant clearly
believed that they could smell aviation fuel odours. This averages fewer than one
complaint per month. Figure 7.6, Volume 2 shows their locations. As seen on this
figure, some of the odour complaints received were located as far as 40 km away
from the Airport. Such complaints are most likely to be due to emission sources
not associated with the Airport, and could also potentially relate to activity at other
airports.
Dispersion modelling
7.9.22 Baseline pollutant concentrations for 2015, 2016 and 2017 have been calculated
using dispersion modelling. Pollutant concentrations have been predicted at the
locations of automatic air quality monitoring stations in order to evaluate modelling
performance in the model verification process. Dispersion modelling results have
been adjusted accordingly to ensure that baseline concentrations are
representative of the likely concentrations at receptors and that the model can be
Heathrow Expansion PRELIMINARY ENVIRONMENTAL INFORMATION Report: Chapter 7: Air quality and odour
7.65 © Heathrow Airport Limited 2019
used to predict future concentrations. Details of the model inputs, assumptions
and the verification are provided in Appendix 7.1.
Future baseline
7.9.23 Future baseline concentrations have been predicted using dispersion modelling.
Details of the model inputs, assumptions and the verification are provided in
Appendix 7.1, together with the method used to derive future year background
concentrations. Where assumptions have been made, a reasonable worst-case
approach has been adopted.
7.9.24 The likely evolution of the baseline conditions if the DCO Project did not come
forward has been considered in this assessment. The traffic modelling on which
the dispersion modelling to predict future pollutant concentrations is based takes
account of employment and housing projections, future infrastructure projects and
development in Development Plans and the planning process. Further detail on
the traffic modelling is available in the PTIR.
7.9.25 Furthermore, changes in baseline conditions as a result of other development
being pursued at Heathrow Airport have been taken into consideration, including
the Kilobox Apron Development and Runway Access Taxiway projects, described
in Table 5.1 of Chapter 5, which would be completed prior to the commencement
of construction of the DCO Project.
7.9.26 Additional Heathrow Airport supporting development may also come forward in the
future (with their construction and operation phases overlapping with the
construction and/or operation phases of the DCO Project). Such development is
considered within Section 7.11.
7.9.27 There will also be other changes in baseline conditions in the wider area as a
result of land use changes through development un-related to Heathrow Airport.
Such ‘other development’ could result in new receptors or result in other
cumulative effects with the DCO Project. Where these developments are built out
before the construction of the DCO Project commences, or where the construction
and operation phases of these developments overlap with the construction and/or
operation phases of the DCO Project, they are assessed in Section 7.11.
7.9.28 Air quality is generally expected to improve with time, due, for example, to more
stringent emissions standards for motor vehicles. The pollutant concentrations
presented for the 2035 future baseline (and 2035 with the DCO Project) are higher
than would be expected in reality as 2030 background maps and emission factors
have been used, as this is the latest date for which such projections are available.
Background pollutant concentrations and emission rates are expected to continue
to decline after 2030, in particular as a result of the wider uptake of ULEVs.
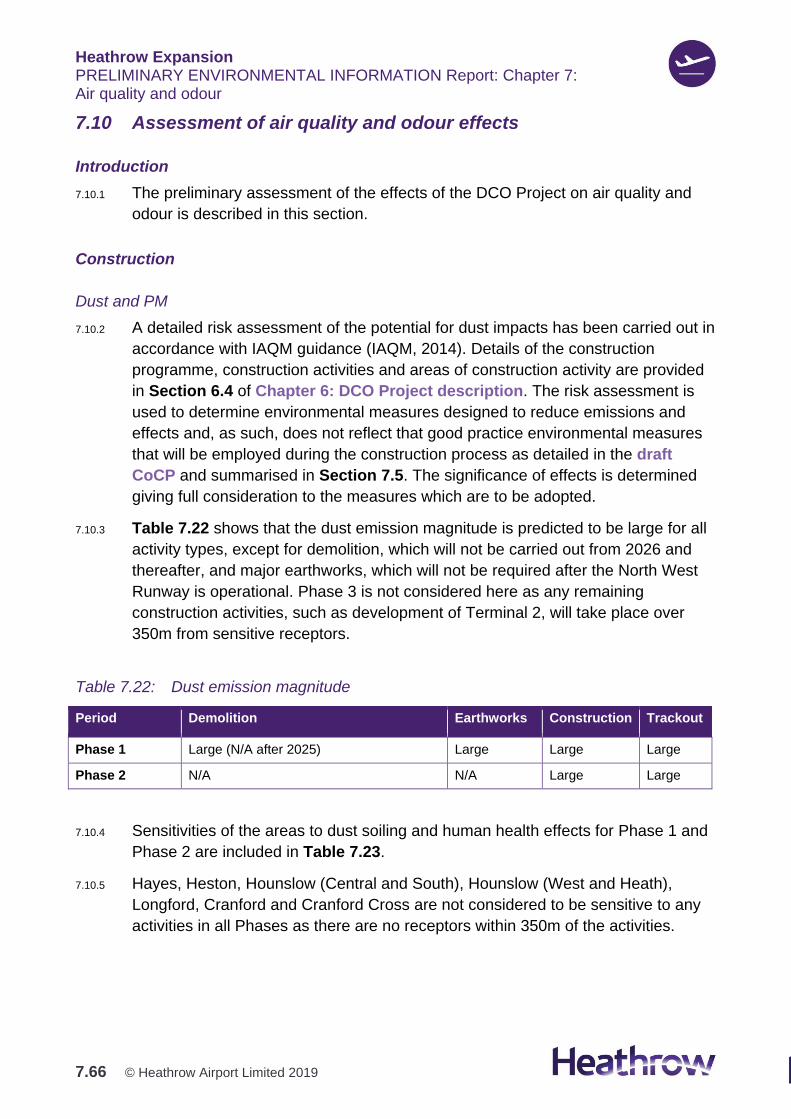
Heathrow Expansion PRELIMINARY ENVIRONMENTAL INFORMATION Report: Chapter 7: Air quality and odour
7.66 © Heathrow Airport Limited 2019
7.10 Assessment of air quality and odour effects
Introduction
7.10.1 The preliminary assessment of the effects of the DCO Project on air quality and
odour is described in this section.
Construction
Dust and PM
7.10.2 A detailed risk assessment of the potential for dust impacts has been carried out in
accordance with IAQM guidance (IAQM, 2014). Details of the construction
programme, construction activities and areas of construction activity are provided
in Section 6.4 of Chapter 6: DCO Project description. The risk assessment is
used to determine environmental measures designed to reduce emissions and
effects and, as such, does not reflect that good practice environmental measures
that will be employed during the construction process as detailed in the draft
CoCP and summarised in Section 7.5. The significance of effects is determined
giving full consideration to the measures which are to be adopted.
7.10.3 Table 7.22 shows that the dust emission magnitude is predicted to be large for all
activity types, except for demolition, which will not be carried out from 2026 and
thereafter, and major earthworks, which will not be required after the North West
Runway is operational. Phase 3 is not considered here as any remaining
construction activities, such as development of Terminal 2, will take place over
350m from sensitive receptors.
Table 7.22: Dust emission magnitude
Period Demolition Earthworks Construction Trackout
Phase 1 Large (N/A after 2025) Large Large Large
Phase 2 N/A N/A Large Large
7.10.4 Sensitivities of the areas to dust soiling and human health effects for Phase 1 and
Phase 2 are included in Table 7.23.
7.10.5 Hayes, Heston, Hounslow (Central and South), Hounslow (West and Heath),
Longford, Cranford and Cranford Cross are not considered to be sensitive to any
activities in all Phases as there are no receptors within 350m of the activities.
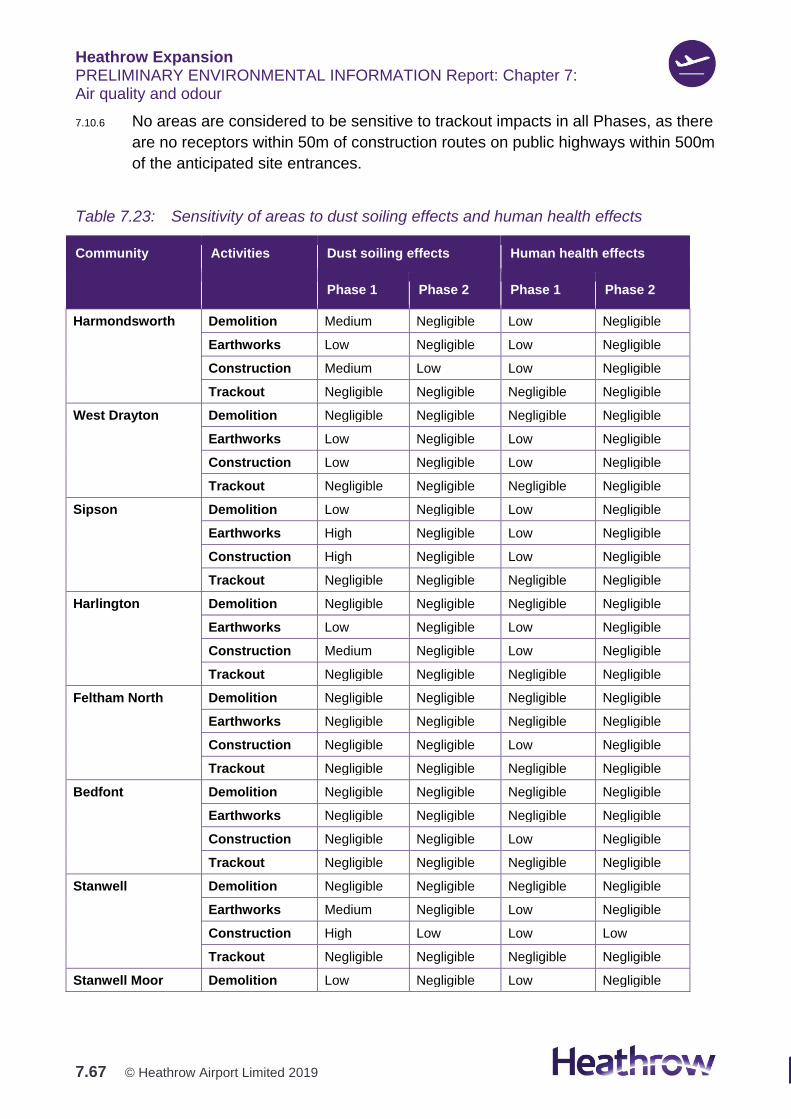
Heathrow Expansion PRELIMINARY ENVIRONMENTAL INFORMATION Report: Chapter 7: Air quality and odour
7.67 © Heathrow Airport Limited 2019
7.10.6 No areas are considered to be sensitive to trackout impacts in all Phases, as there
are no receptors within 50m of construction routes on public highways within 500m
of the anticipated site entrances.
Table 7.23: Sensitivity of areas to dust soiling effects and human health effects
Community Activities Dust soiling effects Human health effects
Phase 1 Phase 2 Phase 1 Phase 2
Harmondsworth Demolition Medium Negligible Low Negligible
Earthworks Low Negligible Low Negligible
Construction Medium Low Low Negligible
Trackout Negligible Negligible Negligible Negligible
West Drayton Demolition Negligible Negligible Negligible Negligible
Earthworks Low Negligible Low Negligible
Construction Low Negligible Low Negligible
Trackout Negligible Negligible Negligible Negligible
Sipson Demolition Low Negligible Low Negligible
Earthworks High Negligible Low Negligible
Construction High Negligible Low Negligible
Trackout Negligible Negligible Negligible Negligible
Harlington Demolition Negligible Negligible Negligible Negligible
Earthworks Low Negligible Low Negligible
Construction Medium Negligible Low Negligible
Trackout Negligible Negligible Negligible Negligible
Feltham North Demolition Negligible Negligible Negligible Negligible
Earthworks Negligible Negligible Negligible Negligible
Construction Negligible Negligible Low Negligible
Trackout Negligible Negligible Negligible Negligible
Bedfont Demolition Negligible Negligible Negligible Negligible
Earthworks Negligible Negligible Negligible Negligible
Construction Negligible Negligible Low Negligible
Trackout Negligible Negligible Negligible Negligible
Stanwell Demolition Negligible Negligible Negligible Negligible
Earthworks Medium Negligible Low Negligible
Construction High Low Low Low
Trackout Negligible Negligible Negligible Negligible
Stanwell Moor Demolition Low Negligible Low Negligible
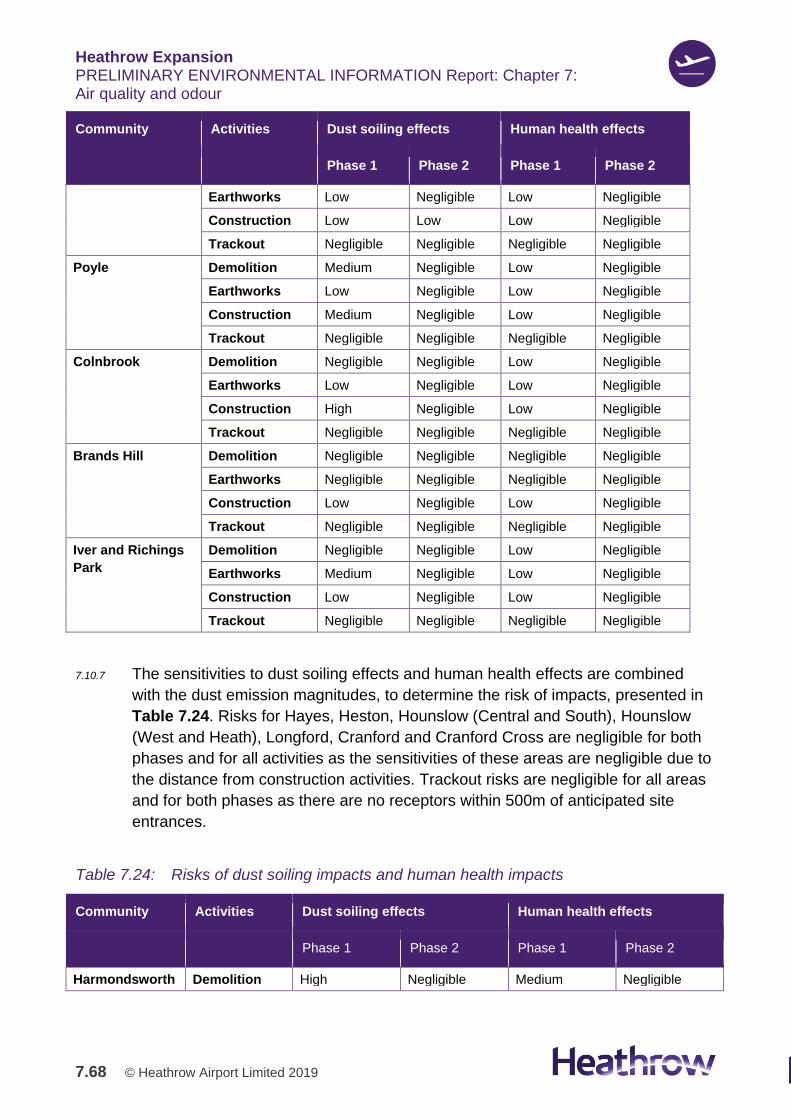
Heathrow Expansion PRELIMINARY ENVIRONMENTAL INFORMATION Report: Chapter 7: Air quality and odour
7.68 © Heathrow Airport Limited 2019
Community Activities Dust soiling effects Human health effects
Phase 1 Phase 2 Phase 1 Phase 2
Earthworks Low Negligible Low Negligible
Construction Low Low Low Negligible
Trackout Negligible Negligible Negligible Negligible
Poyle Demolition Medium Negligible Low Negligible
Earthworks Low Negligible Low Negligible
Construction Medium Negligible Low Negligible
Trackout Negligible Negligible Negligible Negligible
Colnbrook Demolition Negligible Negligible Low Negligible
Earthworks Low Negligible Low Negligible
Construction High Negligible Low Negligible
Trackout Negligible Negligible Negligible Negligible
Brands Hill Demolition Negligible Negligible Negligible Negligible
Earthworks Negligible Negligible Negligible Negligible
Construction Low Negligible Low Negligible
Trackout Negligible Negligible Negligible Negligible
Iver and Richings
Park
Demolition Negligible Negligible Low Negligible
Earthworks Medium Negligible Low Negligible
Construction Low Negligible Low Negligible
Trackout Negligible Negligible Negligible Negligible
7.10.7 The sensitivities to dust soiling effects and human health effects are combined
with the dust emission magnitudes, to determine the risk of impacts, presented in
Table 7.24. Risks for Hayes, Heston, Hounslow (Central and South), Hounslow
(West and Heath), Longford, Cranford and Cranford Cross are negligible for both
phases and for all activities as the sensitivities of these areas are negligible due to
the distance from construction activities. Trackout risks are negligible for all areas
and for both phases as there are no receptors within 500m of anticipated site
entrances.
Table 7.24: Risks of dust soiling impacts and human health impacts
Community Activities Dust soiling effects Human health effects
Phase 1 Phase 2 Phase 1 Phase 2
Harmondsworth Demolition High Negligible Medium Negligible
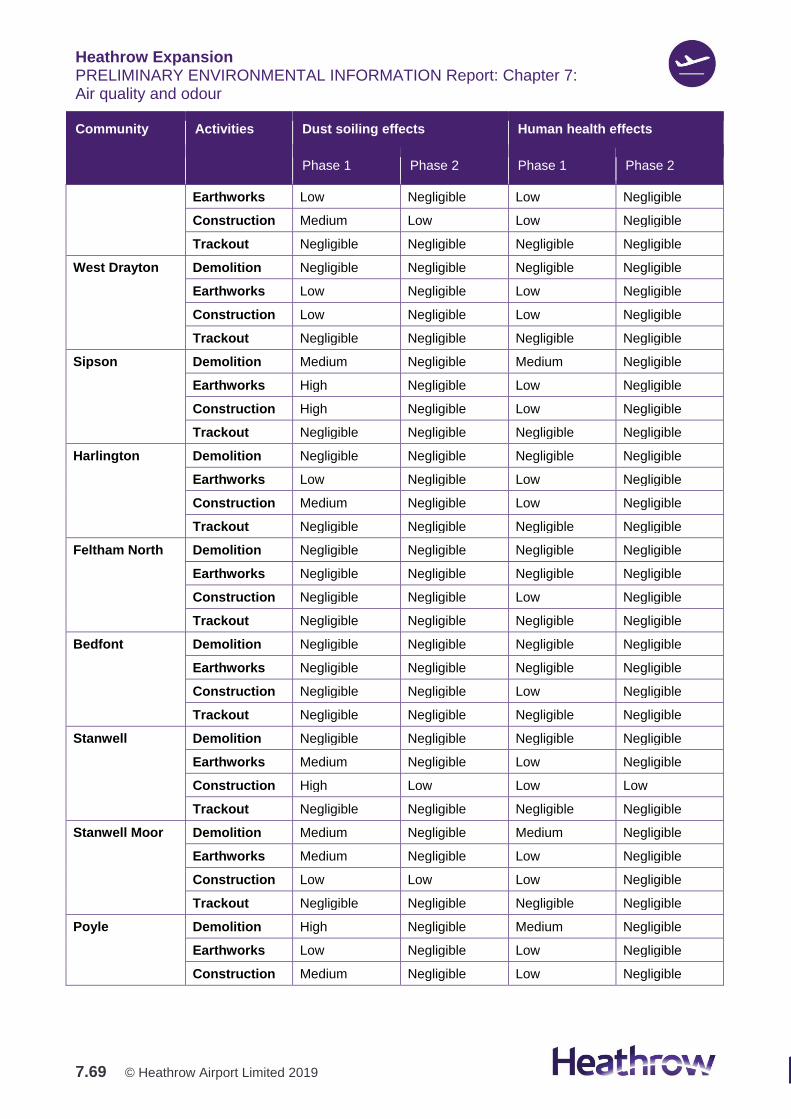
Heathrow Expansion PRELIMINARY ENVIRONMENTAL INFORMATION Report: Chapter 7: Air quality and odour
7.69 © Heathrow Airport Limited 2019
Community Activities Dust soiling effects Human health effects
Phase 1 Phase 2 Phase 1 Phase 2
Earthworks Low Negligible Low Negligible
Construction Medium Low Low Negligible
Trackout Negligible Negligible Negligible Negligible
West Drayton Demolition Negligible Negligible Negligible Negligible
Earthworks Low Negligible Low Negligible
Construction Low Negligible Low Negligible
Trackout Negligible Negligible Negligible Negligible
Sipson Demolition Medium Negligible Medium Negligible
Earthworks High Negligible Low Negligible
Construction High Negligible Low Negligible
Trackout Negligible Negligible Negligible Negligible
Harlington Demolition Negligible Negligible Negligible Negligible
Earthworks Low Negligible Low Negligible
Construction Medium Negligible Low Negligible
Trackout Negligible Negligible Negligible Negligible
Feltham North Demolition Negligible Negligible Negligible Negligible
Earthworks Negligible Negligible Negligible Negligible
Construction Negligible Negligible Low Negligible
Trackout Negligible Negligible Negligible Negligible
Bedfont Demolition Negligible Negligible Negligible Negligible
Earthworks Negligible Negligible Negligible Negligible
Construction Negligible Negligible Low Negligible
Trackout Negligible Negligible Negligible Negligible
Stanwell Demolition Negligible Negligible Negligible Negligible
Earthworks Medium Negligible Low Negligible
Construction High Low Low Low
Trackout Negligible Negligible Negligible Negligible
Stanwell Moor Demolition Medium Negligible Medium Negligible
Earthworks Medium Negligible Low Negligible
Construction Low Low Low Negligible
Trackout Negligible Negligible Negligible Negligible
Poyle Demolition High Negligible Medium Negligible
Earthworks Low Negligible Low Negligible
Construction Medium Negligible Low Negligible
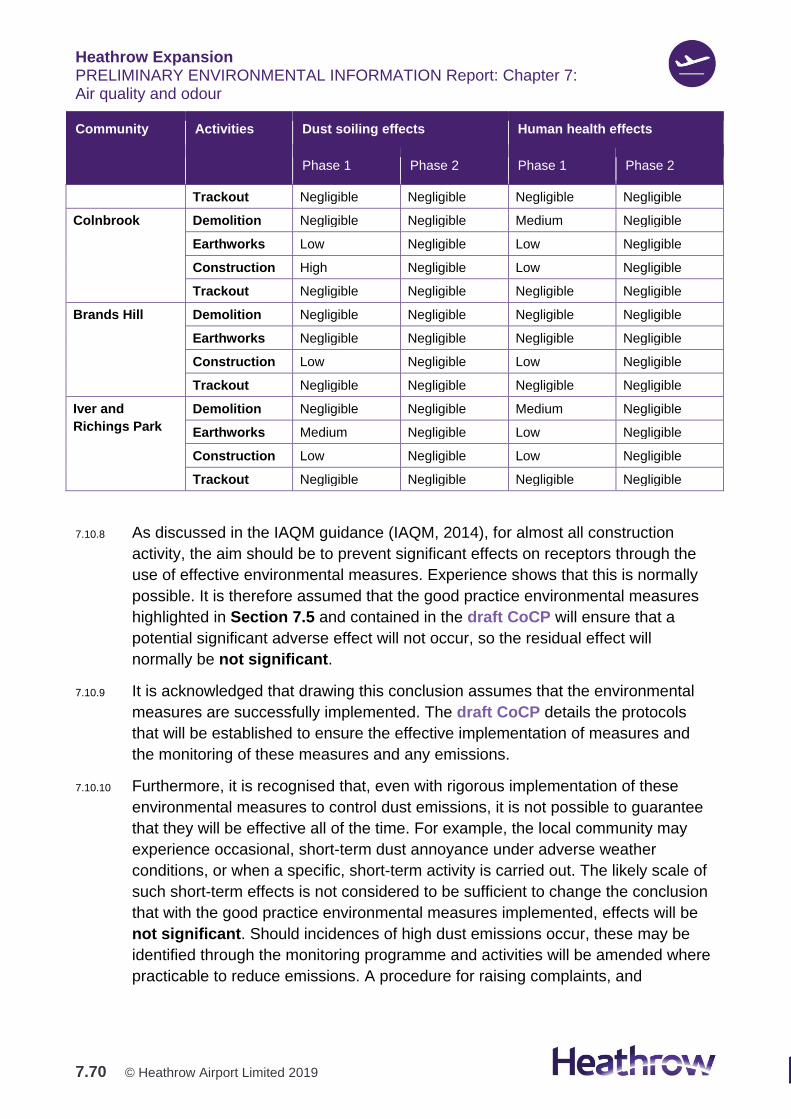
Heathrow Expansion PRELIMINARY ENVIRONMENTAL INFORMATION Report: Chapter 7: Air quality and odour
7.70 © Heathrow Airport Limited 2019
Community Activities Dust soiling effects Human health effects
Phase 1 Phase 2 Phase 1 Phase 2
Trackout Negligible Negligible Negligible Negligible
Colnbrook Demolition Negligible Negligible Medium Negligible
Earthworks Low Negligible Low Negligible
Construction High Negligible Low Negligible
Trackout Negligible Negligible Negligible Negligible
Brands Hill Demolition Negligible Negligible Negligible Negligible
Earthworks Negligible Negligible Negligible Negligible
Construction Low Negligible Low Negligible
Trackout Negligible Negligible Negligible Negligible
Iver and
Richings Park
Demolition Negligible Negligible Medium Negligible
Earthworks Medium Negligible Low Negligible
Construction Low Negligible Low Negligible
Trackout Negligible Negligible Negligible Negligible
7.10.8 As discussed in the IAQM guidance (IAQM, 2014), for almost all construction
activity, the aim should be to prevent significant effects on receptors through the
use of effective environmental measures. Experience shows that this is normally
possible. It is therefore assumed that the good practice environmental measures
highlighted in Section 7.5 and contained in the draft CoCP will ensure that a
potential significant adverse effect will not occur, so the residual effect will
normally be not significant.
7.10.9 It is acknowledged that drawing this conclusion assumes that the environmental
measures are successfully implemented. The draft CoCP details the protocols
that will be established to ensure the effective implementation of measures and
the monitoring of these measures and any emissions.
7.10.10 Furthermore, it is recognised that, even with rigorous implementation of these
environmental measures to control dust emissions, it is not possible to guarantee
that they will be effective all of the time. For example, the local community may
experience occasional, short-term dust annoyance under adverse weather
conditions, or when a specific, short-term activity is carried out. The likely scale of
such short-term effects is not considered to be sufficient to change the conclusion
that with the good practice environmental measures implemented, effects will be
not significant. Should incidences of high dust emissions occur, these may be
identified through the monitoring programme and activities will be amended where
practicable to reduce emissions. A procedure for raising complaints, and
Heathrow Expansion PRELIMINARY ENVIRONMENTAL INFORMATION Report: Chapter 7: Air quality and odour
7.71 © Heathrow Airport Limited 2019
subsequent investigation will also be established. Further detail is available in the
draft CoCP.
Odour
7.10.11 Table 7.25 summarises the results from the risk-based assessment of odour
relating to construction activities. This assumes that there are odorous emissions
during earthworks. Contaminated materials may be excavated during the DCO
Project, the excavated materials could contain volatile compounds that may give
rise to odour impacts in early phases of the construction period. All community
areas contain high sensitivity receptors.
7.10.12 As with construction dust, for almost all construction activity, the aim should be to
prevent significant effects on receptors due to odour through the use of effective
environmental measures. Experience shows that this is normally possible. For this
reason, although the nature of potentially odorous emissions is not fully
understood at this stage and the hedonic tone could potentially be offensive, the
source is considered to have a medium odour potential. This is in accordance with
IAQM (2018) guidance in which one consideration for classifying sources as
having a medium odour potential refers there being ‘some mitigation measures in
place, but significant residual odour remains’.
7.10.13 It is important to note that the risk-based assessment is not a prediction of what
will actually occur during the construction of the DCO Project but the potential for
occurrences, based on the meteorological data available from Heathrow Airport.
Furthermore, emission of an odour does not mean that any of the receptors will
experience an effect on amenity or be caused to raise a complaint.
7.10.14 Areas towards the south and south-east of the Airport are less likely to have odour
emissions dispersed towards them. This is because prevailing winds at Heathrow
are predominantly from the west, south-west and, to a lesser extent, the
north-east, and because the main earthworks activities are to the north-west of the
site. The wind rose is shown in Graphic 7.2.
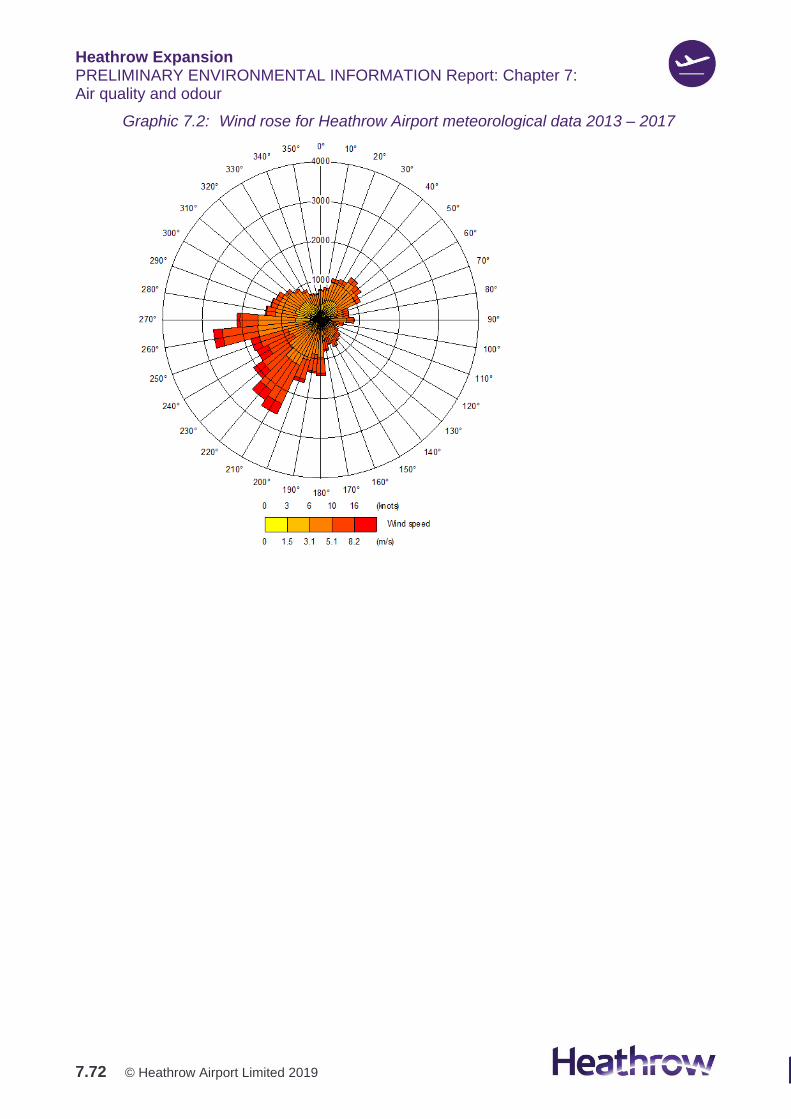
Heathrow Expansion PRELIMINARY ENVIRONMENTAL INFORMATION Report: Chapter 7: Air quality and odour
7.72 © Heathrow Airport Limited 2019
Graphic 7.2: Wind rose for Heathrow Airport meteorological data 2013 – 2017
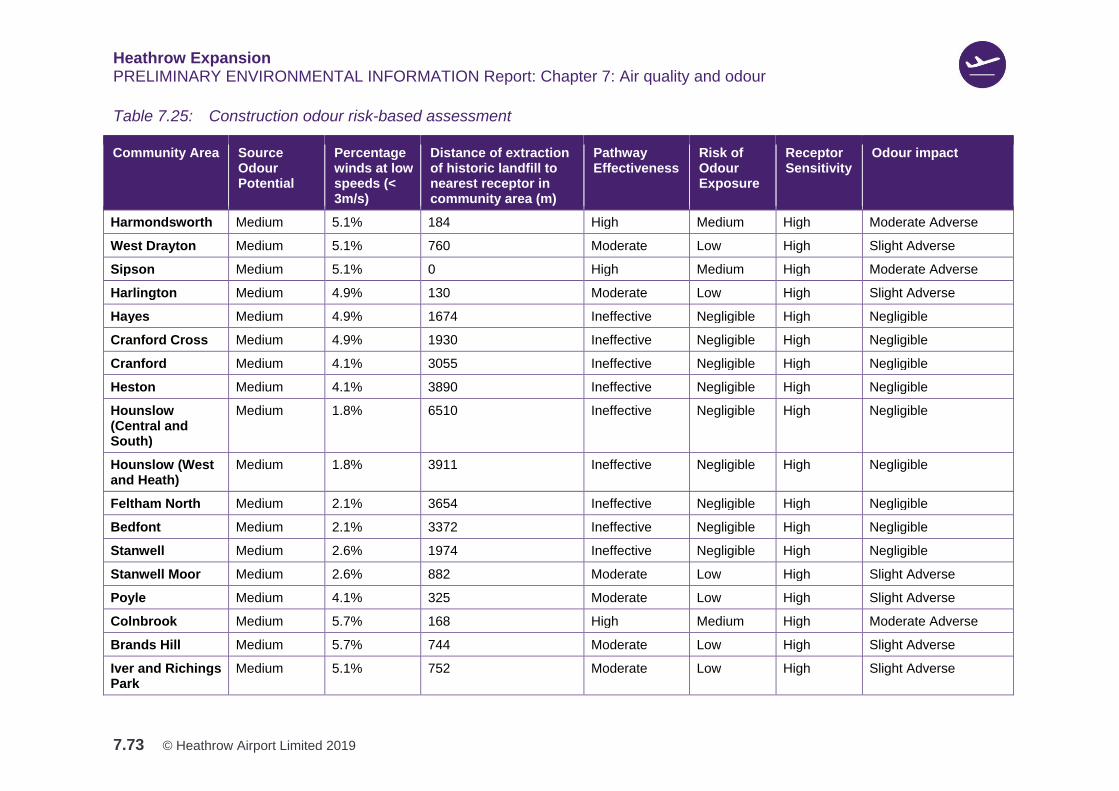
Heathrow Expansion PRELIMINARY ENVIRONMENTAL INFORMATION Report: Chapter 7: Air quality and odour
7.73 © Heathrow Airport Limited 2019
Table 7.25: Construction odour risk-based assessment
Community Area Source Odour Potential
Percentage winds at low speeds (< 3m/s)
Distance of extraction of historic landfill to nearest receptor in community area (m)
Pathway Effectiveness
Risk of Odour Exposure
Receptor Sensitivity
Odour impact
Harmondsworth Medium 5.1% 184 High Medium High Moderate Adverse
West Drayton Medium 5.1% 760 Moderate Low High Slight Adverse
Sipson Medium 5.1% 0 High Medium High Moderate Adverse
Harlington Medium 4.9% 130 Moderate Low High Slight Adverse
Hayes Medium 4.9% 1674 Ineffective Negligible High Negligible
Cranford Cross Medium 4.9% 1930 Ineffective Negligible High Negligible
Cranford Medium 4.1% 3055 Ineffective Negligible High Negligible
Heston Medium 4.1% 3890 Ineffective Negligible High Negligible
Hounslow (Central and South)
Medium 1.8% 6510 Ineffective Negligible High Negligible
Hounslow (West and Heath)
Medium 1.8% 3911 Ineffective Negligible High Negligible
Feltham North Medium 2.1% 3654 Ineffective Negligible High Negligible
Bedfont Medium 2.1% 3372 Ineffective Negligible High Negligible
Stanwell Medium 2.6% 1974 Ineffective Negligible High Negligible
Stanwell Moor Medium 2.6% 882 Moderate Low High Slight Adverse
Poyle Medium 4.1% 325 Moderate Low High Slight Adverse
Colnbrook Medium 5.7% 168 High Medium High Moderate Adverse
Brands Hill Medium 5.7% 744 Moderate Low High Slight Adverse
Iver and Richings Park
Medium 5.1% 752 Moderate Low High Slight Adverse
Heathrow Expansion PRELIMINARY ENVIRONMENTAL INFORMATION Report: Chapter 7: Air quality and odour
7.74 © Heathrow Airport Limited 2019
7.10.15 It is assumed that the good practice environmental measures highlighted in
Section 7.5 and contained in the draft CoCP will ensure that significant adverse
effects resulting from odour emissions associated with earthworks will not occur,
so the residual effect will normally be not significant.
7.10.16 It is possible that local communities may experience occasional, short-term odour
annoyance under specific weather conditions, or when a specific, short-term
activity is carried out. The likely scale of such short-term effects is not considered
to be sufficient to change the conclusion that with the good practice environmental
measures implemented, effects will be not significant. Should incidences of high
odour emissions occur, these may be identified through the monitoring programme
and activities will be amended where practicable to reduce emissions, including
application of further mitigation measures where appropriate. A procedure for
raising complaints, and subsequent investigation will also be established. Further
detail is available in the draft CoCP.
Pollutant concentrations during construction and operation
Overview
7.10.17 Concentrations of NO2, PM10, PM2.5 and SO2 have been modelled both without the
DCO Project and with the DCO Project in 2022, 2027, 2030 and 2035. Contours of
predicted NO2 concentration with the DCO Project in 2022, 2027, 2030 and 2035
are shown in Figure 7.7 to Figure 7.10, Volume 2.
7.10.18 The results for each community area are discussed individually to highlight the
likely changes in local air quality within each of them. The magnitude of impacts in
each community area are described using the EPUK/IAQM (2017) matrix in Table
7.16 which takes account of predicted concentrations, and the magnitude of
change. NO2 concentrations produced using the CURED sensitivity test are shown
in Appendix 7.1.
7.10.19 The overall conclusion on significance in relation to NO2 is then drawn on the
basis of predicted concentrations and changes in concentrations as a result of the
DCO Project at receptors across the Core AQO Assessment Area.
7.10.20 It should be noted that the road traffic data used to assess impacts in 2022 is
preliminary. It does not take full account of the proposed measures to manage
construction traffic. The CTMP and CWTP discussed in Section 7.5 will be
developed further in advance of the DCO application. The magnitude of impacts
presented here is therefore likely to be greater than when these mitigation
measures are taken into account. Results of the assessment using refined
construction phase modelling will be presented in the ES.
Heathrow Expansion PRELIMINARY ENVIRONMENTAL INFORMATION Report: Chapter 7: Air quality and odour
7.75 © Heathrow Airport Limited 2019
7.10.21 It is recognised that due to the natural upgrade of the national road vehicle fleet to
cleaner models over time, average emissions within each vehicle category, and -
also background pollutant concentrations, will decrease (Defra, 2017a). For this
reason, despite emissions associated with the North West Runway and increased
activity associated with the DCO Project (including airfield and LTO activities), air
quality is predicted to improve in future years at locations of relevant exposure.
Pollutant concentrations are predicted to be lower in 2027 than in the current
baseline years and even lower in 2035 and 2050 despite increases in airport
activity associated with the DCO Project.
7.10.22 It is important to note that the pollutant concentrations presented for 2035 are
higher than would be expected in reality as 2030 background maps and emission
factors have been used, as this is the latest date for which such projections are
available from Defra.
7.10.23 In addition, emissions per aircraft will decrease further. Through its Committee on
Aviation Environmental Protection (CAEP), the International Civil Aviation
Organization (ICAO) sets new emission standards for aircraft engines, including
for NOX. Engine models which were certified on or after 1 January 2014 must meet
CAEP8, the latest standard for NOX. The number of aircraft movements at
Heathrow made by CAEP8 aircraft increased to 28.6% at the end of 2018 and the
percentage continues to rise (Heathrow, 2019).
Short-term AQOs
7.10.24 Annual mean NO2 concentrations with the DCO Project are predicted to be below
60μg/m3 at all of the receptor locations in all modelled years and it is, therefore,
unlikely that the 1-hour mean NO2 AQO (200 µg/m3 not to be exceeded more than
18 times a year) will be exceeded. Results are not discussed further in relation to
this AQO.
7.10.25 Annual mean PM10 concentrations with the DCO Project are predicted to be below
32μg/m3 and it is, therefore, unlikely that the 24-hour mean PM10 AQO (50 µg/m3
not to be exceeded more than 35 times a year) will be exceeded at any of the
receptors. Results are not discussed further in relation to this AQO. There are no
short-term AQOs for PM2.5.
7.10.26 SO2 emissions from aircraft have been modelled, in order to allow assessment
against the SO2 objectives, all of which are short-term AQOs. These are the 15-
minute mean (266µg/m3 not to be exceeded more than 35 times a year), 1-hour
mean (350µg/m3 not to be exceeded more than 24 times a year) and 24-hour
mean (125µg/m3 not to be exceeded more than 3 times a year) AQOs. A common
way of assessing the risk of an exceedance of a short-term objective is to add the
concentration for the relevant percentile to two times the annual mean
concentration, and to compare the total to the AQO level (Environment Agency,
Heathrow Expansion PRELIMINARY ENVIRONMENTAL INFORMATION Report: Chapter 7: Air quality and odour
7.76 © Heathrow Airport Limited 2019
2016). There is no background monitor measuring SO2 close to Heathrow Airport,
with the nearest AURN site being in North Kensington. The annual mean SO2
concentration measured here in 2018 was 1.4µg/m3. Taking this value as a
representative background concentration, in order for any objective to be
exceeded the contribution of aircraft emissions would need to exceed the following
levels at locations of relevant exposure:
1. the 99.9th percentile of 15-minute mean SO2 concentrations would need to
exceed 263µg/m3;
2. the 99.73th percentile of 1-hour mean SO2 concentrations would need to
exceed 347µg/m3; and
3. the 99.18th percentile of 24-hour mean SO2 concentrations would need to
exceed 122µg/m3.
7.10.27 Model results at receptors outside of the DCO Project boundary have been
interrogated to determine the maximum contribution of aircraft emissions to short-
term SO2 concentrations. The 2035 scenario with the DCO Project has been used
as it is the modelled scenario with the highest number of aircraft movements, and
thus the highest SO2 emissions.
7.10.28 The maximum contribution to the 99.9th percentile of 15-minute mean SO2
concentrations outside of the DCO Project boundary is 92.4µg/m3. The maximum
contribution to the 99.73th percentile of 1-hour mean SO2 concentrations outside of
the DCO Project boundary is 65.6µg/m3. The maximum contribution to the 99.18th
percentile of 24-hour mean SO2 concentrations outside of the DCO Project
boundary is 23.3µg/m3. The process contribution of the aircraft emissions will not
exceed the given levels outside of the Airport boundary, with all of the process
contributions being less than half of the calculated thresholds. As such, there is
considered to be no risk of exceedance of the SO2 objectives as a result of the
DCO Project.
Community area results
Harmondsworth
7.10.29 Table 7.26 shows dispersion modelling results at 35 selected representative
receptor locations, including those which are likely to be worst-case in terms of
likely air quality impacts and total concentrations, within Harmondsworth. NO2
concentrations with the DCO Project and impacts are shown in Figure 7.11 and
Figure 7.12 (CURED sensitivity test), Volume 2.
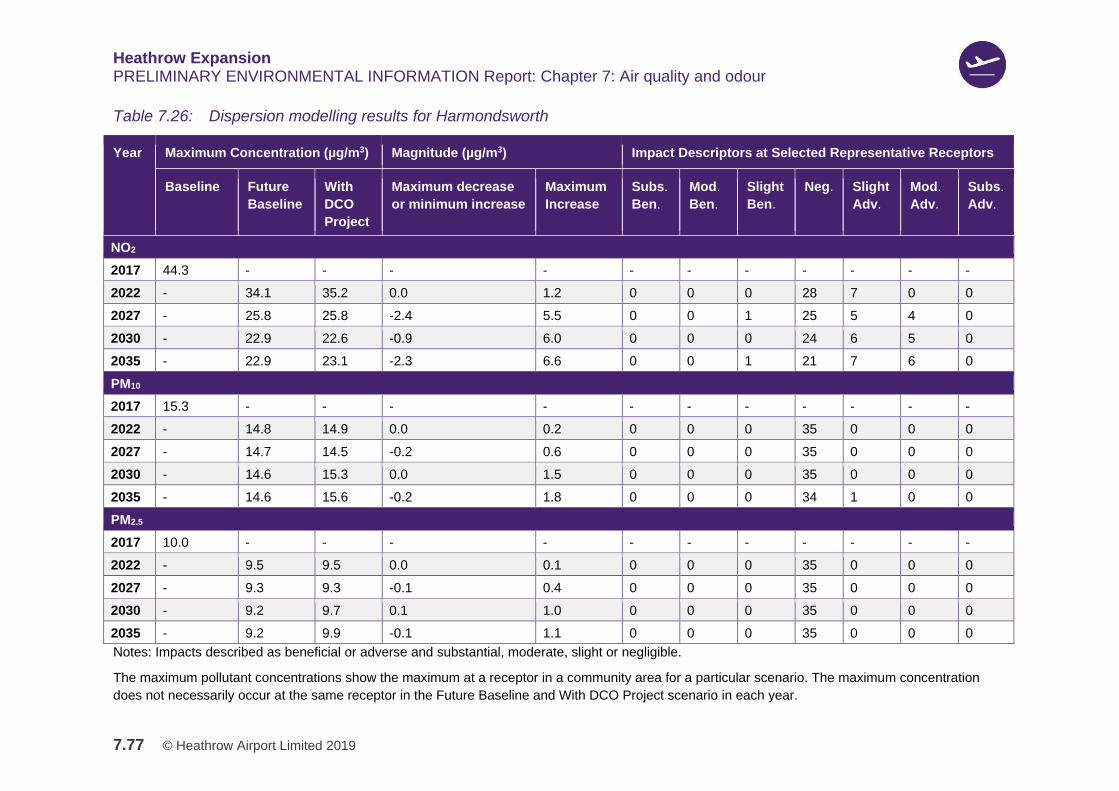
Heathrow Expansion PRELIMINARY ENVIRONMENTAL INFORMATION Report: Chapter 7: Air quality and odour
7.77 © Heathrow Airport Limited 2019
Table 7.26: Dispersion modelling results for Harmondsworth
Year Maximum Concentration (µg/m3) Magnitude (µg/m3) Impact Descriptors at Selected Representative Receptors
Baseline Future
Baseline
With
DCO
Project
Maximum decrease
or minimum increase
Maximum
Increase
Subs.
Ben.
Mod.
Ben.
Slight
Ben.
Neg. Slight
Adv.
Mod.
Adv.
Subs.
Adv.
NO2
2017 44.3 - - - - - - - - - - -
2022 - 34.1 35.2 0.0 1.2 0 0 0 28 7 0 0
2027 - 25.8 25.8 -2.4 5.5 0 0 1 25 5 4 0
2030 - 22.9 22.6 -0.9 6.0 0 0 0 24 6 5 0
2035 - 22.9 23.1 -2.3 6.6 0 0 1 21 7 6 0
PM10
2017 15.3 - - - - - - - - - - -
2022 - 14.8 14.9 0.0 0.2 0 0 0 35 0 0 0
2027 - 14.7 14.5 -0.2 0.6 0 0 0 35 0 0 0
2030 - 14.6 15.3 0.0 1.5 0 0 0 35 0 0 0
2035 - 14.6 15.6 -0.2 1.8 0 0 0 34 1 0 0
PM2.5
2017 10.0 - - - - - - - - - - -
2022 - 9.5 9.5 0.0 0.1 0 0 0 35 0 0 0
2027 - 9.3 9.3 -0.1 0.4 0 0 0 35 0 0 0
2030 - 9.2 9.7 0.1 1.0 0 0 0 35 0 0 0
2035 - 9.2 9.9 -0.1 1.1 0 0 0 35 0 0 0
Notes: Impacts described as beneficial or adverse and substantial, moderate, slight or negligible.
The maximum pollutant concentrations show the maximum at a receptor in a community area for a particular scenario. The maximum concentration
does not necessarily occur at the same receptor in the Future Baseline and With DCO Project scenario in each year.
Heathrow Expansion PRELIMINARY ENVIRONMENTAL INFORMATION Report: Chapter 7: Air quality and odour
7.78 © Heathrow Airport Limited 2019
7.10.30 In 2022, the maximum predicted increases in annual mean NO2 concentrations is
1.2μg/m3 (3% of the 40μg/m3 AQO) at a receptor close to the A4 Bath Road. The
maximum total concentration within Harmondsworth with the DCO Project is
35.2μg/m3, which is below the AQO. Of the 35 receptors modelled in
Harmondsworth, 28 are predicted to experience negligible impacts, with seven
predicted to experience slight adverse impacts. These conclusions remain
unchanged with the CURED sensitivity test.
7.10.31 In 2027, the maximum predicted increase in annual mean NO2 concentration is
5.5μg/m3 (14% of the 40μg/m3 AQO) at a receptor on Hatch Lane closest to the
North West Runway. The maximum total concentration within Harmondsworth with
the DCO Project is 25.8μg/m3, which is below the AQO. The maximum decrease
in annual mean concentration is 2.4μg/m3 at a receptor on Holloway Lane, where
traffic flows will be reduced due to the new A3044 configuration. Of the 35
receptors modelled in Harmondsworth, 25 are predicted to experience negligible
impacts, with one slight beneficial, five slight adverse and four moderate adverse
impacts. One of the moderate adverse impacts is reduced to slight adverse under
the CURED sensitivity test and one of the negligible impacts becomes slight
beneficial as the impact of reduced traffic flows is enhanced in the sensitivity test,
but the impact of increased ATMs remains.
7.10.32 In 2030, the maximum predicted increase in annual mean NO2 concentration is
6μg/m3 (15% of the 40μg/m3 AQO) at a receptor on Hatch Lane closest to the
North West Runway. The maximum total concentration within Harmondsworth with
the DCO Project is 22.6μg/m3, which is below the AQO. The maximum decrease
in annual mean concentration is 0.9μg/m3 at a receptor on Holloway Lane. Of the
35 receptors modelled in Harmondsworth, 24 are predicted to experience
negligible impacts, with six slight adverse and five moderate adverse impacts. One
of the moderate adverse impacts is reduced to slight adverse under the CURED
sensitivity test and there are two receptors with slight beneficial impacts.
7.10.33 In 2035, the maximum predicted increase in annual mean NO2 concentrations is
6.6μg/m3 (17% of the 40μg/m3 AQO) at a receptor on Hatch Lane closest to the
North West Runway. The maximum total concentration within Harmondsworth with
the DCO Project is 23.1μg/m3, which is below the AQO. The maximum decrease
in annual mean concentration is 2.3μg/m3 at a receptor on Holloway Lane. Of the
35 receptors modelled in Harmondsworth, 21 are predicted to experience
negligible impacts, with one slight beneficial, seven slight adverse and six
moderate adverse impacts. One of the moderate adverse impacts is reduced to
slight adverse, and eight of the negligible changes become slight beneficial under
the CURED sensitivity test. Under this test a moderate beneficial impact is
predicted at one receptor.
Heathrow Expansion PRELIMINARY ENVIRONMENTAL INFORMATION Report: Chapter 7: Air quality and odour
7.79 © Heathrow Airport Limited 2019
7.10.34 The maximum predicted annual mean PM concentrations occur at receptors close
to the A4 Bath Road. Annual mean PM10 and PM2.5 concentrations are predicted to
be well below the annual mean AQOs at all receptors in Harmondsworth in all
modelled years both without and with the DCO Project.
7.10.35 The maximum predicted increases in annual mean PM concentrations range from
around 0.2μg/m3 and 0.1μg/m3 for PM10 and PM2.5 respectively in 2022 at
receptors close to the A4 Bath Road, to 1.8μg/m3 and 1.1μg/m3 respectively in
2035 at receptors close to the A3044 Hatch Lane. All 35 receptors modelled in
Harmondsworth are predicted to experience negligible impacts from 2022 to 2030.
In 2035 one receptor close to the A3044 Hatch Lane is predicted to experience a
slight adverse impact, and all other receptors are predicted to experience
negligible impacts.
West Drayton
7.10.36 Table 7.27 shows dispersion modelling results at 26 selected representative
receptor locations, including those which are likely to be worst-case in terms of
likely air quality impacts and total concentrations, within West Drayton. NO2
concentrations with the DCO Project and impacts are shown in Figure 7.13 and
Figure 7.14 (CURED sensitivity test), Volume 2.

Heathrow Expansion PRELIMINARY ENVIRONMENTAL INFORMATION Report: Chapter 7: Air quality and odour
7.80 © Heathrow Airport Limited 2019
Table 7.27: Dispersion modelling results for West Drayton
Year Maximum Concentration (µg/m3) Magnitude (µg/m3) Impact Descriptors at Selected Representative Receptors
Baseline Future
Baseline
With
DCO
Project
Maximum decrease
or minimum increase
Maximum
Increase
Subs.
Ben.
Mod.
Ben.
Slight
Ben.
Neg. Slight
Adv.
Mod.
Adv.
Subs.
Adv.
NO2
2017 56.6 - - - - - - - - - - -
2022 - 43.6 44.0 0.0 1.6 0 0 0 22 2 2 0
2027 - 32.3 33.7 0.3 2.1 0 0 0 23 3 0 0
2030 - 28.4 29.4 0.4 1.7 0 0 0 26 0 0 0
2035 - 28.7 29.8 0.4 2.3 0 0 0 23 3 0 0
PM10
2017 17.0 - - - - - - - - - - -
2022 - 16.5 16.5 0.0 0.1 0 0 0 26 0 0 0
2027 - 16.3 16.6 0.0 0.3 0 0 0 26 0 0 0
2030 - 16.2 16.5 0.0 0.3 0 0 0 26 0 0 0
2035 - 16.3 16.6 0.0 0.3 0 0 0 26 0 0 0
PM2.5
2017 10.8 - - - - - - - - - - -
2022 - 10.3 10.3 0.0 0.1 0 0 0 26 0 0 0
2027 - 10.1 10.2 0.0 0.2 0 0 0 26 0 0 0
2030 - 10.0 10.1 0.0 0.2 0 0 0 26 0 0 0
2035 - 10.1 10.2 0.0 0.2 0 0 0 26 0 0 0
Notes: Impacts described as beneficial or adverse and substantial, moderate, slight or negligible.
The maximum pollutant concentrations show the maximum at a receptor in a community area for a particular scenario. The maximum concentration
does not necessarily occur at the same receptor in the Future Baseline and With DCO Project scenario in each year.
Heathrow Expansion PRELIMINARY ENVIRONMENTAL INFORMATION Report: Chapter 7: Air quality and odour
7.81 © Heathrow Airport Limited 2019
7.10.37 In 2022, the maximum predicted increase in annual mean NO2 concentration is
1.6μg/m3 (4% of the 40μg/m3 AQO) at a receptor close to the M4. The maximum
total concentration within West Drayton with the DCO Project is 44.0μg/m3, which
is above the AQO. The AQO is also predicted to be exceeded in the future
baseline. Of the 26 receptors modelled in West Drayton, 22 are predicted to
experience negligible impacts, with two predicted to experience slight adverse
impacts, and two predicted to experience moderate adverse impacts. With the
CURED sensitivity test, 15 are predicted to experience negligible impacts, six are
predicted to experience slight adverse impacts and five are predicted to
experience moderate adverse impacts.
7.10.38 In 2027, the maximum predicted increase in annual mean NO2 concentration is
2.1μg/m3 (5% of the 40μg/m3 AQO) at a receptor close to the M4. The maximum
total concentration within West Drayton with the DCO Project is 33.7μg/m3, which
is below the AQO. Of the 26 receptors modelled in West Drayton, 23 are predicted
to experience negligible impacts, with three predicted to experience slight adverse
impacts. With the CURED sensitivity test, 10 are predicted to experience negligible
impacts, 14 are predicted to experience slight adverse impacts and two are
predicted to experience moderate adverse impacts.
7.10.39 In 2030, the maximum predicted increase in annual mean NO2 concentration is
1.7μg/m3 (4% of the 40μg/m3 AQO) at a receptor close to the M4. The maximum
total concentration within West Drayton with the DCO Project is 29.4μg/m3, which
is below the AQO. All 26 receptors modelled in West Drayton in 2030 are
predicted to experience negligible impacts. With the CURED sensitivity test, 16 are
predicted to experience negligible impacts, nine are predicted to experience slight
adverse impacts and one is predicted to experience a moderate adverse impact.
7.10.40 In 2035, the maximum predicted increase in annual mean NO2 concentration is
2.3μg/m3 (6% of the 40μg/m3 AQO) at a receptor close to the M4. The maximum
total concentration within West Drayton with the DCO Project is 29.8μg/m3, which
is below the AQO. Of the 26 receptors modelled in West Drayton in 2035, 23 are
predicted to experience negligible impacts, with three predicted to experience
slight adverse impacts. With the CURED sensitivity test, 15 are predicted to
experience negligible impacts, five are predicted to experience slight adverse
impacts and six are predicted to experience moderate adverse impacts.
7.10.41 The maximum predicted annual mean PM concentrations occur at receptors close
to the M4. Annual mean PM10 and PM2.5 concentrations are predicted to be well
below the annual mean AQOs at all receptors in West Drayton in all modelled
years both without and with the DCO Project.
7.10.42 The maximum predicted increases in annual mean PM concentrations range from
0.1μg/m3 for PM10 and PM2.5 in 2022 at receptors close to the M4, to 0.3μg/m3 and
Heathrow Expansion PRELIMINARY ENVIRONMENTAL INFORMATION Report: Chapter 7: Air quality and odour
7.82 © Heathrow Airport Limited 2019
0.2μg/m3 for PM10 and PM2.5 respectively in 2035. All 26 receptors modelled in
West Drayton are predicted to experience negligible impacts in all years.
Sipson
7.10.43 Table 7.28 shows dispersion modelling results at 31 selected representative
receptor locations, including those which are likely to be worst-case in terms of
likely air quality impacts and total concentrations, within Sipson. NO2
concentrations with the DCO Project and impacts are shown in Figure 7.15 and
Figure 7.16 (CURED sensitivity test), Volume 2.

Heathrow Expansion PRELIMINARY ENVIRONMENTAL INFORMATION Report: Chapter 7: Air quality and odour
7.83 © Heathrow Airport Limited 2019
Table 7.28: Dispersion modelling results for Sipson
Year Maximum Concentration (µg/m3) Magnitude (µg/m3) Impact Descriptors at Selected Representative Receptors
Baseline Future
Baseline
With
DCO
Project
Maximum decrease
or minimum increase
Maximum
Increase
Subs.
Ben.
Mod.
Ben.
Slight
Ben.
Neg. Slight
Adv.
Mod.
Adv.
Subs.
Adv.
NO2
2017 35.5 - - - - - - - - - - -
2022 - 27.9 28.3 0.1 0.6 0 0 0 31 0 0 0
2027 - 21.1 22.8 1.5 5.1 0 0 0 7 20 4 0
2030 - 18.8 20.6 1.5 4.9 0 0 0 6 19 6 0
2035 - 19.1 21.0 1.9 5.2 0 0 0 3 11 17 0
PM10
2017 15.7 - - - - - - - - - - -
2022 - 15.2 15.3 0.0 0.1 0 0 0 31 0 0 0
2027 - 15.1 15.2 0.0 0.2 0 0 0 31 0 0 0
2030 - 15.0 15.2 0.0 0.2 0 0 0 31 0 0 0
2035 - 15.1 15.2 0.0 0.2 0 0 0 31 0 0 0
PM2.5
2017 10.0 - - - - - - - - - - -
2022 - 9.6 9.7 0.0 0.0 0 0 0 31 0 0 0
2027 - 9.4 9.5 0.0 0.1 0 0 0 31 0 0 0
2030 - 9.4 9.5 0.0 0.2 0 0 0 31 0 0 0
2035 - 9.4 9.5 0.0 0.2 0 0 0 31 0 0 0
Notes: Impacts described as beneficial or adverse and substantial, moderate, slight or negligible.
The maximum pollutant concentrations show the maximum at a receptor in a community area for a particular scenario. The maximum concentration
does not necessarily occur at the same receptor in the Future Baseline and With DCO Project scenario in each year.
Heathrow Expansion PRELIMINARY ENVIRONMENTAL INFORMATION Report: Chapter 7: Air quality and odour
7.84 © Heathrow Airport Limited 2019
7.10.44 In 2022, the maximum predicted increase in annual mean NO2 concentration is
0.6μg/m3 (2% of the 40μg/m3 AQO) at a receptor close to Sipson Way. The
maximum total concentration within Sipson with the DCO Project is 28.3μg/m3,
which is below the AQO. All 31 receptors modelled in Sipson are predicted to
experience negligible impacts in 2022. This remains the case with the CURED
sensitivity test.
7.10.45 In 2027, the maximum predicted increase in annual mean NO2 concentration is
5.1μg/m3 (13% of the 40μg/m3 AQO) at a receptor close to Harmondsworth Lane.
The maximum total concentration within Sipson with the DCO Project is
22.8μg/m3, which is below the AQO. Of the 31 receptors modelled in Sipson in
2027, seven are predicted to experience negligible impacts, with 20 predicted to
experience slight adverse impacts and four, moderate adverse impacts. With the
CURED sensitivity test, one slight adverse impact is reduced to negligible.
7.10.46 In 2030, the maximum predicted increase in annual mean NO2 concentration is
4.9μg/m3 (12% of the 40μg/m3 AQO). The maximum total concentration within
Sipson with the DCO Project is 20.6μg/m3, which is below the AQO. Of the 31
receptors modelled in Sipson in 2030, six are predicted to experience negligible
impacts, with 19 predicted to experience slight adverse impacts and six, moderate
adverse impacts. With the CURED sensitivity test, eight are predicted to
experience negligible impacts, with 20 predicted to experience slight adverse
impacts and three predicted to experience moderate adverse impacts.
7.10.47 In 2035, the maximum predicted increase in annual mean NO2 concentration is
5.2μg/m3 (13% of the 40μg/m3 AQO). The maximum total concentration within
Sipson with the DCO Project is 21.0μg/m3, which is below the AQO. Of the 31
receptors modelled in Sipson in 2035, three are predicted to experience negligible
impacts, with 11 predicted to experience slight adverse impacts and 17 predicted
to experience moderate adverse impacts. With the CURED sensitivity test, seven
are predicted to experience negligible impacts, 19 are predicted to experience
slight adverse impacts and five are predicted to experience moderate adverse
impacts.
7.10.48 Annual mean PM10 and PM2.5 concentrations are predicted to be well below the
annual mean AQOs at all receptors in Sipson in all modelled years both without
and with the DCO Project.
7.10.49 The maximum predicted increases in annual mean concentrations range from
0.1μg/m3 for PM10 and below 0.0μg/m3 for PM2.5 in 2022, to 0.2μg/m3 for both
PM10 and PM2.5 in 2035. All 31 receptors modelled in Sipson are predicted to
experience negligible impacts in all years.
Heathrow Expansion PRELIMINARY ENVIRONMENTAL INFORMATION Report: Chapter 7: Air quality and odour
7.85 © Heathrow Airport Limited 2019
Harlington
7.10.50 Table 7.29 shows dispersion modelling results at 20 selected representative
receptor locations, including those which are likely to be worst-case in terms of
likely air quality impacts and total concentrations, within Harlington. NO2
concentrations with the DCO Project and impacts are shown in Figure 7.17 and
Figure 7.18 (CURED sensitivity test), Volume 2.

Heathrow Expansion PRELIMINARY ENVIRONMENTAL INFORMATION Report: Chapter 7: Air quality and odour
7.86 © Heathrow Airport Limited 2019
Table 7.29: Dispersion modelling results for Harlington
Year Maximum Concentration (µg/m3) Magnitude (µg/m3) Impact Descriptors at Selected Representative Receptors
Baseline Future
Baseline
With
DCO
Project
Maximum decrease
or minimum increase
Maximum
Increase
Subs.
Ben.
Mod.
Ben.
Slight
Ben.
Neg. Slight
Adv.
Mod.
Adv.
Subs.
Adv.
NO2
2017 52.0 - - - - - - - - - - -
2022 - 42.1 42.7 0.2 1.0 0 0 0 18 1 0 1
2027 - 30.8 30.8 -0.4 4.3 0 0 0 17 2 1 0
2030 - 26.7 27.0 0.3 3.7 0 0 0 17 3 0 0
2035 - 26.9 27.1 0.2 3.6 0 0 0 15 5 0 0
PM10
2017 17.4 - - - - - - - - - - -
2022 - 16.9 17.0 0.0 0.2 0 0 0 20 0 0 0
2027 - 16.7 16.7 -0.1 0.5 0 0 0 20 0 0 0
2030 - 16.6 16.7 0.0 0.4 0 0 0 20 0 0 0
2035 - 16.7 16.6 -0.1 0.4 0 0 0 20 0 0 0
PM2.5
2017 11.1 - - - - - - - - - - -
2022 - 10.6 10.6 0.0 0.1 0 0 0 20 0 0 0
2027 - 10.3 10.3 0.0 0.3 0 0 0 20 0 0 0
2030 - 10.2 10.2 0.0 0.3 0 0 0 20 0 0 0
2035 - 10.2 10.2 0.0 0.2 0 0 0 20 0 0 0
Notes: Impacts described as beneficial or adverse and substantial, moderate, slight or negligible.
The maximum pollutant concentrations show the maximum at a receptor in a community area for a particular scenario. The maximum concentration
does not necessarily occur at the same receptor in the Future Baseline and With DCO Project scenario in each year.
Heathrow Expansion PRELIMINARY ENVIRONMENTAL INFORMATION Report: Chapter 7: Air quality and odour
7.87 © Heathrow Airport Limited 2019
7.10.51 In 2022, the maximum predicted increase in annual mean NO2 concentration is
1.0μg/m3 (3% of the 40μg/m3 AQO) at a receptor close to the A408 Sipson Road.
The maximum total concentration within Harlington with the DCO Project is
42.7μg/m3, which is above the AQO. Of the 20 receptors modelled in Harlington,
18 are predicted to experience negligible impacts in 2022, with one predicted to
experience a slight adverse impact and one predicted to experience a substantial
adverse impact. With the CURED sensitivity test, 14 are predicted to experience
negligible impacts, five are predicted to experience slight adverse impacts and one
is predicted to experience a substantial adverse impact.
7.10.52 In 2027, the maximum predicted increase in annual mean NO2 concentration is
4.3μg/m3 (11% of the 40μg/m3 AQO). The maximum total concentration within
Harlington with the DCO Project is 30.8μg/m3, which is below the AQO. Of the 20
receptors modelled in Harlington, 17 are predicted to experience negligible
impacts in 2027, with two predicted to experience slight adverse impacts and one
predicted to experience a moderate adverse impact. With the CURED sensitivity
test, one slight adverse impact is increased to moderate adverse.
7.10.53 In 2030, the maximum predicted increase in annual mean NO2 concentration is
3.7μg/m3 (9% of the 40μg/m3 AQO). The maximum total concentration within
Harlington with the DCO Project is 27.0μg/m3, which is below the AQO. Of the 20
receptors modelled in Harlington, 17 are predicted to experience negligible
impacts in 2030, with three predicted to experience slight adverse impacts. With
the CURED sensitivity test, one slight adverse impact is increased to moderate
adverse.
7.10.54 In 2035, the maximum predicted increase in annual mean NO2 concentration is
3.6μg/m3 (9% of the 40μg/m3 AQO). The maximum total concentration within
Harlington with the DCO Project is 27.1μg/m3, which is below the AQO. Of the 20
receptors modelled in Harlington, 15 are predicted to experience negligible
impacts in 2035, with five predicted to experience slight adverse impacts. With the
CURED sensitivity test, 14 are predicted to experience negligible impacts, and six
are predicted to experience slight adverse impacts.
7.10.55 The maximum predicted annual mean PM concentrations occur at receptors close
to the M4. Annual mean PM10 and PM2.5 concentrations are predicted to be well
below the annual mean AQOs at all receptors in Harlington in all modelled years
both without and with the DCO Project.
7.10.56 The maximum predicted increases in annual mean concentrations range from
0.2μg/m3 and 0.1μg/m3 for PM10 and PM2.5 respectively in 2022, to 0.4μg/m3 and
0.2μg/m3 in 2035. All twenty receptors modelled in Harlington are predicted to
experience negligible impacts in all years.
Heathrow Expansion PRELIMINARY ENVIRONMENTAL INFORMATION Report: Chapter 7: Air quality and odour
7.88 © Heathrow Airport Limited 2019
Hayes
7.10.57 Table 7.30 shows dispersion modelling results at 15 selected representative
receptor locations, including those which are likely to be worst-case in terms of
likely air quality impacts and total concentrations, within Hayes. NO2
concentrations with the DCO Project and impacts are shown in Figure 7.19 and
Figure 7.20, Volume 2.

Heathrow Expansion PRELIMINARY ENVIRONMENTAL INFORMATION Report: Chapter 7: Air quality and odour
7.89 © Heathrow Airport Limited 2019
Table 7.30: Dispersion modelling results for Hayes
Year Maximum Concentration (µg/m3) Magnitude (µg/m3) Impact Descriptors at Selected Representative Receptors
Baseline Future
Baseline
With
DCO
Project
Maximum decrease
or minimum increase
Maximum
Increase
Subs.
Ben.
Mod.
Ben.
Slight
Ben.
Neg. Slight
Adv.
Mod.
Adv.
Subs.
Adv.
NO2
2017 53.4 - - - - - - - - - - -
2022 - 42.0 42.5 0.2 0.6 0 0 0 12 3 0 0
2027 - 30.8 30.8 -0.1 0.5 0 0 0 15 0 0 0
2030 - 27.0 27.1 0.1 0.3 0 0 0 15 0 0 0
2035 - 27.3 27.5 0.1 0.5 0 0 0 15 0 0 0
PM10
2017 15.3 - - - - - - - - - - -
2022 - 14.8 14.9 0.0 0.2 0 0 0 15 0 0 0
2027 - 14.7 14.5 -0.2 0.6 0 0 0 15 0 0 0
2030 - 14.6 15.3 0.0 1.5 0 0 0 15 0 0 0
2035 - 14.6 15.6 -0.2 1.8 0 0 0 15 0 0 0
PM2.5
2017 10.0 - - - - - - - - - - -
2022 - 9.5 9.5 0.0 0.1 0 0 0 15 0 0 0
2027 - 9.3 9.3 -0.1 0.4 0 0 0 15 0 0 0
2030 - 9.2 9.7 0.1 1.0 0 0 0 15 0 0 0
2035 - 9.2 9.9 -0.1 1.1 0 0 0 15 0 0 0
Notes: Impacts described as beneficial or adverse and substantial, moderate, slight or negligible.
The maximum pollutant concentrations show the maximum at a receptor in a community area for a particular scenario. The maximum concentration
does not necessarily occur at the same receptor in the Future Baseline and With DCO Project scenario in each year.
Heathrow Expansion PRELIMINARY ENVIRONMENTAL INFORMATION Report: Chapter 7: Air quality and odour
7.90 © Heathrow Airport Limited 2019
7.10.58 In 2022, the maximum predicted increase in annual mean NO2 concentration is
0.6μg/m3 (2% of the 40μg/m3 AQO) at a receptor close to the M4 and the A437
High Street. The maximum total concentration within Hayes with the DCO Project
is 42.5μg/m3, which is above the AQO. Of the 15 receptors modelled in Hayes, 12
are predicted to experience negligible impacts in 2022, with three predicted to
experience slight adverse impacts. With the CURED sensitivity test, seven are
predicted to experience negligible impacts, three are predicted to experience slight
adverse impacts and five are predicted to experience substantial adverse impacts.
7.10.59 After 2022, the maximum predicted increase in annual mean NO2 concentration is
0.5μg/m3 (2027 and 2035). The maximum annual mean concentration predicted
with the DCO Project is 30.8μg/m3, 27.1μg/m3 and 27.5μg/m3 in 2027, 2030 and
2035 respectively. After 2022, all receptors modelled are predicted to experience
annual mean concentrations below the AQO of 40μg/m3 with and without the DCO
Project. All 15 modelled receptors are predicted to experience negligible impacts
after 2022. This remains unchanged with the CURED sensitivity test.
7.10.60 The maximum predicted annual mean PM concentrations occur at receptors close
to the M4 and the A437 High Street. Annual mean PM10 and PM2.5 concentrations
are predicted to be well below the annual mean AQOs at all receptors in Hayes in
all modelled years both without and with the DCO Project.
7.10.61 The maximum predicted increases in annual mean concentrations range from
0.1μg/m3 in 2022 to below 0.0μg/m3 in 2035 for PM10. Maximum predicted
increases in annual mean concentrations for PM2.5 are below 0.0μg/m3 for all years
modelled. All 15 receptors modelled in Hayes are predicted to experience
negligible impacts for all years.
Cranford Cross
7.10.62 Table 7.31 shows dispersion modelling results at 13 selected representative
receptor locations, including those which are likely to be worst-case in terms of
likely air quality impacts and total concentrations, within Cranford Cross. NO2
concentrations with the DCO Project and impacts are shown in Figure 7.21 and
Figure 7.22, Volume 2.
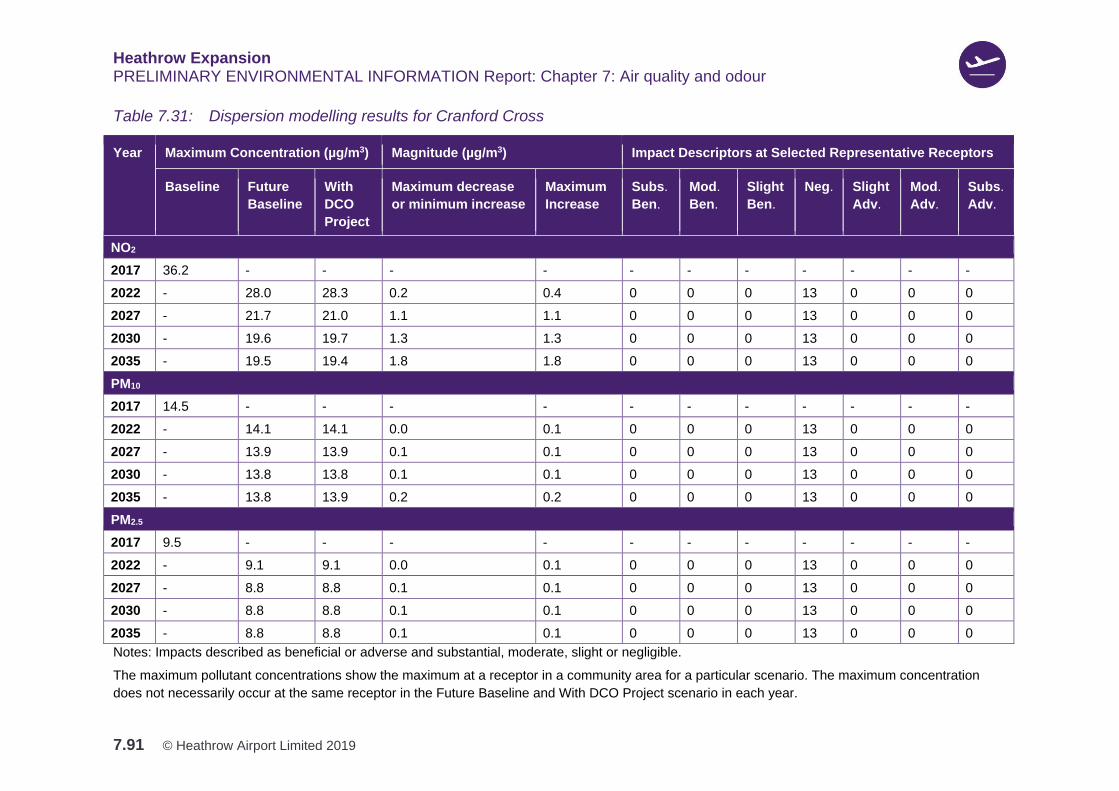
Heathrow Expansion PRELIMINARY ENVIRONMENTAL INFORMATION Report: Chapter 7: Air quality and odour
7.91 © Heathrow Airport Limited 2019
Table 7.31: Dispersion modelling results for Cranford Cross
Year Maximum Concentration (µg/m3) Magnitude (µg/m3) Impact Descriptors at Selected Representative Receptors
Baseline Future
Baseline
With
DCO
Project
Maximum decrease
or minimum increase
Maximum
Increase
Subs.
Ben.
Mod.
Ben.
Slight
Ben.
Neg. Slight
Adv.
Mod.
Adv.
Subs.
Adv.
NO2
2017 36.2 - - - - - - - - - - -
2022 - 28.0 28.3 0.2 0.4 0 0 0 13 0 0 0
2027 - 21.7 21.0 1.1 1.1 0 0 0 13 0 0 0
2030 - 19.6 19.7 1.3 1.3 0 0 0 13 0 0 0
2035 - 19.5 19.4 1.8 1.8 0 0 0 13 0 0 0
PM10
2017 14.5 - - - - - - - - - - -
2022 - 14.1 14.1 0.0 0.1 0 0 0 13 0 0 0
2027 - 13.9 13.9 0.1 0.1 0 0 0 13 0 0 0
2030 - 13.8 13.8 0.1 0.1 0 0 0 13 0 0 0
2035 - 13.8 13.9 0.2 0.2 0 0 0 13 0 0 0
PM2.5
2017 9.5 - - - - - - - - - - -
2022 - 9.1 9.1 0.0 0.1 0 0 0 13 0 0 0
2027 - 8.8 8.8 0.1 0.1 0 0 0 13 0 0 0
2030 - 8.8 8.8 0.1 0.1 0 0 0 13 0 0 0
2035 - 8.8 8.8 0.1 0.1 0 0 0 13 0 0 0
Notes: Impacts described as beneficial or adverse and substantial, moderate, slight or negligible.
The maximum pollutant concentrations show the maximum at a receptor in a community area for a particular scenario. The maximum concentration
does not necessarily occur at the same receptor in the Future Baseline and With DCO Project scenario in each year.
Heathrow Expansion PRELIMINARY ENVIRONMENTAL INFORMATION Report: Chapter 7: Air quality and odour
7.92 © Heathrow Airport Limited 2019
7.10.63 The maximum predicted annual mean NO2 concentrations occur at receptors close
to the A4 Bath Road. The maximum annual mean concentration predicted with the
DCO Project is 28.3μg/m3, 21.0μg/m3, 19.7μg/m3 and 19.4μg/m3 in 2022, 2027,
2030 and 2035 respectively and is therefore below the AQO of 40μg/m3 in all
modelled years.
7.10.64 The maximum predicted increases in annual mean concentrations range from
0.4μg/m3 in 2022 to 2.2μg/m3 in 2035. All 13 receptors modelled in Cranford Cross
are predicted to experience negligible impacts for all years. This conclusion
remains the case with the CURED sensitivity scenario.
7.10.65 The maximum predicted annual mean PM concentrations occur at receptors close
to the A4 Bath Road. Annual mean PM10 and PM2.5 concentrations are predicted to
be well below the annual mean AQOs at all receptors in Cranford Cross in all
modelled years both without and with the DCO Project.
7.10.66 The maximum predicted increases in annual mean concentrations are 0.1μg/m3
for PM10 and PM2.5 for all years. All 13 receptors modelled in Cranford Cross are
predicted to experience negligible impacts for all years.
Cranford
7.10.67 Table 7.32 shows dispersion modelling results at 14 selected representative
receptor locations, including those which are likely to be worst-case in terms of
likely air quality impacts and total concentrations, within Cranford. NO2
concentrations with the DCO Project and impacts are shown in Figure 7.23 and
Figure 7.24, Volume 2.
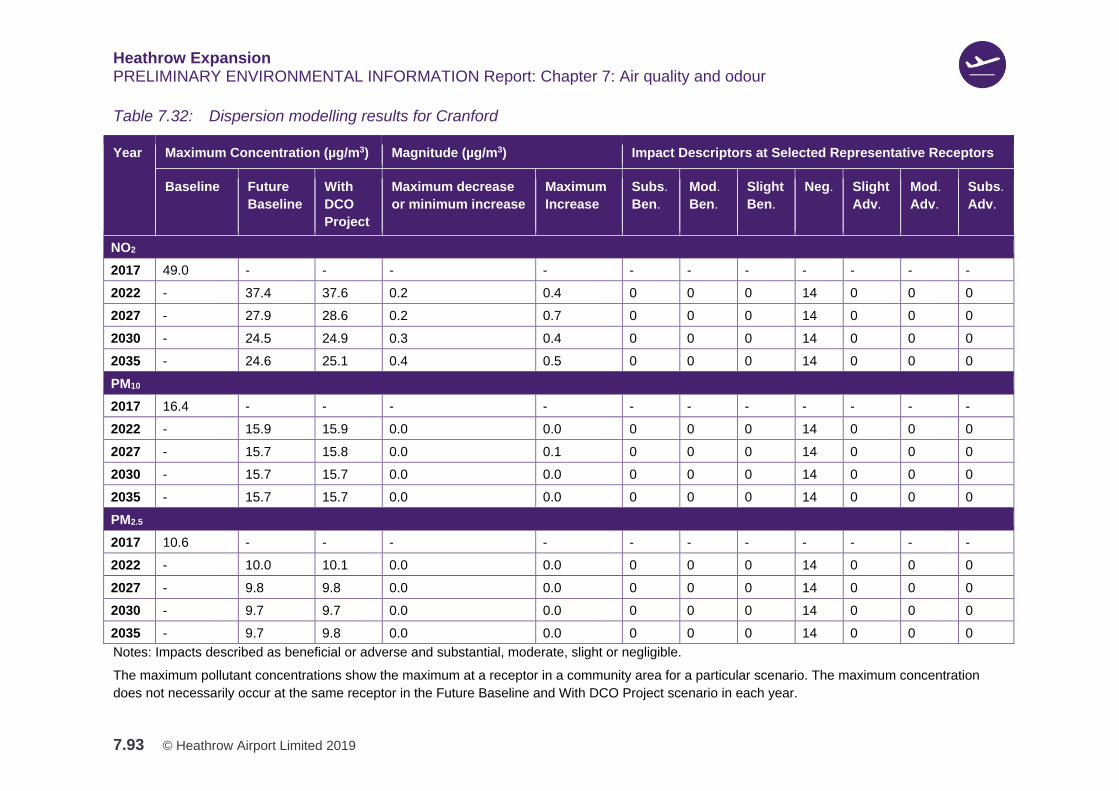
Heathrow Expansion PRELIMINARY ENVIRONMENTAL INFORMATION Report: Chapter 7: Air quality and odour
7.93 © Heathrow Airport Limited 2019
Table 7.32: Dispersion modelling results for Cranford
Year Maximum Concentration (µg/m3) Magnitude (µg/m3) Impact Descriptors at Selected Representative Receptors
Baseline Future
Baseline
With
DCO
Project
Maximum decrease
or minimum increase
Maximum
Increase
Subs.
Ben.
Mod.
Ben.
Slight
Ben.
Neg. Slight
Adv.
Mod.
Adv.
Subs.
Adv.
NO2
2017 49.0 - - - - - - - - - - -
2022 - 37.4 37.6 0.2 0.4 0 0 0 14 0 0 0
2027 - 27.9 28.6 0.2 0.7 0 0 0 14 0 0 0
2030 - 24.5 24.9 0.3 0.4 0 0 0 14 0 0 0
2035 - 24.6 25.1 0.4 0.5 0 0 0 14 0 0 0
PM10
2017 16.4 - - - - - - - - - - -
2022 - 15.9 15.9 0.0 0.0 0 0 0 14 0 0 0
2027 - 15.7 15.8 0.0 0.1 0 0 0 14 0 0 0
2030 - 15.7 15.7 0.0 0.0 0 0 0 14 0 0 0
2035 - 15.7 15.7 0.0 0.0 0 0 0 14 0 0 0
PM2.5
2017 10.6 - - - - - - - - - - -
2022 - 10.0 10.1 0.0 0.0 0 0 0 14 0 0 0
2027 - 9.8 9.8 0.0 0.0 0 0 0 14 0 0 0
2030 - 9.7 9.7 0.0 0.0 0 0 0 14 0 0 0
2035 - 9.7 9.8 0.0 0.0 0 0 0 14 0 0 0
Notes: Impacts described as beneficial or adverse and substantial, moderate, slight or negligible.
The maximum pollutant concentrations show the maximum at a receptor in a community area for a particular scenario. The maximum concentration
does not necessarily occur at the same receptor in the Future Baseline and With DCO Project scenario in each year.
Heathrow Expansion PRELIMINARY ENVIRONMENTAL INFORMATION Report: Chapter 7: Air quality and odour
7.94 © Heathrow Airport Limited 2019
7.10.68 In 2022, the maximum predicted increase in annual mean NO2 concentration is
0.4μg/m3 (1% of the 40μg/m3 AQO) at a receptor close to the A4 Bath Road and
the A312 The Parkway. The maximum total concentration within Cranford with the
DCO Project is 37.6μg/m3, which is below the AQO. All 14 receptors modelled in
Cranford are predicted to experience negligible impacts in 2022. With the CURED
sensitivity test, one receptor is predicted to experience a slight adverse impact.
7.10.69 In 2027, the maximum predicted increase in annual mean NO2 concentration is
0.7μg/m3 (2% of the 40μg/m3 AQO) at a receptor close to the A4 Bath Road and
the A312 The Parkway. The maximum total concentration within Cranford with the
DCO Project is 28.6μg/m3, which is below the AQO. All 14 receptors modelled in
Cranford are predicted to experience negligible impacts in 2027. With the CURED
sensitivity test, two receptors are predicted to experience a slight adverse impact.
7.10.70 In modelled scenarios after 2027, the maximum predicted increase in annual
mean concentration ranges from 0.4μg/m3 in 2030 to 0.5μg/m3 in 2035. All
fourteen modelled receptors are predicted to experience negligible impacts after
2027. This remains unchanged with the CURED sensitivity test.
7.10.71 The maximum predicted annual mean PM concentrations occur at receptors close
to the A4 Bath Road and the A312 The Parkway. Annual mean PM10 and PM2.5
concentrations are predicted to be well below the annual mean AQOs at all
receptors in Cranford in all modelled years both without and with the DCO Project.
7.10.72 The maximum predicted increases in annual mean concentrations are below
0.0μg/m3 for PM10 and PM2.5 for all years modelled, except in 2027 when the
maximum predicted increases in annual mean concentration is 0.1μg/m3 for PM10.
All 14 receptors modelled in Cranford are predicted to experience negligible
impacts for all years.
Heston
7.10.73 Table 7.33 shows dispersion modelling results at 17 selected representative
receptor locations, including those which are likely to be worst-case in terms of
likely air quality impacts and total concentrations, within Heston. NO2
concentrations with the DCO Project and impacts are shown in Figure 7.25 and
Figure 7.26, Volume 2.

Heathrow Expansion PRELIMINARY ENVIRONMENTAL INFORMATION Report: Chapter 7: Air quality and odour
7.95 © Heathrow Airport Limited 2019
Table 7.33: Dispersion modelling results for Heston
Year Maximum Concentration (µg/m3) Magnitude (µg/m3) Impact Descriptors at Selected Representative Receptors
Baseline Future
Baseline
With
DCO
Project
Maximum decrease
or minimum increase
Maximum
Increase
Subs.
Ben.
Mod.
Ben.
Slight
Ben.
Neg. Slight
Adv.
Mod.
Adv.
Subs.
Adv.
NO2
2017 57.0 - - - - - - - - - - -
2022 - 43.7 44.0 0.1 0.5 0 0 0 13 3 1 0
2027 - 31.9 32.0 0.3 0.3 0 0 0 17 0 0 0
2030 - 27.7 27.9 0.3 0.3 0 0 0 17 0 0 0
2035 - 27.9 28.2 0.3 0.4 0 0 0 17 0 0 0
PM10
2017 17.4 - - - - - - - - - - -
2022 - 16.8 16.8 0.0 0.1 0 0 0 17 0 0 0
2027 - 16.6 16.6 0.0 0.0 0 0 0 17 0 0 0
2030 - 16.6 16.6 0.0 0.0 0 0 0 17 0 0 0
2035 - 16.6 16.6 0.0 0.0 0 0 0 17 0 0 0
PM2.5
2017 11.1 - - - - - - - - - - -
2022 - 10.5 10.5 0.0 0.0 0 0 0 17 0 0 0
2027 - 10.2 10.2 0.0 0.0 0 0 0 17 0 0 0
2030 - 10.2 10.2 0.0 0.0 0 0 0 17 0 0 0
2035 - 10.2 10.2 0.0 0.0 0 0 0 17 0 0 0
Notes: Impacts described as beneficial or adverse and substantial, moderate, slight or negligible.
The maximum pollutant concentrations show the maximum at a receptor in a community area for a particular scenario. The maximum concentration
does not necessarily occur at the same receptor in the Future Baseline and With DCO Project scenario in each year.
Heathrow Expansion PRELIMINARY ENVIRONMENTAL INFORMATION Report: Chapter 7: Air quality and odour
7.96 © Heathrow Airport Limited 2019
7.10.74 In 2022, the maximum predicted increase in annual mean NO2 concentration is
0.5μg/m3 (1% of the 40μg/m3 AQO) at a receptor close to the M4. The maximum
total concentration within Heston with the DCO Project is 44.0μg/m3, which is
above the AQO. Of the 17 receptors modelled in Heston, 13 are predicted to
experience negligible impacts in 2022, with three predicted to experience slight
adverse impacts and one predicted to experience a moderate adverse impact.
With the CURED sensitivity test, four negligible impacts are increased to slight
adverse, and one slight adverse impact is increased to moderate adverse.
7.10.75 In modelled scenarios after 2022, the maximum predicted increase in annual
mean concentration range from 0.3μg/m3 in 2027 to 0.4μg/m3 in 2035. The
maximum annual mean concentration predicted with the DCO Project is
32.0μg/m3, 27.9μg/m3 and 28.2μg/m3 in 2027, 2030 and 2035 respectively. In
modelled scenarios after 2022, all receptors are predicted to experience annual
mean concentrations below the AQO of 40μg/m3 with and without the DCO
Project. All 17 modelled receptors are predicted to experience negligible impacts
after 2022. This remains unchanged with the CURED sensitivity test.
7.10.76 The maximum predicted annual mean PM concentrations occur at receptors close
to the M4. Annual mean PM10 and PM2.5 concentrations are predicted to be well
below the annual mean AQOs at all receptors in Heston in all modelled years both
without and with the DCO Project.
7.10.77 The maximum predicted increases in annual mean PM concentrations are below
0.0μg/m3 for PM10 and PM2.5 for all years modelled, except in 2022 when the
maximum predicted increases in annual mean concentration is 0.1μg/m3 for PM10.
All seventeen receptors modelled in Heston are predicted to experience negligible
impacts for all years.
Hounslow (Central and South)
7.10.78 Table 7.34 shows dispersion modelling results at 6 selected representative
receptor locations, including those which are likely to be worst-case in terms of
likely air quality impacts and total concentrations, within Hounslow (Central and
South). NO2 concentrations with the DCO Project and impacts are shown in
Figure 7.27 and Figure 7.28, Volume 2.

Heathrow Expansion PRELIMINARY ENVIRONMENTAL INFORMATION Report: Chapter 7: Air quality and odour
7.97 © Heathrow Airport Limited 2019
Table 7.34: Dispersion modelling results for Hounslow (Central and South)
Year Maximum Concentration (µg/m3) Magnitude (µg/m3) Impact Descriptors at Selected Representative Receptors
Baseline Future
Baseline
With
DCO
Project
Maximum decrease
or minimum increase
Maximum
Increase
Subs.
Ben.
Mod.
Ben.
Slight
Ben.
Neg. Slight
Adv.
Mod.
Adv.
Subs.
Adv.
NO2
2017 43.1 - - - - - - - - - - -
2022 - 34.5 34.8 0.0 0.2 0 0 0 6 0 0 0
2027 - 25.4 26.2 0.0 0.9 0 0 0 6 0 0 0
2030 - 22.5 23.3 0.0 0.8 0 0 0 6 0 0 0
2035 - 22.8 23.2 0.0 0.4 0 0 0 6 0 0 0
PM10
2017 16.2 - - - - - - - - - - -
2022 - 15.7 15.7 0.0 0.0 0 0 0 6 0 0 0
2027 - 15.5 15.6 0.0 0.1 0 0 0 6 0 0 0
2030 - 15.5 15.6 0.0 0.1 0 0 0 6 0 0 0
2035 - 15.5 15.6 0.0 0.0 0 0 0 6 0 0 0
PM2.5
2017 10.4 - - - - - - - - - - -
2022 - 9.9 9.9 0.0 0.0 0 0 0 6 0 0 0
2027 - 9.6 9.7 0.0 0.0 0 0 0 6 0 0 0
2030 - 9.6 9.6 0.0 0.1 0 0 0 6 0 0 0
2035 - 9.6 9.6 0.0 0.0 0 0 0 6 0 0 0
Notes: Impacts described as beneficial or adverse and substantial, moderate, slight or negligible.
The maximum pollutant concentrations show the maximum at a receptor in a community area for a particular scenario. The maximum concentration
does not necessarily occur at the same receptor in the Future Baseline and With DCO Project scenario in each year.
Heathrow Expansion PRELIMINARY ENVIRONMENTAL INFORMATION Report: Chapter 7: Air quality and odour
7.98 © Heathrow Airport Limited 2019
7.10.79 The maximum predicted annual mean NO2 concentrations occur at receptors close
to the A315 London Road. The maximum annual mean concentration predicted at
a modelled receptor with the DCO Project is 34.8μg/m3, 26.2μg/m3, 23.3μg/m3 and
23.2μg/m3 in 2022, 2027, 2030 and 2035 respectively and is therefore below the
AQO of 40μg/m3 in all modelled years.
7.10.80 The maximum predicted increases in annual mean concentrations range from
0.2μg/m3 in 2022 to 0.9μg/m3 in 2027. All six receptors modelled in Hounslow
(Central and South) are predicted to experience negligible impacts for all years.
With the CURED sensitivity test, one receptor is predicted to experience a slight
adverse impact in 2027.
7.10.81 Annual mean PM10 and PM2.5 concentrations are predicted to be well below the
annual mean AQOs at all receptors in Hounslow (Central and South) in all
modelled years both without and with the DCO Project.
7.10.82 The maximum predicted increases in annual mean concentrations are below
0.0μg/m3 for PM10 and PM2.5 for most years modelled. The maximum predicted
increases in annual mean concentrations are 0.1μg/m3 for PM10 in 2027 and 2030,
and for PM2.5 in 2030. All six receptors modelled in Hounslow (Central and South)
are predicted to experience negligible impacts for all years.
Hounslow (West and Heath)
7.10.83 Table 7.35 shows dispersion modelling results at 24 selected representative
receptor locations, including those which are likely to be worst-case in terms of
likely air quality impacts and total concentrations, within Hounslow (West and
Heath). NO2 concentrations with the DCO Project and impacts are shown in
Figure 7.29 and Figure 7.30, Volume 2.

Heathrow Expansion PRELIMINARY ENVIRONMENTAL INFORMATION Report: Chapter 7: Air quality and odour
7.99 © Heathrow Airport Limited 2019
Table 7.35: Dispersion modelling results for Hounslow (West and Heath)
Year Maximum Concentration (µg/m3) Magnitude (µg/m3) Impact Descriptors at Selected Representative Receptors
Baseline Future
Baseline
With
DCO
Project
Maximum decrease
or minimum increase
Maximum
Increase
Subs.
Ben.
Mod.
Ben.
Slight
Ben.
Neg. Slight
Adv.
Mod.
Adv.
Subs.
Adv.
NO2
2017 47.7 - - - - - - - - - - -
2022 - 36.6 36.7 0.0 0.6 0 0 0 24 0 0 0
2027 - 27.3 28.3 0.0 0.9 0 0 0 24 0 0 0
2030 - 24.2 24.8 0.0 0.6 0 0 0 24 0 0 0
2035 - 24.3 24.9 0.0 0.6 0 0 0 24 0 0 0
PM10
2017 16.6 - - - - - - - - - - -
2022 - 16.1 16.1 0.0 0.0 0 0 0 24 0 0 0
2027 - 15.9 16.0 0.0 0.1 0 0 0 24 0 0 0
2030 - 15.9 15.9 0.0 0.1 0 0 0 24 0 0 0
2035 - 15.9 15.9 0.0 0.1 0 0 0 24 0 0 0
PM2.5
2017 10.7 - - - - - - - - - - -
2022 - 10.1 10.2 0.0 0.0 0 0 0 24 0 0 0
2027 - 9.9 10.0 0.0 0.1 0 0 0 24 0 0 0
2030 - 9.8 9.9 0.0 0.0 0 0 0 24 0 0 0
2035 - 9.9 9.9 0.0 0.0 0 0 0 24 0 0 0
Notes: Impacts described as beneficial or adverse and substantial, moderate, slight or negligible.
The maximum pollutant concentrations show the maximum at a receptor in a community area for a particular scenario. The maximum concentration
does not necessarily occur at the same receptor in the Future Baseline and With DCO Project scenario in each year.
Heathrow Expansion PRELIMINARY ENVIRONMENTAL INFORMATION Report: Chapter 7: Air quality and odour
7.100 © Heathrow Airport Limited 2019
7.10.84 The maximum predicted annual mean NO2 concentrations occur at receptors close
to the A4 Bath Road. The maximum annual mean concentration predicted at a
modelled receptor with the DCO Project is 36.7μg/m3, 28.3μg/m3, 24.8μg/m3 and
24.9μg/m3 in 2022, 2027, 2030 and 2035 respectively and is therefore below the
AQO of 40μg/m3 in all modelled years.
7.10.85 The maximum predicted increase in annual mean concentration is 0.6μg/m3 in all
years modelled, except in 2027 when it is predicted to be to 0.9μg/m3. All 24
receptors modelled in Hounslow (West and Heath) are predicted to experience
negligible impacts for all years. With the CURED sensitivity test, two receptors are
predicted to experience slight adverse impacts in 2022, three receptors are
predicted to experience slight adverse impacts in 2027, and one receptor is
predicted to experience a slight adverse impact in 2030 and 2035.
7.10.86 The maximum predicted annual mean PM concentrations occur at receptors close
to the A3063 Wellington Road. Annual mean PM10 and PM2.5 concentrations are
predicted to be well below the annual mean AQOs at all receptors in Hounslow
(West and Heath) in all modelled years both without and with the DCO Project.
7.10.87 The maximum predicted increases in annual mean concentrations are below
0.0μg/m3 for PM10 and PM2.5 for most years modelled. The maximum predicted
increases in annual mean concentrations are 0.1μg/m3 for PM10 in 2027, 2030 and
2035 and for PM2.5 in 2027. All twenty-four receptors modelled in Hounslow (West
and Heath) are predicted to experience negligible impacts for all years.
Feltham North
7.10.88 Table 7.36 shows dispersion modelling results at 12 selected representative
receptor locations, including those which are likely to be worst-case in terms of
likely air quality impacts and total concentrations, within Feltham North. NO2
concentrations with the DCO Project and impacts are shown in Figure 7.31 and
Figure 7.32, Volume 2.

Heathrow Expansion PRELIMINARY ENVIRONMENTAL INFORMATION Report: Chapter 7: Air quality and odour
7.101 © Heathrow Airport Limited 2019
Table 7.36: Dispersion modelling results for Feltham North
Year Maximum Concentration (µg/m3) Magnitude (µg/m3) Impact Descriptors at Selected Representative Receptors
Baseline Future
Baseline
With
DCO
Project
Maximum decrease
or minimum increase
Maximum
Increase
Subs.
Ben.
Mod.
Ben.
Slight
Ben.
Neg. Slight
Adv.
Mod.
Adv.
Subs.
Adv.
NO2
2017 47.2 - - - - - - - - - - -
2022 - 36.4 36.7 0.3 0.5 0 0 0 12 0 0 0
2027 - 27.7 28.0 -0.3 0.6 0 0 0 12 0 0 0
2030 - 24.5 24.8 -0.1 0.4 0 0 0 12 0 0 0
2035 - 24.6 25.4 0.7 0.7 0 0 0 12 0 0 0
PM10
2017 15.6 - - - - - - - - - - -
2022 - 15.0 15.0 0.0 0.0 0 0 0 12 0 0 0
2027 - 14.8 14.9 0.0 0.1 0 0 0 12 0 0 0
2030 - 14.8 14.8 0.0 0.0 0 0 0 12 0 0 0
2035 - 14.8 14.8 0.0 0.1 0 0 0 12 0 0 0
PM2.5
2017 10.1 - - - - - - - - - - -
2022 - 9.6 9.6 0.0 0.0 0 0 0 12 0 0 0
2027 - 9.4 9.4 0.0 0.0 0 0 0 12 0 0 0
2030 - 9.3 9.3 0.0 0.0 0 0 0 12 0 0 0
2035 - 9.3 9.3 0.0 0.0 0 0 0 12 0 0 0
Notes: Impacts described as beneficial or adverse and substantial, moderate, slight or negligible.
The maximum pollutant concentrations show the maximum at a receptor in a community area for a particular scenario. The maximum concentration
does not necessarily occur at the same receptor in the Future Baseline and With DCO Project scenario in each year.
Heathrow Expansion PRELIMINARY ENVIRONMENTAL INFORMATION Report: Chapter 7: Air quality and odour
7.102 © Heathrow Airport Limited 2019
7.10.89 The maximum predicted annual mean NO2 concentrations occur at receptors close
to the A30 Great South-West Road. The maximum annual mean concentration
predicted with the DCO Project is 37.6μg/m3, 28.0μg/m3, 24.8μg/m3 and 25.4μg/m3
in 2022, 2027, 2030 and 2035 respectively and is therefore below the AQO of
40μg/m3 in all modelled years.
7.10.90 The maximum predicted increases in annual mean concentrations range from
0.5μg/m3 in 2022 to 0.7μg/m3 in 2035. All twelve receptors modelled in Feltham
North are predicted to experience negligible impacts for all years. With the CURED
sensitivity test, one receptor is predicted to experience a slight adverse impact in
2022, 2027 and 2035.
7.10.91 The maximum predicted annual mean PM concentrations occur at receptors close
to the A315 Staines Road. Annual mean PM10 and PM2.5 concentrations are
predicted to be well below the annual mean AQOs at all receptors in Feltham
North in all modelled years both without and with the DCO Project.
7.10.92 The maximum predicted increases in annual mean PM concentrations are below
0.0μg/m3 for PM10 and PM2.5 for most years modelled. The maximum predicted
increases in annual mean concentrations are 0.1μg/m3 for PM10 in 2027 and 2035.
All twelve receptors modelled in Feltham North are predicted to experience
negligible impacts for all years.
Bedfont
7.10.93 Table 7.37 shows dispersion modelling results at 12 selected representative
receptor locations, including those which are likely to be worst-case in terms of
likely air quality impacts and total concentrations, within Bedfont. NO2
concentrations with the DCO Project and impacts are shown in Figure 7.33 and
Figure 7.34, Volume 2.

Heathrow Expansion PRELIMINARY ENVIRONMENTAL INFORMATION Report: Chapter 7: Air quality and odour
7.103 © Heathrow Airport Limited 2019
Table 7.37: Dispersion modelling results for Bedfont
Year Maximum Concentration (µg/m3) Magnitude (µg/m3) Impact Descriptors at Selected Representative Receptors
Baseline Future
Baseline
With
DCO
Project
Maximum decrease
or minimum increase
Maximum
Increase
Subs.
Ben.
Mod.
Ben.
Slight
Ben.
Neg. Slight
Adv.
Mod.
Adv.
Subs.
Adv.
NO2
2017 47.4 - - - - - - - - - - -
2022 - 35.4 35.7 0.2 0.4 0 0 0 12 0 0 0
2027 - 26.7 27.5 -0.8 1.1 0 0 0 12 0 0 0
2030 - 23.5 24.3 -0.5 1.1 0 0 0 12 0 0 0
2035 - 23.7 24.8 0.7 1.5 0 0 0 12 0 0 0
PM10
2017 15.1 - - - - - - - - - - -
2022 - 14.6 14.6 -0.2 0.0 0 0 0 12 0 0 0
2027 - 14.4 14.5 -0.1 0.2 0 0 0 12 0 0 0
2030 - 14.4 14.5 0.0 0.2 0 0 0 12 0 0 0
2035 - 14.4 14.5 0.0 0.2 0 0 0 12 0 0 0
PM2.5
2017 9.9 - - - - - - - - - - -
2022 - 9.4 9.4 -0.1 0.0 0 0 0 12 0 0 0
2027 - 9.2 9.3 0.0 0.1 0 0 0 12 0 0 0
2030 - 9.1 9.2 0.0 0.1 0 0 0 12 0 0 0
2035 - 9.1 9.2 0.0 0.1 0 0 0 12 0 0 0
Notes: Impacts described as beneficial or adverse and substantial, moderate, slight or negligible.
The maximum pollutant concentrations show the maximum at a receptor in a community area for a particular scenario. The maximum concentration
does not necessarily occur at the same receptor in the Future Baseline and With DCO Project scenario in each year.
Heathrow Expansion PRELIMINARY ENVIRONMENTAL INFORMATION Report: Chapter 7: Air quality and odour
7.104 © Heathrow Airport Limited 2019
7.10.94 The maximum predicted annual mean NO2 concentrations occur at receptors close
to the A30 Great South-West Road and Stanwell Road. The maximum annual
mean concentration predicted with the DCO Project is 35.7μg/m3, 27.5μg/m3,
24.3μg/m3 and 24.8μg/m3 in 2022, 2027, 2030 and 2035 respectively and is
therefore below the AQO of 40μg/m3 in all modelled years.
7.10.95 The maximum predicted increases in annual mean concentrations range from
0.4μg/m3 in 2022 to 1.5μg/m3 in 2035. All 12 receptors modelled in Bedfont are
predicted to experience negligible impacts for all years. With the CURED
sensitivity test, two receptors in 2027 and one in 2035 are predicted to experience
slight adverse impacts.
7.10.96 The maximum predicted annual mean PM concentrations occur at receptors close
to the A30 Great South-West Road and Stanwell Road. Annual mean PM10 and
PM2.5 concentrations are predicted to be well below the annual mean AQOs at all
receptors in Bedfont in all modelled years both without and with the DCO Project.
7.10.97 The maximum predicted increases in annual mean PM concentrations are
0.2μg/m3 for PM10 and 0.1μg/m3 for PM2.5 in 2027, 2030 and 2035. All 12 receptors
modelled in Bedfont are predicted to experience negligible impacts for all years.
Stanwell
7.10.98 Table 7.38 shows dispersion modelling results at 18 selected representative
receptor locations, including those which are likely to be worst-case in terms of
likely air quality impacts and total concentrations, within Stanwell. NO2
concentrations with the DCO Project and impacts are shown in Figure 7.35 and
Figure 7.36, Volume 2.
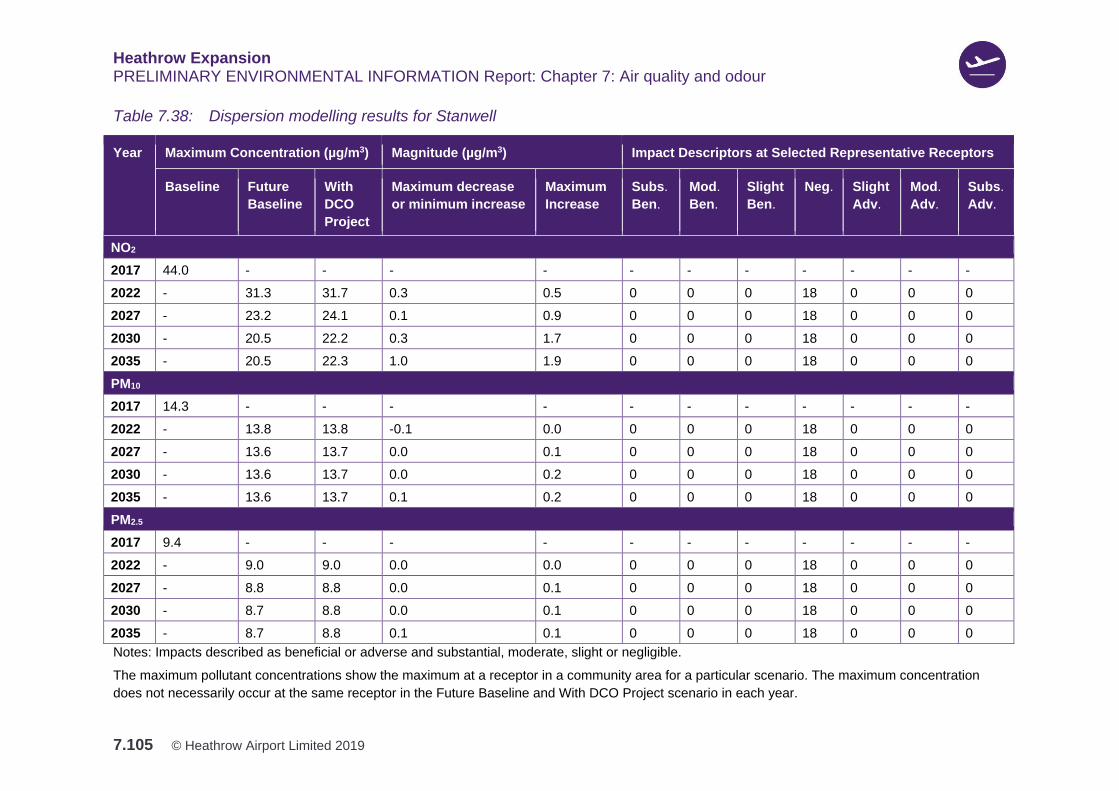
Heathrow Expansion PRELIMINARY ENVIRONMENTAL INFORMATION Report: Chapter 7: Air quality and odour
7.105 © Heathrow Airport Limited 2019
Table 7.38: Dispersion modelling results for Stanwell
Year Maximum Concentration (µg/m3) Magnitude (µg/m3) Impact Descriptors at Selected Representative Receptors
Baseline Future
Baseline
With
DCO
Project
Maximum decrease
or minimum increase
Maximum
Increase
Subs.
Ben.
Mod.
Ben.
Slight
Ben.
Neg. Slight
Adv.
Mod.
Adv.
Subs.
Adv.
NO2
2017 44.0 - - - - - - - - - - -
2022 - 31.3 31.7 0.3 0.5 0 0 0 18 0 0 0
2027 - 23.2 24.1 0.1 0.9 0 0 0 18 0 0 0
2030 - 20.5 22.2 0.3 1.7 0 0 0 18 0 0 0
2035 - 20.5 22.3 1.0 1.9 0 0 0 18 0 0 0
PM10
2017 14.3 - - - - - - - - - - -
2022 - 13.8 13.8 -0.1 0.0 0 0 0 18 0 0 0
2027 - 13.6 13.7 0.0 0.1 0 0 0 18 0 0 0
2030 - 13.6 13.7 0.0 0.2 0 0 0 18 0 0 0
2035 - 13.6 13.7 0.1 0.2 0 0 0 18 0 0 0
PM2.5
2017 9.4 - - - - - - - - - - -
2022 - 9.0 9.0 0.0 0.0 0 0 0 18 0 0 0
2027 - 8.8 8.8 0.0 0.1 0 0 0 18 0 0 0
2030 - 8.7 8.8 0.0 0.1 0 0 0 18 0 0 0
2035 - 8.7 8.8 0.1 0.1 0 0 0 18 0 0 0
Notes: Impacts described as beneficial or adverse and substantial, moderate, slight or negligible.
The maximum pollutant concentrations show the maximum at a receptor in a community area for a particular scenario. The maximum concentration
does not necessarily occur at the same receptor in the Future Baseline and With DCO Project scenario in each year.
Heathrow Expansion PRELIMINARY ENVIRONMENTAL INFORMATION Report: Chapter 7: Air quality and odour
7.106 © Heathrow Airport Limited 2019
7.10.99 The maximum predicted annual mean NO2 concentrations occur at receptors close
to the B37 Park Road. The maximum annual mean concentration predicted with
the DCO Project is 31.7μg/m3, 24.1μg/m3, 22.2μg/m3 and 22.3μg/m3 in 2022,
2027, 2030 and 2035 respectively and is therefore below the AQO of 40μg/m3 in
all modelled years.
7.10.100 The maximum predicted increases in annual mean concentrations range from
0.5μg/m3 in 2022 to 1.9μg/m3 in 2035. All eighteen receptors modelled in Stanwell
are predicted to experience negligible impacts for all years. With the CURED
sensitivity test, one receptor is predicted to experience a slight adverse impact in
2035.
7.10.101 The maximum predicted annual mean PM concentrations occur at receptors close
to the A30 London Road. Annual mean PM10 and PM2.5 concentrations are
predicted to be well below the annual mean AQOs at all receptors in Stanwell in all
modelled years both without and with the DCO Project.
7.10.102 The maximum predicted increases in annual mean PM concentrations range from
below 0.0μg/m3 in 2022 and 0.2μg/m3 in 2035 for PM10, and from below 0.0μg/m3
in 2022 and 0.1μg/m3 in 2035 for PM2.5. All 18 receptors modelled in Stanwell are
predicted to experience negligible impacts for all years.
Stanwell Moor
7.10.103 Table 7.39 shows dispersion modelling results at 12 selected representative
receptor locations, including those which are likely to be worst-case in terms of
likely air quality impacts and total concentrations, within Stanwell Moor. NO2
concentrations with the DCO Project and impacts are shown in Figure 7.37 and
Figure 7.38, Volume 2.
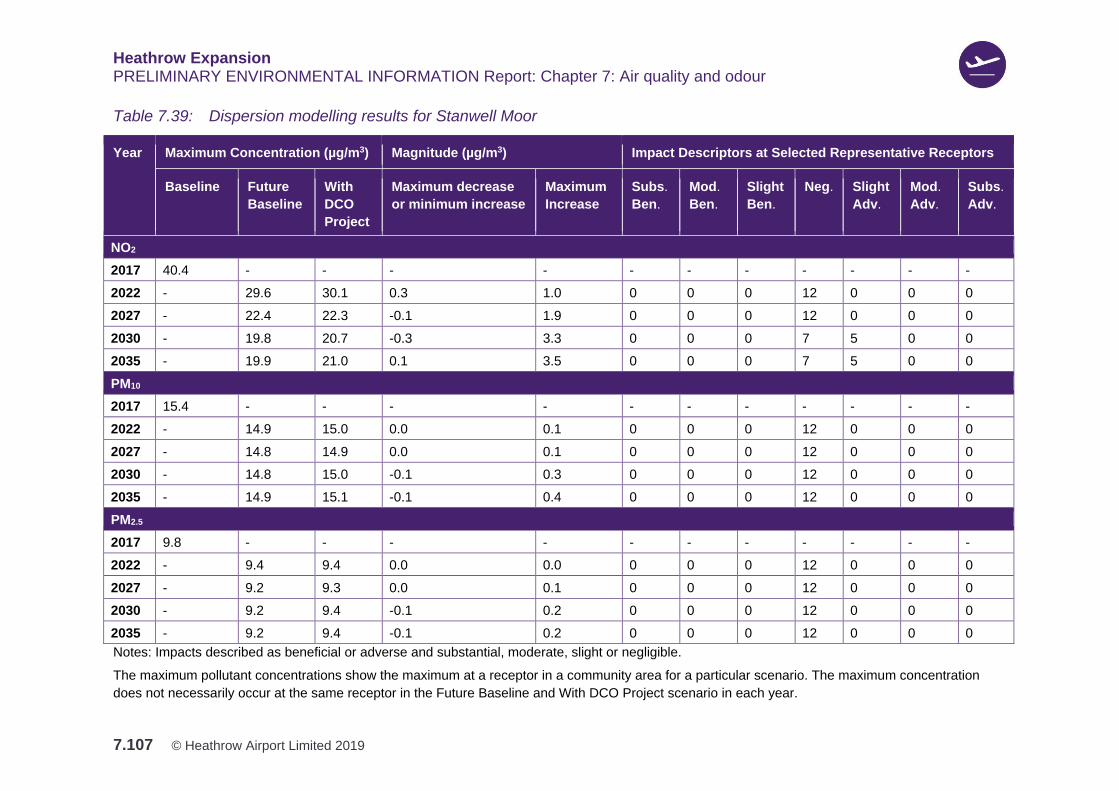
Heathrow Expansion PRELIMINARY ENVIRONMENTAL INFORMATION Report: Chapter 7: Air quality and odour
7.107 © Heathrow Airport Limited 2019
Table 7.39: Dispersion modelling results for Stanwell Moor
Year Maximum Concentration (µg/m3) Magnitude (µg/m3) Impact Descriptors at Selected Representative Receptors
Baseline Future
Baseline
With
DCO
Project
Maximum decrease
or minimum increase
Maximum
Increase
Subs.
Ben.
Mod.
Ben.
Slight
Ben.
Neg. Slight
Adv.
Mod.
Adv.
Subs.
Adv.
NO2
2017 40.4 - - - - - - - - - - -
2022 - 29.6 30.1 0.3 1.0 0 0 0 12 0 0 0
2027 - 22.4 22.3 -0.1 1.9 0 0 0 12 0 0 0
2030 - 19.8 20.7 -0.3 3.3 0 0 0 7 5 0 0
2035 - 19.9 21.0 0.1 3.5 0 0 0 7 5 0 0
PM10
2017 15.4 - - - - - - - - - - -
2022 - 14.9 15.0 0.0 0.1 0 0 0 12 0 0 0
2027 - 14.8 14.9 0.0 0.1 0 0 0 12 0 0 0
2030 - 14.8 15.0 -0.1 0.3 0 0 0 12 0 0 0
2035 - 14.9 15.1 -0.1 0.4 0 0 0 12 0 0 0
PM2.5
2017 9.8 - - - - - - - - - - -
2022 - 9.4 9.4 0.0 0.0 0 0 0 12 0 0 0
2027 - 9.2 9.3 0.0 0.1 0 0 0 12 0 0 0
2030 - 9.2 9.4 -0.1 0.2 0 0 0 12 0 0 0
2035 - 9.2 9.4 -0.1 0.2 0 0 0 12 0 0 0
Notes: Impacts described as beneficial or adverse and substantial, moderate, slight or negligible.
The maximum pollutant concentrations show the maximum at a receptor in a community area for a particular scenario. The maximum concentration
does not necessarily occur at the same receptor in the Future Baseline and With DCO Project scenario in each year.
Heathrow Expansion PRELIMINARY ENVIRONMENTAL INFORMATION Report: Chapter 7: Air quality and odour
7.108 © Heathrow Airport Limited 2019
7.10.104 In 2022, the maximum predicted increase in annual mean NO2 concentration is
1.0μg/m3 (3% of the 40μg/m3 AQO). The maximum total concentration within
Stanwell Moor with the DCO Project is 30.1μg/m3, which is below the AQO. All 12
receptors modelled in Stanwell Moor are predicted to experience negligible
impacts in 2022. This remains the case with the CURED sensitivity test.
7.10.105 In 2027, the maximum predicted increase in annual mean NO2 concentration is
1.9μg/m3 (5% of the 40μg/m3 AQO). The maximum total concentration within
Stanwell Moor with the DCO Project is 22.3μg/m3, which is below the AQO. All 12
receptors modelled in Stanwell Moor are predicted to experience negligible
impacts in 2027. This remains the case with the CURED sensitivity test.
7.10.106 In 2030, the maximum predicted increase in annual mean NO2 concentration is
3.3μg/m3 (8% of the 40μg/m3 AQO). The maximum total concentration within
Stanwell Moor with the DCO Project is 20.7μg/m3, which is below the AQO. Of the
12 receptors modelled in Stanwell Moor, seven are predicted to experience
negligible impacts, with five slight adverse impacts. One of the slight adverse
impact is increased to moderate adverse under the CURED sensitivity test.
7.10.107 In 2035, the maximum predicted increase in annual mean NO2 concentration is
3.5μg/m3 (9% of the 40μg/m3 AQO). The maximum total concentration within
Stanwell Moor with the DCO Project is 21.0μg/m3, which is below the AQO. Of the
12 receptors modelled in Stanwell Moor, seven are predicted to experience
negligible impacts, with five slight adverse impacts. Two of the slight adverse
impacts are increased to moderate adverse under the CURED sensitivity test.
7.10.108 The maximum predicted annual mean PM concentrations occur at receptors close
to the A3044 Stanwell Moor Road. Annual mean PM10 and PM2.5 concentrations
are predicted to be well below the annual mean AQOs at all receptors in Stanwell
Moor in all modelled years both without and with the DCO Project.
7.10.109 The maximum predicted increases in annual mean concentrations range from
0.1μg/m3 in 2022 and 0.4μg/m3 in 2035 for PM10, and from below 0.0μg/m3 in 2022
and 0.2μg/m3 in 2035 for PM2.5. All twelve receptors modelled in Stanwell Moor
are predicted to experience negligible impacts for all years.
Poyle
7.10.110 Table 7.40 shows dispersion modelling results at 12 selected representative
receptor locations, including those which are likely to be worst-case in terms of
likely air quality impacts and total concentrations, within Poyle. NO2 concentrations
with the DCO Project and impacts are shown in Figure 7.39 and Figure 7.40,
Volume 2.

Heathrow Expansion PRELIMINARY ENVIRONMENTAL INFORMATION Report: Chapter 7: Air quality and odour
7.109 © Heathrow Airport Limited 2019
Table 7.40: Dispersion modelling results for Poyle
Year Maximum Concentration (µg/m3) Magnitude (µg/m3) Impact Descriptors at Selected Representative Receptors
Baseline Future
Baseline
With
DCO
Project
Maximum decrease
or minimum increase
Maximum
Increase
Subs.
Ben.
Mod.
Ben.
Slight
Ben.
Neg. Slight
Adv.
Mod.
Adv.
Subs.
Adv.
NO2
2017 41.5 - - - - - - - - - - -
2022 - 29.0 29.3 0.2 0.3 0 0 0 12 0 0 0
2027 - 22.5 22.3 -0.2 2.1 0 0 0 12 0 0 0
2030 - 20.1 20.7 0.1 2.1 0 0 0 12 0 0 0
2035 - 20.2 21.1 0.3 2.1 0 0 0 12 0 0 0
PM10
2017 15.8 - - - - - - - - - - -
2022 - 15.3 15.3 0.0 0.0 0 0 0 12 0 0 0
2027 - 15.2 15.2 -0.1 0.1 0 0 0 12 0 0 0
2030 - 15.2 15.2 -0.1 0.2 0 0 0 12 0 0 0
2035 - 15.2 15.3 0.0 0.2 0 0 0 12 0 0 0
PM2.5
2017 10.3 - - - - - - - - - - -
2022 - 9.8 9.8 0.0 0.0 0 0 0 12 0 0 0
2027 - 9.7 9.7 0.0 0.1 0 0 0 12 0 0 0
2030 - 9.6 9.7 0.0 0.1 0 0 0 12 0 0 0
2035 - 9.6 9.7 0.0 0.1 0 0 0 12 0 0 0
Notes: Impacts described as beneficial or adverse and substantial, moderate, slight or negligible.
The maximum pollutant concentrations show the maximum at a receptor in a community area for a particular scenario. The maximum concentration
does not necessarily occur at the same receptor in the Future Baseline and With DCO Project scenario in each year.
Heathrow Expansion PRELIMINARY ENVIRONMENTAL INFORMATION Report: Chapter 7: Air quality and odour
7.110 © Heathrow Airport Limited 2019
7.10.111 The maximum predicted annual mean NO2 concentrations occur at receptors close
to Park Street. The maximum annual mean concentration predicted with the DCO
Project is 29.3μg/m3, 22.3μg/m3, 20.7μg/m3 and 21.1μg/m3 in 2022, 2027, 2030
and 2035 respectively and is therefore below the AQO of 40μg/m3 in all modelled
years.
7.10.112 The maximum predicted increases in annual mean NO2 concentrations range from
0.3μg/m3 in 2022 to 2.1μg/m3 in 2035. All 12 receptors modelled in Poyle are
predicted to experience negligible impacts for all years. With the CURED
sensitivity test, one receptor is predicted to experience a slight adverse impact in
2027 and 2030, and two receptors in 2035.
7.10.113 The maximum predicted annual mean PM concentrations occur at receptors close
to Bath Road. Annual mean PM10 and PM2.5 concentrations are predicted to be
well below the annual mean AQOs at all receptors in Poyle in all modelled years
both without and with the DCO Project.
7.10.114 The maximum predicted increases in annual mean PM concentrations range from
less than 0.0μg/m3 in 2022 to 0.2μg/m3 in 2035 for PM10, and from less than
0.0μg/m3 in 2022 to 0.1μg/m3 in 2035 for PM2.5. All 12 receptors modelled in Poyle
are predicted to experience negligible impacts for all years.
Colnbrook
7.10.115 Table 7.41 shows dispersion modelling results at 12 selected representative
receptor locations, including those which are likely to be worst-case in terms of
likely air quality impacts and total concentrations, within Colnbrook. NO2
concentrations with the DCO Project and impacts are shown in Figure 7.41 and
Figure 7.42, Volume 2.

Heathrow Expansion PRELIMINARY ENVIRONMENTAL INFORMATION Report: Chapter 7: Air quality and odour
7.111 © Heathrow Airport Limited 2019
Table 7.41: Dispersion modelling results for Colnbrook
Year Maximum Concentration (µg/m3) Magnitude (µg/m3) Impact Descriptors at Selected Representative Receptors
Baseline Future
Baseline
With
DCO
Project
Maximum decrease
or minimum increase
Maximum
Increase
Subs.
Ben.
Mod.
Ben.
Slight
Ben.
Neg. Slight
Adv.
Mod.
Adv.
Subs.
Adv.
NO2
2017 46.0 - - - - - - - - - - -
2022 - 30.8 31.3 0.0 0.5 0 0 0 12 0 0 0
2027 - 23.0 23.0 0.4 1.3 0 0 0 12 0 0 0
2030 - 20.1 20.2 0.5 1.1 0 0 0 12 0 0 0
2035 - 20.2 20.5 0.5 1.2 0 0 0 12 0 0 0
PM10
2017 16.2 - - - - - - - - - - -
2022 - 15.6 15.6 0.0 0.0 0 0 0 12 0 0 0
2027 - 15.5 15.6 0.0 0.0 0 0 0 12 0 0 0
2030 - 15.5 15.5 0.0 0.0 0 0 0 12 0 0 0
2035 - 15.5 15.6 0.0 0.1 0 0 0 12 0 0 0
PM2.5
2017 10.3 - - - - - - - - - - -
2022 - 9.7 9.7 0.0 0.0 0 0 0 12 0 0 0
2027 - 9.5 9.6 0.0 0.0 0 0 0 12 0 0 0
2030 - 9.5 9.5 0.0 0.0 0 0 0 12 0 0 0
2035 - 9.5 9.5 0.0 0.0 0 0 0 12 0 0 0
Notes: Impacts described as beneficial or adverse and substantial, moderate, slight or negligible.
The maximum pollutant concentrations show the maximum at a receptor in a community area for a particular scenario. The maximum concentration
does not necessarily occur at the same receptor in the Future Baseline and With DCO Project scenario in each year.
Heathrow Expansion PRELIMINARY ENVIRONMENTAL INFORMATION Report: Chapter 7: Air quality and odour
7.112 © Heathrow Airport Limited 2019
7.10.116 The maximum predicted annual mean NO2 concentrations occur at receptors close
to Bridge Street. The maximum annual mean concentration predicted with the
DCO Project is 31.3μg/m3, 23.0μg/m3, 20.2μg/m3 and 20.5μg/m3 in 2022, 2027,
2030 and 2035 respectively and is therefore below the AQO of 40μg/m3 in all
modelled years.
7.10.117 The maximum predicted increases in annual mean concentrations range from
0.5μg/m3 in 2022 to 1.2μg/m3 in 2035. All 12 receptors modelled in Colnbrook are
predicted to experience negligible impacts for all years. This remains the case with
the CURED sensitivity test.
7.10.118 The maximum predicted annual mean PM concentrations occur at receptors close
to the junction between the High Street and Horton Road. Annual mean PM10 and
PM2.5 concentrations are predicted to be well below the annual mean AQOs at all
receptors in Colnbrook in all modelled years both without and with the DCO
Project.
7.10.119 The maximum predicted increases in annual mean concentrations range from less
than 0.0μg/m3 in 2022 to 0.1μg/m3 in 2035 for PM10. Maximum predicted increases
in annual mean concentrations are less than 0.0μg/m3 in all years modelled for
PM2.5. All twelve receptors modelled in Colnbrook are predicted to experience
negligible impacts for all years.
Brands Hill
7.10.120 Table 7.42 shows dispersion modelling results at 16 selected representative
receptor locations, including those which are likely to be worst-case in terms of
likely air quality impacts and total concentrations, within Brands Hill. NO2
concentrations with the DCO Project and impacts are shown in Figure 7.43 and
Figure 7.44, Volume 2.
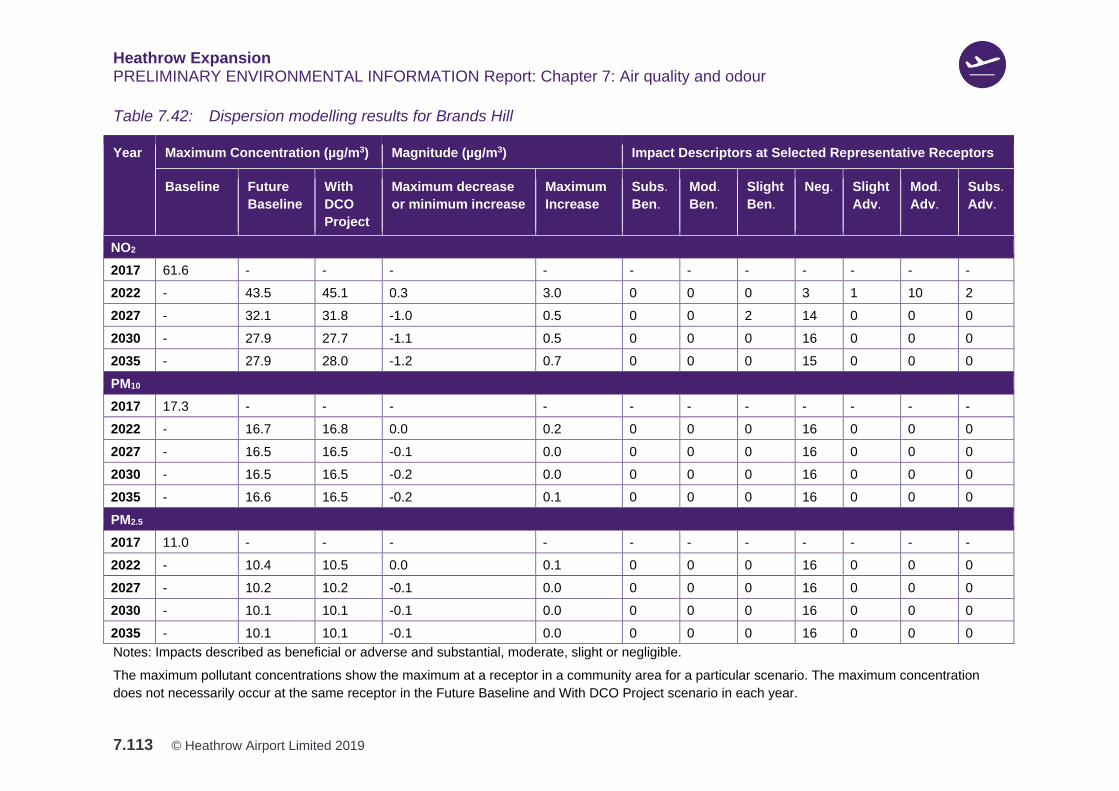
Heathrow Expansion PRELIMINARY ENVIRONMENTAL INFORMATION Report: Chapter 7: Air quality and odour
7.113 © Heathrow Airport Limited 2019
Table 7.42: Dispersion modelling results for Brands Hill
Year Maximum Concentration (µg/m3) Magnitude (µg/m3) Impact Descriptors at Selected Representative Receptors
Baseline Future
Baseline
With
DCO
Project
Maximum decrease
or minimum increase
Maximum
Increase
Subs.
Ben.
Mod.
Ben.
Slight
Ben.
Neg. Slight
Adv.
Mod.
Adv.
Subs.
Adv.
NO2
2017 61.6 - - - - - - - - - - -
2022 - 43.5 45.1 0.3 3.0 0 0 0 3 1 10 2
2027 - 32.1 31.8 -1.0 0.5 0 0 2 14 0 0 0
2030 - 27.9 27.7 -1.1 0.5 0 0 0 16 0 0 0
2035 - 27.9 28.0 -1.2 0.7 0 0 0 15 0 0 0
PM10
2017 17.3 - - - - - - - - - - -
2022 - 16.7 16.8 0.0 0.2 0 0 0 16 0 0 0
2027 - 16.5 16.5 -0.1 0.0 0 0 0 16 0 0 0
2030 - 16.5 16.5 -0.2 0.0 0 0 0 16 0 0 0
2035 - 16.6 16.5 -0.2 0.1 0 0 0 16 0 0 0
PM2.5
2017 11.0 - - - - - - - - - - -
2022 - 10.4 10.5 0.0 0.1 0 0 0 16 0 0 0
2027 - 10.2 10.2 -0.1 0.0 0 0 0 16 0 0 0
2030 - 10.1 10.1 -0.1 0.0 0 0 0 16 0 0 0
2035 - 10.1 10.1 -0.1 0.0 0 0 0 16 0 0 0
Notes: Impacts described as beneficial or adverse and substantial, moderate, slight or negligible.
The maximum pollutant concentrations show the maximum at a receptor in a community area for a particular scenario. The maximum concentration
does not necessarily occur at the same receptor in the Future Baseline and With DCO Project scenario in each year.
Heathrow Expansion PRELIMINARY ENVIRONMENTAL INFORMATION Report: Chapter 7: Air quality and odour
7.114 © Heathrow Airport Limited 2019
7.10.121 In 2022, the maximum predicted increase in annual mean NO2 concentration is
3.0μg/m3 (8% of the 40μg/m3 AQO) at a receptor close to the A4 Colnbrook
Bypass. The maximum total concentration within Brands Hill with the DCO Project
is 45.1μg/m3, which is above the AQO. Of the 16 receptors modelled in Brands
Hill, three are predicted to experience negligible impacts in 2022, with one
predicted to experience a slight adverse impact, 10 predicted to experience
moderate adverse impacts and two predicted to experience substantial adverse
impacts. With the CURED sensitivity test, two receptors are predicted to
experience negligible impacts, with two predicted to experience slight adverse
impacts, four predicted to experience moderate adverse impacts and eight
predicted to experience substantial adverse impacts.
7.10.122 In 2027, the maximum predicted increase in annual mean NO2 concentration is
0.5μg/m3 (1% of the 40μg/m3 AQO) at a receptor close to London Road. The
maximum total concentration within Brands Hill with the DCO Project is 31.8μg/m3,
which is below the AQO. Of the 16 receptors modelled in Brands Hill, 14 are
predicted to experience negligible impacts in 2027, with two predicted to
experience slight beneficial impacts. With the CURED sensitivity test, nine are
predicted to experience negligible impacts in 2027, with two predicted to
experience slight adverse impacts, one predicted to experience a moderate
adverse impact, four predicted to experience slight beneficial impacts and one
predicted to experience a moderate beneficial impact.
7.10.123 In 2030, the maximum predicted increase in annual mean NO2 concentration is
0.5μg/m3 (1% of the 40μg/m3 AQO). The maximum total concentration within
Brands Hill with the DCO Project is 27.7μg/m3, which is below the AQO. All of the
16 receptors modelled in Brands Hill are predicted to experience negligible
impacts in 2030. With the CURED sensitivity test, 12 are predicted to experience
negligible impacts in 2030, with four predicted to experience slight beneficial
impacts.
7.10.124 In 2035, the maximum predicted increase in annual mean NO2 concentration is
0.7μg/m3 (2% of the 40μg/m3 AQO). The maximum total concentration within
Brands Hill with the DCO Project is 28.0μg/m3, which is below the AQO. All of the
16 receptors modelled in Brands Hill are predicted to experience negligible
impacts in 2035. With the CURED sensitivity test, 11 are predicted to experience
negligible impacts in 2035, with one predicted to experience a slight adverse
impact, and four predicted to experience slight beneficial impacts.
7.10.125 The maximum predicted annual mean PM concentrations occur at receptors close
to the junction between the A4 Colnbrook Bypass and London Road. Annual mean
PM10 and PM2.5 concentrations are predicted to be well below the annual mean
AQOs at all receptors in Brands Hill in all modelled years both without and with the
DCO Project.
Heathrow Expansion PRELIMINARY ENVIRONMENTAL INFORMATION Report: Chapter 7: Air quality and odour
7.115 © Heathrow Airport Limited 2019
7.10.126 The maximum predicted increases in annual mean PM concentrations range from
0.2μg/m3 and 0.1μg/m3 for PM10 and PM2.5 respectively in 2022, to 0.1μg/m3 and
below 0.0μg/m3 in 2035. All sixteen receptors modelled in Brands Hill are
predicted to experience negligible impacts for all years.
Iver and Richings Park
7.10.127 Table 7.43 shows dispersion modelling results at 14 selected representative
receptor locations, including those which are likely to be worst-case in terms of
likely air quality impacts and total concentrations, within Iver and Richings Park.
NO2 concentrations with the DCO Project and impacts are shown in Figure 7.45
and Figure 7.46, Volume 2.
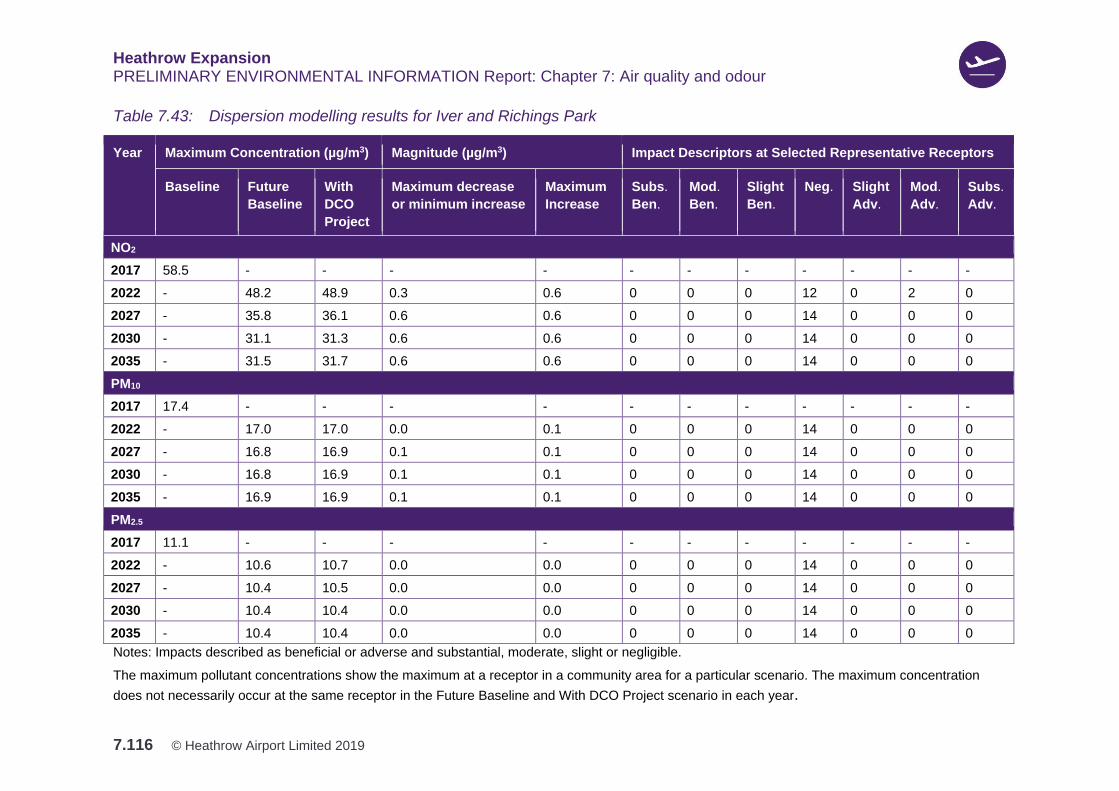
Heathrow Expansion PRELIMINARY ENVIRONMENTAL INFORMATION Report: Chapter 7: Air quality and odour
7.116 © Heathrow Airport Limited 2019
Table 7.43: Dispersion modelling results for Iver and Richings Park
Year Maximum Concentration (µg/m3) Magnitude (µg/m3) Impact Descriptors at Selected Representative Receptors
Baseline Future
Baseline
With
DCO
Project
Maximum decrease
or minimum increase
Maximum
Increase
Subs.
Ben.
Mod.
Ben.
Slight
Ben.
Neg. Slight
Adv.
Mod.
Adv.
Subs.
Adv.
NO2
2017 58.5 - - - - - - - - - - -
2022 - 48.2 48.9 0.3 0.6 0 0 0 12 0 2 0
2027 - 35.8 36.1 0.6 0.6 0 0 0 14 0 0 0
2030 - 31.1 31.3 0.6 0.6 0 0 0 14 0 0 0
2035 - 31.5 31.7 0.6 0.6 0 0 0 14 0 0 0
PM10
2017 17.4 - - - - - - - - - - -
2022 - 17.0 17.0 0.0 0.1 0 0 0 14 0 0 0
2027 - 16.8 16.9 0.1 0.1 0 0 0 14 0 0 0
2030 - 16.8 16.9 0.1 0.1 0 0 0 14 0 0 0
2035 - 16.9 16.9 0.1 0.1 0 0 0 14 0 0 0
PM2.5
2017 11.1 - - - - - - - - - - -
2022 - 10.6 10.7 0.0 0.0 0 0 0 14 0 0 0
2027 - 10.4 10.5 0.0 0.0 0 0 0 14 0 0 0
2030 - 10.4 10.4 0.0 0.0 0 0 0 14 0 0 0
2035 - 10.4 10.4 0.0 0.0 0 0 0 14 0 0 0
Notes: Impacts described as beneficial or adverse and substantial, moderate, slight or negligible.
The maximum pollutant concentrations show the maximum at a receptor in a community area for a particular scenario. The maximum concentration
does not necessarily occur at the same receptor in the Future Baseline and With DCO Project scenario in each year.
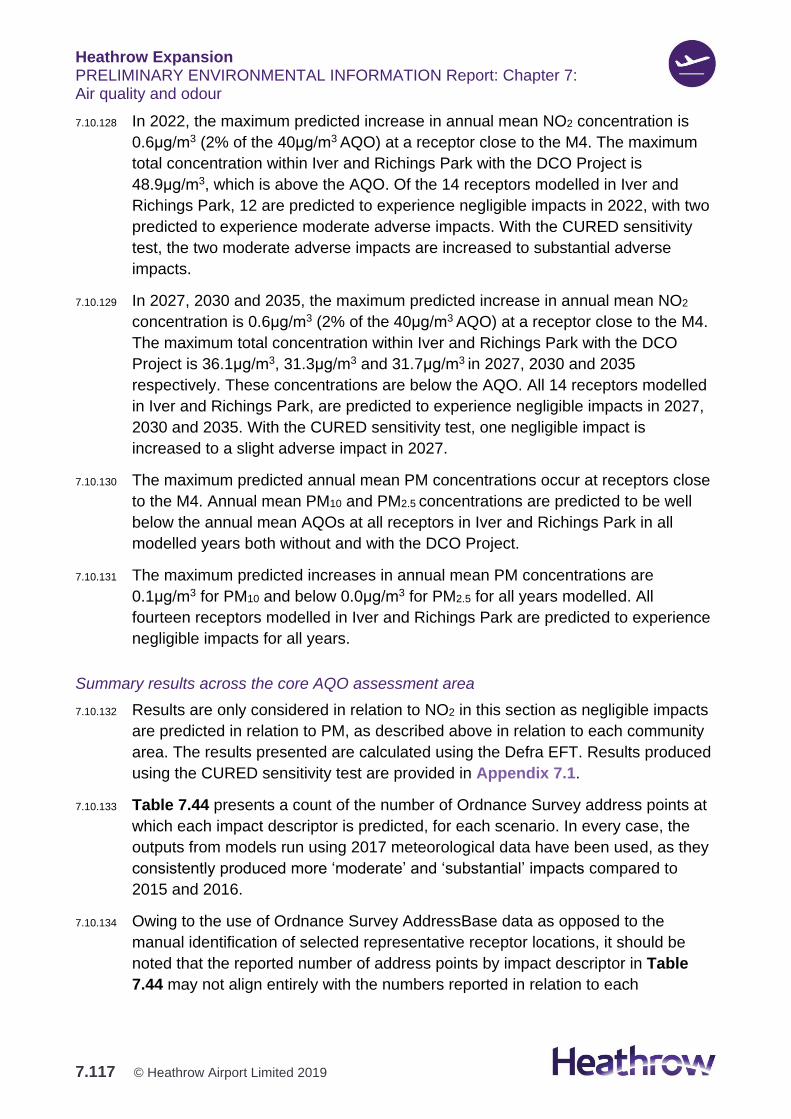
Heathrow Expansion PRELIMINARY ENVIRONMENTAL INFORMATION Report: Chapter 7: Air quality and odour
7.117 © Heathrow Airport Limited 2019
7.10.128 In 2022, the maximum predicted increase in annual mean NO2 concentration is
0.6μg/m3 (2% of the 40μg/m3 AQO) at a receptor close to the M4. The maximum
total concentration within Iver and Richings Park with the DCO Project is
48.9μg/m3, which is above the AQO. Of the 14 receptors modelled in Iver and
Richings Park, 12 are predicted to experience negligible impacts in 2022, with two
predicted to experience moderate adverse impacts. With the CURED sensitivity
test, the two moderate adverse impacts are increased to substantial adverse
impacts.
7.10.129 In 2027, 2030 and 2035, the maximum predicted increase in annual mean NO2
concentration is 0.6μg/m3 (2% of the 40μg/m3 AQO) at a receptor close to the M4.
The maximum total concentration within Iver and Richings Park with the DCO
Project is 36.1μg/m3, 31.3μg/m3 and 31.7μg/m3 in 2027, 2030 and 2035
respectively. These concentrations are below the AQO. All 14 receptors modelled
in Iver and Richings Park, are predicted to experience negligible impacts in 2027,
2030 and 2035. With the CURED sensitivity test, one negligible impact is
increased to a slight adverse impact in 2027.
7.10.130 The maximum predicted annual mean PM concentrations occur at receptors close
to the M4. Annual mean PM10 and PM2.5 concentrations are predicted to be well
below the annual mean AQOs at all receptors in Iver and Richings Park in all
modelled years both without and with the DCO Project.
7.10.131 The maximum predicted increases in annual mean PM concentrations are
0.1μg/m3 for PM10 and below 0.0μg/m3 for PM2.5 for all years modelled. All
fourteen receptors modelled in Iver and Richings Park are predicted to experience
negligible impacts for all years.
Summary results across the core AQO assessment area
7.10.132 Results are only considered in relation to NO2 in this section as negligible impacts
are predicted in relation to PM, as described above in relation to each community
area. The results presented are calculated using the Defra EFT. Results produced
using the CURED sensitivity test are provided in Appendix 7.1.
7.10.133 Table 7.44 presents a count of the number of Ordnance Survey address points at
which each impact descriptor is predicted, for each scenario. In every case, the
outputs from models run using 2017 meteorological data have been used, as they
consistently produced more ‘moderate’ and ‘substantial’ impacts compared to
2015 and 2016.
7.10.134 Owing to the use of Ordnance Survey AddressBase data as opposed to the
manual identification of selected representative receptor locations, it should be
noted that the reported number of address points by impact descriptor in Table
7.44 may not align entirely with the numbers reported in relation to each
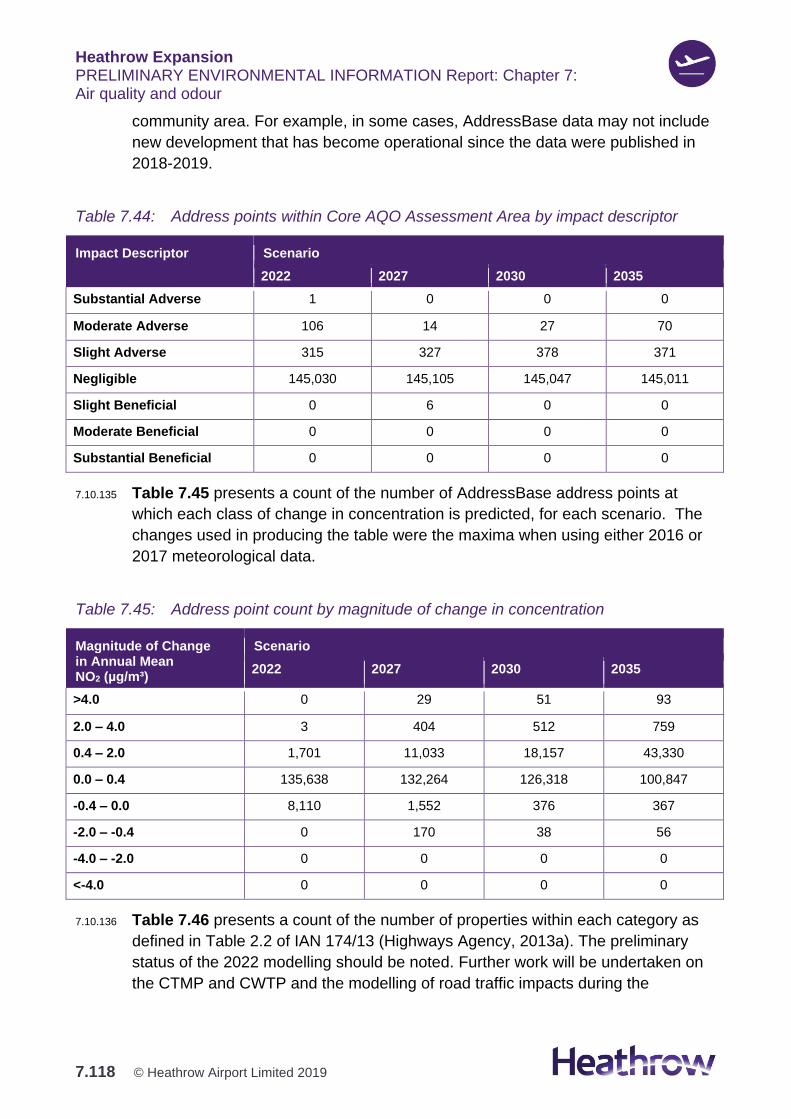
Heathrow Expansion PRELIMINARY ENVIRONMENTAL INFORMATION Report: Chapter 7: Air quality and odour
7.118 © Heathrow Airport Limited 2019
community area. For example, in some cases, AddressBase data may not include
new development that has become operational since the data were published in
2018-2019.
Table 7.44: Address points within Core AQO Assessment Area by impact descriptor
Impact Descriptor Scenario
2022 2027 2030 2035
Substantial Adverse 1 0 0 0
Moderate Adverse 106 14 27 70
Slight Adverse 315 327 378 371
Negligible 145,030 145,105 145,047 145,011
Slight Beneficial 0 6 0 0
Moderate Beneficial 0 0 0 0
Substantial Beneficial 0 0 0 0
7.10.135 Table 7.45 presents a count of the number of AddressBase address points at
which each class of change in concentration is predicted, for each scenario. The
changes used in producing the table were the maxima when using either 2016 or
2017 meteorological data.
Table 7.45: Address point count by magnitude of change in concentration
Magnitude of Change in Annual Mean NO2 (µg/m³)
Scenario
2022 2027 2030 2035
>4.0 0 29 51 93
2.0 – 4.0 3 404 512 759
0.4 – 2.0 1,701 11,033 18,157 43,330
0.0 – 0.4 135,638 132,264 126,318 100,847
-0.4 – 0.0 8,110 1,552 376 367
-2.0 – -0.4 0 170 38 56
-4.0 – -2.0 0 0 0 0
<-4.0 0 0 0 0
7.10.136 Table 7.46 presents a count of the number of properties within each category as
defined in Table 2.2 of IAN 174/13 (Highways Agency, 2013a). The preliminary
status of the 2022 modelling should be noted. Further work will be undertaken on
the CTMP and CWTP and the modelling of road traffic impacts during the
Heathrow Expansion PRELIMINARY ENVIRONMENTAL INFORMATION Report: Chapter 7: Air quality and odour
7.119 © Heathrow Airport Limited 2019
construction phase. Results of the assessment using this refined data will be
presented in the ES. The approach detailed in IAN 174/13 (Highways Agency,
2013a) is not generally considered to apply to the construction phase of a project,
which by its nature is temporary and therefore does not affect the long-term ability
to meet the AQO or limit value. However, the results have been considered using
this approach in 2022 for consistency and to enable comparison across Phases.
Following the approach in IAN 174/13 (Highways Agency, 2013a), the DCO
Project is predicted to cause a small change at 33 receptors where the AQO is
exceeded already, or a new exceedance is created in 2022. No exceedances are
predicted in all other years assessed.
Table 7.46: Local air quality receptors informing significance
Magnitude of Change in Annual Mean NO2 (µg/m³)
Total Number of Receptors
2022 2027 2030 2035
A1 B2 A B A B A B
Large (>4.0) 0 0 0 0 0 0 0 0
Medium (2.0 – 4.0) 0 0 0 0 0 0 0 0
Small (0.4 – 2.0) 333 0 0 0 0 0 0 0
Notes: 1 Increase in NO2 concentration where the AQO is exceeded already, or creation of a new exceedance 2 Reduction in NO2 concentration where the AQO is exceeded already, or removal of an existing exceedance 3 If the EPUK/IAQM definition of negligible (0.2µg/m³), was used instead of the Highways Agency definition of
imperceptible (0.4µg/m³), there would be 79 address points where there is predicted to be a small increase in
NO2 concentration where the AQO is exceeded already, or creation of a new exceedance
7.10.137 Overall, as shown in Table 7.47, following the ‘Approach to be Adopted to
Evaluate Significant Local Air Quality Effects’ in IAN 174/13 (Highways Agency,
2013a), the scheme is judged to be not significant.
Table 7.47: Overall evaluation of local air quality (NO2) significance
Key Criteria Questions Yes/No
Justification
Is there a risk that
environmental standards will be
breached?
Yes Some AQO exceedances are predicted in 2022, but not in any of
the years 2027, 2030 or 2035.
Will there be a large change in
environmental conditions?
No Only small changes are predicted at locations where exceedances
of the annual mean NO2 AQO are predicted.
Will the effect continue for a
long time?
No The DCO Project is predicted to cause a small change at 33
receptors where the AQO is exceeded already, or a new
exceedance is created in 2022. No exceedances are predicted in
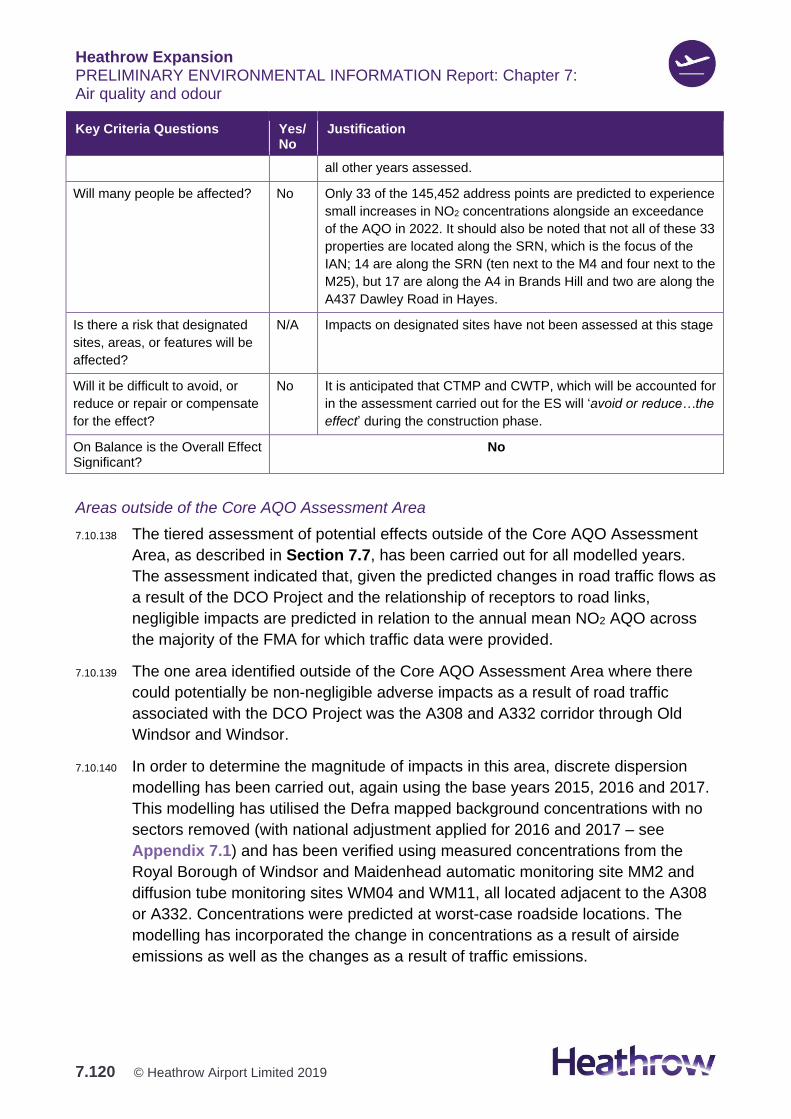
Heathrow Expansion PRELIMINARY ENVIRONMENTAL INFORMATION Report: Chapter 7: Air quality and odour
7.120 © Heathrow Airport Limited 2019
Key Criteria Questions Yes/No
Justification
all other years assessed.
Will many people be affected? No Only 33 of the 145,452 address points are predicted to experience
small increases in NO2 concentrations alongside an exceedance
of the AQO in 2022. It should also be noted that not all of these 33
properties are located along the SRN, which is the focus of the
IAN; 14 are along the SRN (ten next to the M4 and four next to the
M25), but 17 are along the A4 in Brands Hill and two are along the
A437 Dawley Road in Hayes.
Is there a risk that designated
sites, areas, or features will be
affected?
N/A Impacts on designated sites have not been assessed at this stage
Will it be difficult to avoid, or
reduce or repair or compensate
for the effect?
No It is anticipated that CTMP and CWTP, which will be accounted for
in the assessment carried out for the ES will ‘avoid or reduce…the
effect’ during the construction phase.
On Balance is the Overall Effect Significant?
No
Areas outside of the Core AQO Assessment Area
7.10.138 The tiered assessment of potential effects outside of the Core AQO Assessment
Area, as described in Section 7.7, has been carried out for all modelled years.
The assessment indicated that, given the predicted changes in road traffic flows as
a result of the DCO Project and the relationship of receptors to road links,
negligible impacts are predicted in relation to the annual mean NO2 AQO across
the majority of the FMA for which traffic data were provided.
7.10.139 The one area identified outside of the Core AQO Assessment Area where there
could potentially be non-negligible adverse impacts as a result of road traffic
associated with the DCO Project was the A308 and A332 corridor through Old
Windsor and Windsor.
7.10.140 In order to determine the magnitude of impacts in this area, discrete dispersion
modelling has been carried out, again using the base years 2015, 2016 and 2017.
This modelling has utilised the Defra mapped background concentrations with no
sectors removed (with national adjustment applied for 2016 and 2017 – see
Appendix 7.1) and has been verified using measured concentrations from the
Royal Borough of Windsor and Maidenhead automatic monitoring site MM2 and
diffusion tube monitoring sites WM04 and WM11, all located adjacent to the A308
or A332. Concentrations were predicted at worst-case roadside locations. The
modelling has incorporated the change in concentrations as a result of airside
emissions as well as the changes as a result of traffic emissions.
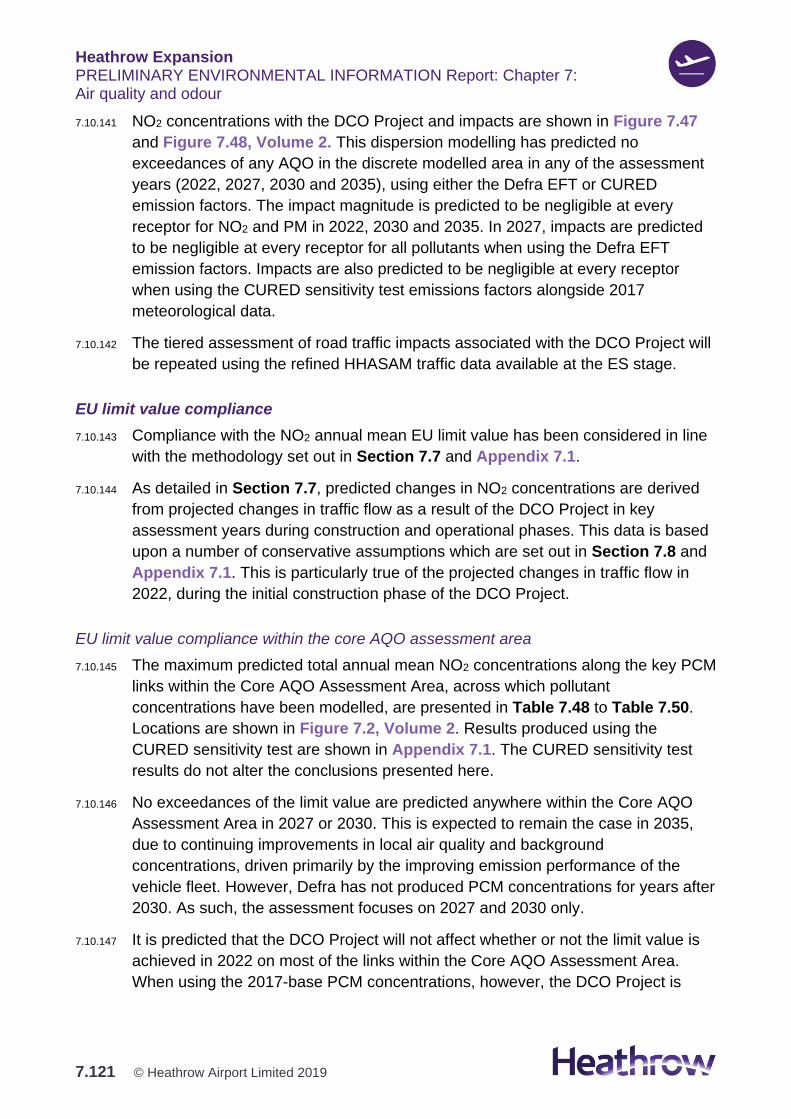
Heathrow Expansion PRELIMINARY ENVIRONMENTAL INFORMATION Report: Chapter 7: Air quality and odour
7.121 © Heathrow Airport Limited 2019
7.10.141 NO2 concentrations with the DCO Project and impacts are shown in Figure 7.47
and Figure 7.48, Volume 2. This dispersion modelling has predicted no
exceedances of any AQO in the discrete modelled area in any of the assessment
years (2022, 2027, 2030 and 2035), using either the Defra EFT or CURED
emission factors. The impact magnitude is predicted to be negligible at every
receptor for NO2 and PM in 2022, 2030 and 2035. In 2027, impacts are predicted
to be negligible at every receptor for all pollutants when using the Defra EFT
emission factors. Impacts are also predicted to be negligible at every receptor
when using the CURED sensitivity test emissions factors alongside 2017
meteorological data.
7.10.142 The tiered assessment of road traffic impacts associated with the DCO Project will
be repeated using the refined HHASAM traffic data available at the ES stage.
EU limit value compliance
7.10.143 Compliance with the NO2 annual mean EU limit value has been considered in line
with the methodology set out in Section 7.7 and Appendix 7.1.
7.10.144 As detailed in Section 7.7, predicted changes in NO2 concentrations are derived
from projected changes in traffic flow as a result of the DCO Project in key
assessment years during construction and operational phases. This data is based
upon a number of conservative assumptions which are set out in Section 7.8 and
Appendix 7.1. This is particularly true of the projected changes in traffic flow in
2022, during the initial construction phase of the DCO Project.
EU limit value compliance within the core AQO assessment area
7.10.145 The maximum predicted total annual mean NO2 concentrations along the key PCM
links within the Core AQO Assessment Area, across which pollutant
concentrations have been modelled, are presented in Table 7.48 to Table 7.50.
Locations are shown in Figure 7.2, Volume 2. Results produced using the
CURED sensitivity test are shown in Appendix 7.1. The CURED sensitivity test
results do not alter the conclusions presented here.
7.10.146 No exceedances of the limit value are predicted anywhere within the Core AQO
Assessment Area in 2027 or 2030. This is expected to remain the case in 2035,
due to continuing improvements in local air quality and background
concentrations, driven primarily by the improving emission performance of the
vehicle fleet. However, Defra has not produced PCM concentrations for years after
2030. As such, the assessment focuses on 2027 and 2030 only.
7.10.147 It is predicted that the DCO Project will not affect whether or not the limit value is
achieved in 2022 on most of the links within the Core AQO Assessment Area.
When using the 2017-base PCM concentrations, however, the DCO Project is
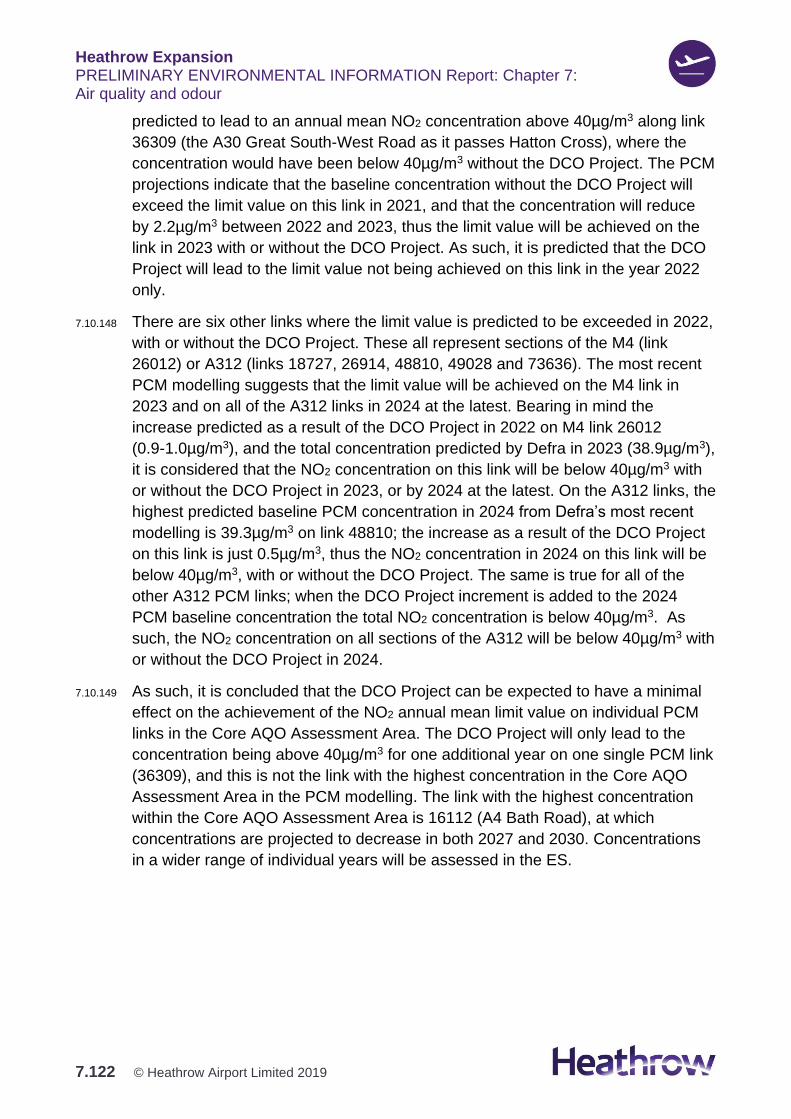
Heathrow Expansion PRELIMINARY ENVIRONMENTAL INFORMATION Report: Chapter 7: Air quality and odour
7.122 © Heathrow Airport Limited 2019
predicted to lead to an annual mean NO2 concentration above 40µg/m3 along link
36309 (the A30 Great South-West Road as it passes Hatton Cross), where the
concentration would have been below 40µg/m3 without the DCO Project. The PCM
projections indicate that the baseline concentration without the DCO Project will
exceed the limit value on this link in 2021, and that the concentration will reduce
by 2.2µg/m3 between 2022 and 2023, thus the limit value will be achieved on the
link in 2023 with or without the DCO Project. As such, it is predicted that the DCO
Project will lead to the limit value not being achieved on this link in the year 2022
only.
7.10.148 There are six other links where the limit value is predicted to be exceeded in 2022,
with or without the DCO Project. These all represent sections of the M4 (link
26012) or A312 (links 18727, 26914, 48810, 49028 and 73636). The most recent
PCM modelling suggests that the limit value will be achieved on the M4 link in
2023 and on all of the A312 links in 2024 at the latest. Bearing in mind the
increase predicted as a result of the DCO Project in 2022 on M4 link 26012
(0.9-1.0µg/m3), and the total concentration predicted by Defra in 2023 (38.9µg/m3),
it is considered that the NO2 concentration on this link will be below 40µg/m3 with
or without the DCO Project in 2023, or by 2024 at the latest. On the A312 links, the
highest predicted baseline PCM concentration in 2024 from Defra’s most recent
modelling is 39.3µg/m3 on link 48810; the increase as a result of the DCO Project
on this link is just 0.5µg/m3, thus the NO2 concentration in 2024 on this link will be
below 40µg/m3, with or without the DCO Project. The same is true for all of the
other A312 PCM links; when the DCO Project increment is added to the 2024
PCM baseline concentration the total NO2 concentration is below 40µg/m3. As
such, the NO2 concentration on all sections of the A312 will be below 40µg/m3 with
or without the DCO Project in 2024.
7.10.149 As such, it is concluded that the DCO Project can be expected to have a minimal
effect on the achievement of the NO2 annual mean limit value on individual PCM
links in the Core AQO Assessment Area. The DCO Project will only lead to the
concentration being above 40µg/m3 for one additional year on one single PCM link
(36309), and this is not the link with the highest concentration in the Core AQO
Assessment Area in the PCM modelling. The link with the highest concentration
within the Core AQO Assessment Area is 16112 (A4 Bath Road), at which
concentrations are projected to decrease in both 2027 and 2030. Concentrations
in a wider range of individual years will be assessed in the ES.
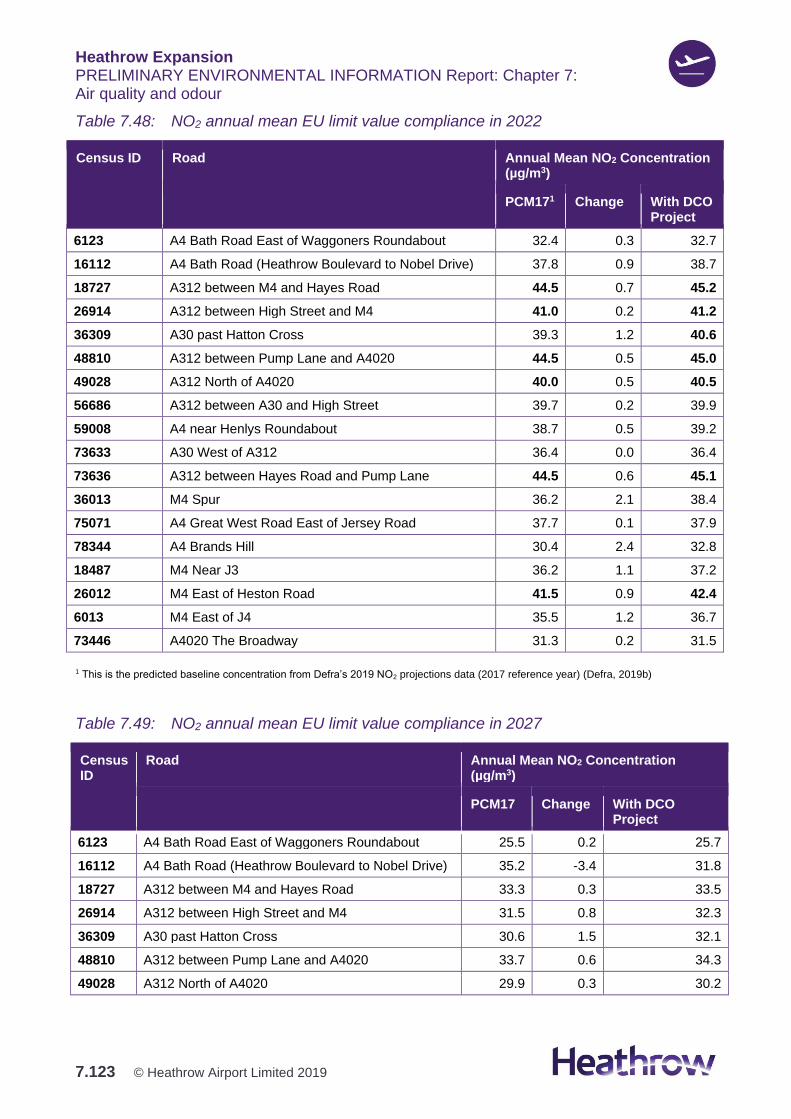
Heathrow Expansion PRELIMINARY ENVIRONMENTAL INFORMATION Report: Chapter 7: Air quality and odour
7.123 © Heathrow Airport Limited 2019
Table 7.48: NO2 annual mean EU limit value compliance in 2022
Census ID Road Annual Mean NO2 Concentration (µg/m3)
PCM171 Change With DCO Project
6123 A4 Bath Road East of Waggoners Roundabout 32.4 0.3 32.7
16112 A4 Bath Road (Heathrow Boulevard to Nobel Drive) 37.8 0.9 38.7
18727 A312 between M4 and Hayes Road 44.5 0.7 45.2
26914 A312 between High Street and M4 41.0 0.2 41.2
36309 A30 past Hatton Cross 39.3 1.2 40.6
48810 A312 between Pump Lane and A4020 44.5 0.5 45.0
49028 A312 North of A4020 40.0 0.5 40.5
56686 A312 between A30 and High Street 39.7 0.2 39.9
59008 A4 near Henlys Roundabout 38.7 0.5 39.2
73633 A30 West of A312 36.4 0.0 36.4
73636 A312 between Hayes Road and Pump Lane 44.5 0.6 45.1
36013 M4 Spur 36.2 2.1 38.4
75071 A4 Great West Road East of Jersey Road 37.7 0.1 37.9
78344 A4 Brands Hill 30.4 2.4 32.8
18487 M4 Near J3 36.2 1.1 37.2
26012 M4 East of Heston Road 41.5 0.9 42.4
6013 M4 East of J4 35.5 1.2 36.7
73446 A4020 The Broadway 31.3 0.2 31.5
1 This is the predicted baseline concentration from Defra’s 2019 NO2 projections data (2017 reference year) (Defra, 2019b)
Table 7.49: NO2 annual mean EU limit value compliance in 2027
Census ID
Road Annual Mean NO2 Concentration (µg/m3)
PCM17 Change With DCO Project
6123 A4 Bath Road East of Waggoners Roundabout 25.5 0.2 25.7
16112 A4 Bath Road (Heathrow Boulevard to Nobel Drive) 35.2 -3.4 31.8
18727 A312 between M4 and Hayes Road 33.3 0.3 33.5
26914 A312 between High Street and M4 31.5 0.8 32.3
36309 A30 past Hatton Cross 30.6 1.5 32.1
48810 A312 between Pump Lane and A4020 33.7 0.6 34.3
49028 A312 North of A4020 29.9 0.3 30.2
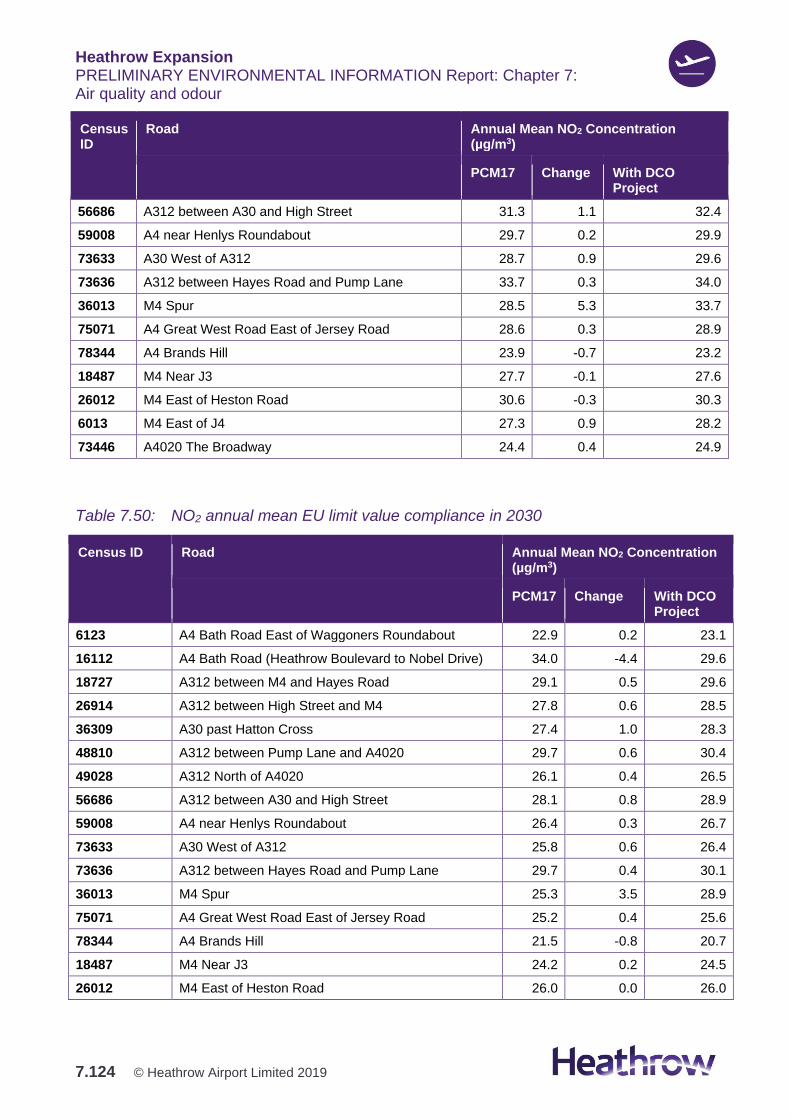
Heathrow Expansion PRELIMINARY ENVIRONMENTAL INFORMATION Report: Chapter 7: Air quality and odour
7.124 © Heathrow Airport Limited 2019
Census ID
Road Annual Mean NO2 Concentration (µg/m3)
PCM17 Change With DCO Project
56686 A312 between A30 and High Street 31.3 1.1 32.4
59008 A4 near Henlys Roundabout 29.7 0.2 29.9
73633 A30 West of A312 28.7 0.9 29.6
73636 A312 between Hayes Road and Pump Lane 33.7 0.3 34.0
36013 M4 Spur 28.5 5.3 33.7
75071 A4 Great West Road East of Jersey Road 28.6 0.3 28.9
78344 A4 Brands Hill 23.9 -0.7 23.2
18487 M4 Near J3 27.7 -0.1 27.6
26012 M4 East of Heston Road 30.6 -0.3 30.3
6013 M4 East of J4 27.3 0.9 28.2
73446 A4020 The Broadway 24.4 0.4 24.9
Table 7.50: NO2 annual mean EU limit value compliance in 2030
Census ID Road Annual Mean NO2 Concentration (µg/m3)
PCM17 Change With DCO Project
6123 A4 Bath Road East of Waggoners Roundabout 22.9 0.2 23.1
16112 A4 Bath Road (Heathrow Boulevard to Nobel Drive) 34.0 -4.4 29.6
18727 A312 between M4 and Hayes Road 29.1 0.5 29.6
26914 A312 between High Street and M4 27.8 0.6 28.5
36309 A30 past Hatton Cross 27.4 1.0 28.3
48810 A312 between Pump Lane and A4020 29.7 0.6 30.4
49028 A312 North of A4020 26.1 0.4 26.5
56686 A312 between A30 and High Street 28.1 0.8 28.9
59008 A4 near Henlys Roundabout 26.4 0.3 26.7
73633 A30 West of A312 25.8 0.6 26.4
73636 A312 between Hayes Road and Pump Lane 29.7 0.4 30.1
36013 M4 Spur 25.3 3.5 28.9
75071 A4 Great West Road East of Jersey Road 25.2 0.4 25.6
78344 A4 Brands Hill 21.5 -0.8 20.7
18487 M4 Near J3 24.2 0.2 24.5
26012 M4 East of Heston Road 26.0 0.0 26.0
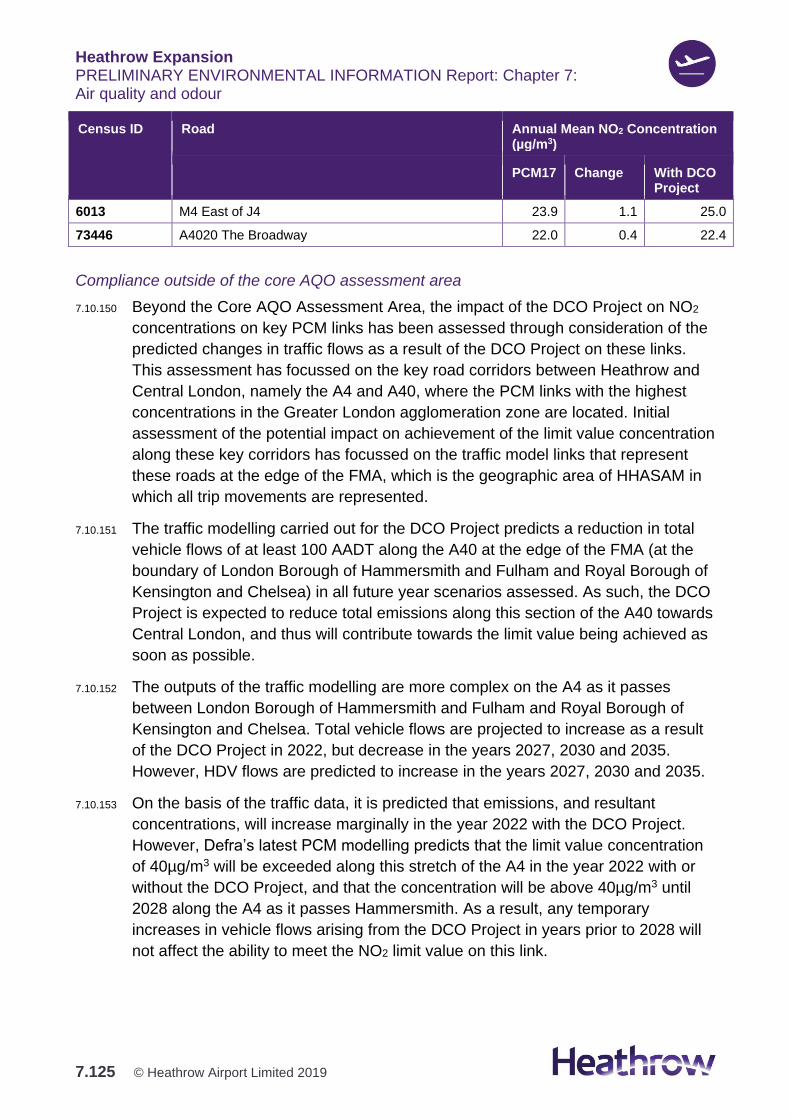
Heathrow Expansion PRELIMINARY ENVIRONMENTAL INFORMATION Report: Chapter 7: Air quality and odour
7.125 © Heathrow Airport Limited 2019
Census ID Road Annual Mean NO2 Concentration (µg/m3)
PCM17 Change With DCO Project
6013 M4 East of J4 23.9 1.1 25.0
73446 A4020 The Broadway 22.0 0.4 22.4
Compliance outside of the core AQO assessment area
7.10.150 Beyond the Core AQO Assessment Area, the impact of the DCO Project on NO2
concentrations on key PCM links has been assessed through consideration of the
predicted changes in traffic flows as a result of the DCO Project on these links.
This assessment has focussed on the key road corridors between Heathrow and
Central London, namely the A4 and A40, where the PCM links with the highest
concentrations in the Greater London agglomeration zone are located. Initial
assessment of the potential impact on achievement of the limit value concentration
along these key corridors has focussed on the traffic model links that represent
these roads at the edge of the FMA, which is the geographic area of HHASAM in
which all trip movements are represented.
7.10.151 The traffic modelling carried out for the DCO Project predicts a reduction in total
vehicle flows of at least 100 AADT along the A40 at the edge of the FMA (at the
boundary of London Borough of Hammersmith and Fulham and Royal Borough of
Kensington and Chelsea) in all future year scenarios assessed. As such, the DCO
Project is expected to reduce total emissions along this section of the A40 towards
Central London, and thus will contribute towards the limit value being achieved as
soon as possible.
7.10.152 The outputs of the traffic modelling are more complex on the A4 as it passes
between London Borough of Hammersmith and Fulham and Royal Borough of
Kensington and Chelsea. Total vehicle flows are projected to increase as a result
of the DCO Project in 2022, but decrease in the years 2027, 2030 and 2035.
However, HDV flows are predicted to increase in the years 2027, 2030 and 2035.
7.10.153 On the basis of the traffic data, it is predicted that emissions, and resultant
concentrations, will increase marginally in the year 2022 with the DCO Project.
However, Defra’s latest PCM modelling predicts that the limit value concentration
of 40µg/m3 will be exceeded along this stretch of the A4 in the year 2022 with or
without the DCO Project, and that the concentration will be above 40µg/m3 until
2028 along the A4 as it passes Hammersmith. As a result, any temporary
increases in vehicle flows arising from the DCO Project in years prior to 2028 will
not affect the ability to meet the NO2 limit value on this link.
Heathrow Expansion PRELIMINARY ENVIRONMENTAL INFORMATION Report: Chapter 7: Air quality and odour
7.126 © Heathrow Airport Limited 2019
7.10.154 To consider the change in emissions on the A4 as a result of the DCO Project in
2027, 2030 and 2035, Defra’s EFT has been used to predict the total change in
emissions in each year considering reductions in LDVs and increases in HDVs.
PCM modelling focusses on predicting concentrations adjacent to sections of road
that are representative of a 100 m stretch and not within 25 m of a junction. As
such, a realistic free-flow speed of 50kph has been used when predicting
emissions. In each year, the outputs of this assessment indicate that the reduction
in LDVs will more than offset the additional emissions from the increase in HDVs.
Noting that the CURED sensitivity test only uplifts LDV emissions factors, it can be
expected that the same conclusion would be drawn were this emissions model to
be used instead of the EFT, i.e. that the reduction in light vehicle emissions would
more than offset the increases in heavy vehicle emissions in the years 2027, 2030
and 2035. The DCO Project is therefore expected to reduce emissions, and
resultant concentrations, along this section of the A4 towards Central London, and
will not delay the achievement of the limit value on this link.
7.10.155 Further consideration of the impact of the DCO Project on PCM compliance in
Central London, beyond the extent of the FMA, has focussed on the outputs of the
traffic demand models. The SAP document (and the Heathrow vehicle access
charge in particular) demonstrates how the Assessment Case is effective at
reducing private vehicle trips to / from Central London as it is well served by public
transport, including schemes like the Elizabeth line and the Piccadilly line upgrade.
Proposals for reduced Heathrow Express fares are predicted to further reduce
demand for private vehicle trips to / from central London. The 2035 DCO Project
scenario modelled in London Airports Surface Access Model (LASAM - the air
passenger surface access mode choice model) achieves a public transport mode
share of 54%. The total number of air passengers forecast to travel to and from
central London increases by just over 33% in the DCO Project scenario compared
to the future baseline. However, the forecast increase in public transport mode
share in Central London means that the number of air passengers using private
vehicle modes is forecast to reduce by 18%.
Compliance risk assessment
7.10.156 Consideration has also been given to compliance in the context of Highways
England’s Interim Advice Note (IAN) 175/13 - Risk assessment of compliance with
the EU Directive on ambient air quality and production of Scheme Air Quality
Action Plans. Specifically, the results set out above have been considered in terms
of the flow chart presented in Annex A of that document.
7.10.157 It should be noted that the IAN 175/13 (Highways Agency, 2013b) risk assessment
is designed to be applied only to the operational impacts of a scheme, not to
impacts arising during the construction phase. It has been applied to the
Heathrow Expansion PRELIMINARY ENVIRONMENTAL INFORMATION Report: Chapter 7: Air quality and odour
7.127 © Heathrow Airport Limited 2019
construction impacts in this case for completeness and is considered a helpful way
of presenting the results.
7.10.158 The assessment results predict no exceedances of the limit value within the Core
AQO Assessment Area in the assessment years 2027 and 2030, with or without
the DCO Project. The assessment results predict that the DCO Project will reduce
concentrations on key links extending into Central London, including the A40. As
such, using the flow chart, it is concluded that the DCO Project is Low Risk.
7.10.159 In 2022, during the construction phase, exceedances of the limit values are
predicted within the Core AQO Assessment Area without the DCO Project. In
2022, projected changes in pollutant concentrations due to the Project are
principally driven by construction traffic.
Heathrow Expansion PRELIMINARY ENVIRONMENTAL INFORMATION Report: Chapter 7: Air quality and odour
7.128 © Heathrow Airport Limited 2019
7.10.161 Table 7.48 demonstrates that the DCO Project will lead to increases in
concentrations on those PCM links where the predicted concentration is above
40µg/m3, and that the increase will be greater than 0.4µg/m3 (1%). Therefore,
using the flow chart, based on a conservative assessment that has not yet
accounted for the final CTMP and CWTP, preliminary findings are that the scheme
is High Risk when considering the construction impacts in 2022, as modelled.
7.10.162 However, as has been stated in Section 7.8, there are limitations to the predicted
traffic flows used for the 2022 construction assessment, such that changes in
traffic flows are anticipated to reduce following application of the suite of measures
to be developed further for the ES which will constitute the Action Plan for the
construction phase. As such, these results should be considered preliminary, but
will inform development of measures to manage construction traffic flows in
advance of the production of the ES, in order to ensure that impacts during
construction are reduced as far as practicable. It must also be noted that the
scheme will not result in a compliant zone becoming non-compliant, or delay the
date predicted by Defra for achieving compliance in the Greater London
agglomeration zone.
Operational odour
7.10.163 In general, the risk-based assessment shows that community areas towards the
south and south-east of the Airport are less likely to have odour emissions
dispersed towards them (including Feltham North and Bedfont). This is because
prevailing winds at Heathrow are predominantly from the west, south-west and, to
a smaller extent, the north-east.
7.10.164 Generally, the level of odour impacts will decrease with increasing distance from
the source, i.e. those areas closest to the airfield activity introduced around the
North West Runway have the potential to experience higher odour impacts than
those at greater distance.
7.10.165 During Phase 1, it is likely that additional potential odour impacts from operational
activities will be negligible because, when compared with current airport
operations, there is a relatively small change in ATMs compared to the existing
baseline.
7.10.166 The DCO Project will have the effect of distributing potential odour impacts over a
wider area than at present due to increased airside activity. Members of
communities close to the existing Airport boundary may have developed a
tolerance to odour emissions arising from airport operations, but this may not be
the case for those which will be located closer to the new DCO Project boundary,
such as receptors in Harmondsworth, Sipson and West Drayton.
Heathrow Expansion PRELIMINARY ENVIRONMENTAL INFORMATION Report: Chapter 7: Air quality and odour
7.129 © Heathrow Airport Limited 2019
7.10.167 Table 7.51 below summarises the results from the risk-based assessment of
odour during Phase 2 and Phase 3. The assessment is not a prediction of what
will actually occur during Phase 2 and Phase 3, but the potential for occurrences.
For operational activities in Phase 3, it is likely that odour effects will be similar to
those occurring in Phase 2. This is because, although ATMs continue to increase,
it is considered that the observable odour effects will be negligible as the locations
of emissions will be broadly similar.
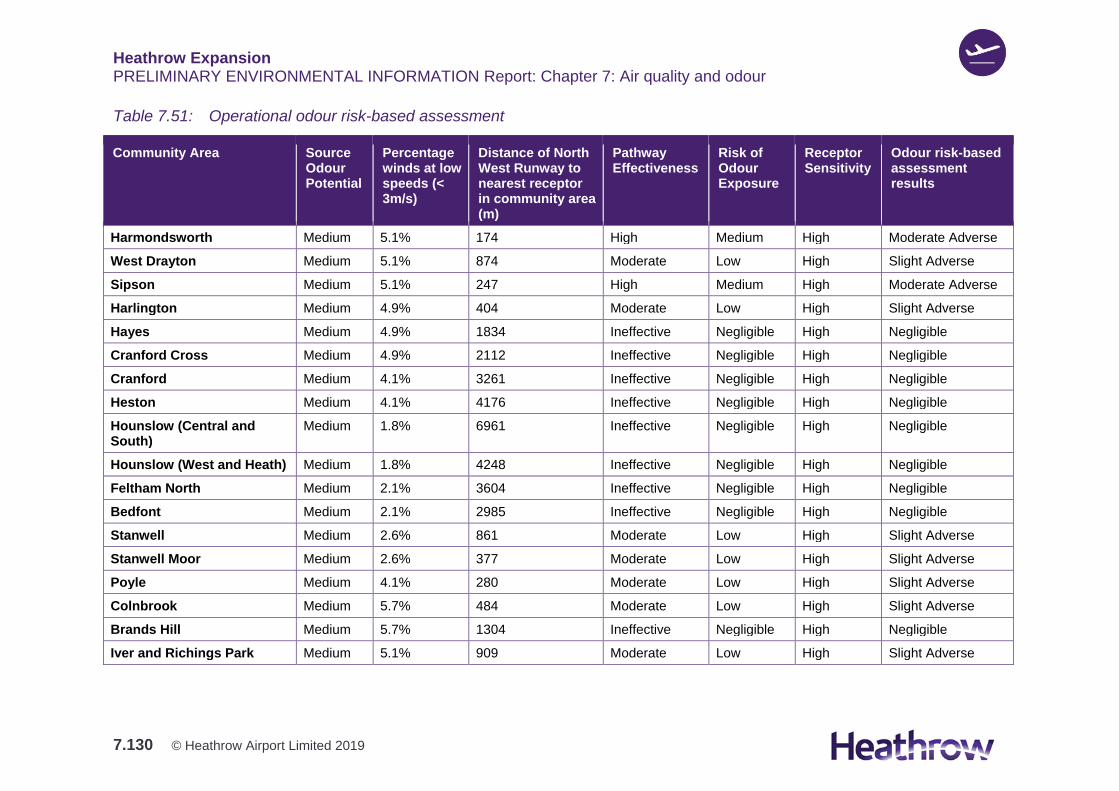
Heathrow Expansion PRELIMINARY ENVIRONMENTAL INFORMATION Report: Chapter 7: Air quality and odour
7.130 © Heathrow Airport Limited 2019
Table 7.51: Operational odour risk-based assessment
Community Area Source Odour Potential
Percentage winds at low speeds (< 3m/s)
Distance of North West Runway to nearest receptor in community area (m)
Pathway Effectiveness
Risk of Odour Exposure
Receptor Sensitivity
Odour risk-based assessment results
Harmondsworth Medium 5.1% 174 High Medium High Moderate Adverse
West Drayton Medium 5.1% 874 Moderate Low High Slight Adverse
Sipson Medium 5.1% 247 High Medium High Moderate Adverse
Harlington Medium 4.9% 404 Moderate Low High Slight Adverse
Hayes Medium 4.9% 1834 Ineffective Negligible High Negligible
Cranford Cross Medium 4.9% 2112 Ineffective Negligible High Negligible
Cranford Medium 4.1% 3261 Ineffective Negligible High Negligible
Heston Medium 4.1% 4176 Ineffective Negligible High Negligible
Hounslow (Central and South)
Medium 1.8% 6961 Ineffective Negligible High Negligible
Hounslow (West and Heath) Medium 1.8% 4248 Ineffective Negligible High Negligible
Feltham North Medium 2.1% 3604 Ineffective Negligible High Negligible
Bedfont Medium 2.1% 2985 Ineffective Negligible High Negligible
Stanwell Medium 2.6% 861 Moderate Low High Slight Adverse
Stanwell Moor Medium 2.6% 377 Moderate Low High Slight Adverse
Poyle Medium 4.1% 280 Moderate Low High Slight Adverse
Colnbrook Medium 5.7% 484 Moderate Low High Slight Adverse
Brands Hill Medium 5.7% 1304 Ineffective Negligible High Negligible
Iver and Richings Park Medium 5.1% 909 Moderate Low High Slight Adverse
Heathrow Expansion PRELIMINARY ENVIRONMENTAL INFORMATION Report: Chapter 7: Air quality and odour
7.131 © Heathrow Airport Limited 2019
7.10.168 It is possible that some local communities may experience occasional, short-term
odour annoyance under specific weather conditions. At present, a limited number
of complaints in relation to aviation fuel odour are currently received from
receptors in the vicinity of Heathrow (fewer than one complaint per month). It is
anticipated that, given the increase in activity and size of Heathrow and
introduction of activities closer to different communities, there may be occasional,
short-term increases in the level of annoyance. As a result, the number of odour
complaints received may increase. However, this is considered likely to remain at
a limited level due to the low frequency of the necessary meteorological conditions
and medium odour source potential. This effect is therefore considered to be not
significant. The procedure for raising complaints, and subsequent investigation of
these complaints will continue.
7.11 Preliminary assessment of significance
7.11.1 The significance of effects remaining once all embedded environmental measures
have been taken into consideration is summarised in Table 7.52.
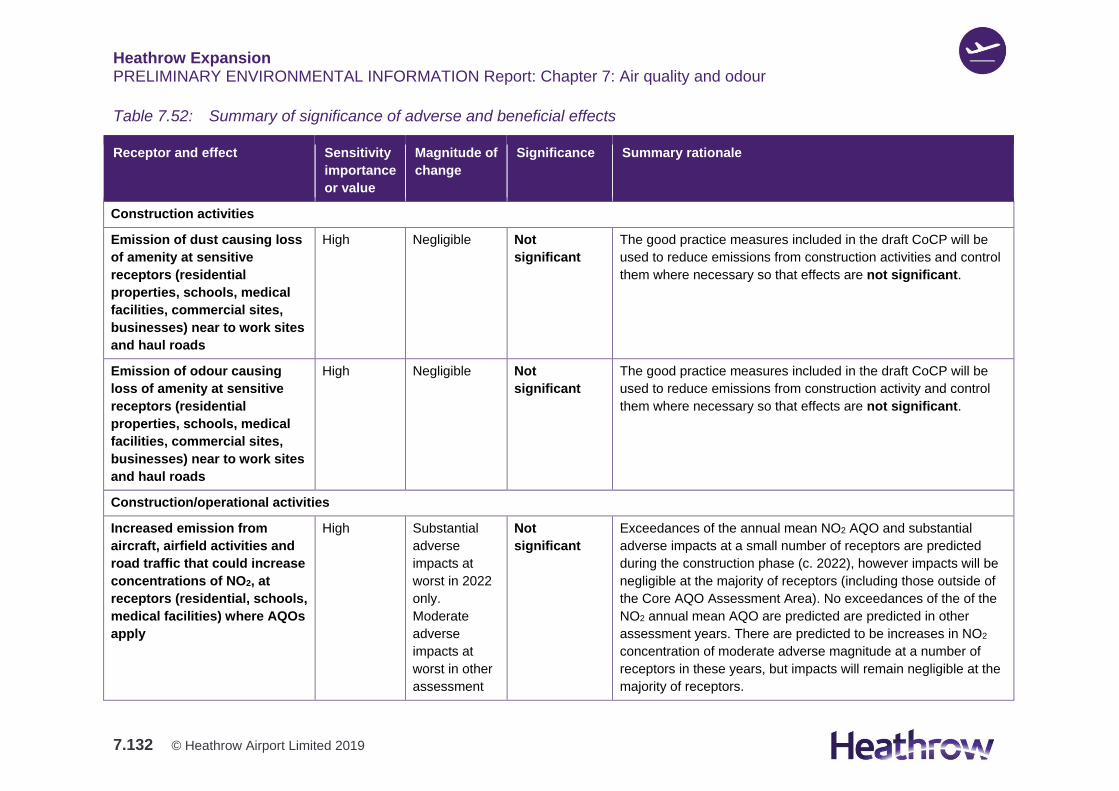
Heathrow Expansion PRELIMINARY ENVIRONMENTAL INFORMATION Report: Chapter 7: Air quality and odour
7.132 © Heathrow Airport Limited 2019
Table 7.52: Summary of significance of adverse and beneficial effects
Receptor and effect Sensitivity
importance
or value
Magnitude of
change
Significance Summary rationale
Construction activities
Emission of dust causing loss
of amenity at sensitive
receptors (residential
properties, schools, medical
facilities, commercial sites,
businesses) near to work sites
and haul roads
High Negligible Not
significant
The good practice measures included in the draft CoCP will be
used to reduce emissions from construction activities and control
them where necessary so that effects are not significant.
Emission of odour causing
loss of amenity at sensitive
receptors (residential
properties, schools, medical
facilities, commercial sites,
businesses) near to work sites
and haul roads
High Negligible Not
significant
The good practice measures included in the draft CoCP will be
used to reduce emissions from construction activity and control
them where necessary so that effects are not significant.
Construction/operational activities
Increased emission from
aircraft, airfield activities and
road traffic that could increase
concentrations of NO2, at
receptors (residential, schools,
medical facilities) where AQOs
apply
High Substantial
adverse
impacts at
worst in 2022
only.
Moderate
adverse
impacts at
worst in other
assessment
Not
significant
Exceedances of the annual mean NO2 AQO and substantial
adverse impacts at a small number of receptors are predicted
during the construction phase (c. 2022), however impacts will be
negligible at the majority of receptors (including those outside of
the Core AQO Assessment Area). No exceedances of the of the
NO2 annual mean AQO are predicted are predicted in other
assessment years. There are predicted to be increases in NO2
concentration of moderate adverse magnitude at a number of
receptors in these years, but impacts will remain negligible at the
majority of receptors.
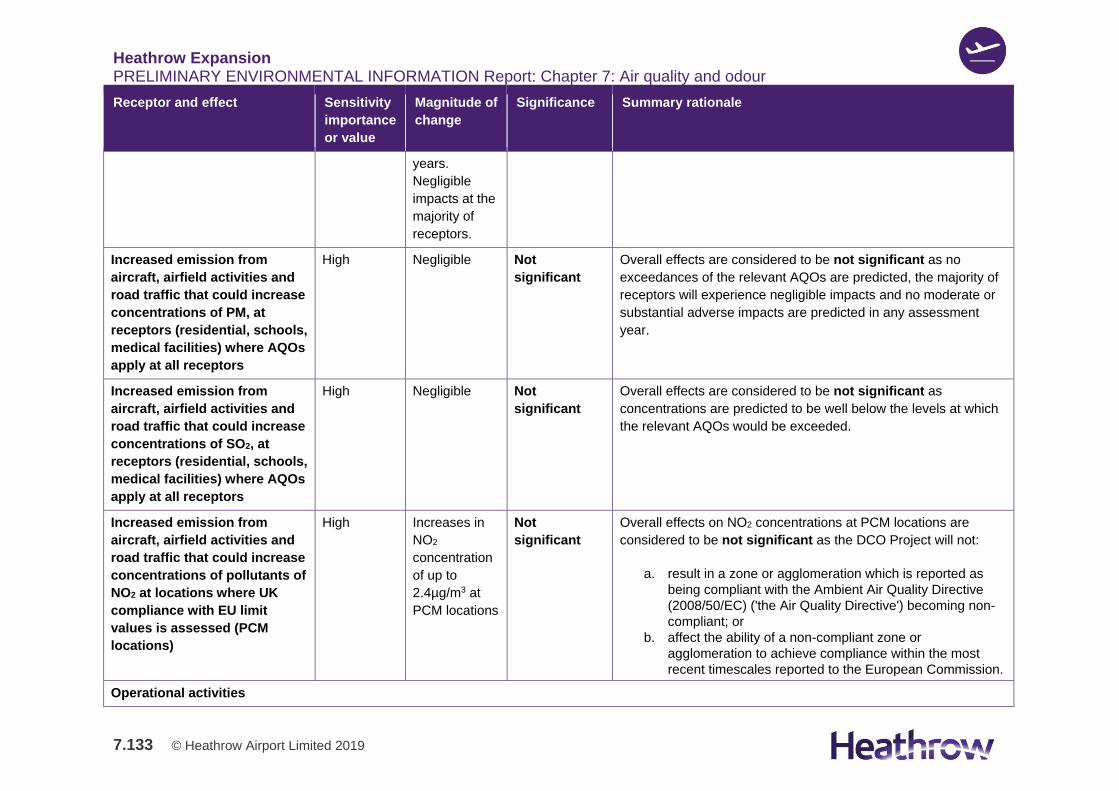
Heathrow Expansion PRELIMINARY ENVIRONMENTAL INFORMATION Report: Chapter 7: Air quality and odour
7.133 © Heathrow Airport Limited 2019
Receptor and effect Sensitivity
importance
or value
Magnitude of
change
Significance Summary rationale
years.
Negligible
impacts at the
majority of
receptors.
Increased emission from
aircraft, airfield activities and
road traffic that could increase
concentrations of PM, at
receptors (residential, schools,
medical facilities) where AQOs
apply at all receptors
High Negligible Not
significant
Overall effects are considered to be not significant as no
exceedances of the relevant AQOs are predicted, the majority of
receptors will experience negligible impacts and no moderate or
substantial adverse impacts are predicted in any assessment
year.
Increased emission from
aircraft, airfield activities and
road traffic that could increase
concentrations of SO2, at
receptors (residential, schools,
medical facilities) where AQOs
apply at all receptors
High Negligible Not
significant
Overall effects are considered to be not significant as
concentrations are predicted to be well below the levels at which
the relevant AQOs would be exceeded.
Increased emission from
aircraft, airfield activities and
road traffic that could increase
concentrations of pollutants of
NO2 at locations where UK
compliance with EU limit
values is assessed (PCM
locations)
High Increases in
NO2
concentration
of up to
2.4µg/m3 at
PCM locations
Not
significant
Overall effects on NO2 concentrations at PCM locations are
considered to be not significant as the DCO Project will not:
a. result in a zone or agglomeration which is reported as
being compliant with the Ambient Air Quality Directive
(2008/50/EC) ('the Air Quality Directive') becoming non-
compliant; or
b. affect the ability of a non-compliant zone or
agglomeration to achieve compliance within the most
recent timescales reported to the European Commission.
Operational activities
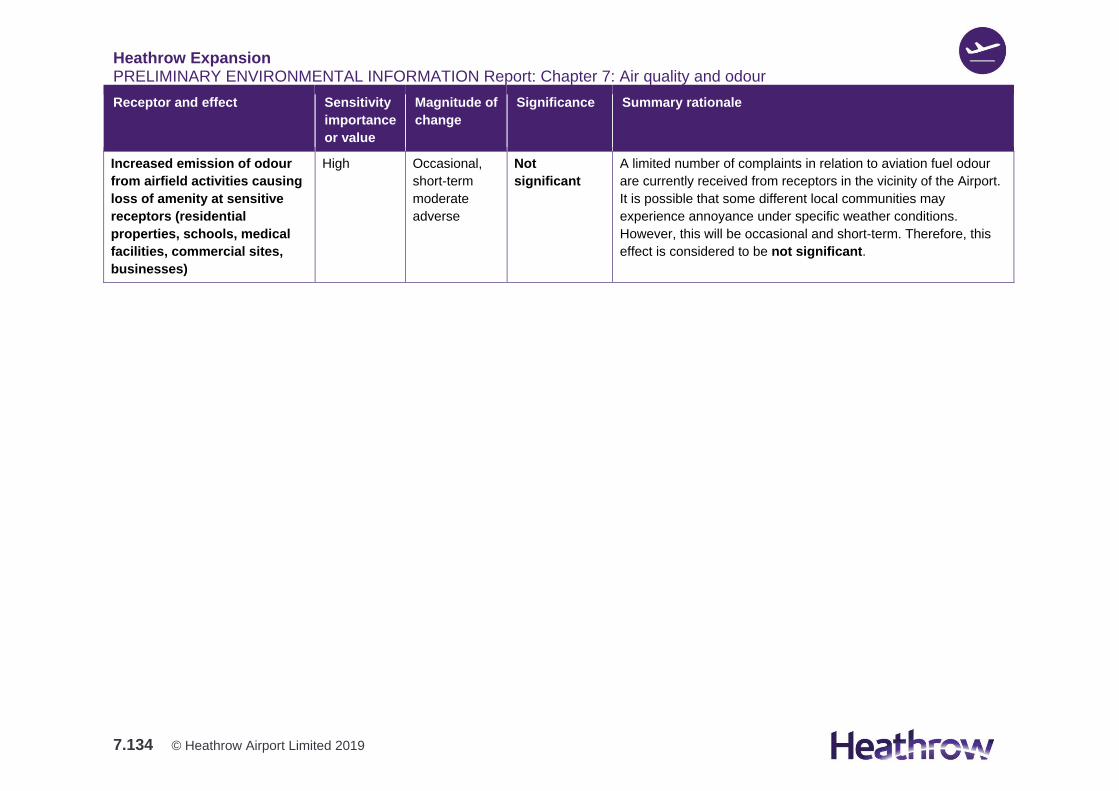
Heathrow Expansion PRELIMINARY ENVIRONMENTAL INFORMATION Report: Chapter 7: Air quality and odour
7.134 © Heathrow Airport Limited 2019
Receptor and effect Sensitivity
importance
or value
Magnitude of
change
Significance Summary rationale
Increased emission of odour
from airfield activities causing
loss of amenity at sensitive
receptors (residential
properties, schools, medical
facilities, commercial sites,
businesses)
High Occasional,
short-term
moderate
adverse
Not
significant
A limited number of complaints in relation to aviation fuel odour
are currently received from receptors in the vicinity of the Airport.
It is possible that some different local communities may
experience annoyance under specific weather conditions.
However, this will be occasional and short-term. Therefore, this
effect is considered to be not significant.
Heathrow Expansion PRELIMINARY ENVIRONMENTAL INFORMATION Report: Chapter 7: Air quality and odour
7.135 © Heathrow Airport Limited 2019
7.12 Assessment of cumulative effects
Introduction
7.12.1 The cumulative effects assessment (CEA) presented in this section reflects
Stage 3 in the CEA process set out in Section 5.8 of Chapter 5.
7.12.2 The assessment of cumulative air quality and odour effects is based on
professional judgement, taking into account the levels of significance identified in
the primary or ‘stand-alone’ assessment, and identifying whether effects could be
different when ‘other development’ is considered.
7.12.3 A CEA is only undertaken for those receptors that are likely to experience effects
greater than negligible in the primary assessment. This is because such effects
are unlikely to result in any discernible positive or negative effects on a receptor. It
is considered that they are extremely unlikely to result in a significant cumulative
effect, even if multiple effects of a similar significance are considered.
7.12.4 The following sections present the assessment of the cumulative effects of the
DCO Project and ‘other developments’ on air quality and odour. Effects are
described for each phase of the DCO Project where relevant.
7.12.5 The ‘other developments’ to be considered in the CEA for the PEIR are those on
the ‘assessment list’ provided in Section 5.8 of Chapter 5.
7.12.6 The CEA has considered the spatial area within which ‘other development’ could
be located, which, together with the DCO Project, could result in likely significant
effects on receptors. This is defined as the Zone of Influence (ZOI). Only those
developments in the assessment list that fall within the Air Quality and Odour ZOI
(which matches the Core AQO Assessment Area), Dust ZOI and Air Quality 5km
Major Emitters ZOI have the potential to result in cumulative effects with the
Project. The ZOIs are shown in Figure 5.1, Volume 2 and Figure 5.3, Volume 2.
All developments on the assessment list falling outside the ZOIs are excluded from
this assessment and are indicated in Table 7.54.
Emissions from road traffic
7.12.7 The HHASAM on which the dispersion modelling to predict pollutant
concentrations is based is inherently cumulative as it uses modelled traffic data
that has been adjusted to account for growth in future traffic flows. The modelling
takes account of employment and housing projections, some future infrastructure
projects and development in Development Plans and the planning process. No
additional cumulative assessment associated with emissions from road traffic has
therefore been undertaken.
Heathrow Expansion PRELIMINARY ENVIRONMENTAL INFORMATION Report: Chapter 7: Air quality and odour
7.136 © Heathrow Airport Limited 2019
7.12.8 The SAP document and HHASAM traffic data used are based on an ‘Assessment
Case’, which represents a future year where only transport improvements that are
committed (those that are funded and have all necessary consents in place) are
brought forward. This means that several planned large infrastructure schemes
that are considered likely to come forward, such as the Western and Southern Rail
Links promoted by the Department for Transport and Network Rail, but which are
not yet sufficiently certain, are not taken into account.
7.12.9 In testing the SAP Heathrow has also considered an 'Expected Case', to
determine the revised level of interventions that would be necessary if these
planned large infrastructure schemes are brought forward as currently anticipated.
The preliminary modelling presented in the SAP document demonstrates that
there is forecast to be a similar public transport mode share of Heathrow travel in
the Expected Case (55%) to the Assessment Case (57%). While this appears
potentially counter-intuitive, given that the Expected Case includes the Western
and Southern Rail links, which would be expected to boost public transport use, it
reflects the fact that the focus in preparing the SAP document has been on
developing a package of interventions that achieve the ANPS targets in the
Assessment Case. The overall package of interventions for the Expected Case is
currently less developed but could be refined to achieve similar or better outcomes
to the Assessment Case.
7.12.10 As such, in scenarios that include planned infrastructure schemes, such as the
Western and Southern Rail links, the forecast levels of airport-related demand by
mode would not be expected to materially differ from those on which this
assessment is based. However, it is recognised that the introduction of these
schemes would be likely to change mode choice and the geographic distribution of
demand by mode in the areas served by these schemes. It is also recognised that
such schemes have potential to exert a cumulative effect as a result of
construction activities, which may run concurrently with those carried out for the
DCO Project, should they receive consent as well as the DCO Project. Such
effects will be considered in the development of the CTMP and CWTP and they
will be considered in the assessment carried out for the ES.
7.12.11 The Western Rail Link would provide direct rail access to the Airport from areas to
the west, including Slough, Maidenhead and Reading, while the Southern Rail Link
would provide direct rail access to the Airport from areas to the south, including
Staines, Chertsey and Virginia Water. As these are all areas from which many
Heathrow colleagues currently drive to the Airport, in the Expected Case there
would likely be fewer car trips to the Airport from these areas.
7.12.12 It is considered that the inclusion of major infrastructure schemes, such as the
Western and Southern Rail Links, would reduce the use of and improve the
operation of the strategic road network around Heathrow.
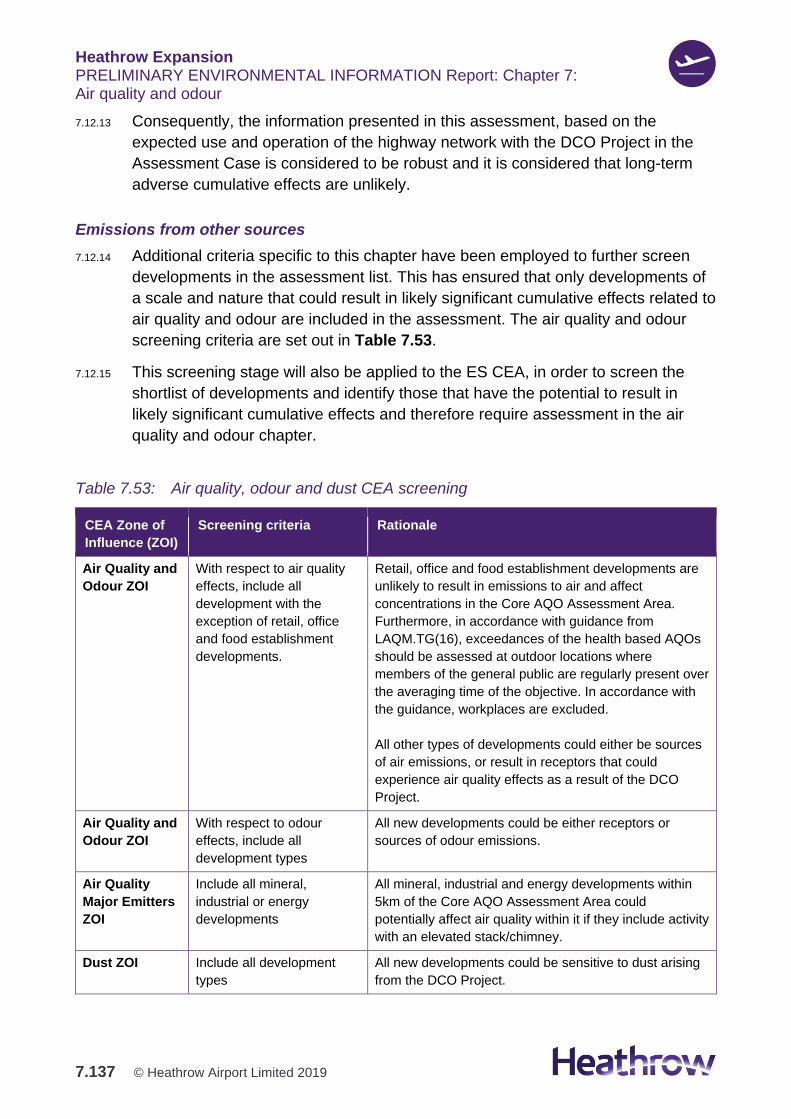
Heathrow Expansion PRELIMINARY ENVIRONMENTAL INFORMATION Report: Chapter 7: Air quality and odour
7.137 © Heathrow Airport Limited 2019
7.12.13 Consequently, the information presented in this assessment, based on the
expected use and operation of the highway network with the DCO Project in the
Assessment Case is considered to be robust and it is considered that long-term
adverse cumulative effects are unlikely.
Emissions from other sources
7.12.14 Additional criteria specific to this chapter have been employed to further screen
developments in the assessment list. This has ensured that only developments of
a scale and nature that could result in likely significant cumulative effects related to
air quality and odour are included in the assessment. The air quality and odour
screening criteria are set out in Table 7.53.
7.12.15 This screening stage will also be applied to the ES CEA, in order to screen the
shortlist of developments and identify those that have the potential to result in
likely significant cumulative effects and therefore require assessment in the air
quality and odour chapter.
Table 7.53: Air quality, odour and dust CEA screening
CEA Zone of
Influence (ZOI)
Screening criteria Rationale
Air Quality and
Odour ZOI
With respect to air quality
effects, include all
development with the
exception of retail, office
and food establishment
developments.
Retail, office and food establishment developments are
unlikely to result in emissions to air and affect
concentrations in the Core AQO Assessment Area.
Furthermore, in accordance with guidance from
LAQM.TG(16), exceedances of the health based AQOs
should be assessed at outdoor locations where
members of the general public are regularly present over
the averaging time of the objective. In accordance with
the guidance, workplaces are excluded.
All other types of developments could either be sources
of air emissions, or result in receptors that could
experience air quality effects as a result of the DCO
Project.
Air Quality and
Odour ZOI
With respect to odour
effects, include all
development types
All new developments could be either receptors or
sources of odour emissions.
Air Quality
Major Emitters
ZOI
Include all mineral,
industrial or energy
developments
All mineral, industrial and energy developments within
5km of the Core AQO Assessment Area could
potentially affect air quality within it if they include activity
with an elevated stack/chimney.
Dust ZOI Include all development
types
All new developments could be sensitive to dust arising
from the DCO Project.
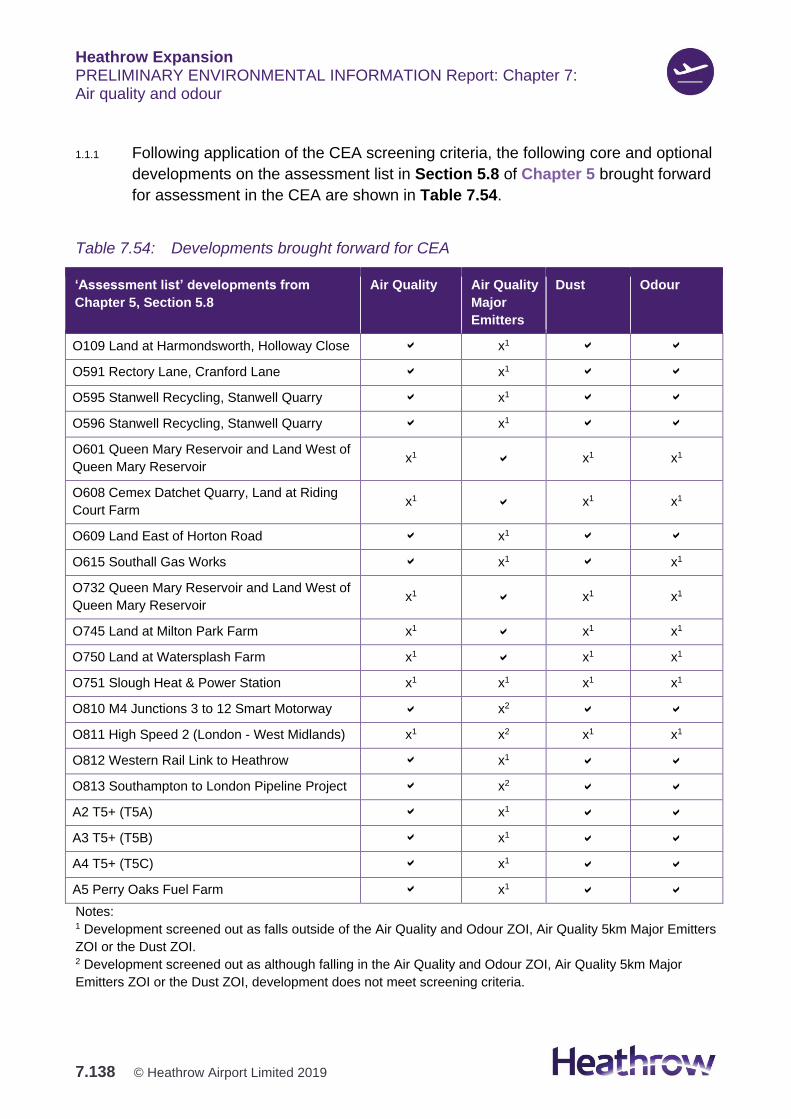
Heathrow Expansion PRELIMINARY ENVIRONMENTAL INFORMATION Report: Chapter 7: Air quality and odour
7.138 © Heathrow Airport Limited 2019
1.1.1 Following application of the CEA screening criteria, the following core and optional
developments on the assessment list in Section 5.8 of Chapter 5 brought forward
for assessment in the CEA are shown in Table 7.54.
Table 7.54: Developments brought forward for CEA
‘Assessment list’ developments from
Chapter 5, Section 5.8
Air Quality Air Quality
Major
Emitters
Dust Odour
O109 Land at Harmondsworth, Holloway Close x1
O591 Rectory Lane, Cranford Lane x1
O595 Stanwell Recycling, Stanwell Quarry x1
O596 Stanwell Recycling, Stanwell Quarry x1
O601 Queen Mary Reservoir and Land West of
Queen Mary Reservoir x1 x1 x1
O608 Cemex Datchet Quarry, Land at Riding
Court Farm x1 x1 x1
O609 Land East of Horton Road x1
O615 Southall Gas Works x1 x1
O732 Queen Mary Reservoir and Land West of
Queen Mary Reservoir x1 x1 x1
O745 Land at Milton Park Farm x1 x1 x1
O750 Land at Watersplash Farm x1 x1 x1
O751 Slough Heat & Power Station x1 x1 x1 x1
O810 M4 Junctions 3 to 12 Smart Motorway x2
O811 High Speed 2 (London - West Midlands) x1 x2 x1 x1
O812 Western Rail Link to Heathrow x1
O813 Southampton to London Pipeline Project x2
A2 T5+ (T5A) x1
A3 T5+ (T5B) x1
A4 T5+ (T5C) x1
A5 Perry Oaks Fuel Farm x1
Notes: 1 Development screened out as falls outside of the Air Quality and Odour ZOI, Air Quality 5km Major Emitters
ZOI or the Dust ZOI. 2 Development screened out as although falling in the Air Quality and Odour ZOI, Air Quality 5km Major
Emitters ZOI or the Dust ZOI, development does not meet screening criteria.
Heathrow Expansion PRELIMINARY ENVIRONMENTAL INFORMATION Report: Chapter 7: Air quality and odour
7.139 © Heathrow Airport Limited 2019
Phase 1: c. 2022-2026
7.12.16 None of the developments taken forward for assessment are considered likely to
result in emissions that would alter the conclusions with regard to NO2 and PM
detailed in Table 7.52. Development O615 Southall Gas Works would introduce
sensitive receptors, but negligible effects on pollutant concentrations as a result of
the DCO Project are forecast in this area. Development O591 Rectory Lane,
Cranford Lane would be considered as a sensitive receptor in relation to short-
term AQOs, but negligible effects as a result of the DCO Project are forecast in
relation to these.
7.12.17 None of the developments taken forward for assessment within the Air Quality
5km Major Emitters ZOI have been identified that could give rise to emissions that
could affect pollutant concentrations within the Core AQO Assessment Area.
7.12.18 It is assumed that the DCO Project and other developments will adopt best
practice management techniques to reduce dust emissions such that all individual
development effects will be negligible, and the cumulative effect will be negligible.
7.12.19 None of the taken forward for assessment have been identified with the potential
for odorous emissions that could exert a cumulative effect with the DCO Project.
Development O615 Southall Gas Works would introduce sensitive receptors, but
negligible effects in relation to odour as a result of the DCO Project are forecast in
this area. Development O591 Rectory Lane, Cranford Lane would be considered
as a sensitive receptor in relation to odorous emissions, but negligible effects as a
result of the DCO Project are forecast in this area.
7.12.20 There are therefore considered to be no cumulative effects as a result of other
developments in Phase 1, and the magnitude of change and significance reported
in Table 7.52 remain unchanged; all effects are not significant.
Phase 2: c. late 2026-2035
7.12.21 For construction dust and odour, given the peak construction activities for the DCO
Project occur during Phase 1, the assessment of cumulative effects in Phase 1 is
considered to be most representative of the likely significant cumulative effects of
the DCO Project and other developments are therefore not repeated here for this
PEIR assessment.
7.12.22 For operational emissions, including odour, the conclusions with regard to Phase
1, remain valid for Phase 2.
7.12.23 There are therefore considered to be no cumulative effects as a result of other
developments in Phase 2, and the magnitude of change and significance reported
in Table 7.52 remain unchanged; all effects are not significant.
Heathrow Expansion PRELIMINARY ENVIRONMENTAL INFORMATION Report: Chapter 7: Air quality and odour
7.140 © Heathrow Airport Limited 2019
Phase 3: c. 2036-2050
7.12.24 For construction dust and odour, given the peak construction activities for the DCO
Project occur during Phase 1, the assessment of cumulative effects in Phase 1 is
considered to be most representative of the likely significant cumulative effects of
the DCO Project and other developments are therefore not repeated here for this
PEIR assessment.
7.12.25 For operational emissions, including odour, the conclusions with regard to Phase
1, remain valid for Phase 3.
7.12.26 There are therefore considered to be no cumulative effects as a result of other
developments in Phase 3, and the magnitude of change and significance reported
in Table 7.52 remain unchanged; all effects are not significant.
7.13 Consideration of additional environmental measures and compensation
7.13.1 No additional environmental measures are proposed to further reduce air quality
and odour effects that are identified in this PEIR at this stage. The measures
detailed in Section 7.5 are shown in the assessment to be effective at managing
the effects of the DCO Project. The implementation of the measures detailed in
Section 7.5 will be secured through the Application and other documents (e.g. the
Surface Access Strategy to be prepared on the basis of the SAP document).
7.14 Next steps
Introduction
7.14.1 Further work that will be undertaken to support the air quality and odour
assessment and presented within the ES is set out below.
Baseline
7.14.2 Baseline monitoring data for 2018 will be collated and included in the ES. The
dispersion model verification will be updated to include the 2018 calendar year.
Assessment
7.14.3 Model input data, including road traffic data from HHASAM and aircraft schedules
will be refined, and the air quality assessment will be based on the final versions of
these models, inputs and assumptions. Assumptions regarding operational airside
activity will be refined on the basis of surveys carried out in 2019. Modelling
carried out for assessment years during the construction phase will reflect the
Heathrow Expansion PRELIMINARY ENVIRONMENTAL INFORMATION Report: Chapter 7: Air quality and odour
7.141 © Heathrow Airport Limited 2019
CTMP and CWTP. The impact of the HULEZ on pollutant concentrations will be
considered in the assessment.
7.14.4 The Core AQO Assessment Area will remain unchanged, but dispersion modelling
may be carried out for additional areas depending on the final road traffic datasets
and the likely changes in traffic flows on the road network outside of this Core
AQO Assessment Area.
7.14.5 Additional assessment years will be considered, in order to ensure the full range of
potential impacts are quantitatively considered, particularly in the period from 2022
to 2030.
7.14.6 Dispersion modelling will use the latest version of Defra’s background maps
available at the time.
7.14.7 The assessment of compliance with EU limit values will be based on the latest
version of Defra’s projections at PCM locations available at the time. Where
demand modelling does not show that there will be reductions in traffic flows, and
where changes in traffic flows have the potential to lead to non-negligible changes
in air quality, dispersion modelling of discrete PCM road links will be undertaken to
assess the likely impact on limit value compliance.
7.14.8 The construction dust risk assessment will be updated to reflect the final phasing
of infrastructure and construction methodology proposed.
7.14.9 The cumulative effect of other schemes that would also be expected to affect air
quality, such as the Lakeside Waste Management Facility and the Western Rail
Link to Heathrow will be considered.
Engagement
7.14.10 Further technical engagement that will be undertaken to inform the air quality and
odour assessment presented within the ES. Ongoing engagement will be carried
out with the HSPG, TfL, Highways England and Natural England.


