PNNL-14649 Preliminary Investigation of Sulfur Loading in Hanford LAW Glass J. D. Vienna P. Hrma W. C. Buchmiller J. S. Ricklefs April 2004 Prepared for the U.S. Department of Energy under Contract DE-AC06-76RL01830
Transcript
PNNL-14649
Preliminary Investigation of Sulfur Loading in Hanford LAW Glass J. D. Vienna P. Hrma W. C. Buchmiller J. S. Ricklefs April 2004 Prepared for the U.S. Department of Energy under Contract DE-AC06-76RL01830
DISCLAIMER This report was prepared as an account of work sponsored by an agency of the United States Government. Neither the United States Government nor any agency thereof, nor Battelle Memorial Institute, nor any of their employees, makes any warranty, express or implied, or assumes any legal liability or responsibility for the accuracy, completeness, or usefulness of any information, apparatus, product, or process disclosed, or represents that its use would not infringe privately owned rights. Reference herein to any specific commercial product, process, or service by trade name, trademark, manufacturer, or otherwise does not necessarily constitute or imply its endorsement, recommendation, or favoring by the United States Government or any agency thereof, or Battelle Memorial Institute. The views and opinions of authors expressed herein do not necessarily state or reflect those of the United States Government or any agency thereof. PACIFIC NORTHWEST NATIONAL LABORATORY operated by BATTELLE for the UNITED STATES DEPARTMENT OF ENERGY under Contract DE-AC06-76RL01830
This document was printed on recycled paper. (8/00)
PNNL-14649
Preliminary Investigation of Sulfur Loading in Hanford LAW Glass J. D. Vienna P. Hrma W. C. Buchmiller J. S. Ricklefs April 2004 Prepared for the U.S. Department of Energy under Contract DE-AC06-76RL01830 Pacific Northwest National Laboratory Richland, Washington 99352
iii
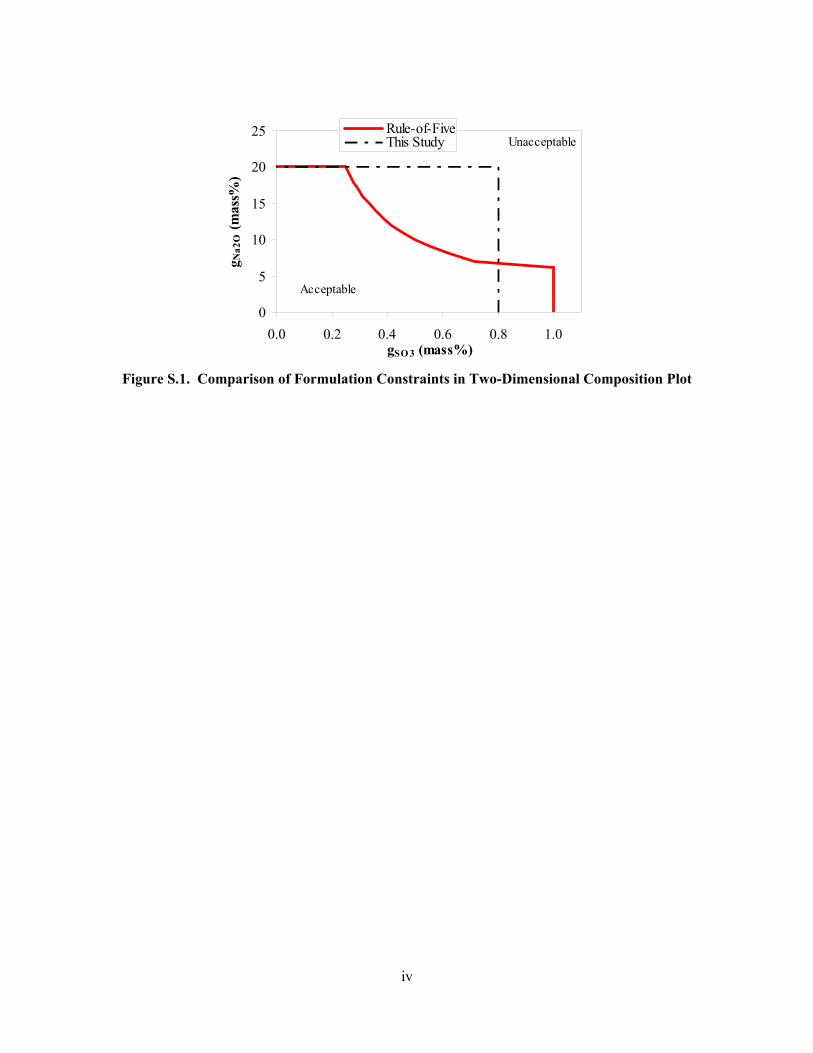
Summary A preliminary estimate was developed for loading limits for high-sulfur low-activity waste (LAW) feeds that will be vitrified into borosilicate glass at the Hanford Site in the waste-cleanup effort. Previous studies reported in the literature were consulted to provide a basis for the estimate. The examination of previous studies led to questions about sulfur loading in Hanford LAW glass, and scoping tests were performed to help answer these questions. The results of these tests indicated that a formulation approach developed by Vienna and colleagues shows promise for maximizing LAW loading in glass. However, there is a clear need for follow-on work. The approach taken by the Waste Treatment and Immobilization Plant (WTP) was based on a sulfur:sodium product. Specifically, the technical basis for WTP glass formulations was initially given by:
2 35Na O S Og g× ≤
where
2N a Og and 3S Og are the mass% of Na2O and SO3 in the target glass composition, respectively
(Pegg et al. 2000). The range of applicability of the rule-of-five(a) ranged from 2N a Og = 20 (above which
glass would be durability limited) to 3S Og = 1.0 (above which salt accumulation occurred).(b)
The approach taken in this study demonstrated increasing sulfur tolerance with increasing alkali and alkali-earth concentrations. Therefore,
3S Og increases with 2N a Og . The limits of applicability are
2N a Og = 20 and 3S Og = 0.8. Figure S1 compares the two approaches in a two-dimensional composition
plot. The area to the bottom left of each curve is the acceptable processing range.
(a) The rule-of-five is shown in Figure 2.2. (b) It should be noted that formulations that are more recent have reached higher loadings that those given by the
rule-of-five in the region of gSO3 < 0.7 and have a lower gSO3 upper bound of rule applicability (due to refractory corrosion related issues); per a personal communication from E. V. Morrey to J. D. Vienna, 2003.
iv
0
5
10
15
20
25
0.0 0.2 0.4 0.6 0.8 1.0gSO 3 (mass%)
g Na2
O (m
ass%
)
Rule-of-FiveThis Study
Acceptable
Unacceptable
Figure S.1. Comparison of Formulation Constraints in Two-Dimensional Composition Plot
v
Abbreviations, Acronyms, and Symbols
AES atomic emission spectroscopy
AO alkaline earth
DOE U.S. Department of Energy
DWPF Defense Waste Processing Facility
EPA U.S. Environmental Protection Agency
GFC glass forming chemical
HEME high-efficiency mist eliminator
HLW high-level waste
ICP inductively coupled plasma
IDF Integrated Disposal Facility
INEEL Idaho National Engineering and Environmental Laboratory
LAW low-activity waste
LSM laboratory-scale melter
MS mass spectrometer
PCT product consistency test
PNNL Pacific Northwest National Laboratory
RSM research scale melter
SBW sodium-bearing waste
TCLP toxicity characteristic leaching procedure
TFA Tanks Focus Area
VHT vapor hydration test
WTP waste treatment and immobilization plant
WVDP West Valley Demonstration Project
XRF X-ray fluorescence spectroscopy
vii
Acknowledgments
The authors would like to acknowledge very useful conversations and suggestions from Hong Li (PPG, Inc.) Ian Pegg (Catholic University of America), and Dong-Sang Kim (Pacific Northwest National Laboratory). We are indebted to Wayne Cosby for his artful editing of the report. We thank Ron Sanders (KLM Analytical) for chemical analyses of samples. Bill Holtzscheiter (Tanks Focus Area) gave invaluable management support for this project. We thank the Research and Technology staff at Hanford’s Waste Treatment and Immobilization Plant project for useful conversation and information/data on baseline formulations and process information. This study was funded by the U.S. Department of Energy’s (DOE’s) Office of Science and Technology, through the Tanks Focus Area, the Office of Waste Management through the Idaho National Environmental and Engineering Laboratory High-Level Waste Program, and the Office of River Protection through the River Protection Project. Pacific Northwest National Laboratory is operated for DOE by Battelle under Contract DE-AC06-76RL01830.
ix
Contents
Summary ...................................................................................................................................................... iii
Abbreviations, Acronyms, and Symbols....................................................................................................... v
Figure S.1. Comparison of Formulation Constraints in Two-dimensional Composition Plot ....................iii
Figure 2.1. SO3 Solubility as a Function of cNBO2/cBO (cNBO is the non-bridging oxygen concentration, and
cBO is the bridging oxygen concentration as defined by Papadopoulos 1973) (from Li et al. 2001) 2.2
Figure 2.2. Measured Sulfur Solubility in Simulated Hanford LAW Glass Melts at 1200°C (from Pegg et al. 2000)............................................................................................................................................. 2.3
Figure 2.3. Schematic of the EV-16 Melter (after Musick et al. 2000) .................................................... 2.8
Figure 2.4. Schematic of the Research-Scale Melter System (after Goles et al. 2001) .......................... 2.10
Figure 3.1. Laboratory-Scale Melter Schematic (from Darab et al. 2001) ............................................... 3.4
x
Tables
Table 2.1. Summary of Melter Test Segment Results with Various Simulated Hanford LAW Glasses Containing 7.9 mass% Na2O (after Pegg et al. 2000) ....................................................................... 2.4
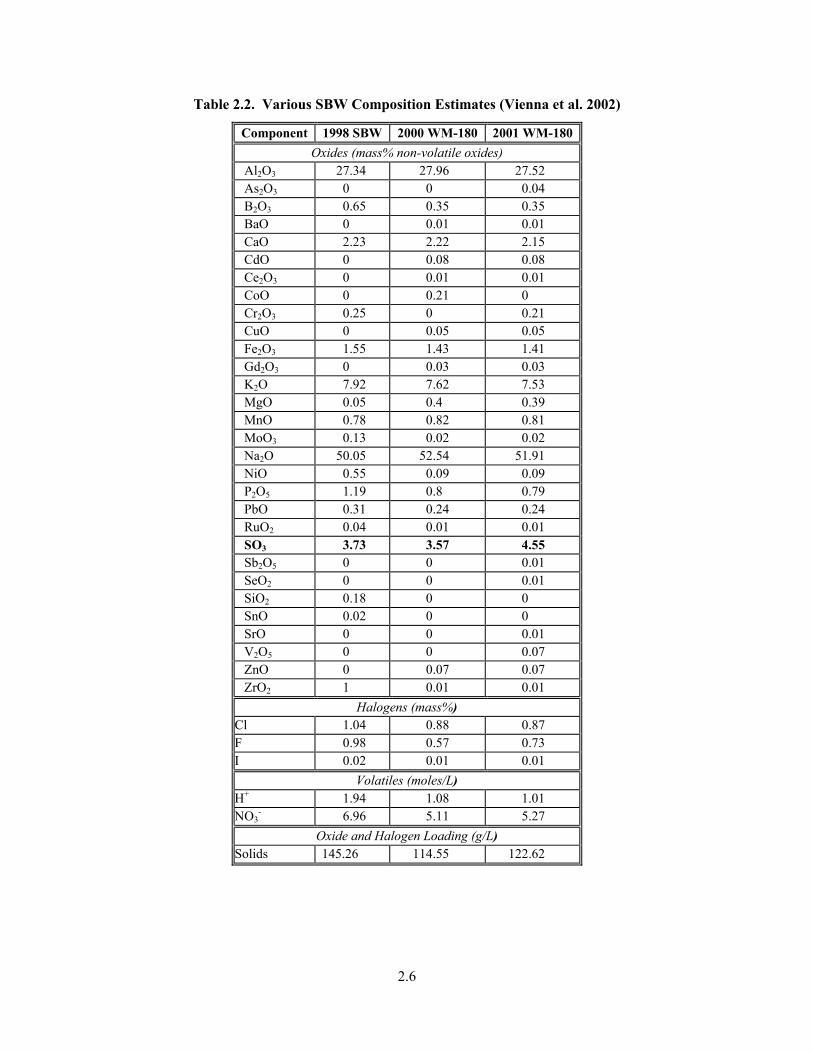
Table 2.2. Various SBW Composition Estimates (Vienna et al. 2002) .................................................... 2.6
Table 2.3. Additive Compositions Tested with SBW (in mass% glass oxides)........................................ 2.7
Table 2.4. Summary of RSM-01-1 Segments ......................................................................................... 2.11
Table 2.5. Summary of S Content in RSM-01-1 Glass........................................................................... 2.11
Table 2.6. Summary of S Content in EV-16-2001-1 Glass..................................................................... 2.12
Table 2.7. Summary of Test Segments for RSM-01-2............................................................................ 2.13
Table 3.1. Formulation Summary for Hanford LAW (From Muller et al. 2001) ..................................... 3.2
Table 3.2. Simulant Preparation Sheet with Chemicals in the Order of Addition .................................... 3.2
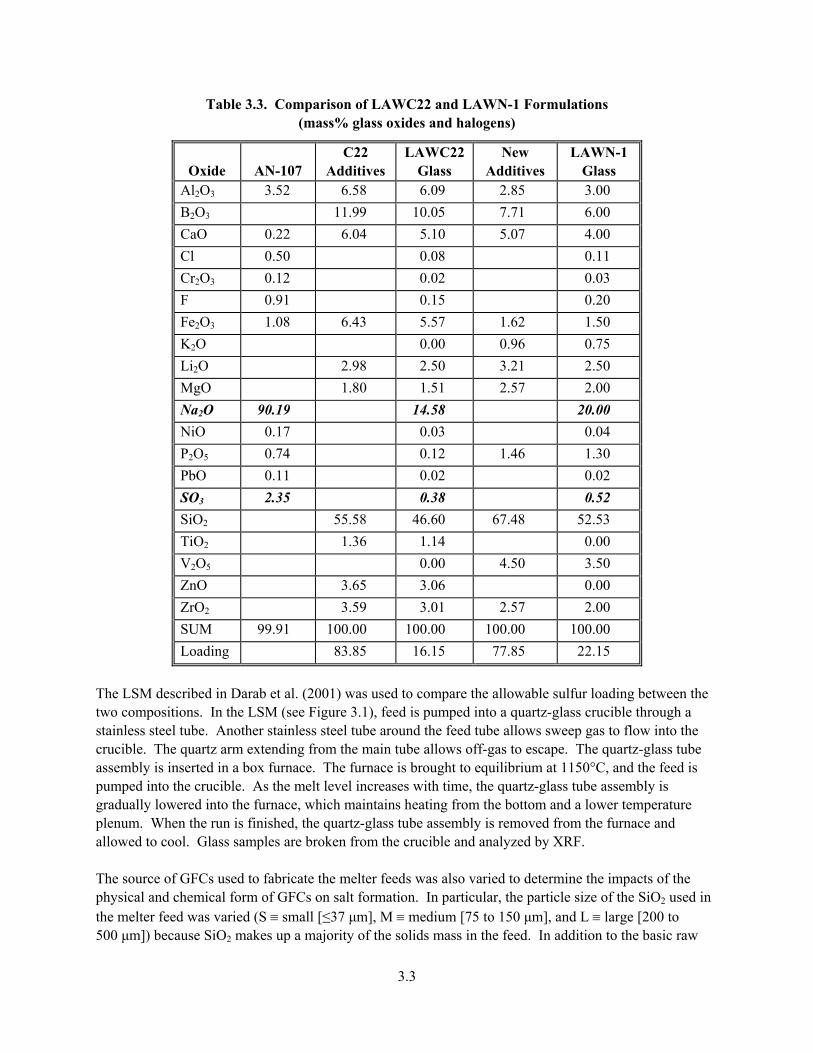
Table 3.3. Comparison of LAWC22 and LAWN-1 Formulations (mass% glass oxides and halogens) .3.3
Table 3.4. Example Batch Sheet for Feed for 85 g Glass AN107 Using Standard GFCs......................... 3.5
Table 3.5. Example WTP GFC Mix for C22 Glass ................................................................................. 3.5
Table 3.6. Observations from Laboratory Scale Melter Tests with AN-107 Waste Simulant.................. 3.6 Table A.1. Compositions of Tested INEEL SBW Glasses in mass%...................................................... A.1
1.1
1.0 Introduction and Objectives
Roughly 50-million gallons of high-level radioactive waste are stored in 177 underground tanks at the Hanford Site. These wastes were generated from over 4 decades of nuclear-fuel processing and heavy-element separations. The U.S. Department of Energy (DOE) has contracted for the design, construction, and demonstration of a waste treatment and immobilization plant (WTP) to treat these tank wastes (DOE 2000). The WTP will separate the tank wastes into low-activity waste (LAW) and high-level waste (HLW) fractions and vitrify them separately into borosilicate glasses. The LAW fraction of the tank waste is primarily composed of sodium salts (e.g., sodium-nitrate, -nitrite, -hydroxide, -sulfate, -phosphate, -chromate). The concentration of sulfur in many LAWs is sufficient to limit the loading of waste in borosilicate glass. The loading of Hanford LAWs in borosilicate glasses produced in the baseline WTP process is limited by one of two factors: salt accumulation and chemical durability. To meet the performance assessment goals for the proposed Hanford site Integrated Disposal Facility (IDF), the LAW product must be of sufficient chemical durability to withstand corrosion in an aqueous environment. Chemical-durability constraints have been imposed on the LAW glass to lower the risk of obtaining a glass that does not meet the performance goals for the IDF. One such constraint is that the releases of sodium, boron, and silicon by the glass exposed to the product consistency test (PCT) after normalizing for concentrations in glass and surface area-to-solution volume ratio should be less than 2 g/m2. Another is that the rate of alteration of glass exposed to the 200°C vapor hydration test (VHT) should be less than 50 g/(m2·d). These chemical-durability-related constraints can be consistently met with LAW glasses containing up to 20 mass% Na2O (e.g., Muller et al. 2001; Vienna et al. 2001). A molten sodium-sulfate-based salt will segregate from the glass melt phase during melter processing of LAWs with excessive sulfur concentrations. The salt phase is highly corrosive and can shorten the useful life of the melter. The sulfur concentration at which the salt phase accumulates is a function of key physical and chemical parameters of the glass-fabrication process. Key among these parameters is glass forming chemical (GFC) composition, redox, temperature, and feeding rate. The objective of this study is to recommend a preliminary estimate of loading limits for high-sulfur LAW feeds processed beyond the current WTP program tanks (DOE 2000). The recommendation will rely heavily on results from previous studies reported in the literature. Much of the pertinent literature data are summarized in Section 2.0. Evaluating previous results led to questions about sulfur loading in Hanford LAW glass. Scoping tests, described in Section 3.1, were performed to help answer these questions. The results of this study are summarized and discussed in Section 3.2, and conclusions are presented in Section 4.0.
2.1
2.0 Review of Previous Studies
The solubility of sulfur in glasses has been studied for over 50 years (Fincham and Richardson 1954, for example). Sulfur was widely used in the commercial glass industry as a fining agent and for melting-rate enhancement. Generally, the solubility of sulfur increases with increasing alkali- and alkali-earth oxide concentrations in glass (Holmquist 1966; Papadopoulos 1973; Goldman 1985). In highly oxidizing conditions, the sulfur incorporation in silicate glass melts is largely a result of sulfate incorporation given by: SO2(g) + ½O2(g) = SO3(g) SO2(g) + ½O2(g) + O2-(melt) = SO4
2-(melt) (2.1) SO3(g) + O2-(melt) = SO4
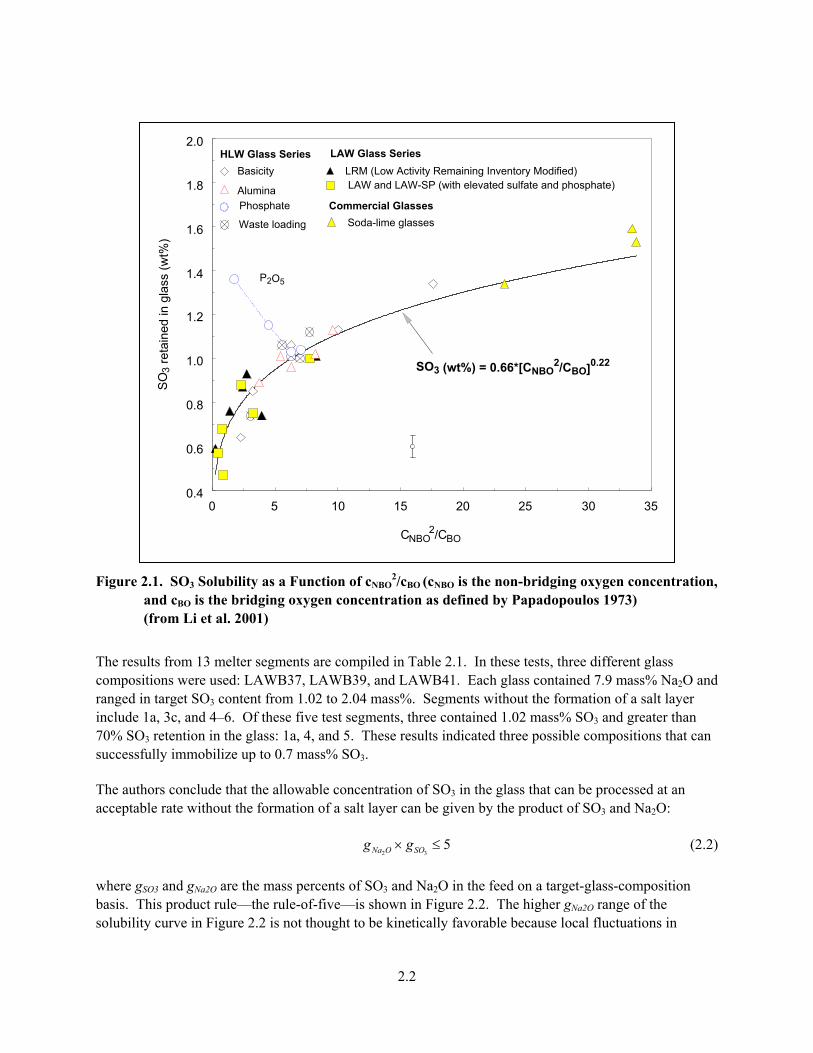
2-(melt) This relationship suggests that sulfate solubility increases with increasing oxygen activity in the melt or melt basicity. Papadopoulos (1973) found a linear relationship between the estimated ratio of non-bridging oxygen to bridging oxygen concentrations and sulfate solubility in soda-lime-silicate glasses. A similar relationship was found to adequately describe the sulfate retention in typical waste glasses melted in the presence of molten sulfate containing salts (see Figure 2.1). However, the solubility of sulfate represents only a portion of the challenge to increase the loading of high sulfur wastes in glass. Salt segregation has been found during waste glass melting at sulfur concentrations below the equilibrium solubility at the nominal melt composition and temperature. Therefore, the kinetics of salt segregation is an important practical consideration. Studies of sulfur segregation during waste-glass melting have been performed in support of waste vitrification activities (for examples, see Perez et al. 1983; Bates et al. 1985; Fu et al. 1996; Li et al. 1996; Vienna et al. 1999; Pegg et al. 2000; Musick et al. 2000; Darab et al. 2001; Li et al. 2001; Goles et al. 2001; Muller et al. 2001; Peeler et al. 2001; Goles et al. 2002; Vienna et al. 2003; Hrma et al. 2003; and Hrma et al. 2004). The following subsections review a portion of that literature thought to be key to the understanding of sulfate-incorporation limits during Hanford LAW vitrification.
2.1 WTP LAW Glass Studies
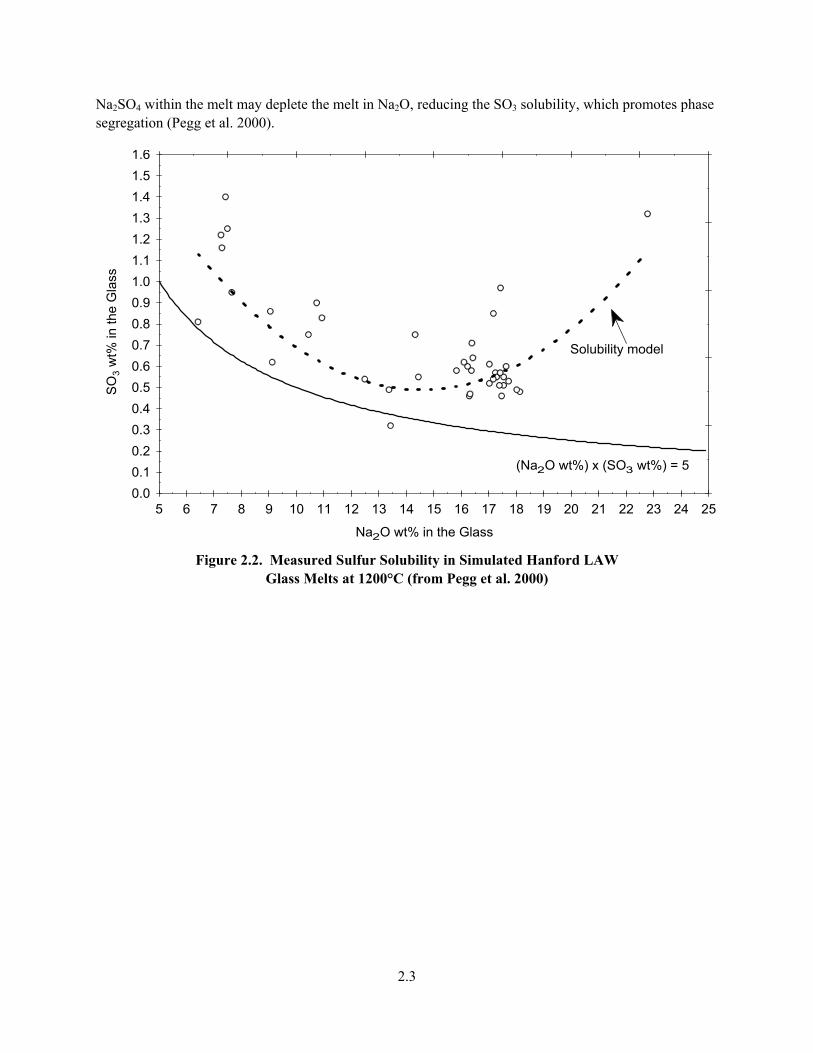
In 1999, the sulfur-removal operation was eliminated from the WTP process. A study of sulfate loading limits was initiated in response to this flowsheet change (Pegg et al. 2000). In this study, a series of crucible melts and 13 melter test segments were performed. The authors report a quadratic relationship between soda content and sulfur solubility in equilibrium with a molten salt phase (see Figure 2.2). It is not yet clear why this relationship exists for these glasses rather than the monotonic increase in sulfate solubility with alkali content discussed above. However, it is possible that the difference is caused in part by other chemical differences between glasses. It is likely that the studied glasses were designed to have a similar viscosity at the fixed target melting temperature of the glass. Therefore, as soda content was decreased, increases in other flux-component concentrations offset the soda-content differences. Another possibility is a distribution of sulfur redox states in these glasses rather than sulfate ions only. Some evidence for this distribution in partially reduced melts was reported by McKeown et al. (2004).
2.2
Figure 2.1. SO3 Solubility as a Function of cNBO
2/cBO (cNBO is the non-bridging oxygen concentration, and cBO is the bridging oxygen concentration as defined by Papadopoulos 1973) (from Li et al. 2001)
The results from 13 melter segments are compiled in Table 2.1. In these tests, three different glass compositions were used: LAWB37, LAWB39, and LAWB41. Each glass contained 7.9 mass% Na2O and ranged in target SO3 content from 1.02 to 2.04 mass%. Segments without the formation of a salt layer include 1a, 3c, and 4–6. Of these five test segments, three contained 1.02 mass% SO3 and greater than 70% SO3 retention in the glass: 1a, 4, and 5. These results indicated three possible compositions that can successfully immobilize up to 0.7 mass% SO3. The authors conclude that the allowable concentration of SO3 in the glass that can be processed at an acceptable rate without the formation of a salt layer can be given by the product of SO3 and Na2O:
2 35Na O SOg g× ≤ (2.2)
where gSO3 and gNa2O are the mass percents of SO3 and Na2O in the feed on a target-glass-composition basis. This product rule—the rule-of-five—is shown in Figure 2.2. The higher gNa2O range of the solubility curve in Figure 2.2 is not thought to be kinetically favorable because local fluctuations in
P2O5
SO3 (wt%) = 0.66*[CNBO2/CBO]0.22
HLW Glass SeriesBasicity
AluminaPhosphate
Waste loading
LAW and LAW-SP (with elevated sulfate and phosphate) LRM (Low Activity Remaining Inventory Modified)
Soda-lime glasses
LAW Glass Series
Commercial Glasses
0 5 10 15 20 25 30 35
CNBO2/CBO
0.4
0.6
0.8
1.0
1.4
1.6
1.8
2.0
1.2
SO
3 re
tain
ed in
gla
ss (w
t%)
2.3
Na2SO4 within the melt may deplete the melt in Na2O, reducing the SO3 solubility, which promotes phase segregation (Pegg et al. 2000).
Figure 2.2. Measured Sulfur Solubility in Simulated Hanford LAW
Glass Melts at 1200°C (from Pegg et al. 2000)
2.4
Table 2.1. Summary of Melter Test Segment Results with Various Simulated Hanford LAW Glasses Containing 7.9 mass% Na2O (after Pegg et al. 2000)
Seg Target SO3 in Feed (%) Salt
SO3 Retention (%)
Glass Rate (MT/d/m2) Glass Comments
1a 1.02 No 74 2.6 LAWB37 1b 2.04 Yes 74 2.6 LAWB37 2a 2.04 Yes 64 1.8 LAWB37 2b 2.04 Yes 74 1.6 LAWB37 high water 2c 2.04 Yes 26 1.9 LAWB37 high sugar 2d 2.04 Yes 36 1.2 LAWB37 high water, high sugar 2e 2.04 No 41 1.5 LAWB37 high water, high sugar 3a 2.04 Yes 42 1.5 LAWB39 3b 1.59 Yes 69 1.5 LAWB39 3c 1.59 No 37 1.3 LAWB39 high sugar 4 1.02 No 84 1.6 LAWB39 5 1.02 No 89 1.6 LAWB41 6 1.02 No Not Reported 2.7 LAWB41
2.2 INEEL Glass Studies
Sodium-bearing waste (SBW) is a high soda, acidic, high-activity waste stored at the Idaho National Engineering and Environmental Laboratory (INEEL). Table 2.2 lists the SBW composition estimates on a glass-component basis. The composition of SBW falls within the region of expected Hanford LAWs with the exception of Al2O3 concentration, which is roughly 28% in SBW and up to roughly 20% in LAW. This difference may not be significant since Al2O3 is added as a glass former in Hanford LAW glasses (Muller et al. 2001). Studies were performed to optimize the loading of SBW in glass to be produced in a liquid-fed, ceramic-lined, Joule-heated melter similar to those used at the Defense Waste Processing Facility (DWPF) and West Valley Demonstration Project (WVDP) and those planned to be used at WTP. These studies began in 1999 and continued through 2002 with evolving waste-composition estimates and flowsheet assumptions. In the first phase, a glass was formulated to demonstrate the feasibility of direct vitrification of SBW using current melter technologies (Vienna et al. 1999). The second phase was aimed at developing a glass to demonstrate the direct vitrification process and determine the range of expected waste loadings, assuming that sulfur lost to the off-gas would be grouted (Peeler et al. 2001). The third phase of the study was aimed at formulating a baseline glass composition to be used in developing engineering data for vitrification plant design. The overriding assumption during the third phase was that salt accumulation in the melter would not be tolerated and that nearly all of the sulfur lost to the off-gas would be recycled back to the melter feed. Different SBW compositions were assumed for each phase of the study—1998 SBW, 2000 WM-180, and 2001 WM-180 in Phases 1, 2, and 3, respectively (shown in Table 2.2).
2.5
2.2.1 Glass-Formulation Strategy
The formulation work performed by Vienna, Peeler, and colleagues (Vienna et al. 1999; Peeler et al. 2001; Vienna et al. 2002; Vienna et al. 2003) was based primarily on years of research and production experience in commercial glass melts, which suggests that increasing the alkali- and alkali-earth content increases SO3 solubility (see Section 2.0). To increase waste loading, it is necessary but insufficient to formulate a glass to have relatively high sulfate solubility. This is because many examples from studies with SBW, WVDP, and WTP glasses have shown that sulfate may segregate as a mixed alkali/alkaline earth oxyanionic salt during melter processing at concentrations below the equilibrium solubility of sulfate in the bulk melt at the nominal operating temperature. Tests were performed to determine the mechanism of sulfate segregation during melter processing and to mimic cold-cap processing conditions in the laboratory (Darab et al. 2001; Hrma et al. 2003; Vienna et al. 2002; and Hrma et al. 2004). These tests led to several key outcomes, including the determination of the primary phenomena responsible for salt segregation at seemingly sub-saturated conditions, the composition influences on sulfur-retention kinetics, and optimized glass formulations for treatment of SBW. It was found, as is intuitively logical, that the higher the sulfate solubility, the more that is incorporated into the melt before salt segregation. This led to formulations with increased alkali- and alkaline-earth concentrations. As general mixing thermodynamics would suggest, a combination of alkali- and alkaline-earth components is far more effective at increasing sulfur solubility than in higher concentrations of any single component. It was shown experimentally that no one alkali- or alkali-earth component was as effective as a mix of many alkali and alkali-earth components in increasing sulfur incorporation. Finally, the addition of V2O5 in the melt allowed for higher concentrations of sulfur in the feed before salt segregation. In addition to these simple rules, ZrO2 was added to increase the chemical durability and viscosity of the waste glass/melt that was lowered by high alkali- and alkali-earth component concentrations. In early formulations, Fe2O3 was added to dilute the waste with a component that did not decrease durability and did not increase viscosity; later formulations added Fe2O3 only as a redox indicator. The overall blend of glass components was largely dictated by the need to meet a range of glass-property constraints. The various additive compositions tested during this period of development are listed in Table 2.3. The glass compositions generated from mixing the additives with the waste simulants at various loadings are reported in Appendix A. Testing these additive compositions in a laboratory-scale melter (LSM) showed a consistent trend in that increased alkali (R2O) and alkaline earth (AO) component concentrations, along with V2O5, allowed for higher sulfur incorporation. For example, a series of tests with SBW-22 through -27 with fixed waste loading at 20 mass% and excess SO3
(a) showed salt formation in all samples with R2O + AO < 20 mole% in frit and R2O/(R2O+AO) < 40 % in frit, while other samples showed no salt formation. One exception was SBW-24, which showed salt formation even with R2O+AO = 21 mole% and R2O/(R2O+AO) = 64%. The major difference in this formulation is the lack of V2O5. Similar results were found with crucible melts as reported by Vienna et al. (2001). These tests also showed a clear correlation between sugar concentration and sulfur retention, with the higher sugar concentrations leading to higher sulfur losses (Vienna et al. 2002). These losses were found to be caused by the formation of SO2 gas in the reducing environment. Higher LSM feeding rates were found to increase the tendency for salt formation at fixed SO3 concentrations (Darab et al. 2001).
(a) All other parameters in these tests were fixed, e.g., feed rate, reductant concentration.
2.6
Table 2.2. Various SBW Composition Estimates (Vienna et al. 2002)
• SBW-1 and 1998 SBW at a 35% waste loading in the first phase
• SBW-9 and 2000 WM-180 at loadings ranging from 20 to 35% in the second phase
• SBW-22 and 2001 WM-180 at 20% loading in the third phase
using the EV-16 melter at Clemson University and/or the research scale melter (RSM) at Pacific Northwest National Laboratory (PNNL). In addition, a number of tests were performed using a slurry-fed
2.8
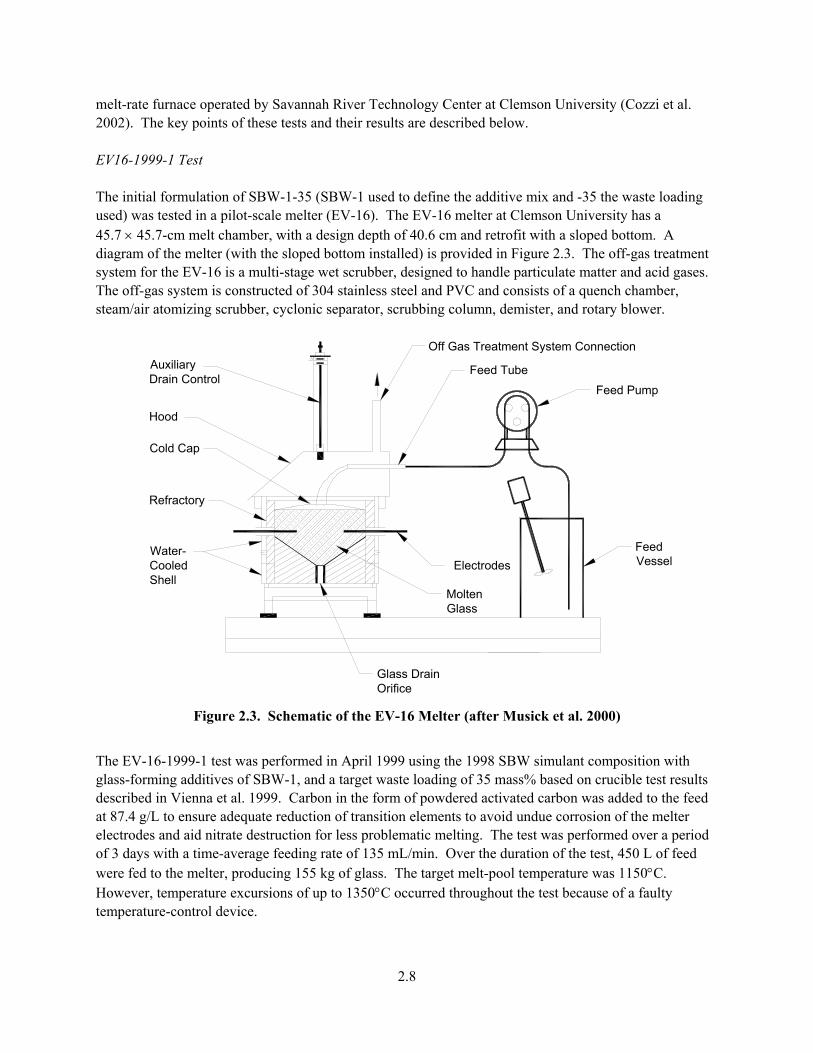
melt-rate furnace operated by Savannah River Technology Center at Clemson University (Cozzi et al. 2002). The key points of these tests and their results are described below. EV16-1999-1 Test The initial formulation of SBW-1-35 (SBW-1 used to define the additive mix and -35 the waste loading used) was tested in a pilot-scale melter (EV-16). The EV-16 melter at Clemson University has a 45.7 × 45.7-cm melt chamber, with a design depth of 40.6 cm and retrofit with a sloped bottom. A diagram of the melter (with the sloped bottom installed) is provided in Figure 2.3. The off-gas treatment system for the EV-16 is a multi-stage wet scrubber, designed to handle particulate matter and acid gases. The off-gas system is constructed of 304 stainless steel and PVC and consists of a quench chamber, steam/air atomizing scrubber, cyclonic separator, scrubbing column, demister, and rotary blower.
Glass DrainOrifice
MoltenGlass
Electrodes
Off Gas Treatment System Connection
Water-CooledShell
Cold Cap
Refractory
Hood
AuxiliaryDrain Control
Feed Pump
Feed Tube
FeedVessel
Figure 2.3. Schematic of the EV-16 Melter (after Musick et al. 2000)
The EV-16-1999-1 test was performed in April 1999 using the 1998 SBW simulant composition with glass-forming additives of SBW-1, and a target waste loading of 35 mass% based on crucible test results described in Vienna et al. 1999. Carbon in the form of powdered activated carbon was added to the feed at 87.4 g/L to ensure adequate reduction of transition elements to avoid undue corrosion of the melter electrodes and aid nitrate destruction for less problematic melting. The test was performed over a period of 3 days with a time-average feeding rate of 135 mL/min. Over the duration of the test, 450 L of feed were fed to the melter, producing 155 kg of glass. The target melt-pool temperature was 1150°C. However, temperature excursions of up to 1350°C occurred throughout the test because of a faulty temperature-control device.
2.9
Analyses of the resulting glass by X-ray fluorescence spectroscopy (XRF) and by inductively coupled plasma (ICP) atomic emission spectroscopy (AES) showed an SO3 concentration of 0.49 mass% and 0.58 mass%, respectively. The target concentration of SO3 in glass was 1.3 mass%, and ICP analyses of the melter feed suggest an as-batched SO3 concentration of 1.07 mass%. This suggests that 54% of the S fed to the melter was in the glass (based on ICP measured results of the feed and the glass). No evidence of a salt layer was seen at the melt surface during or after the test.(a) Insufficient data were collected to determine the amount and speciation of S in the off-gas. However, it is likely that the remaining fraction of the S fed to the melter partitioned to the off-gas as SO2. RSM-01-1 Test The second formulation—SBW-9 with 30, 32, and 35% waste loading—was tested in an RSM. Peeler et al. (2001) reported the testing to support this formulation. The RSM is a 15.24-cm (6-in.) diameter, Joule-heated melter capable of continuous feeding and pouring that was specifically designed and built to evaluate various aspects of the vitrification process. The RSM consists of a 26-cm (10.25 in.) outside diameter × 44.45-cm (17.5 in.) high Inconel 601 shell, lined with ceramic paper and Alfrax 66. A crucible of Monofrax K-3 high Cr2O3 refractory provided a melt cavity that measures 15.24 cm (6 in.) in diameter. The operating glass height of the RSM is nominally 7.6 cm (3 in.), resulting in a glass volume of 1.4 L. A view port in the lid allowed observations of the cold cap, observations of salt-layer formation, and sampling from the melt surface. The off-gas-system included a film cooler, venturi scrubber, high-efficiency mist eliminator (HEME), and scrub-solution tank. Emission rates of process off-gas effluents and equipment-abatement efficiencies were characterized using gaseous and particulate samplers operated according to applicable U.S. Environmental Protection Agency (EPA) protocols. In addition, an online quadrupole mass spectrometer (MS) allowed real-time analysis to be conducted for volatile and semivolatile effluents having mass numbers between 2 and 300 AMU. Figure 2.4 shows a schematic of the RSM. The RSM-01-1 test was performed in January 2001 using the 2000 WM-180 simulant composition with glass-forming additives of SBW-9. The target waste loadings were increased from 30 to 35 mass% during the eight test segments to determine the loading at which a salt layer would accumulate (see Table 2.4). The amount of S was increased by 40% during the final segment to intentionally form a salt layer. Sugar was added as a reductant at concentrations ranging from 135 to 197 g/L of SBW to obtain an initial assessment of the impacts of reductant concentration on S loss and glass redox. The test was performed over a period of 120 hours with a feeding rate of 2.1 to 3.3 L/h and a glass pour rate of 35 to 54 Kg/h/m2. The average oxide loading of the feed was 292 g/L. The melt-pool temperature was maintained between 1147 and 1162°C with a target nominal melt temperature of 1150°C.
(a) The absence of a salt phase during this test may have been influenced by the temperature excursions.
2.10
Scrub Solution Tank
Heat Exchanger
HEME
Off-Gas From RSM
Off-Gas to Blower
Secondary Containment
P
P
P
Opening Available for Drum Pump
T
T
T
T
T
O
RSM Feed
Scale
Kiln
Discharge Clamshell Heater
Lift
Scale
Glass Canister
Glass Canister Heater
RSM
T
P -- Pressure Port
-- Thermocouple Port
Drawing Not to Scale
Legend
O -- Off-Gas Sample Port
-- Duraboard
Figure 2.4. Schematic of the Research-Scale Melter System (after Goles et al. 2001)
2.11
Table 2.4. Summary of RSM-01-1 Segments
Segment Waste Loading
(mass%) Target SO3
Concentration
Target Na2O
Concentration
Sugar Concentration (g/L of SBW)
Average Feed Rate
(L/h) A 30 1.07 15.8 135 2.1 B 30 1.07 15.8 135 2.3 C 32 1.14 16.8 135 3.0 D 32 1.14 16.8 135 2.8 E 35 1.25 18.4 135 2.5 F 35 1.25 18.4 150 2.6 G 35 1.25 18.4 155 3.2 H 35 1.75 18.4 178 3.3
Goles et al. (2001) thoroughly described the results of the RSM-01-1 test. Table 2.5 compares the ICP analyses of SO3 in glass with target values. Roughly, 50 to 60% of the S fed to the melter partitioned to the glass and is apparently relatively independent of waste loading in the range of 30 to 35 mass%. A mass balance over the entire 120-hour test found that roughly 25% of the S fed to the melter partitioned to the off-gas system, roughly 80% of which was found in the drainage from the HEME, and the remaining was in the scrub solution. More of the S could have been in the HEME since the entire HEME was not flushed after the test. Alternatively, if the remaining 15 to 25% of the S left the melter as SO2, the concentration of SO2 would have been below the detection limit of the MS used to monitor off-gas composition. Very small spots of molten salt could be found on the melt surface during nearly the entire test. Typically, the salt disappeared after feeding was stopped for some period. Salt accumulation was not seen until the waste loading was increased to 35%. Although no accurate data were taken to quantify the amount of salt accumulation, visual observations suggested that the amount of salt on the melt surface decreased when the amount of sugar increased during the last test segment.
35 (1.40×S) 18.4 1.75 0.89 51 EV-16-2001-1 Test A second melter test was performed in the EV-16 pilot-scale melter in April of 2001 (Perry et al. 2001). The melter plenum was rebuilt before the test, and other melter modifications were made to simulate more closely the planned INEEL process. This test, EV-16-2001-1, processed a glass using the 2000 WM-180 waste simulant at 30 mass% loading with the SBW-9 additive mix (SBW-9-30). Sugar was added as a reductant to the feed at a concentration of 160 g/L of SBW. With the exception of the sugar concentration, the target feed composition was the same as that processed in the RSM-01-1 test during the first two segments. This test was performed over 175 hours with active feeding for approximately
2.12
120 hours. The average nominal feeding rate was 14.7 L/h. Approximately 1790 L of feed was fed during the test, and 538 kg of glass were produced. The empirical oxide loading of the feed was 21.9%. The melt pool temperature was maintained between 1100°C and 1175°C with a nominal target of 1150°C. Normalizing the feed rate to the melter surface area, the average RSM-01-1 feed rate was 120 L/h/m2, and that for the EV-16-2001-1 was 70 L/h/m2.(a) With slower feeding, there is more opportunity for the melt to approach the equilibrium concentration of SO3, which is estimated to be roughly 1 mass% for this melt composition in air. A molten salt was found to form and possibly accumulate during the EV-16-2001-1 test, unlike the EV-16-1999-1 and RSM-01-1 tests. A method to measure the amount of salt at the melt-pool surface during the test was not available, but qualitative observations were made by probing the melt surface with an alumina tube. The amount of salt that remained on the glass surface when the melter was cooled after the test was estimated. This salt layer, which was found primarily on the melter refractory-glass interface, was estimated to contain 7.7% of the S fed to the melter.(b) After completion of the test, melter-feed samples that had been systematically taken during feeding were analyzed using ICP-AES to find that a significantly higher sulfur content was in the feed than targeted in glass. Table 2.6 compares the concentrations of SO3 in feed and in glass with the target values (all on a glass oxide composition basis). Therefore, these results correspond well with the result of the RSM-01-1 test.
Table 2.6. Summary of S Content in EV-16-2001-1 Glass
Sample Target SO3 (Mass%)
ICP SO3 in Feed on a Mass% in Glass Basis
XRF SO3 in Glass (mass%)
ICP SO3 in Glass (mass%)
Melter Bottom 1.07 1.35 0.74 0.79 General Melter Glass 1.07 1.35 0.75 0.77 Melter Top 1.07 1.35 0.76 0.76
RSM-01-2 Test The third composition tested at melter scale was SBW-22 at 20% loading of the 2001 WM-180 simulant (SBW-22-20). This formulation differed from SBW-9 since the concentration of sulfur in the waste increased. The planned INEEL flowsheet changed from one in which the sulfur leaving the melter would be grouted to one in which a majority of sulfur leaving the melter would return as recycle. Vienna et al. (2002) described the formulation and testing activities for this feed. This test was performed in much the same manner as RSM-01-1. The test was performed over a period of 120 hours with a feeding rate of 1.24 to 1.9 L/h and glass pour rates of 6.2 to 9.4 lb/h/ft2. The melt-pool temperature was maintained at roughly 1150°C throughout the test. Details of this test are reported by Goles et al. (2002) and summarized in Table 2.7.
(a) The complexity of melter feed to glass-conversion processes does not allow the scaling of melter feed rates
between different melters; the feed rate per unit melt pool surface area is often used as a very rough estimate for comparison purposes.
(b) The amount of salt on the melter surface after the test was roughly 575 g, and a total of 2594 g of S was fed to the melter. Assuming the salt was composed of 34.77 mass% S, 7.7% of the S fed to the melter would be in the salt.
Analyses of the feed and glass suggest that the target SO3 concentration was obtained in the feed and that 94.2% of the sulfur fed to the melter remained in the glass with 3.4% found in the off-gas scrub solution. The additional 2.4% of sulfur could not be accounted for by the mass balance, but no sign of salt formation existed. The sulfur retention in glass would likely be higher if not for the wide variations in reductant concentrations. These varied reductant concentrations were used to determine the impacts on mercury speciation in the off-gas rather than to control sulfur behavior. EV16-2001-2 Test A final EV-16 test with SBW simulant (2001 WM-180) was performed in September of 2001. This test was performed with the same feed composition of the RSM-01-2 test (SBW-22-20). The test was conducted over a 3-day period, stopped short by unrelated difficulties occurring on September 11, 2001. This test showed excellent agreement with the RSM-01-2 test. Analyses of the feed and glass suggest that the target SO3 concentration was obtained in the feed and that 97.1% of the sulfur fed to the melter remained in the glass with 2.4% found in the off-gas scrub solution. The additional 0.5% of sulfur could not be accounted for by the mass balance. No indication of a salt layer on top of the melt was found.
2.2.3 Summary of SBW Formulation and Testing
Formulations were performed to develop high-loaded SBW glasses that would avoid salt formation during pilot-scale melter testing at prototypic plant operating conditions. Initial formulations showed that
2.14
concentrations of SO3 in feed of >1 mass% (on a glass oxide basis) could be processed without salt formation/accumulation in the melter. A baseline glass, developed as a conservative formulation, contained 0.91 mass% of SO3 (on a glass oxide basis). This formulation was shown to incorporate nearly completely to the glass phases during pilot testing (97.1%) at prototypic processing rates. These formulations were based on increased alkali, alkaline earth, and vanadium. Na2O concentrations in melter tests ranged from 14 to 17.5% in glass. These correspond to Na2O×SO3 products between 12.6 and 19.2. Because the testing was performed on single-point compositions without accounting for variation in waste composition, waste loading, and process uncertainty, it was recommended that INEEL reduce the anticipated sulfate loading in the incoming feed to 0.8 mass% on a glass-oxide basis. This limit was to be combined with a limit of 20 mass% Na2O for the purposes of durability control. These limits were independent of each other. In other words, the glass could contain up to 20% Na2O and/or 0.8% SO3, but neither should be higher than the limits.
3.1
3.0 Scoping Tests for Hanford LAW
The compositions of Hanford LAW are very similar to those of INEEL SBW. The SBW is higher in nitrates and aluminum, while the LAW is basic. These differences are considered minor so long as sugar concentration is adjusted for the nitrate concentration, and alumina is added as a glass former in LAW. Other differences in the process may be more significant. For example, the concentration of water in SBW is significantly higher with a sodium molarity of 2 M rather than the molarity range from 1.15 to 10 that is currently planned for Hanford LAW. The planned INEEL flowsheet did not include the use of bubblers in their melter to increase the processing rate. The combined differences between the sodium concentration and the lack of bubbling gives a reduced processing rate for SBW (ranged between 0.38 and 1.3 MTg/d/m2). A final difference between the INEEL SBW and Hanford LAW glasses is the glass-property constraints imposed on the glasses and thus on the formulations. For SBW glass, the entire melter operating time was planned to be less than 3 years while for Hanford LAW glass, the melter life was planned to be significantly longer; plus, it was not planned that the SBW melter would use bubblers. This translates to a difference in constraints on the corrosivity of the melt to glass-contact materials. The SBW glass was to be disposed of in the Federal Geologic Repository and so was required to meet durability constraints based on the product consistency test (PCT) and the toxicity characteristic leaching procedure (TCLP), much like Hanford LAW glasses. However, Hanford LAW glass must also meet constraints based on the VHT, which was not required for the SBW glasses. These added constraints further restrict the flexibility in glass composition that must be accounted for when formulating LAW glass. With these similarities and differences in mind, a small task was performed by PNNL under the funding and guidance of the Tanks Focus Area (TFA) to evaluate the possibility of expanding the experience from glass formulation and testing for SBW to Hanford LAW.
3.1 Experimental Approach
To perform the study, a typical Hanford LAW was selected so that the current WTP formulation would give significantly lower waste loading than would a formulation based on the loading limits developed for INEEL (e.g., Na2O ≤ 20% and SO3 ≤ 0.8%). The baseline formulations assumed in this comparison were those reported by Muller et al. (2001) and listed in Table 3.1. As Sub-Envelopes A1 and A2 were limited by 20% Na2O, and Sub-Envelope B2 was limited by 1% SO3, only Sub-Envelopes A3, C1, and C2 would have a substantially increased loading if the INEEL limits were used. Sub-Envelope C1 (AN-107) was found to have the greatest loading increase, so it was used in this study. A simulant of AN-107 was prepared according to the procedures used in pilot melter testing of AN-107 with glass LAWC22 by the WTP. A number of salts (Table 3.2) were gradually added to H2O. A new formulation was developed for the waste using the approach described above for INEEL SBW. This new formulation is known as LAW-New-1 or LAWN-1. The waste, additives, and resulting glasses are compared in Table 3.3. The LAWN-1 composition was designed to meet the property constraints for the Hanford LAW melter while allowing for higher sulfur incorporation. The predicted VHT response of LAWN-1 is comparable to that of LAWC22 glass (fabricated from C22 additives and AN-107 waste)
3.2
using models reported by Vienna et al. (2001). The ZnO added to LAWC22 for corrosion resistance of glass-contact materials was not added to LAWN-1.
Table 3.1. Formulation Summary for Hanford LAW (From Muller et al. 2001)
Current Envelope
Designation Envelope A Envelope B(a) Envelope C Sub-
(a) The current selection of glasses for Envelope B may not apply to individual tank waste as most of the present study was based on blending of AZ-101 and AZ-102, now abandoned.
Table 3.2. Simulant Preparation Sheet with Chemicals in the Order of Addition
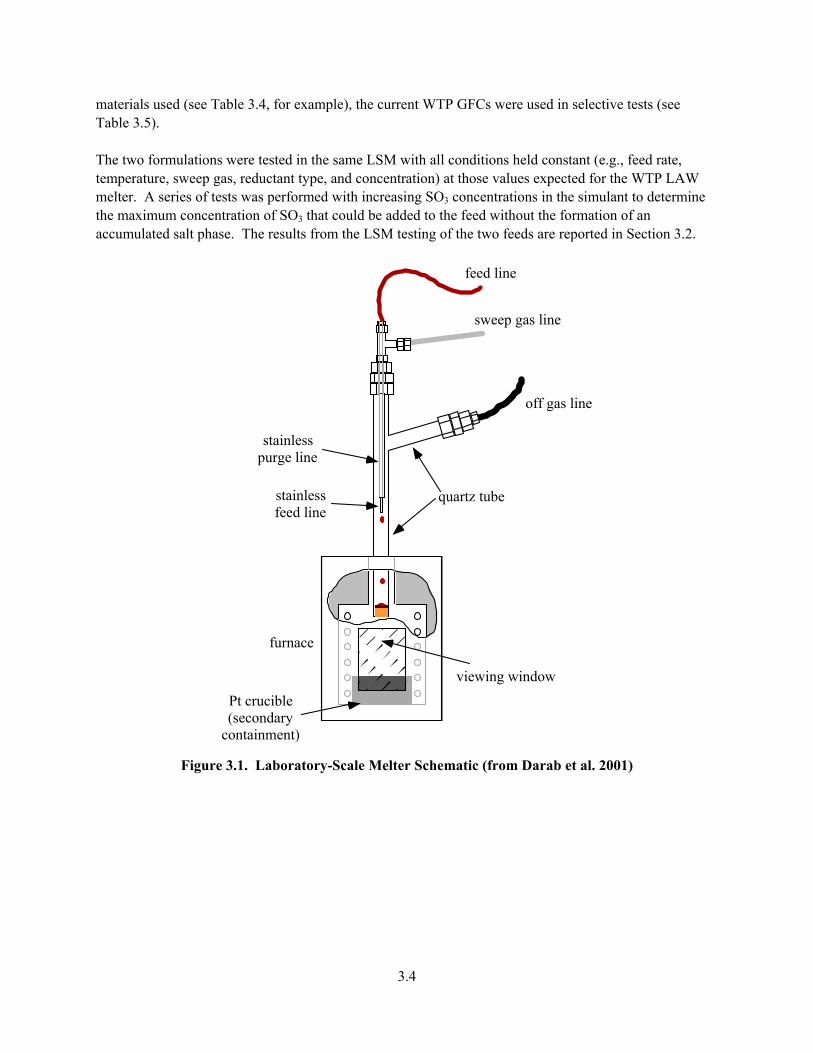
The LSM described in Darab et al. (2001) was used to compare the allowable sulfur loading between the two compositions. In the LSM (see Figure 3.1), feed is pumped into a quartz-glass crucible through a stainless steel tube. Another stainless steel tube around the feed tube allows sweep gas to flow into the crucible. The quartz arm extending from the main tube allows off-gas to escape. The quartz-glass tube assembly is inserted in a box furnace. The furnace is brought to equilibrium at 1150°C, and the feed is pumped into the crucible. As the melt level increases with time, the quartz-glass tube assembly is gradually lowered into the furnace, which maintains heating from the bottom and a lower temperature plenum. When the run is finished, the quartz-glass tube assembly is removed from the furnace and allowed to cool. Glass samples are broken from the crucible and analyzed by XRF. The source of GFCs used to fabricate the melter feeds was also varied to determine the impacts of the physical and chemical form of GFCs on salt formation. In particular, the particle size of the SiO2 used in the melter feed was varied (S ≡ small [≤37 µm], M ≡ medium [75 to 150 µm], and L ≡ large [200 to 500 µm]) because SiO2 makes up a majority of the solids mass in the feed. In addition to the basic raw
3.4
materials used (see Table 3.4, for example), the current WTP GFCs were used in selective tests (see Table 3.5). The two formulations were tested in the same LSM with all conditions held constant (e.g., feed rate, temperature, sweep gas, reductant type, and concentration) at those values expected for the WTP LAW melter. A series of tests was performed with increasing SO3 concentrations in the simulant to determine the maximum concentration of SO3 that could be added to the feed without the formation of an accumulated salt phase. The results from the LSM testing of the two feeds are reported in Section 3.2.
feed line
sweep gas line
off gas line
quartz tube
furnace
viewing window
Pt crucible(secondary
containment)
stainlessfeed line
stainlesspurge line
Figure 3.1. Laboratory-Scale Melter Schematic (from Darab et al. 2001)
3.5
Table 3.4. Example Batch Sheet for Feed for 85 g Glass AN107 Using Standard GFCs
The results from LSM testing are summarized in Table 3.6. These results clearly demonstrate that in the LSM, the LAWN-1 glass can tolerate almost twice the SO3 loading as the LAWC22 formulation before a salt forms. In addition, these results show that the allowable SO3 concentration was higher in a glass with 20% Na2O than one with 14.6% Na2O. It should be noted that the LSM was found to show higher allowable sulfur concentrations before a salt forms than did the pilot melter. However, there was a consistent shift in allowable sulfur concentrations, so the LSM gives an excellent qualitative comparison between formulations. The more efficient incorporation of sulfate achieved with minerals other than sand is probably caused by delays in the incorporation of those components into the glass melt that reduce sulfate solubility at temperatures below 900°C. LAWN-1 has lower concentrations of the components that lower the melt basicity, such as B2O3 and Al2O3. Some AN107 components are dropped entirely, such as TiO2 and ZnO. Alkali- and alkali-earth oxides are in different proportions (K2O is introduced) to benefit the effects of mixing that may enhance the SO3 solubility. Also, P2O5 is added as an additive component. As reported by Sullivan et al. (1995) and Li et al. (1996), P2O5 increases sulfate retention. Finally, V2O5 is a mixture ingredient. V2O5 is a well-known surface-active component and is known to catalyze a reaction between SO2 and SO3 (Equation 1). How V2O5 may increase sulfate dissolution is not yet clear. It may improve the spreading of liquid sulfate over available internal surfaces of the melting feed and thus increase its chance of being dissolved at early stages of melting.
3.6
Table 3.6. Observations from Laboratory Scale Melter Tests with AN-107 Waste Simulant(a)
Test ID Additive
Target SO3
(mass%)
Measured SO3
(mass%)
Average SiO2 size
(mm) Salts Observation S6-1-1 C22 0.6 0.46 0.068 No salt visible M6-1-1 C22 0.6 0.49 0.138 No salt visible L6-1-2 C22 0.6 0.66 0.200 No salt visible S9-1-1 C22 0.9 0.63 0.068 No salt visible M9-1-1 C22 0.9 0.55 0.138 No salt visible L9-1-2 C22 0.9 0.73 0.200 No salt visible S12-1-1 C22 1.2 0.70 0.068 Trace salts M12-1-1 C22 1.2 0.82 0.138 Specks of salt seen in broken glass sample L12-1-2 C22 1.2 0.74 0.355 Salts observed at meniscus C12(b) C22 1.2 0.84 0.038 No salt visible C15(b) C22 1.5 1.10 0.038 Salt observed NS12-2-1 New-1 1.2 0.85 0.068 No salt visible NS15-1-1 New-1 1.5 1.15 0.068 No salt visible NS18-1-1 New-1 1.8 1.26 0.068 No salt visible NS21-1-1 New-1 2.1 1.26 0.068 No salt visible NM12Sg(c) New-1 1.2 0.82 0.138 No salt visible (a) Note that the Na2O content of C22-based glasses was roughly 14.6 mass% while that of New-1 based glasses
was 20.0 mass%. As additional SO3 was added as Na2SO3, the Na2O concentrations were not fixed. (b) WTP GFCs used. (c) Higher sugar added.
4.1
4.0 Conclusions and Recommendations
This report presented a brief review of literature data and results of scoping studies for glass formulations considered for immobilization of INEEL SBW and Hanford LAW. These glass formulations are influenced by the presence of Na and sulfur in the waste composition. The literature data suggest that a difference in sulfur tolerance is possible with different glass-formulation approaches. The Hanford WTP baseline LAW glass-development approach yields lower sulfur loading with increasing Na (Na2O) loading while the INEEL SBW formulation approach yields the opposite trend. Specifically, a Na2O independent gSO3 limit of 0.8 mass% was developed and demonstrated for INEEL SBW. The gNa2O limit of 20 mass% is the same for the WTP and INEEL glass-formulation approaches. Therefore, scoping studies were performed to determine if the INEEL SBW approach could be applicable to Hanford LAW. These results show promise for the use of the formulation approach developed by Vienna and colleagues (Vienna et al. 1999; Peeler et al. 2001; Vienna et al. 2002; Vienna et al. 2003) for maximizing Hanford LAW loading in glass. Scoping studies indicated that approximately twice as much S can be incorporated in the glass as compared to current WTP glass formulations (e.g., up to 0.8 wt% SO3 at 20 wt% Na2O). These scoping studies suggest that the Hanford LAW glass development and formulation program could benefit from additional studies, including:
• testing and optimization for those properties key to Hanford LAW glasses that were not considered for INEEL SBW (VHT response, melter-component corrosion)
• scale-up testing to demonstrate the ability to incorporate higher LAW loadings while meeting required processing-rate constraints using the bubbled melters similar to those designed for WTP
• variation studies to ensure the robustness of the compositions to process uncertainties and waste-composition variations
• additional waste-form qualification activities (to expand the current LAW composition region to include these compositions).
The benefit of adopting this glass-development approach would be to lower the amount of LAW glass produced (and costs) at the WTP during life-cycle operations due to higher sulfur tolerances.
5.1
5.0 References
Bates, S. O., D. S. Goldman, and W. C. Richey. 1985. A Letter Report Summarizing the Sulfate/Redox Relationship to Glass Melting Chemistry and Behavior. HWVP-020207A, Pacific Northwest Laboratory, Richland, WA. Cozzi, A. D., D. F. Bickford, and M. E. Stone. 2002. Slurry Fed Melt Rate Furnace Runs to Support Glass Formulation Development for INEEL Sodium-Bearing Waste. WSRC-TR-2002-00192, Westinghouse Savannah River Company, Aiken, SC. Darab, J. G., D. D. Graham, B. D. MacIsaac, R. L. Russell, D. K. Peeler, H. D. Smith, and J. D. Vienna. 2001. Sulfur Partitioning During Vitrification of INEEL Sodium Bearing Waste: Status Report, PNNL-13588, Pacific Northwest National Laboratory, Richland, WA. Fincham, C.J.B., and F. D. Richardson. 1954. “The Behavior of Sulfur in Silicate and Aluminate Melts.” In Proc. Royal Soc., London, 223A, 40-63. Fu, S. S., K. S. Matlack, R. K. Mohr, W. Luo, E. Wang, M. Leontiev, H. Hojaji, M. Brandys, I. L. Pegg, and P. B. Macedo. 1996. “Minimelter Runs of Mixed Wastes High in Lead, Barium, Phosphorous, and Sulfur.” In Ceramic Transactions, 72, pp. 27-40, American Ceramic Society, Westerville, OH. Goldman, D. S. 1985. “Redox and Sulfur Solubility in Glass Melts.” In Proc. Intl. Congress on Glass, Charleroi, Belgium. Goles, R. W., J. M. Perez, B. D. MacIsaac, D. D. Siemer, and J. A. McCray. 2001. Test summary Report INEEL Sodium-Bearing Waste Vitrification Demonstration RSM-01-01. PNNL-13522, Pacific Northwest National Laboratory, Richland, WA. Goles, R. W., J. A. Del Debbio, R. J. Kirkham, B. D. MacIsaac, J. A. McCray, D. D. Siemer, and N. R. Soelberg. 2002. Test Summary Report INEEL Sodium-Bearing Waste Vitrification Demonstration RSM-01-2. PNNL-13869, Pacific Northwest National Laboratory, Richland, WA. Holmquist, S. 1966. “Oxygen Ion Activity and the Solubility of Sulfur Trioxide in Sodium Silicate Melts.” In J. Am. Ceram. Soc. 49(9):467:473. Hrma, P., J. D. Vienna, and J. S. Ricklefs. 2003. “Mechanism of Sulfate Segregation during Glass Melting.” In Scientific Basis for Nuclear Waste Management XXVI, pp 147-152, Materials Research Society, Warrendale, PA. Hrma, P., J. D. Vienna, and J. S. Ricklefs. 2004. “Sulfate Retention During Waste Glass Melting.” In Ceramics Transactions, 155, American Ceramic Society, Westerville, OH. Li, H., J. G. Darab, D. W. Matson, P. A. Smith, P. Hrma, Y. Chen, and J. Liu. 1996. “Phosphate-Sulfate Interaction in Simulated Low-Level Radioactive Waste Glasses.” In Scientific Basis for Nuclear Waste Management XIX, pp 141-148, Materials Research Society, Pittsburgh, PA. Li, H., P. Hrma, and J. D. Vienna. 2001. “Sulfate Retention and Segregation in Simulated Radioactive Waste Borosilicate Glass.” In Ceramic Transactions, 119, pp. 237-246, American Ceramic Society, Westerville, OH.
5.2
McKeown, D. A., I. S. Muller, H. Gan, I. L. Pegg, and W. C. Stolte. 2004. “Determination of sulfur environments in borosilicate waste glasses using X-ray absorption near-edge spectroscopy.” In J. Non-Cryst. Sol. 333:74–84. Muller, I. S., A. C. Buechele, and I. L. Pegg. 2001. Glass Formulation and Testing with RPP-WTP LAW Simulants - Final Report. VSL-01R3560-2, Vitreous State Laboratory, The Catholic University of America, Washington D.C. Musick, C. A., B. A. Scholes, R. D. Tillotson, D. M. Bennert, J. D. Vienna, J. V. Crum, D. K. Peeler, I. A. Reamer, D. F. Bickford, J. C. Marra, and N. L. Waldo. 2000. Technical Status Report: Vitrification Technology Development Using INEEL Run 78 Pilot Plant Calcine. INEEL\EXT-2000-00110, Idaho National Engineering and Environmental Laboratory, Idaho Falls, ID. Papadopoulos, K. 1973. “The Solubility of SO3 in Soda-Lime-Silica Melts.” In Phys. Chem. Glasses 14:60-65. Peeler, D. K., T. B. Edwards, I. A. Reamer, R. J. Workman, J. D. Vienna, J. V. Crum, and M. J. Schweiger. 2001. Glass Formulation Development for INEEL Sodium-Bearing Waste (WM-180) (U). WSRC-TR-2001-00295, Westinghouse Savannah River Company, Aiken, SC. Pegg I. L., H. Gan, I. S. Muller, D. A. McKeown, and K. S. Matlack. 2000. Summary of Preliminary Results on Enhanced Sulfate Incorporation During Vitrification of LAW Feeds. VSL-00R3630-1, Rev. 1, Vitreous State Laboratory, The Catholic University of America, Washington, D.C. Perez, J. M., L. J. Ethridge, D. S. Goldman, R. W. Goles, R. D. Peters, N. L. Scharnhorst, and G. J. Sevigny. 1983. West Valley Vitrification Experiment PSCM-16 Summary. Pacific Northwest Laboratory, Richland, WA. Perry, K. J., R. R. Kimmitt, N. R. Soelberg, R. D. Tillotson, and A. N. Olson. 2001. Test Results from SBW-FY91-PS-01 Vitrification Demonstration of Sodium Bearing Waste Simulant using WM-180 Surrogate. INEEL/EXT-01-01073, Idaho National Engineering and Environmental Laboratory, Idaho Falls, ID. Sullivan, G., M. H. Langowski, and P. Hrma. 1995. “Sulfate Segregation in Vitrification of Simulated Hanford Nuclear Waste Glasses.” In Ceramic Transactions 61, pp 187-193, American Ceramic Society, Westerville, OH. U.S. Department of Energy (DOE). 2000. Design, Construction, and Commissioning of the Hanford Tank Waste Treatment and Immobilization Plant. Contract Number: DE-AC27-01RV14136, as amended, U.S. Department of Energy, Office of River Protection, Richland, WA. Vienna, J. D., M. J. Schweiger, D. E. Smith, H. D. Smith, J. V. Crum, D. K. Peeler, I. A. Reamer, C. A. Musick, and R. D. Tillotson. 1999. Glass Formulation Development for INEEL Sodium-Bearing Waste. PNNL-12234, Pacific Northwest National Laboratory, Richland, WA Vienna, J. D., P. Hrma, A. Jiricka, D. E. Smith, T. H. Lorier, I. A. Reamer, and R. L. Schulz. 2001. Hanford Immobilized LAW Product Acceptance Testing: Tanks Focus Area Results. PNNL-13744, Pacific Northwest National Laboratory, Richland, WA.
5.3
Vienna, J. D., W. C. Buchmiller, J. V. Crum, D. D. Graham, D. S. Kim, B. D. MacIsaac, M. J. Schweiger, D. K. Peeler, T. B. Edwards, I. A. Reamer, and R. J. Workman. 2002. Glass Formulation Development for INEEL Sodium-Bearing Waste. PNNL-14050, Pacific Northwest National Laboratory, Richland, WA. Vienna, J. D., D. S. Kim, and D. K. Peeler. 2003. “Glass Formulation for INEEL Sodium Bearing Waste.” In Ceramic Transactions 143, pp. 169-176, American Ceramic Society, Westerville, OH.
A1
Appendix A. INEEL SBW Glass Compositions
Table A.1. Compositions of Tested INEEL SBW Glasses in mass%
1 A. Aloy V. G. Khlopin Radium Institute 28, 2nd Murinsky Pr. RF-194021 St. Petersburg, Russia 1 I. L. Pegg Catholic University of America Vitreous State Laboratory 620 Michigan Ave., N. E. Washington, D. C. 20064 3 Westinghouse Savannah River Company Aiken, SC 29808, Attn: E. W. Holtzscheiter 773-A C. M. Jantzen 773-A D. K. Peeler 999-W
2 DOE/Office of River Protection W. F. Hamel H6-60 B. Mauss H6-60 1 Duratek C. C. Chapman H1-11 6 RPP-WTP Program R. L. Gilchrist H4-02 E. V. Morrey H4-02 C. M. Musick H4-02 J. M. Perez H4-02 W. Tamosaitis H4-02 J. H. Westsik H4-02 22 Pacific Northwest National Laboratory G. H. Beeman K9-18 W. F. Bonner K9-14 J. V. Crum K6-24 M. L. Elliott K6-28 R. W. Goles K6-24 P. R. Hrma K6-24 L. K. Holton H6-61 E. O. Jones K6-24 G. B. Josephson K6-69 D. S. Kim K6-24 L. K. Holton H6-61 M. J. Schweiger K6-24 J. D. Vienna (10) K6-24