41
ã Commonwealth of Australia 2016
ISSN 1448-9805 (Print)ISSN 2206-9704 (Online)ISBN 978-1-74037-590-0 (PDF)ISBN 978-1-74037-591-7 (Print)
Except for the Commonwealth Coat of Arms and content supplied by third parties, this copyright work is licensed under a Creative Commons Attribution 3.0 Australia licence. In essence, you are free to copy, communicate and adapt the work, as long as you attribute the work to the Steering Committee for the Review of Government Service Provision (but not in any way that suggests the Commission endorses you or your use) and abide by the other licence terms. To view a copy of this licence, visit http://creativecommons.org/licenses/by/3.0/au.
Third party copyrightWherever a third party holds copyright in this material, the copyright remains with that party. Their permission may be required to use the material, please contact them directly.
AttributionThis work should be attributed as follows, Source: Steering Committee for the Review of Government Service Provision, Overcoming Indigenous Disadvantage 2016.If you have adapted, modified or transformed this work in anyway, please use the following, Source: based on Steering Committee for the Review of Government Service Provision data, Overcoming Indigenous Disadvantage 2016.
An appropriate reference for this publication is:SCRGSP (Steering Committee for the Review of Government Service Provision) 2016, Overcoming Indigenous Disadvantage: Key Indicators 2016, Productivity Commission, Canberra.
Publications enquiriesThe Productivity Commission acts as the Secretariat for the Steering Committee for the Review of Government Service Provision. This report and previous editions are available from the Productivity Commission website at www.pc.gov.au. The Steering Committee welcomes enquiries and suggestions on the information contained in this report, contact the Secretariat by phone: (03) 9653 2100 or email: [email protected].
PhotographsAboriginal and Torres Strait Islander people should be aware that this publication may contain images of deceased people. The Steering Committee thanks the Yiriman Project; Department of Agriculture and Food WA; Indigenous Landholder Services Organisation; the AIME Program; Mossman Gorge Centre; Victorian Aboriginal Child Care Agency; Care for Kids’ Ears, Department of Health; Kimberley Aboriginal Law & Cultural Centre; and the Family Wellbeing Program for providing the photographs reproduced in this report. No inference is intended that the people or communities shown are the subject of any issues raised in the report.
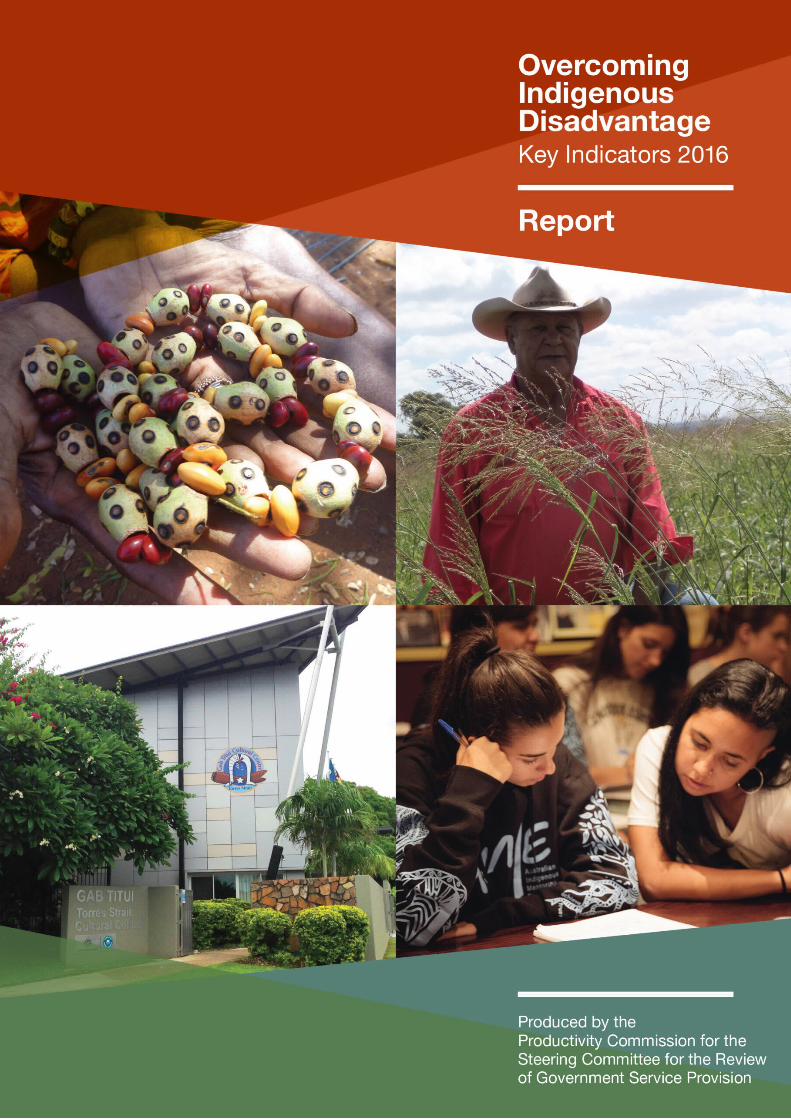
Cover photosClockwise from top left: Image of Walmajarri woman Julia Mayarn Lawford, photo taken by Janelle White, courtesy of Yiriman Project; Image of Kevin Barron, Yallalie Farm in Dandaragan WA, photo taken by Mark Chmielewski, courtesy of the Department of Agriculture and Food WA; Photo courtesy of the AIME Program; Photo taken by Secretariat staff, The Gab Titui Cultural Centre, Thursday Island, Queensland.
This report generally uses the term ‘Aboriginal and Torres Strait Islander Australians’ to describe Australia’s first peoples and ‘non-Indigenous Australians’ to refer to Australians of other backgrounds, except where quoting other sources.
Foreword
This is the seventh report in the Overcoming Indigenous Disadvantage (OID) series, which can trace its origins to the final report of the Council for Aboriginal Reconciliation in 2000. It measures the wellbeing of Aboriginal and Torres Strait Islander Australians.
The OID report provides a public report card on progress in overcoming Indigenous disadvantage. It can help governments assess the effectiveness of policies and inform the development of new approaches. It can assist Aboriginal and Torres Strait Islander Australians to hold governments to account, and to develop their own responses.
The extent of the challenge to improve Aboriginal and Torres Strait Islander wellbeing remains evident in the data presented in this report. While there have been improvements in some areas over time (particularly for indicators related to early child development), in many areas there have not, and in some areas outcomes have worsened (for mental health and imprisonment, this represents a continued regression from the previous OID report in 2014).
But data alone cannot tell the complete story of wellbeing for Aboriginal and Torres Strait Islander Australians, nor can it tell us why outcomes improve (or not). As in previous editions, this report includes case studies of programs that are making a difference as ‘things that work’, though only a relatively small number have been rigorously evaluated. There is a pressing need for more and better evaluation of Indigenous policies and programs nationally if we are to see improvements in outcomes for Aboriginal and Torres Strait Islander Australians. We need to understand better which policies and programs work better than others and why.
On behalf of the Steering Committee, I would like to thank the many Aboriginal and Torres Strait Islander organisations and individuals involved in the production of the report. Particular thanks go to the National Congress of Australia’s First Peoples, which participated on the working group that advised the Steering Committee on all aspects of the report. I also record our gratitude to all members of the working group. And I am very grateful for the support of staff in the Secretariat at the Productivity Commission, led by Catherine Andersson.
Peter Harris AOChairmanNovember 2016
FOREWORD iii
Terms of reference
Prime MinisterCanberra
Reference: B08/2004
11 Mar 2009
Mr Gary Banks AOChairmanSteering Committee for the Review of Government Service Provision
Dear Mr Banks
I am writing in my capacity as Chair of the Council of Australian Governments (COAG) to convey to you updated Terms of Reference for the Overcoming Indigenous Disadvantage (OID) Report.
Since it was first published in 2003, the OID report has established itself as a source of high quality information on the progress being made in addressing Indigenous disadvantage across a range of key indicators. The OID report has been used by Governments and the broader community to understand the nature of Indigenous disadvantage and as a result has helped inform the development of policies to address Indigenous disadvantage. The OID report is highly regarded and I commend the Steering Committee for the Review of Government Services (the Steering Committee) for its efforts in preparing the report every two years.
In December 2007 and March 2008, COAG committed to six ambitious targets to close the gap in Indigenous disadvantage:
closing the life expectancy gap within a generation;
halving the gap in the mortality rate for Indigenous Children under five within a decade;
ensuring all Indigenous four year olds in remote communities have access to quality early childhood programs within five years;
halving the gap in reading, writing and numeracy achievements for children within a decade;
iv OVERCOMING INDIGENOUS DISADVANTAGE 2016

halving the gap for Indigenous students in Year 12 attainment rates or equivalent attainment by 2020; and
halving the gap in employment outcomes within a decade.
Without high quality data, it is impossible to understand where we are headed in terms of overcoming Indigenous disadvantage. Through the National Indigenous Reform Agreement, all Governments have committed to ensuring their data is of high quality, and moreover, is available for reporting purposes. This undertaking has been made with specific reference to the need for data to be provided for the OID report.
In August 2008, the Chair of the COAG Working Group on Indigenous Reform (WGIR), the Hon Jenny Macklin MP, wrote to you requesting the Steering Committee work with the WGIR to align the OID framework to the Closing the Gap targets.
As a result, on 29 November 2008, COAG agreed a new framework for the OID report which takes account of the six ambitious targets to Close the Gap in Indigenous disadvantage. The Steering Committee should take account of this new framework in preparing future OID reports thereby ensuring the report continues to provide Governments and the broader community with an understanding of the progress being made to overcome Indigenous disadvantage.
I have copied this letter to the Treasurer, Ms Macklin and the Chair of MCATSIA the Deputy Premier of the Government of Western Australia and Minister for Indigenous Affairs, the Hon Dr Kim Hames MLA.
Yours sincerely
Kevin Rudd
TERMS OF REFERENCE v
Contents
Foreword iiiTerms of reference ivSteering Committee xiAcknowledgments xiiiAcronyms and abbreviations xvGlossary xxKey Points xxviii1 About this report 1.1
1.1 Origins of the OID report1.1
1.2 Role and purpose of the OID report1.2
1.3 Putting the OID report into context1.5
1.4 The historical context1.7
1.5 Recent COAG developments1.13
1.6 The Review of Government Service Provision1.14
2 The framework 2.12.1 The framework
2.1
2.2 Key concepts incorporated in the framework2.10
3 Key themes and interpretation 3.13.1 Estimating the Aboriginal and Torres Strait Islander populations 3.2
CONTENTS vii
3.2 Interpreting data in the report3.4
3.3 Demographics of the Aboriginal and Torres Strait Islander population 3.8
3.4 Remoteness3.11
3.5 Interactions across the report3.13
3.6 Things that work — success factors3.17
3.7 International comparisons3.21
4 COAG targets and headline indicators 4.14.1 Life expectancy
4.4
4.2 Young child mortality4.11
4.3 Early childhood education4.18
4.4 Reading, writing and numeracy4.26
4.5 Year 1 to 10 attendance4.36
4.6 Year 12 attainment4.43
4.7 Employment4.51
4.8 Post-secondary education — participation and attainment4.61
4.9 Disability and chronic disease4.69
4.10 Household and individual income4.79
4.11 Substantiated child abuse and neglect4.87
viii OVERCOMING INDIGENOUS DISADVANTAGE 2016
4.12 Family and community violence 4.98
4.13 Imprisonment and juvenile detention4.110
5 Governance, leadership and culture 5.15.1 Valuing Indigenous Australians and their cultures
5.3
5.2 Governance, leadership and culture5.12
5.3 Engagement with services5.19
5.4 Case studies in governance5.28
5.5 Indigenous language revitalisation and maintenance5.44
5.6 Indigenous cultural studies5.53
5.7 Participation in community activities5.62
5.8 Access to traditional lands and waters5.70
6 Early child development 6.16.1 Antenatal care
6.3
6.2 Health behaviours during pregnancy6.10
6.3 Teenage birth rate6.19
6.4 Birthweight6.26
6.5 Early childhood hospitalisations6.32
6.6 Injury and preventable disease6.36
6.7 Ear Health6.42
CONTENTS ix

6.8 Basic skills for life and learning6.49
7 Education and training 7.17.1 Teacher quality
7.3
7.2 School engagement7.9
7.3 Transition from school to work7.14
8 Healthy lives 8.18.1 Access to primary health care
8.3
8.2 Potentially preventable hospitalisations8.10
8.3 Potentially avoidable deaths8.15
8.4 Tobacco consumption and harm8.20
8.5 Obesity and nutrition8.25
8.6 Oral health8.30
8.7 Mental health8.35
8.8 Suicide and self-harm8.42
9 Economic participation 9.19.1 Employment by full time/part time status, sector and occupation 9.4
9.2 Indigenous owned or controlled land and business9.10
9.3 Home ownership9.23
9.4 Income support9.29
x OVERCOMING INDIGENOUS DISADVANTAGE 2016
10 Home environment 10.110.1 Overcrowding in housing
10.3
10.2 Rates of disease associated with poor environmental health 10.13
10.3 Access to clean water and functional sewerage and electricity services 10.21
11 Safe and supportive communities 11.111.1 Alcohol consumption and harm
11.3
11.2 Drug and other substance use and harm11.12
11.3 Juvenile diversions11.19
11.4 Repeat offending11.25
11.5 Community functioning 11.31
12 Outcomes for Torres Strait Islander people 12.112.1 Selected outcomes for Torres Strait Islander people 12.2
13 Measuring factors that improve outcomes 13.113.1 Interactions between measures of wellbeing
13.2
13.2 Factors related to primary education achievement13.9
Appendix 1 COAG Communiqués A1.1Appendix 2 Aboriginal and Torres Strait Islander populations
and language use A2.1Appendix 3 Data limitations A3.1
CONTENTS xi
Steering Committee
This report was produced under the direction of the Steering Committee for the Review of Government Service Provision (SCRGSP). The Steering Committee comprises the following current members:
Mr Peter Harris Chairman Productivity Commission
Mr Marty Robinson Aust. Govt. The TreasuryMs Josephine Laduzko Aust. Govt. Department of the Prime Minister and CabinetMr Nicholas Hunt Aust. Govt. Department of Finance
Mr Rick Sondalini NSW NSW TreasuryMs Anita Truninger NSW Department of Premier and Cabinet
Ms Brigid Monagle Vic Department of Premier and CabinetMr Jeremy Nott Vic Department of Treasury and Finance
Ms Nicole Tabb Qld Department of the Premier and CabinetMs Janelle Thurlby Qld Queensland Treasury
Ms Melissa Rudez WA Department of the Premier and CabinetMr Kurt Sibma WA Department of Treasury
Ms Tammie Pribanic SA Department of Treasury and FinanceMr Chris McGowan SA Department of the Premier and Cabinet
Ms Ruth McArdle Tas Department of Premier and Cabinet
Mr Geoffrey Rutledge ACT Chief Minister, Treasury and Economic Development Directorate
Ms Jean Doherty NT Department of the Chief MinisterMs Linda Weatherhead NT Department of the Chief MinisterMs Nardia Harris NT Department of Treasury and Finance
Mr Barry Sandison Australian Institute of Health and Welfare
Dr Paul Jelfs Australian Bureau of Statistics
xii OVERCOMING INDIGENOUS DISADVANTAGE 2016
People who also served on the Steering Committee during the production of this report include:
Ms Emily Martin Aust. Govt. The TreasuryMr Jonathan Rollings Aust. Govt. The TreasuryMs Sam Reinhardt Aust. Govt. The TreasuryMr Mark Thomann Aust. Govt. Department of Finance
Ms Michelle Dumazel NSW Department of Premier and Cabinet
Ms Bronwen FitzGerald Vic Department of Premier and CabinetMs Katherine Whetton Vic Department of Premier and Cabinet
Mr Chris Chinn Qld Department of the Premier and Cabinet
Ms Marion Burchell WA Department of the Premier and CabinetMs Lorissa Kelly WA Department of the Premier and CabinetMr Barry Thomas WA Department of Treasury
Ms Katrina Ball SA Department of Treasury and FinanceMs Nicole Hunter SA Department of the Premier and Cabinet
Ms Rebekah Burton Tas Department of Premier and Cabinet
Ms Tracey Scott NT Department of Treasury and Finance
Ms Kerry Flanagan Australian Institute of Health and WelfareMr Andrew Kettle Australian Institute of Health and Welfare
Mr Peter Harper Australian Bureau of Statistics
STEERING COMMITTEE xiii
Acknowledgments
The Overcoming Indigenous Disadvantage Working Group undertakes the development and production of the Overcoming Indigenous Disadvantage Report under the auspice of the Steering Committee. The Working Group comprises the following members:
Ms Nina Davidson Acting Head of Office Productivity CommissionMr Matthew James Aust. Govt. Department of the Prime Minister and CabinetMr Nathan Martin NSW Department of Premier and CabinetMs Rachel Davis Vic Department of Premier and CabinetMs Jackie Wallace Qld Department of the Premier and CabinetMr Ben Halton WA Department of Aboriginal AffairsMr John Wright SA Department of State DevelopmentMs Kate Kent Tas Department of Premier and CabinetMs Lisa Gooley ACT Community Services DirectorateMr Nathan Evans NT Department of Local Government and
Community ServicesMr Geoff Scott National Congress of Australia’s First PeoplesDr Fadwa Al-Yaman Australian Institute of Health and WelfareMs Sharon Pech Australian Bureau of Statistics
People who also served on the Working Group during the production of this report include:
Ms Kristy Delaney NSW Aboriginal AffairsMr Trevor Fleming Vic Department of Premier and CabinetMs Emma Ogilvie Qld Department of Premier and CabinetMs Jocelyn Bell Qld Department of Premier and CabinetMr Stephen Jones WA Department of Aboriginal AffairsMr Nick Evans Tas Department of Premier and CabinetMr Craig Martin Tas Department of Premier and CabinetMr Colin Farlow ACT Community Services DirectorateMs Danielle Stiff ACT Community Services DirectorateMs Linda Weatherhead NT Department of the Chief MinisterMs Leeanne Caton NT Department of Local Government and
Community Services
xiv OVERCOMING INDIGENOUS DISADVANTAGE 2016
Ms Julie Nankervis Australian Bureau of StatisticsMs Mary Jackson Australian Bureau of StatisticsMr Simon Bartlett Australian Bureau of Statistics
The Steering Committee acknowledges the contribution of the staff of the secretariat at the Productivity Commission who produced this report, and of the many organisations and individuals in consultations on this report. It particularly thanks the following organisations and individuals for reviewing sections of this report.
Dr Nicholas Biddle (Centre for Aboriginal Economic Policy Research, Australian National University)Dr Kyllie Cripps (Indigenous Law Centre, University of New South Wales)Mr Jason Glanville (Australian Indigenous Governance Institute)Ms Heron Loban (Griffith University)Dr Karen Martin (Griffith University)National Health Leadership ForumReconciliation AustraliaMs Lynette Riley (University of Sydney)Dr Felecia Watkin Lui (James Cook University)Working Group on Aboriginal and Torres Strait Islander Environmental Health
ACKNOWLEDGMENTS xv
Acronyms and abbreviations
AATSIHS Australian Aboriginal and Torres Strait Islander Health Survey
ABS Australian Bureau of Statistics
ABS Census Census of Population and Housing
ACARA Australian Curriculum, Assessment and Reporting Authority
ACCHS Aboriginal Community Controlled Health Services
ACER Australian Council for Educational Research
ACIR Australian Childhood Immunisation Register
ACT Australian Capital Territory
AEC Australian Electoral Commission
AEDC Australian Early Development Census
AHMAC Australian Health Ministers’ Advisory Council
AHRC Australian Human Rights Commission
AHS Australian Health Survey
AIATSIS Australian Institute of Aboriginal and Torres Strait Islander Studies
AIC Australian Institute of Criminology
AIEW Aboriginal and Islander Education Worker
AIFS Australian Institute of Family Studies
AIHW Australian Institute of Health and Welfare
AILC Australian Indigenous Leadership Centre
ANAO Australian National Audit Office
APY Anangu Pitjantjatjara Yankunytjatjara
APSC Australian Public Service Commission
AQF Australian Qualifications Framework
ASGC Australian Standard Geographical Classification
ASGS Australian Statistical Geography Standard (replaced the ASGC)
ATAR Australian Tertiary Admissions Rank
ATSIHPF Aboriginal and Torres Strait Islander Health Performance Framework
xvi OVERCOMING INDIGENOUS DISADVANTAGE 2016
ATSIC Aboriginal and Torres Strait Islander Commission
BCA Business Council of Australia
BBB Bumps, Babies and Beyond
BMI Body mass index
CAEPR Centre for Aboriginal Economic Policy Research
CAR Council for Aboriginal Reconciliation
CDEP Community Development Employment Projects
CEaCS Childhood Education and Care Survey
CGC Commonwealth Grants Commission
CGRIS Coordinator General for Remote Indigenous Services
CHINS Community Housing and Infrastructure Needs Survey
CIRCA Cultural and Indigenous Research Centre Australia
COAG Council of Australian Governments
COPD Chronic obstructive pulmonary diseases
CPiCLAS Children’s Participation in Cultural and Leisure Activities Survey
CRC COAG Reform Council
CTGCH Closing the Gap Clearinghouse
CYI Cape York Institute
CYP Cape York Partnerships
CYWR Cape York Welfare Reform
DAFWA Department of Agriculture and Food WA
dmft Decayed, missing or filled deciduous (infant) teeth
DMFT Decayed, missing or filled adult teeth
DSS Department of Social Services
EASCP East Arnhem Scabies Control Program
EGWH Equivalised Gross Weekly Household income
FaHCSIA Department of Families, Housing, Community Services and Indigenous Affairs
FATSIL Federation of Aboriginal and Torres Strait Islander Languages
FASD Fetal alcohol spectrum disorder
GP General practitioner
GSS ABS General Social Survey
ACRONYMS AND ABBREVIATIONS xvii

HILDA Household, Income and Labour Dynamics in Australia survey
HIPPY Home Interaction Program for Parents and Youngsters
HfL Healthy for Life program
HoRSCoATSIA House of Representatives Standing Committee on Aboriginal and Torres Strait Islander Affairs
IBA Indigenous Business Australia
ICD-10-AM International Classification of Diseases, 10th Edition, Australian Modification
ICGP Indigenous Community Governance Project
IERSC Indigenous Expenditure Report Steering Committee
IGA Indigenous Governance Award
ILC Indigenous Land Corporation
ILS Indigenous Landholder Services
ILUA Indigenous Land Use Agreement
IPA Indigenous Protected Area
JJT Juvenile Justice Team
LSAC Longitudinal Study of Australian Children
LSIC Longitudinal Study of Indigenous Children
MBS Medicare Benefits Schedule
MCATSIA Ministerial Council for Aboriginal and Torres Strait Islander Affairs
MSS mean scale score
NAHA National Affordable Housing Agreement
NPAH National Partnership Agreement on Homelessness
NPARIH National Partnership Agreement on Remote Indigenous Housing
NAPLAN National Assessment Program — Literacy and Numeracy
NATSIHS National Aboriginal and Torres Strait Islander Health Survey
NATSINPAS National Aboriginal and Torres Strait Islander Nutrition and Physical Activity Survey
NATSIS National Aboriginal and Torres Strait Islander Survey
NATSISS National Aboriginal and Torres Strait Islander Social Survey
NCVER National Centre for Vocational Education Research
NECECC National Early Childhood Education and Care Collection
xviii OVERCOMING INDIGENOUS DISADVANTAGE 2016
NHMD National Hospital Morbidity Database
NHMP National Homicide Monitoring Program
NHMRC National Health and Medical Research Council
NHS National Health Survey
NILS National Indigenous Languages Survey
NIRA National Indigenous Reform Agreement
NMDDP National Maternity Data Development Project
NMDS National Minimum Data Set
NMS national minimum standard
NNTT National Native Title Tribunal
NP National Partnership
NPA National Partnership Agreement
NPARIH National Partnership Agreement on Remote Indigenous Housing
NPC National Preschool Census
NPDC National Perinatal Data Collection
NSAC National Schools Attendance Collection
NSSC National Schools Statistics Collection
NSW New South Wales
NT Northern Territory
NTER Northern Territory Emergency Response
NTWD National Teacher Workforce Dataset
NWC National Water Commission
NWI National Water Initiative
OECD Organisation for Economic Co-operation and Development
OID Overcoming Indigenous Disadvantage
OIPC Office of Indigenous Policy Coordination
ORIC Office of the Registrar of Indigenous Corporations
PC Productivity Commission
PISA Programme for International Student Assessment
Qld Queensland
RA Reconciliation Australia
RAP Reconciliation Action Plan
ACRONYMS AND ABBREVIATIONS xix
RJCP Remote Jobs and Communities Program
RSE Relative standard error
SA South Australia
SAAAC South Australian Aboriginal Advisory Council
SCRCSSP Steering Committee for the Review of Commonwealth/State Service Provision
SCRGSP Steering Committee for the Review of Government Service Provision
SCSEEC Standing Council on School Education and Early Childhood
SDAC ABS Survey of Disability Ageing and Carers
SE Standard Error
SEW ABS Survey of Education and Work
SNAICC Secretariat of National Aboriginal and Islander Child Care
SHS Specialist Homelessness Services
SiAS Staff in Australia’s Schools survey
STIs Sexually Transmissible Infections
TAFE Technical and Further Education
Tas Tasmania
UNESCO United Nations Educational, Scientific and Cultural Organization
VET Vocational Education and Training
Vic Victoria
WA Western Australia
WAACHS Western Australian Aboriginal Child Health Survey
WGIR Working Group on Indigenous Reform
WHO World Health Organisation
xx OVERCOMING INDIGENOUS DISADVANTAGE 2016
Glossary
Aboriginal A person who identifies as being of Aboriginal origin. May also include people who identify as being of both Aboriginal and Torres Strait Islander origin.
Age standardised rates
Age standardised rates enable comparisons to be made between populations that have different age structures. Age standardisation is often used when comparing the Aboriginal and Torres Strait Islander and non-Indigenous populations because the Aboriginal and Torres Strait Islander population is younger than the non-Indigenous population. Outcomes for some indicators are influenced by age, therefore, it is appropriate to age standardise the data when comparing the results. When comparisons are not being made between the two populations, the data are not age standardised.
CDEP Community Development Employment Projects (CDEP) was an Australian Government funded program that provided activities for unemployed Aboriginal and Torres Strait Islander Australians to develop work skills and move into employment (see section 4.7).
Core activity limitation (ABS SDAC definition)
Four levels of core activity limitation are determined based on whether a person needs help, has difficulty, or uses aids or equipment with any of the core activities (mobility, self-care and communication). A person's overall level of core activity limitation is determined by their highest level of limitation in these activities.
The four levels of limitation are: profound — the person is unable to do, or always needs help
with, a core activity task. severe — the person:
– sometimes needs help with a core activity task, and/or
– has difficulty understanding or being understood by family or friends, or
– can communicate more easily using sign language or other non-spoken forms of communication.
moderate — the person needs no help, but has difficulty with a
GLOSSARY xxi
core activity task. mild — the person needs no help and has no difficulty with any
of the core activity tasks, but:
– uses aids or equipment, or has one or more of the following limitations
– cannot easily walk 200 metres
– cannot walk up and down stairs without a handrail
– cannot easily bend to pick up an object from the floor
– cannot use public transport
– can use public transport, but needs help or supervision
– needs no help or supervision, but has difficulty using public transport.
Confidence intervals
Survey data, for example data from the Australian Aboriginal and Torres Strait Islander Health Survey, are subject to sampling error because they are based on samples of the total population. Where survey data are shown in charts in this report, error bars are included, showing 95 per cent confidence intervals. There is a 95 per cent chance that the true value of the data item lies within the interval shown by the error bars. See ‘statistical significance’.
See also ‘Error bars’.
Disability (ABS SDAC definition)
A person has a disability if he or she has a limitation, restriction or impairment, which has lasted, or is likely to last, for at least six months and restricts everyday activities. These activities include: loss of sight (not corrected by glasses or contact lenses); loss of hearing where communication is restricted, or an aid to assist with, or substitute for, hearing is used; speech difficulties; shortness of breath or breathing difficulties causing restriction; chronic or recurrent pain or discomfort causing restriction; blackouts, seizures, or fits, or loss of consciousness; difficulty learning or understanding; incomplete use of arms or fingers; difficulty gripping or holding things; incomplete use of feet or legs; nervous or emotional condition causing restriction; restriction in physical activities or in doing physical work; disfigurement or deformity; mental illness or condition requiring help or supervision; long-term effects of head injury, stroke or other brain damage causing restriction; receiving treatment or medication for any other long-term conditions or ailments and still restricted; or any other long-term conditions resulting in a restriction.
xxii OVERCOMING INDIGENOUS DISADVANTAGE 2016
ICD ICD is the International Statistical Classification of Diseases and Related Health Problems, endorsed by the World Health Organization (WHO). It is primarily designed for the classification of diseases and injuries with a formal diagnosis. ICD-10-AM is the Australian modification of the tenth revision and was adopted for Australian use from 1 January 1999 (superseding ICD-9).
Equivalised household income
Equivalised household income adjusts the actual incomes of households to make households of different sizes and compositions comparable. It results in a measure of the economic resources available to members of a standardised household (see section 4.10).
Error bars Survey data, for example data from the Australian Aboriginal and Torres Strait Islander Social Survey, are subject to sampling error because they are based on samples of the total population. Where survey data are shown in charts in this report, error bars are included, showing 95 per cent confidence intervals. There is a 95 per cent chance that the true value of the data item lies within the interval shown by the error bars. See ‘statistical significance’.
See also ‘Confidence intervals’.
Hospitalisation Hospitalisations recorded in this report refer to ‘hospital separations’. A ‘separation’ is an episode of care, which can be a total hospital stay (from admission to discharge, transfer or death), or a portion of a hospital stay beginning or ending in a change of type of care (for example, from acute to rehabilitation). It is also defined as the process by which an admitted patient completes an episode of care by being discharged, dying, transferring to another hospital or changing type of care. For measuring a hospital’s activity, separations are used in preference to admissions because diagnoses and procedures can be more accurately recorded at the end of a patient’s stay and patients may undergo more than one separation from the time of admission. Admitted patients who receive same day procedures are recorded in hospitalisation statistics.
Income ranges See ‘quintiles’.
Indigenous A person of Aboriginal and/or Torres Strait Islander origin who identifies as an Aboriginal and/or Torres Strait Islander Australian.
Indigenous status not stated/
Where a person’s Indigenous status has either not been asked or not recorded.
GLOSSARY xxiii

Indigenous status unknown
Infant mortality Deaths of children between birth and exactly one year of age.
Inner regional See ‘remoteness areas’.
Jurisdiction The Australian Government or a State or Territory Government and areas that it has legal authority over.
Labour force The labour force is the most widely used measure of the economically active population or the formal supply of labour. It is a measure of the number of people contributing to, or willing to contribute to, the supply of labour and, as defined by the ABS, comprises two mutually exclusive categories of population: the employed (people who have worked for at least one hour in the reference week), and the unemployed (people who are without work, but had actively looked for work in the four weeks up to the end of the reference week and were available to start work in the reference week).
Major cities See ‘remoteness areas’.
Mean and median income measures
A mean income value is the average value of a set of income data. It is calculated by adding up all the values in the set of data and dividing that sum by the number of values in the dataset. Median value is the middle point of a set of income data. Lining up the values in a set of income data from largest to smallest, the one in the centre is the median income value (if the centre point lies between two numbers, the median value is the average value of the two numbers).
Median value is a better measure for income than mean as mean income values are more influenced by extreme income values (including the lowest and highest incomes). Therefore, median income value is a more accurate measure of income for an average household or average individual income earner.
For example, the gross monthly incomes for 9 households are: $10 000, $5000, $2500, $1500, $1500, $1500, $1000, $450, $450.
The mean income value among the 9 households is ($10 000+$5 000+$2500+$1500+$1500+$1500+$1000+$450+$450)/9=$2655.6. The median income value is the fifth value (the mid point), $1500.
Non-Indigenous A person who does not identify as Aboriginal and/or Torres Strait
xxiv OVERCOMING INDIGENOUS DISADVANTAGE 2016
Islander.
Non-school qualification
Non-school qualifications include vocational or higher education qualifications.
Non-remote See ‘remoteness areas’.
Outer regional See ‘remoteness areas’.
Perinatal mortality
Fetuses delivered with a gestational age of 20 weeks or more, or weighing at least 400 grams, and all neonatal deaths – infant deaths within 28 days of birth.
Post-school qualification
Post-school qualifications include vocational or higher education qualifications.
Quintiles Income quintiles are groups that result from ranking all people in the population in ascending order (from the lowest to the highest) according to their (as an example) incomes and then dividing the population into five equal groups, each comprising 20 per cent of the population.
Rate ratio The rate ratio is the rate for the Aboriginal and Torres Strait Islander population divided by the rate for the non-Indigenous (or other) population.
Regional See ‘remoteness areas’.
Relative standard error (RSE)
The relative standard error (RSE) of a survey data estimate is a measure of the reliability of the estimate and depends on both the number of people giving a particular answer in the survey and the size of the population. The RSE is expressed as a percentage of the estimate. The higher the RSE, the less reliable the estimate. Relative standard errors for survey estimates are included in the attachment tables. See also ‘statistical significance’.
Remote See ‘remoteness areas’.
Remoteness See ‘remoteness areas’.
GLOSSARY xxv
Remoteness areas
Remoteness areas are defined in the Australian Statistical Geographical Standard (ASGS) developed by the ABS.1 The ASGS remoteness classification identifies a place in Australia as having a particular degree of remoteness. The remoteness of each place is determined using the Accessibility/Remoteness Index of Australia (ARIA). The ABS generates an average ARIA score for each location based on its distance from population centres of various sizes. Locations are then added together to form the remoteness areas in each State and Territory. Remoteness areas comprise the following six categories:
major cities of Australia
inner regional Australia
outer regional Australia
remote Australia
very remote Australia
migratory regions (comprising off-shore, shipping and migratory places).
The aim of the ASGS remoteness structure is not to provide a measure of the remoteness of a particular location but to divide Australia into five broad categories (excluding migratory regions) of remoteness for comparative statistical purposes.
Statistical significance
Statistical significance is a measure of the degree of difference between survey data estimates. The potential for sampling error — that is, the error that occurs by chance because the data are obtained from only a sample and not the entire population — means that reported responses may not indicate the true responses.
Using the relative standard errors (RSE) of survey data estimates, it is possible to use a formula to test whether the difference is statistically significant. If there is an overlap between confidence intervals for different data items, it cannot be stated for certain that there is a statistically significant difference between the results. See ‘confidence intervals’ and ‘relative standard error’.
1 The ASGS replaced the Australian Standard Geographical Classification (ASGC) from 1 July 2013.
xxvi OVERCOMING INDIGENOUS DISADVANTAGE 2016
Torres Strait Islander people
People who identify as being of Torres Strait Islander origin. May also include people who identify as being of both Torres Strait Islander and Aboriginal origin.
Unemployment rate
The unemployment rate is defined as the proportion of people in the labour force who:
had actively looked for full-time or part-time work at any time in the four weeks up to the end of the reference week, or
were waiting to start a new job within four weeks from the end of the reference week and could have started in the reference week if the job had been available then.
Very remote See ‘remoteness areas’.
GLOSSARY xxvii
Key points This report measures the wellbeing of Aboriginal and Torres Strait Islander Australians, and
was produced in consultation with governments and Aboriginal and Torres Strait Islander Australians. Around 3 per cent of the Australian population are estimated as being of Aboriginal or Torres Strait Islander origin (based on 2011 Census data).
Outcomes have improved in a number of areas, including some COAG targets. For indicators with new data for this report:
– Mortality rates for children improved between 1998 and 2014, particularly for 0<1 year olds, whose mortality rates more than halved (from 14 to 6 deaths per 1000 live births).
– Education improvements included increases in the proportion of 20–24 year olds completing year 12 or above (from 2008 to 2014-15) and the proportion of 20–64 year olds with or working towards post-school qualifications (from 2002 to 2014-15).
– The proportion of adults whose main income was from employment increased from 32 per cent in 2002 to 43 per cent in 2014-15, with household income increasing over this period.
– The proportion of adults that recognised traditional lands increased from 70 per cent in 2002 to 74 per cent in 2014-15.
However, there has been little or no change for some indicators.
– Rates of family and community violence were unchanged between 2002 and 2014-15 (around 22 per cent), and risky long-term alcohol use in 2014-15 was similar to 2002 (though lower than 2008).
– The proportions of people learning and speaking Indigenous languages remained unchanged from 2008 to 2014-15.
Outcomes have worsened in some areas.
– The proportion of adults reporting high levels of psychological distress increased from 27 per cent in 2004-05 to 33 per cent in 2014-15, and hospitalisations for self-harm increased by 56 per cent over this period.
– The proportion of adults reporting substance misuse in the previous 12 months increased from 23 per cent in 2002 to 31 per cent in 2014-15.
– The adult imprisonment rate increased 77 per cent between 2000 and 2015, and whilst the juvenile detention rate has decreased it is still 24 times the rate for non-Indigenous youth.
Change over time cannot be assessed for all the indicators — some indicators have no trend data; some indicators report on service use, and change over time might be due to changing access rather than changes in the underlying outcome; and some indicators have related measures that moved in different directions.
Finally, data alone cannot tell the complete story about the wellbeing of Aboriginal and Torres Strait Islander Australians, nor can it fully tell us why outcomes improve (or not) in different areas. To support the indicator reporting, case studies of ‘things that work’ are included in this report (a subset in this Overview). However, the relatively small number of case studies included reflects a lack of rigorously evaluated programs in the Indigenous policy area.
xxx OVERCOMING INDIGENOUS DISADVANTAGE 2016


