Page 1
PREPARATION AND CHARACTERIZATION OF
LANTHANUM OXIDE DOPED BARIUM STRONTIUM
TITANATE PARAELECTRIC GLASS CERAMICS
Swonal Sitam Das
Department of Ceramic Engineering National Institute of Technology, Rourkela
Rourkela - 769008, India
Page 2
PREPARATION AND CHARACTERIZATION OF
LANTHANUM OXIDE DOPED BARIUM STRONTIUM
TITANATE PARAELECTRIC GLASS CERAMICS
Dissertation submitted in
June 2015
To the department of
Ceramic Engineering
Of
National Institute of Technology, Rourkela
In partial fulfilment of the requirements
for the degree of
Bachelor of Technology
By
Swonsl Sitam Das
(Roll 111CR0585)
Under the supervision of
Prof. Partha Saha
Department of Ceramic Engineering National Institute of Technology, Rourkela
Rourkela - 769008, India
Page 4
ACKNOWLEDGEMENT
I would like to express my sincere and profound gratitude to the faculty advisor Dr.
Partha Saha, Assistant Professor, National Institute of Technology, Rourkela for his inspiring
guidance, sharing his experience and knowledge and exemplary perseverance and hospitality.
This work would have been a difficult task to complete without profiting from his expertise,
encouragement, valuable time and constructive criticisms. I would like to admit my deep sense
of gratitude to Prof. Swadesh Kumar Pratihar, Head of the Department for his constructive
suggestions and valuable time throughout the work. I would like to convey my sincere gratitude
to all the faculty members for their throughout support during four years of my engineering
life. I would also like express my sincere gratitude to Prof. Ranabarata Mazumder for extending
the facilities of dielectric measurements for completing the project in a timely manner.
I would express my gratitude to Mr. A. Kumar, Mr. P. K. Mohanty for their
encouragement and never ending support during laboratory work.
I would also like to convey my thanks to my batch mates Abhijit, Chinmay, Manali,
Bijay and Abhinash for their support, help and cheerful company during the project work.
Finally, I would like to like to express my heart-felt gratitude to my father Mr. Swadesh
Kumar Das and my sister Ms. Swati Sanita Das for being by my side during difficulties. Their
loving support has been and shall always will be my most precious possession on earth.
Page 5
CONTENTS
LIST OF TABLES ..................................................................................................................... 1
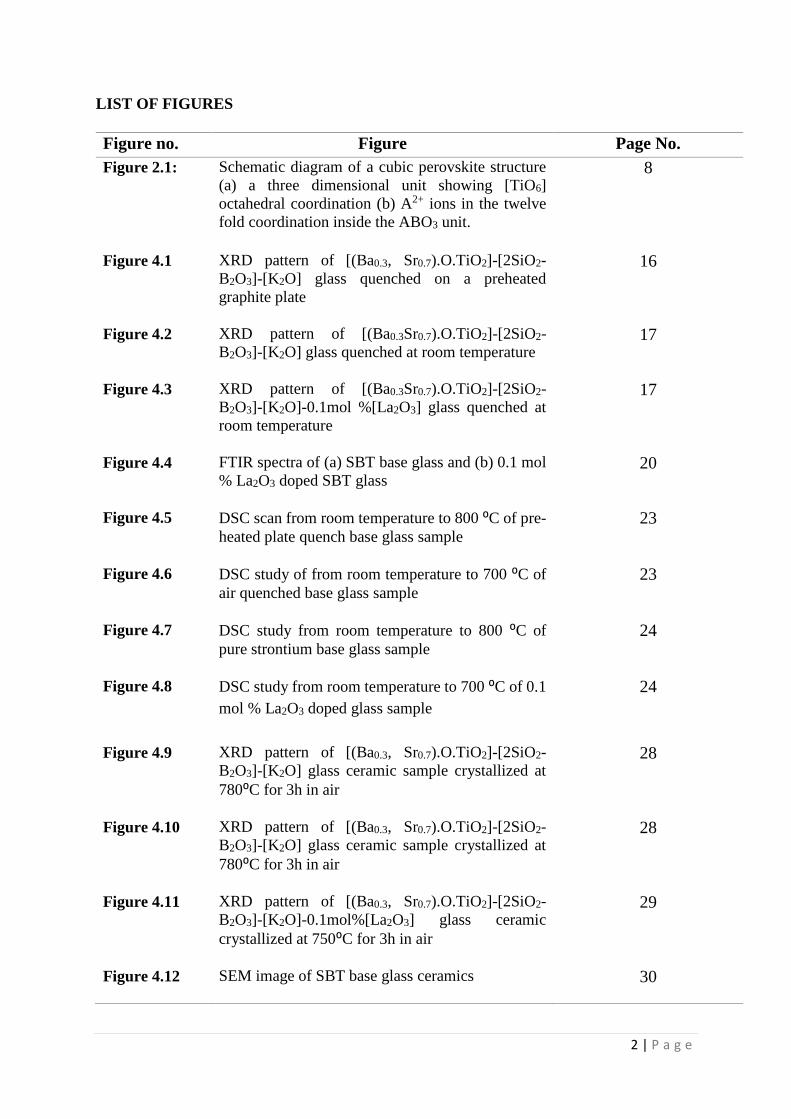
LIST OF FIGURES ................................................................................................................... 2
ABSTRACT………………………………………………………………………………….. 4
1 INTRODUCTION .................................................................................................................... 5
2 LITERATURE REVIEW AND OBJECTIVES OF PRESENT WORK ................................... 7
3 EXPERIMENTAL PROCEDURE…………………………………………………………….. 11
GLASS FORMATION AND CERAMIZATION ...................................................... 11
DIFFERENTIAL SCANNING CALORIMETERY (DSC) STUDY………….. 13
DENSITY MEASUREMENT .............................................................................. 14
PHASE ANALYSIS USING X-RAY DIFFRACTION………………………... 14
FOURIER TRANSFORM INFRARED SPECTROSCOPY (FTIR) STUDY… 14
FIELD EMISSION SCANNING ELECTRON MICROSCOPE STUDY……,.. 15
DIELECTRIC MEASUREMENT ........................................................................ 15
4 RESULTS AND DISCUSSION ............................................................................................... 16
PHASE ANALYSIS OF GLASS SAMPLES…………………………………...….. 16
FTIR SPECTRA OF GLASS SAMPLES…………………………………………… 17
DSC STUDY OF GLASS SAMPLES………………………………………………. 20
DENSITY MEASUREMENT………………………………………………………. 24
PHASE ANALYSIS OF GLASS CERAMIC SAMPLES…………………………. 26
MICROSTURUTAL ANALYSIS OF GLASS CERAMIC SAMPLES…………… 29
DIELECTRIC ANALYSIS…………………………………………………………. 33
5 CONCLUSION ............................................................................................................................................. 38
6 REFERENCES ....................................................................................................................... 39
Page 6
1 | P a g e
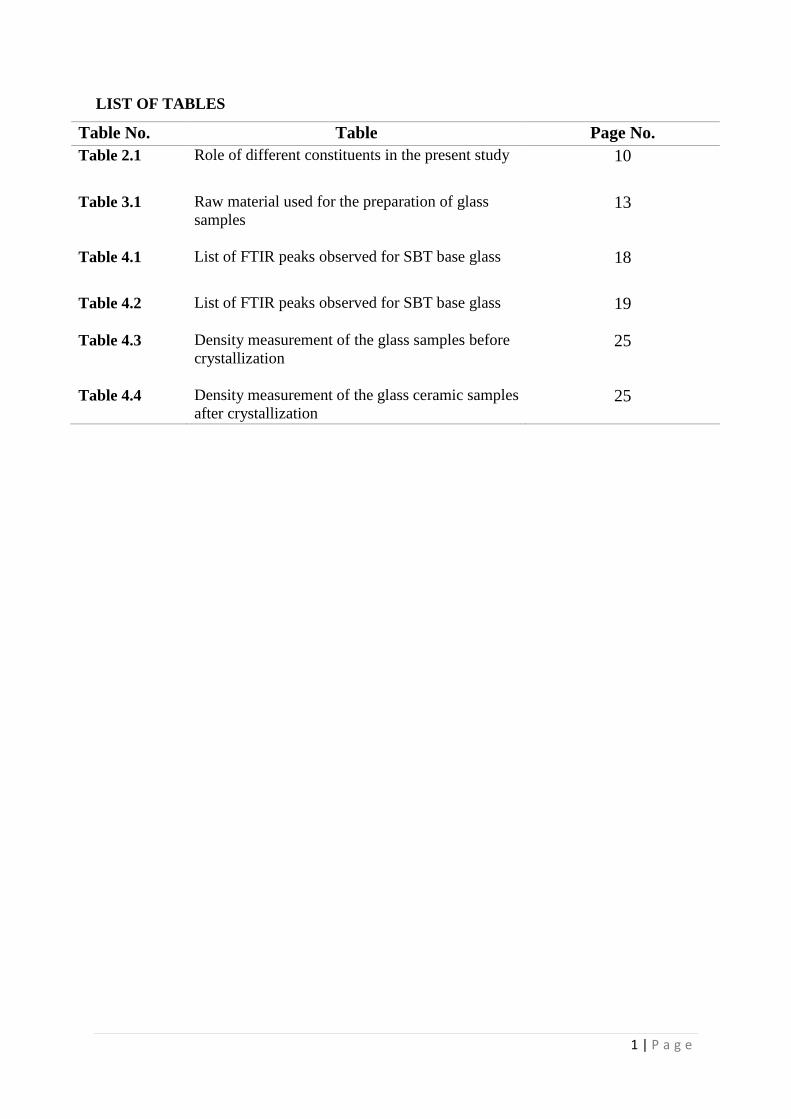
LIST OF TABLES
Table No. Table Page No.
Table 2.1 Role of different constituents in the present study 10
Table 3.1 Raw material used for the preparation of glass
samples
13
Table 4.1 List of FTIR peaks observed for SBT base glass
18
Table 4.2 List of FTIR peaks observed for SBT base glass
19
Table 4.3 Density measurement of the glass samples before
crystallization
25
Table 4.4 Density measurement of the glass ceramic samples
after crystallization 25
Page 7
2 | P a g e
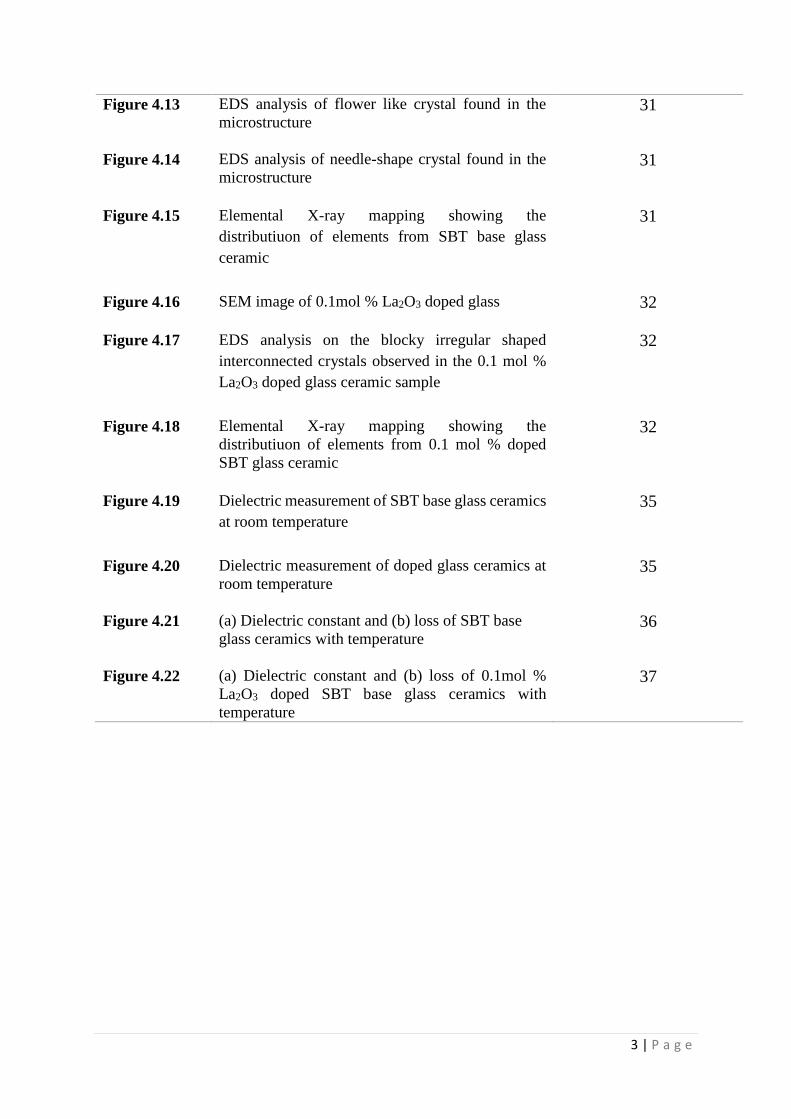
LIST OF FIGURES
Figure no. Figure Page No.
Figure 2.1: Schematic diagram of a cubic perovskite structure
(a) a three dimensional unit showing [TiO6]
octahedral coordination (b) A2+ ions in the twelve
fold coordination inside the ABO3 unit.
8
Figure 4.1 XRD pattern of [(Ba0.3, Sr0.7).O.TiO2]-[2SiO2-
B2O3]-[K2O] glass quenched on a preheated
graphite plate
16
Figure 4.2 XRD pattern of [(Ba0.3Sr0.7).O.TiO2]-[2SiO2-
B2O3]-[K2O] glass quenched at room temperature
17
Figure 4.3 XRD pattern of [(Ba0.3Sr0.7).O.TiO2]-[2SiO2-
B2O3]-[K2O]-0.1mol %[La2O3] glass quenched at
room temperature
17
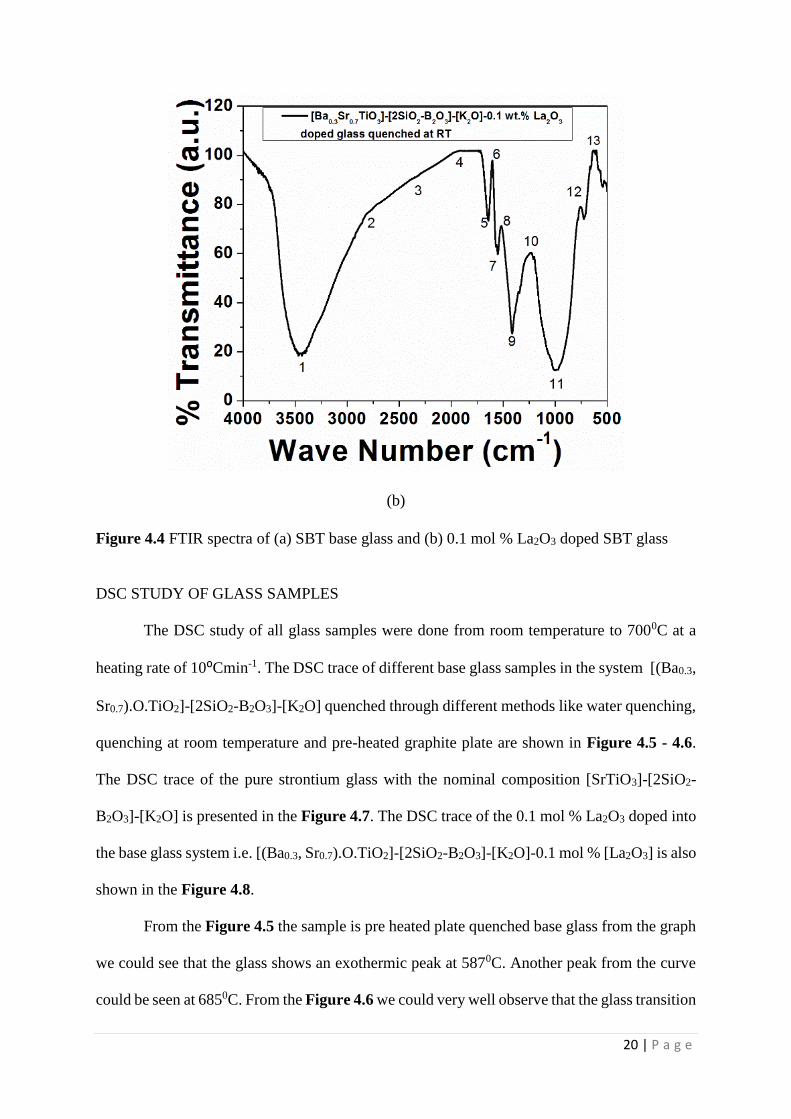
Figure 4.4 FTIR spectra of (a) SBT base glass and (b) 0.1 mol
% La2O3 doped SBT glass
20
Figure 4.5 DSC scan from room temperature to 800 ⁰C of pre-
heated plate quench base glass sample
23
Figure 4.6 DSC study of from room temperature to 700 ⁰C of
air quenched base glass sample
23
Figure 4.7 DSC study from room temperature to 800 ⁰C of
pure strontium base glass sample
24
Figure 4.8 DSC study from room temperature to 700 ⁰C of 0.1
mol % La2O3 doped glass sample
24
Figure 4.9 XRD pattern of [(Ba0.3, Sr0.7).O.TiO2]-[2SiO2-
B2O3]-[K2O] glass ceramic sample crystallized at
780⁰C for 3h in air
28
Figure 4.10 XRD pattern of [(Ba0.3, Sr0.7).O.TiO2]-[2SiO2-
B2O3]-[K2O] glass ceramic sample crystallized at
780⁰C for 3h in air
28
Figure 4.11 XRD pattern of [(Ba0.3, Sr0.7).O.TiO2]-[2SiO2-
B2O3]-[K2O]-0.1mol%[La2O3] glass ceramic
crystallized at 750⁰C for 3h in air
29
Figure 4.12 SEM image of SBT base glass ceramics 30
Page 8
3 | P a g e
Figure 4.13 EDS analysis of flower like crystal found in the
microstructure
31
Figure 4.14 EDS analysis of needle-shape crystal found in the
microstructure
31
Figure 4.15 Elemental X-ray mapping showing the
distributiuon of elements from SBT base glass
ceramic
31
Figure 4.16 SEM image of 0.1mol % La2O3 doped glass
32
Figure 4.17 EDS analysis on the blocky irregular shaped
interconnected crystals observed in the 0.1 mol %
La2O3 doped glass ceramic sample
32
Figure 4.18 Elemental X-ray mapping showing the
distributiuon of elements from 0.1 mol % doped
SBT glass ceramic
32
Figure 4.19 Dielectric measurement of SBT base glass ceramics
at room temperature
35
Figure 4.20 Dielectric measurement of doped glass ceramics at
room temperature
35
Figure 4.21 (a) Dielectric constant and (b) loss of SBT base
glass ceramics with temperature
36
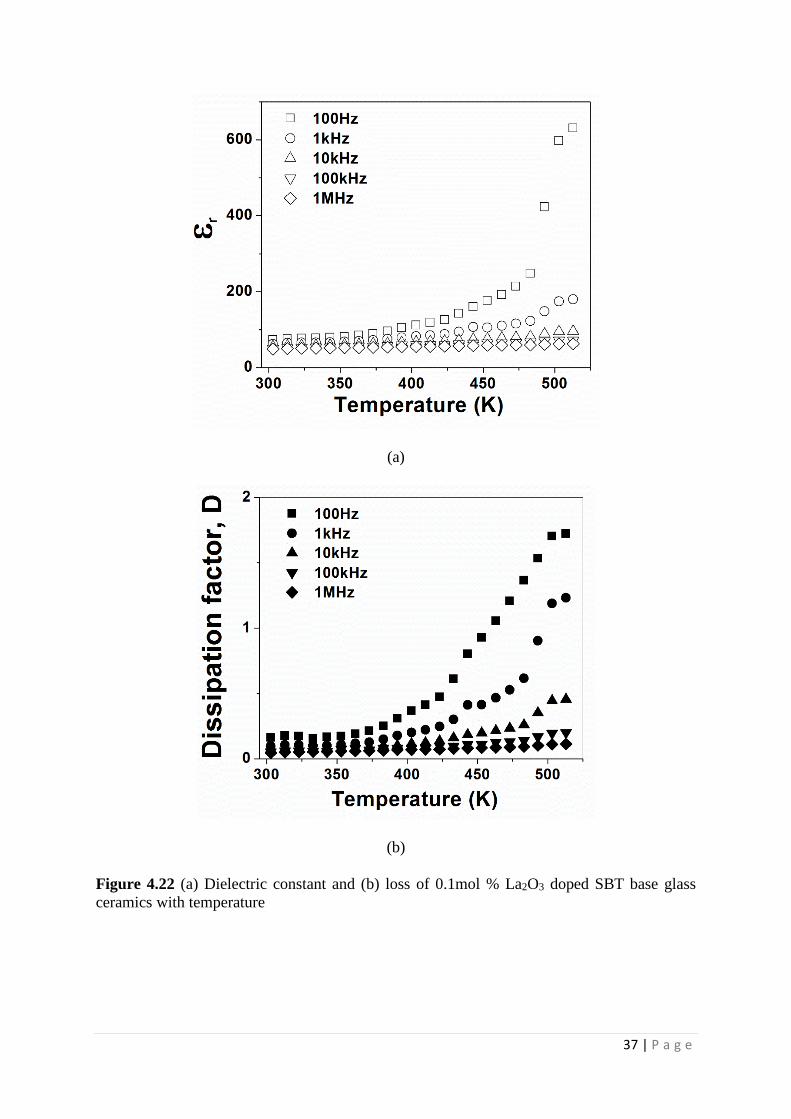
Figure 4.22 (a) Dielectric constant and (b) loss of 0.1mol %
La2O3 doped SBT base glass ceramics with
temperature
37
Page 9
4 | P a g e
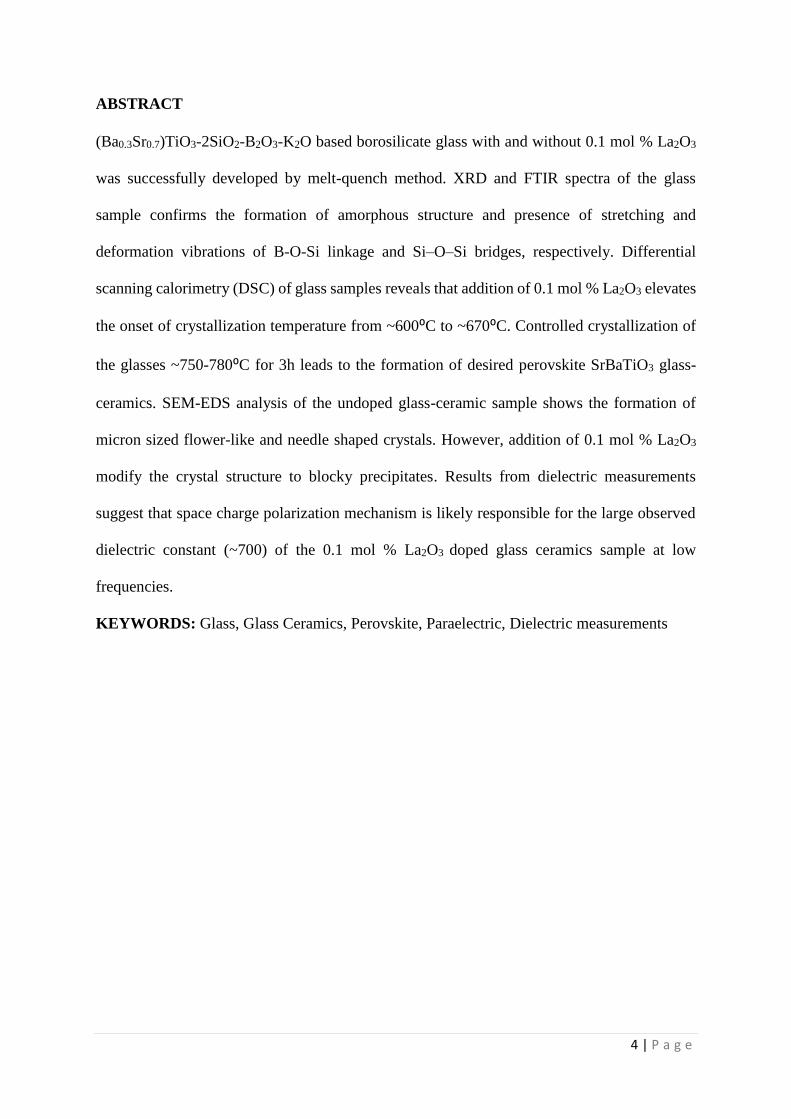
ABSTRACT
(Ba0.3Sr0.7)TiO3-2SiO2-B2O3-K2O based borosilicate glass with and without 0.1 mol % La2O3
was successfully developed by melt-quench method. XRD and FTIR spectra of the glass
sample confirms the formation of amorphous structure and presence of stretching and
deformation vibrations of B-O-Si linkage and Si–O–Si bridges, respectively. Differential
scanning calorimetry (DSC) of glass samples reveals that addition of 0.1 mol % La2O3 elevates
the onset of crystallization temperature from ~600⁰C to ~670⁰C. Controlled crystallization of
the glasses ~750-780⁰C for 3h leads to the formation of desired perovskite SrBaTiO3 glass-
ceramics. SEM-EDS analysis of the undoped glass-ceramic sample shows the formation of
micron sized flower-like and needle shaped crystals. However, addition of 0.1 mol % La2O3
modify the crystal structure to blocky precipitates. Results from dielectric measurements
suggest that space charge polarization mechanism is likely responsible for the large observed
dielectric constant (~700) of the 0.1 mol % La2O3 doped glass ceramics sample at low
frequencies.
KEYWORDS: Glass, Glass Ceramics, Perovskite, Paraelectric, Dielectric measurements
Page 10
5 | P a g e
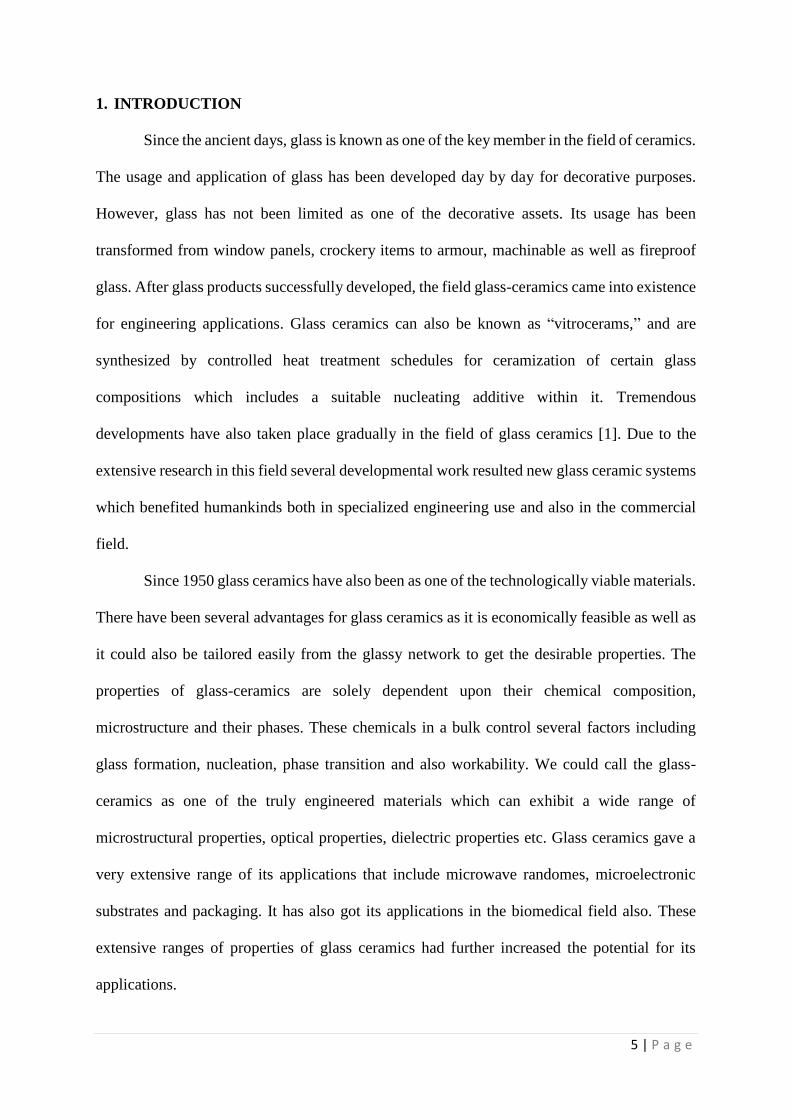
1. INTRODUCTION
Since the ancient days, glass is known as one of the key member in the field of ceramics.
The usage and application of glass has been developed day by day for decorative purposes.
However, glass has not been limited as one of the decorative assets. Its usage has been
transformed from window panels, crockery items to armour, machinable as well as fireproof
glass. After glass products successfully developed, the field glass-ceramics came into existence
for engineering applications. Glass ceramics can also be known as “vitrocerams,” and are
synthesized by controlled heat treatment schedules for ceramization of certain glass
compositions which includes a suitable nucleating additive within it. Tremendous
developments have also taken place gradually in the field of glass ceramics [1]. Due to the
extensive research in this field several developmental work resulted new glass ceramic systems
which benefited humankinds both in specialized engineering use and also in the commercial
field.
Since 1950 glass ceramics have also been as one of the technologically viable materials.
There have been several advantages for glass ceramics as it is economically feasible as well as
it could also be tailored easily from the glassy network to get the desirable properties. The
properties of glass-ceramics are solely dependent upon their chemical composition,
microstructure and their phases. These chemicals in a bulk control several factors including
glass formation, nucleation, phase transition and also workability. We could call the glass-
ceramics as one of the truly engineered materials which can exhibit a wide range of
microstructural properties, optical properties, dielectric properties etc. Glass ceramics gave a
very extensive range of its applications that include microwave randomes, microelectronic
substrates and packaging. It has also got its applications in the biomedical field also. These
extensive ranges of properties of glass ceramics had further increased the potential for its
applications.
Page 11
6 | P a g e
Glass ceramics are known to be the polycrystalline solids which can be synthesized
through controlled ceramization of the glass samples. The crystallization of glass samples can
be successfully done subjecting the glass samples undergo the appropriate heat treatment
schedules. This results in the nucleation and growth of the crystal phases within the glass
sample.
There are several advantages of glass ceramics-
• Through glass-forming technique it can be produced in mass.
• Specific nanostructure or microstructure is possible to design for a specific application.
• Porosity is zero or negligible.
• It is possible for to combine a variety of desired properties.
However, some amount of residual glass is observed in many cases even though crystallization
process is taken to completion. It could be easily distinguished from glass as glasses are
amorphous and non-crystalline in nature.
Glass ceramics can be produced through different techniques or routes. One of it is it could be
prepared through bulk crystallization method. In this process melted glass is casted to an
appropriate shape. It is then given a regulated heat treatment schedule and is kept at that
temperature for some time to nucleate and grow crystals to get the desired degree of
crystallinity.
The other method is sintering and crystallization of glass powder. In this method the glass
powder is sintered and due to low eutectics some of the phases forms liquid at low temperature
it seals the pores and developed a complex structure. However there are some drawbacks some
of the phases gets crystallized and if the surface gets crystallized then the surface is pore free
but the inner parts have some pores and are not pore free.
Page 12
7 | P a g e
2. LITERATURE REVIEW
Barium Strontium Titanate (BST) glass ceramics is considered to be one of the potential
ferroelectric glass ceramic for having high energy density dielectric materials. Previously it
was found that the dielectric constant of these samples were approximately 1000 having the
dielectric breakdown strength 800kV/cm. For the overall increase of the energy density refining
agents were added to the melt. The rate of nucleation and growth of the grain is also taken into
consideration while measuring the dielectric parameters. Hence the crystallization kinetics of
the glass ceramic particles were studied properly to understand fully the role of the required
BST phase and which phase can result in the increment of the energy density of the sample. A
decrease in grain size will result in more grain boundaries. The defects existed at the grain
boundary accelerates the thermally activated motions of defects which leads to an increase in
the activation energy (which is higher than the conventionally synthesized powder ceramics).
The ratio of Ba2+/Sr2+ also plays a very important role in the phase formation as well as
measurement of the dielectric parameters also. If the glass gets rich with Sr2+ then the sample
shows paraelectric properties. And if the glass sample is rich in Ba2+ then the sample shows
ferroelectric properties. Hence that the Sr2+/Ba2+ ratio has an enormous influence on
microstructures, energy storage properties and dielectric relaxation behaviours of BST glass
ceramics. It could also be observed that La2O3 additive alters slightly the dielectric constant
but it significantly changes the microstructure of the glass ceramics and this resulted in
improvising the break down strength (BDS). Addition of La2O3 also increases optimized
energy storage density as it could be observed when addition of 1.0 wt% La2O3 increases the
energy storage density by~2.5 times higher than the pure BST glass ceramics. Hence it could
be concluded that the dielectric properties gets improved with the addition of the refining
agents and preference of glass ceramic samples will increase the activation energy [2].
Page 13
8 | P a g e
PEROVSKITE STRUCTURE
The perovskites structural family includes a large family of compounds those are
having their crystal structures related to the mineral perovskite for example BaTiO3. One of
the ideal form of crystal structure is cubic. ABO3 perovskite can be portrayed as comprising of
corner sharing [BO6] octahedral with the A cation possessing the 12-fold coordination site
formed in the middle of the cube of eight such octahedral. The mineral perovskite gets modified
to some extent [4].
a) b)
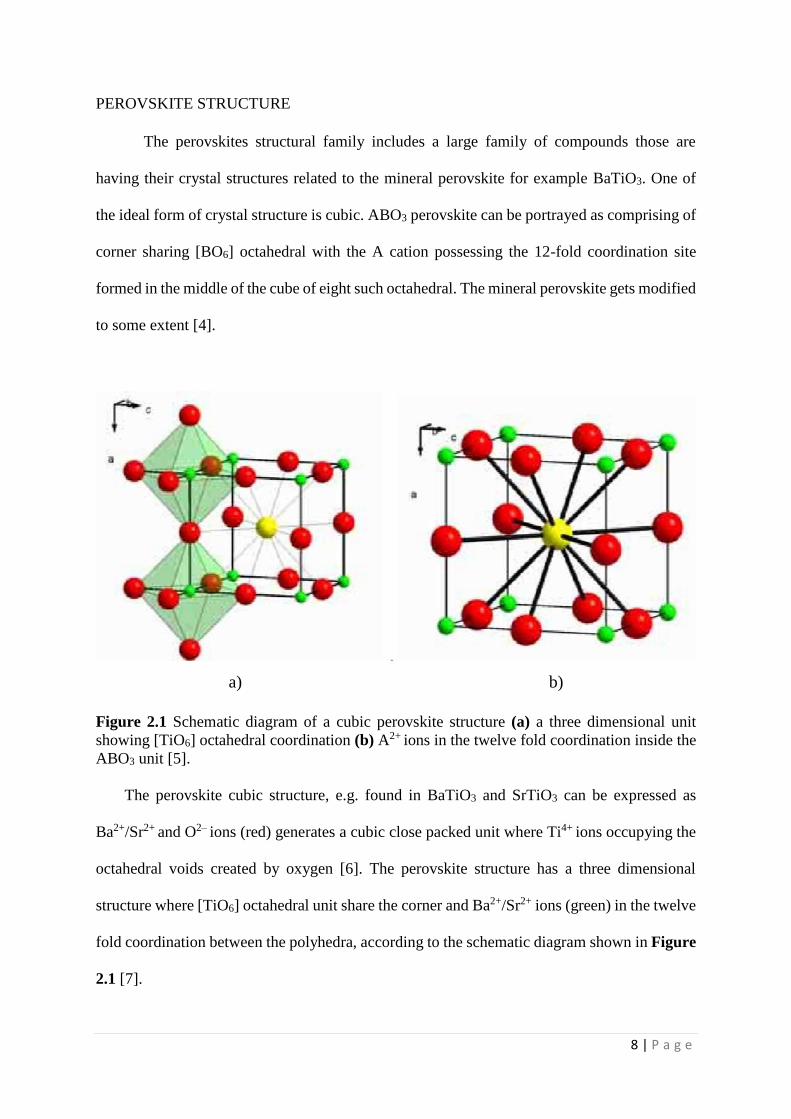
Figure 2.1 Schematic diagram of a cubic perovskite structure (a) a three dimensional unit
showing [TiO6] octahedral coordination (b) A2+ ions in the twelve fold coordination inside the
ABO3 unit [5].
The perovskite cubic structure, e.g. found in BaTiO3 and SrTiO3 can be expressed as
Ba2+/Sr2+ and O2– ions (red) generates a cubic close packed unit where Ti4+ ions occupying the
octahedral voids created by oxygen [6]. The perovskite structure has a three dimensional
structure where [TiO6] octahedral unit share the corner and Ba2+/Sr2+ ions (green) in the twelve
fold coordination between the polyhedra, according to the schematic diagram shown in Figure
2.1 [7].
Page 14
9 | P a g e
FERRO ELECTRIC GLASS CERAMICS
The theory of ferroelectric nature of glass ceramic samples are proven to be invaluable.
The theory of electrical “aligning” or “poling” procedure can be identified correctly as the key
to turn an inert ceramic into an electro mechanically active material have a lots of commercial
uses. This can be called as one of the most unforeseen discovery, because of the prevailing
opinion that ceramics can never be counted as the piezo-electric material, because the sintered
and randomly oriented crystallites on the whole would, cancel out each other [3].
The oxidation state of ferroelectric materials strongly influences their performance in
capacitors. Oxygen removal from the crystal lattice decreases the electrical resistivity of the
material and makes it electrically conducting. There might be a chance of failure of the material
by electrical breakdown when exposed to an operating temperature of 50-200⁰C and/or to DC
electric fields exceeding of 10 volts/cm.
Oxygen loss from the perovskite lattice of ferroelectric materials usually takes place during
the preparation of the material. The range of temperature for its preparation is 1100-1500⁰C.
where oxygen’s partial pressure is relatively high which results in the loss of oxygen. This loss
of oxygen can be corrected by firing and slow cooling in an oxidizing atmosphere. Oxygen can
have direct access into the interior of the material through the pores present in the sintered
material facilitating the oxidation process. Partial crystallization of a homogeneous glass which
are non-porous in nature have a considerable advantage that it provides a material of high
dielectric constant and high dielectric breakdown strength, as well as other desirable electrical
characteristics.
La2O3 DOPANT ROLE IN Sr1-×Ba×TiO3 SYSTEM
Lanthanum oxide acts as a nucleating agent for crystallization of glass ceramics this can
be observed by the crystallization of doped glass takes place at low temperature compared to
the plain glass and this enhances the value of dielectric constant. These glass ceramics can be
Page 15
10 | P a g e
used in making capacitors for high energy storage. This addition of La2O3 in barium strontium
titanate glass ceramics may further increases the value of energy density. In the modification
of tetragonality of barium strontium titanate phase lanthanum ions plays an important role as it
gets diffused into the structure.
In La2O3-doped barium titanate ceramics the La3+ ions replaces the Ba2+ cations in the
A sites as La3+ ions are too large for the B sites where Ti4+ ions are present so as a result the
charge is not balanced which is compensated by the cation vacancies on the A- or B-sites [8].
In addition of direct donor dopant, specifically of low donor concentration, the charge
compensation mechanism and the semi-conductive characteristics were observed [9].
SEM analysis indicated that La2O3 additive decreases the average crystallite size. There is
a significant mismatch of the peaks when the La2O3 concentration is 0.5 mol%. These peaks
also gets separated for 1.0 mol% La2O3 addition obviously. With increasing La2O3
concentration, the crystallite impedance gets lowered, while a larger impedance can be
observed for the partially crystallized glass interface. The blocking factor of the partially
crystallized glass interface with the increase in the concentration of the dopant La2O3. As a
result the activation energy decreases only for the crystallite whereas increases for the partially
crystallized glass [10].
ROLES OF DIFFERENT CONSTITUENTS
Table 2.1 Role of different phases in the present study
Phases Role of phases
(BaSr)TiO3 Forms dielectric phase
SiO2-B2O3 Glass former
K2O Glass intermediate
La2O3 Acts as dopant
Page 16
11 | P a g e
OBJECTIVE
1. Prepare (Ba0.3Sr0.7) TiO3 based borosilicate and 0.1 mol % La2O3 doped borosilicate
glass.
2. Identify the bonding modes of different constituents of the glass forming species with
the help of FTIR.
3. Formation of perovskite glass ceramics by thermal treatment or control crystallization
according to the DSC study.
4. Microstructural analysis and identify the different phases using X-ray diffraction
analysis.
5. Determine the density of both glass and glass ceramic samples.
6. Microstructural analysis of glass ceramic samples through SEM/EDS and X-ray
elemental mapping.
7. Study the dielectric behaviour and dissipation factor of glass ceramic samples as a
function of frequency and temperature.
3. EXPERIMENTAL PROCEDURE
PREPARATION OF [(Ba0.3, Sr0.7).O.TiO2]-[2SiO2-B2O3]-[K2O] (SBT) BASE GLASS
The composition of base glass was [(Ba0.3, Sr0.7).O.TiO2]-[2SiO2-B2O3]-[K2O]. The
batch was prepared by mixing the stoichiometric amount of chemicals listed in Table 3.1 with
the help of acetone as mixing media (for homogenous mixing). Two batches of the glass, 75gm
each were made. The glass samples were prepared by melt quench method. The raw materials
were mixed in an agate mortar and melted in a platinum crucible at 13500C inside a pit furnace.
The liquid melt was quenched either on a pre-heated graphite plate or quenched onto a steel
plate at room temperature.
Page 17
12 | P a g e
PREPARATION OF 0.1 mol% La2O3 DOPED [(Ba0.3, Sr0.7).O.TiO2]-[2SiO2-B2O3]-[K2O]
(SBT) GLASS
The composition of base glass was [(Ba0.3, Sr0.7).O.TiO2]-[2SiO2-B2O3]-[K2O]-
0.1[La2O3]. The batch was prepared by mixing the compounds with the help of acetone mixing
media (for homogenous mixing). This time only one batch of the glass, 75gm was made. The
batch of glass is prepared by following the process of melt quench method. The temperature at
which the molten glass is taken out of the furnace and casted is 13500C. The step followed here
is the molten glass is quenched directly to the room temperature. The temperature raising in
the furnace is pre calculated which includes a soaking time of 1hr at 13500C. This method is
followed to make the glass homogenously melted. After the glass sample is collected then
different characterizations were done.
GLASS FORMATION
The glass is made by melt quenching process where the components of glass is poured
into an alumina crucible. The entire glass sample was poured into it and was heated from the
room temperature. The heat treatment schedule followed here it pre-calculated. The furnace in
which the glass was melted is known to be raising hearth furnace. The temperature at which
we take the glass samples out of the furnace is 1350°C. After melting of the glass sample the
glass is annealed for approximately 45 minutes and then annealing is done in order to remove
the stress from the glass. The annealing should be done at lower temperature. The sample is
collected after being cooled. Appropriate precautions should be taken while transferring the
molten glass at 13500C and care should also be taken while opening the furnace at 13500C so
that the refractory in the furnace should not get damaged due to thermal shock resistance.
Page 18
13 | P a g e
Table 3.1: Raw material used for the preparation of glass samples
Sl. No. Compound
Name
Percentage Purity Company
Name
1 SiO2 99.8 % TRL Belpahar
2 BaCO3 97 % Merck
3 K2CO3 99.9 % Merck
4 H3BO3 99.5 % Merck
5 TiO2 ≥ 99 % Merck
6 La2O3 99.9 % Lova Chemie
7 SrCO3 99 % S.D. Fine
chemical Ltd.
PREPARATION OF GLASS CERAMICS
After the glass samples were collected some part of the sample is grounded into powder.
Then the glass powder is characterized through Differential Thermal Calorimeter (DSC). The
information we get from the DSC curve is the Tg (glass transition temperature), TC1 and TC2
(where TC1 and TC2 are crystallization temperature). Depending upon the information we get
from the DSC curve glass ceramization procedure is followed by further heat treatment method.
The samples were kept on an alumina base plate and according to the respective temperatures
the samples were heat treated. These samples were heat treated on the basis of the heat
treatment schedule.
DIFFERENTIAL SCANNING CALORIMETERY (DSC) STUDY
Differential Scanning Calorimetry, DSC, is the next step to be followed. For the study
of the DSC a small part of the sample is taken and is grounded to very fine powders. The sample
is now ready for the Differential Scanning Calorimetry (DSC). The powdered sample weighing
approximately 100mg is now poured into the alumina crucible with the help of tweezer and
spatula. The crucible is now loaded into the DSC equipment (Netzsch, Germany,
STA449C/4/MFC/G) and the measurements were taken from room temperature to 7000C with
a heating rate of 100Cmin-1. For glasses, the onset of glass transition can be estimated from the
DSC thermogram which shows an endothermic signal while crystallization event exhibits an
Page 19
14 | P a g e
exothermic signal. The DSC also gives the onset of crystallization temperature (Tx) and the
crystallization temperature through the exothermic peaks.
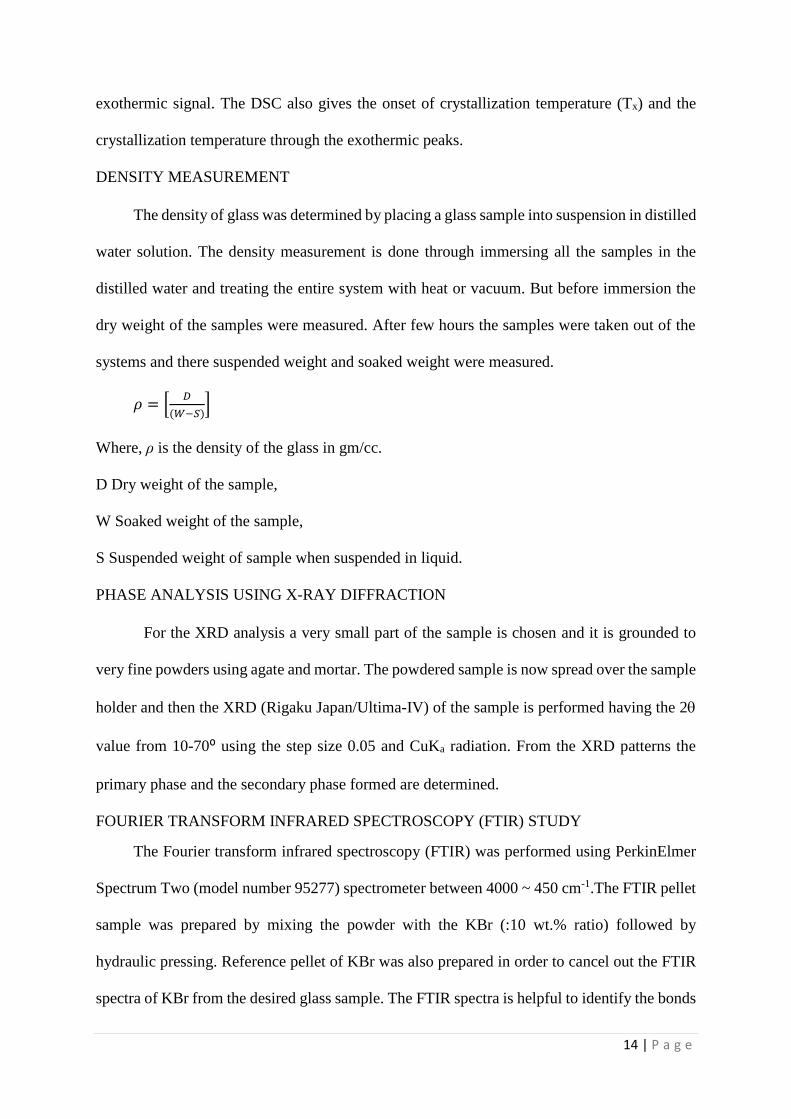
DENSITY MEASUREMENT
The density of glass was determined by placing a glass sample into suspension in distilled
water solution. The density measurement is done through immersing all the samples in the
distilled water and treating the entire system with heat or vacuum. But before immersion the
dry weight of the samples were measured. After few hours the samples were taken out of the
systems and there suspended weight and soaked weight were measured.
𝜌 = [𝐷
(𝑊−𝑆)]
Where, ρ is the density of the glass in gm/cc.
D Dry weight of the sample,
W Soaked weight of the sample,
S Suspended weight of sample when suspended in liquid.
PHASE ANALYSIS USING X-RAY DIFFRACTION
For the XRD analysis a very small part of the sample is chosen and it is grounded to
very fine powders using agate and mortar. The powdered sample is now spread over the sample
holder and then the XRD (Rigaku Japan/Ultima-IV) of the sample is performed having the 2
value from 10-70⁰ using the step size 0.05 and CuKa radiation. From the XRD patterns the
primary phase and the secondary phase formed are determined.
FOURIER TRANSFORM INFRARED SPECTROSCOPY (FTIR) STUDY
The Fourier transform infrared spectroscopy (FTIR) was performed using PerkinElmer
Spectrum Two (model number 95277) spectrometer between 4000 ~ 450 cm-1.The FTIR pellet
sample was prepared by mixing the powder with the KBr (:10 wt.% ratio) followed by
hydraulic pressing. Reference pellet of KBr was also prepared in order to cancel out the FTIR
spectra of KBr from the desired glass sample. The FTIR spectra is helpful to identify the bonds
Page 20
15 | P a g e
present in the glass. The FTIR peaks present in the scan due to the different stretching and
relaxation of the bonds present in the glass. The model and serial number of the equipment
used is instrument model spectrum two instrument serial number 95277.
FIELD EMISSION SCANNING ELECTRON MICROSCOPE (FESEM) STUDY
Prior to FESEM the samples were properly polished using sand grit paper followed by
diamond polish in order to get the mirror-like finish on its surface. The samples were then gold
coated in order to avoid charging during FESEM study. Microstructural analysis of the glass
ceramic samples were performed at 30kV using a Field Emission Scanning Electron
Microscope (NOVA NanoSEM/FEI).
DIELECTRIC MEASUREMENT
The glass ceramic samples were made to desired shape. Ssurfaces of the glass ceramic
samples were polished using sand papers (grit 240, grit 320) followed by polishing using emery
paper (grit 600, grit 1200) and diamond paste (3m) on a lapped cloth to get a mirror-like
finish. The desired thickness of the sample should be ~1mm. The electrodes were made by
applying silver paste on both the surfaces of the samples. The samples were then cured at 6000C
for 1hour. The samples were now ready for the dielectric measurements. The dielectric
parameters like capacitance (C), dielectric loss or dissipation factor (tan or D) and
conductance (C) were measured as a function of frequency and temperature in a locally
fabricated platinum sample holder using a HIOKI 3532-50 LCR High Tester. The entire system
is prevented from any disturbances as it was shielded with metallic jacket. The measurements
were carried out in the frequency range 100Hz-1MHz and temperature range from 27-2500C.
Measurements were taken at an interval of 100C at steady temperatures.
Dielectric constant (r) was calculated from capacitance (C) using the relation;
r= C.t/ (0.A)
Page 21
16 | P a g e
Where C is capacitance, 0 is the permittivity of free space (0=8.854 X 10⁻¹² F/m), A and
t are area and thickness of the sample in square meter and meter respectively.
4. RESULTS AND DISCUSSION
PHASE ANALYSIS OF GLASS SAMPLES
SBT base glasses quenched through the techniques like pre-heated graphite plate and
air quenched were analysed. 0.1 mol % La2O3 doped SBT glass quenched in air is also
analysed. After the three glass samples were prepared a small part of it is grounded to fine
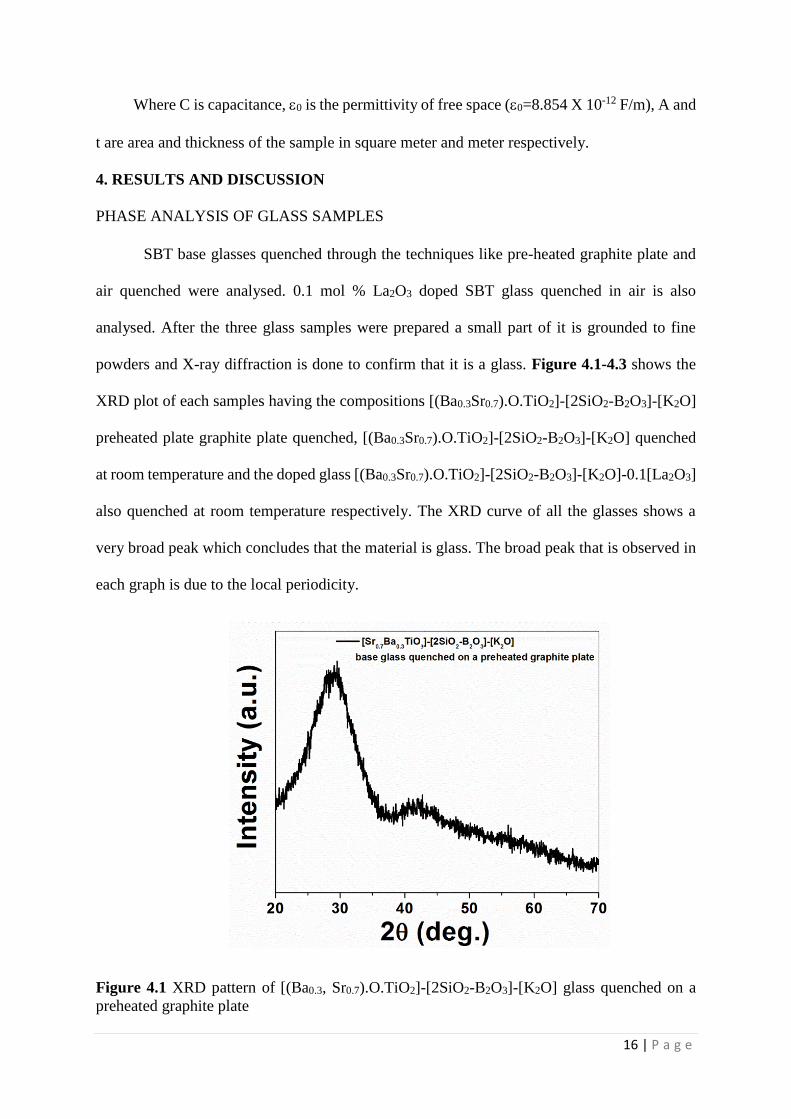
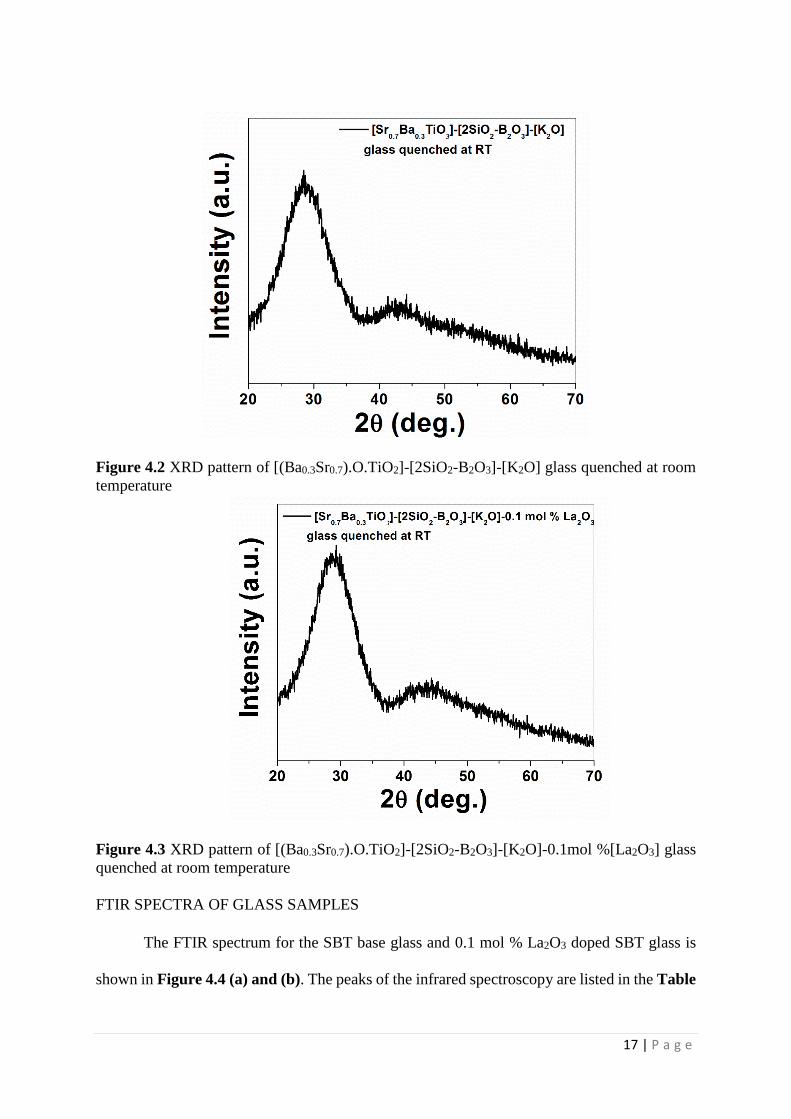
powders and X-ray diffraction is done to confirm that it is a glass. Figure 4.1-4.3 shows the
XRD plot of each samples having the compositions [(Ba0.3Sr0.7).O.TiO2]-[2SiO2-B2O3]-[K2O]
preheated plate graphite plate quenched, [(Ba0.3Sr0.7).O.TiO2]-[2SiO2-B2O3]-[K2O] quenched
at room temperature and the doped glass [(Ba0.3Sr0.7).O.TiO2]-[2SiO2-B2O3]-[K2O]-0.1[La2O3]
also quenched at room temperature respectively. The XRD curve of all the glasses shows a
very broad peak which concludes that the material is glass. The broad peak that is observed in
each graph is due to the local periodicity.
Figure 4.1 XRD pattern of [(Ba0.3, Sr0.7).O.TiO2]-[2SiO2-B2O3]-[K2O] glass quenched on a
preheated graphite plate
Page 22
17 | P a g e
Figure 4.2 XRD pattern of [(Ba0.3Sr0.7).O.TiO2]-[2SiO2-B2O3]-[K2O] glass quenched at room
temperature
Figure 4.3 XRD pattern of [(Ba0.3Sr0.7).O.TiO2]-[2SiO2-B2O3]-[K2O]-0.1mol %[La2O3] glass
quenched at room temperature
FTIR SPECTRA OF GLASS SAMPLES
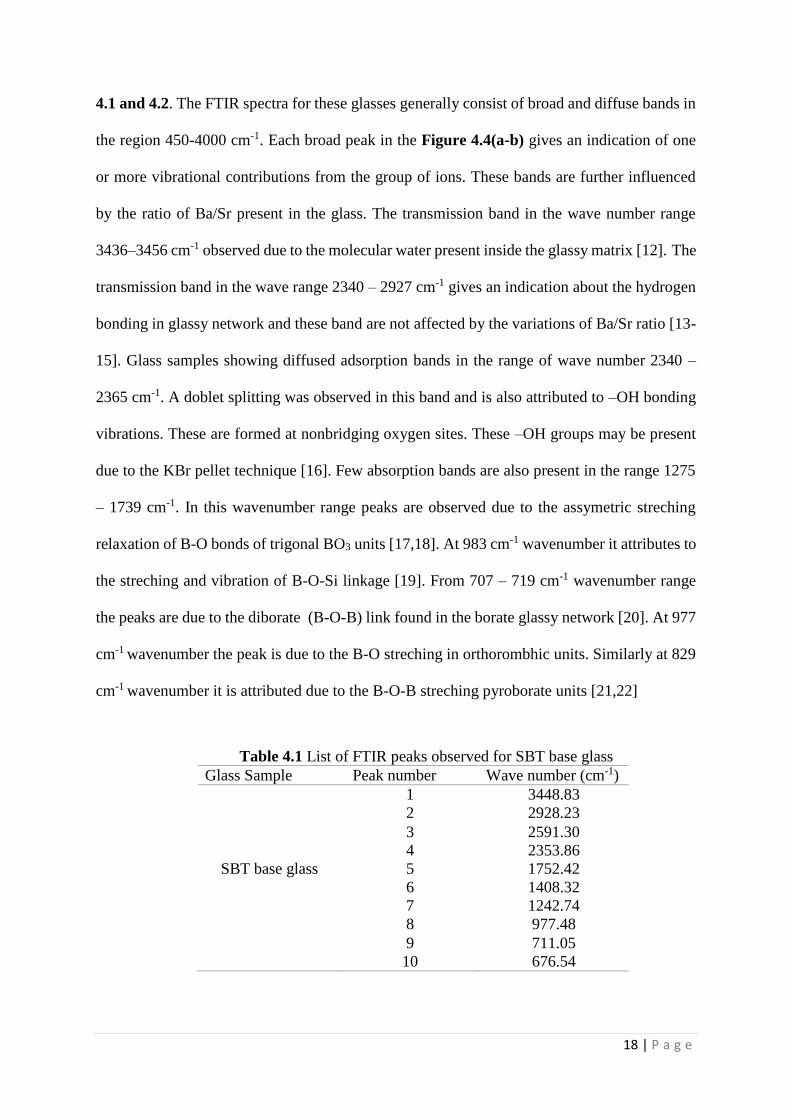
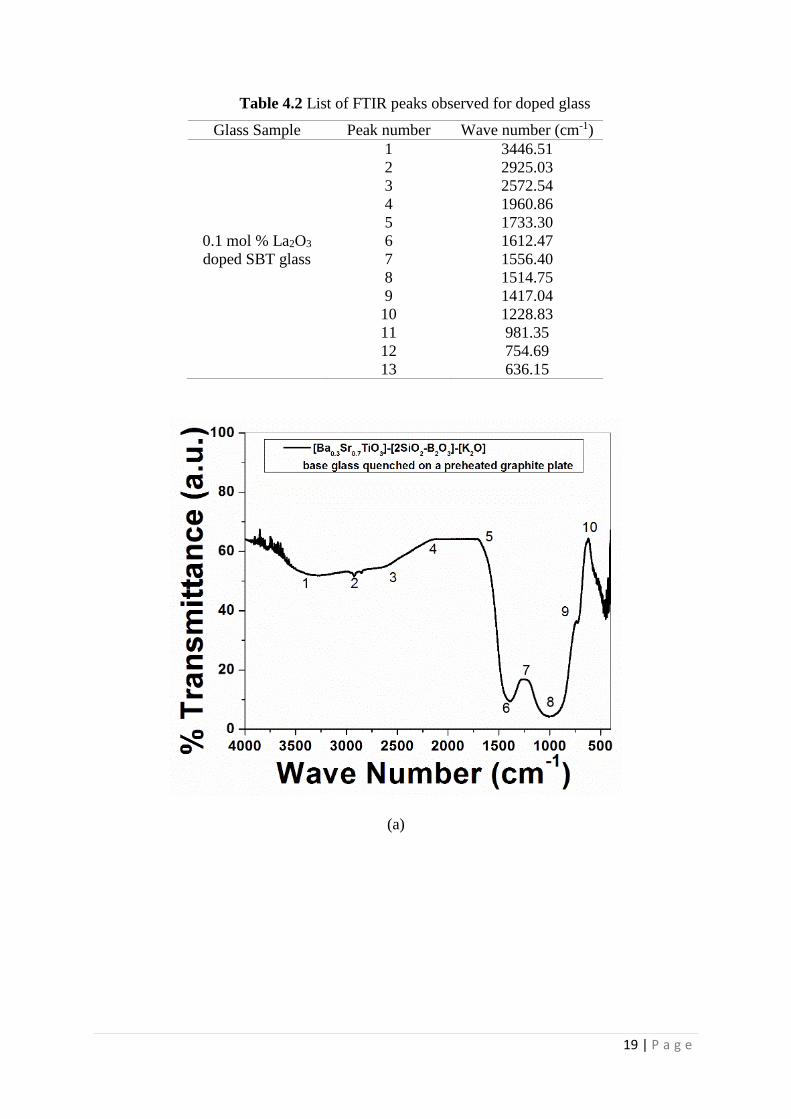
The FTIR spectrum for the SBT base glass and 0.1 mol % La2O3 doped SBT glass is
shown in Figure 4.4 (a) and (b). The peaks of the infrared spectroscopy are listed in the Table
Page 23
18 | P a g e
4.1 and 4.2. The FTIR spectra for these glasses generally consist of broad and diffuse bands in
the region 450-4000 cm-1. Each broad peak in the Figure 4.4(a-b) gives an indication of one
or more vibrational contributions from the group of ions. These bands are further influenced
by the ratio of Ba/Sr present in the glass. The transmission band in the wave number range
3436–3456 cm-1 observed due to the molecular water present inside the glassy matrix [12]. The
transmission band in the wave range 2340 – 2927 cm-1 gives an indication about the hydrogen
bonding in glassy network and these band are not affected by the variations of Ba/Sr ratio [13-
15]. Glass samples showing diffused adsorption bands in the range of wave number 2340 –
2365 cm-1. A doblet splitting was observed in this band and is also attributed to –OH bonding
vibrations. These are formed at nonbridging oxygen sites. These –OH groups may be present
due to the KBr pellet technique [16]. Few absorption bands are also present in the range 1275
– 1739 cm-1. In this wavenumber range peaks are observed due to the assymetric streching
relaxation of B-O bonds of trigonal BO3 units [17,18]. At 983 cm-1 wavenumber it attributes to
the streching and vibration of B-O-Si linkage [19]. From 707 – 719 cm-1 wavenumber range
the peaks are due to the diborate (B-O-B) link found in the borate glassy network [20]. At 977
cm-1 wavenumber the peak is due to the B-O streching in orthorombhic units. Similarly at 829
cm-1 wavenumber it is attributed due to the B-O-B streching pyroborate units [21,22]
Table 4.1 List of FTIR peaks observed for SBT base glass
Glass Sample Peak number Wave number (cm-1)
1 3448.83
2 2928.23
3 2591.30
4 2353.86
SBT base glass 5 1752.42
6 1408.32
7 1242.74
8 977.48
9 711.05
10 676.54
Page 24
19 | P a g e
Table 4.2 List of FTIR peaks observed for doped glass
(a)
Glass Sample Peak number Wave number (cm-1)
1 3446.51
2 2925.03
3 2572.54
4 1960.86
5 1733.30
0.1 mol % La2O3 6 1612.47
doped SBT glass 7 1556.40
8 1514.75
9 1417.04
10 1228.83
11 981.35
12 754.69
13 636.15
Page 25
20 | P a g e
(b)
Figure 4.4 FTIR spectra of (a) SBT base glass and (b) 0.1 mol % La2O3 doped SBT glass
DSC STUDY OF GLASS SAMPLES
The DSC study of all glass samples were done from room temperature to 7000C at a
heating rate of 10⁰Cmin-1. The DSC trace of different base glass samples in the system [(Ba0.3,
Sr0.7).O.TiO2]-[2SiO2-B2O3]-[K2O] quenched through different methods like water quenching,
quenching at room temperature and pre-heated graphite plate are shown in Figure 4.5 - 4.6.
The DSC trace of the pure strontium glass with the nominal composition [SrTiO3]-[2SiO2-
B2O3]-[K2O] is presented in the Figure 4.7. The DSC trace of the 0.1 mol % La2O3 doped into
the base glass system i.e. [(Ba0.3, Sr0.7).O.TiO2]-[2SiO2-B2O3]-[K2O]-0.1 mol % [La2O3] is also
shown in the Figure 4.8.
From the Figure 4.5 the sample is pre heated plate quenched base glass from the graph
we could see that the glass shows an exothermic peak at 5870C. Another peak from the curve
could be seen at 6850C. From the Figure 4.6 we could very well observe that the glass transition
Page 26
21 | P a g e
temperature (Tg) is 3250C. The onset of crystallization temperature is found to be around
4950C. So, a temperature between 4950C to 5870C is chosen for making of glass ceramics
because below 4950C no crystallization will be observed and after 5870C the entire sample will
be crystallized. As we require partial crystallization of glass where both glass and crystals will
be present and they show the respective properties. Increasing the dwelling time at
crystallization temperature will increase the crystal size. The onset of crystallization
temperature is mentioned to be Tx. the stability factor of a glass can be calculated from the
formula Tx-Tg. In preheated plate quenched base glass the stability factor is calculated to be
around 1700C.
From the Figure 4.7 the sample is air quenched base glass having the same glass system
as preheated plate quenched base glass. From the graph we could see that the glass shows a
peak at 5810C. From the Figure 4.7 we could very well observe that the glass transition
temperature (Tg) is 3300C. The onset of crystallization temperature is found to be around
5210C. So, a temperature between 5210C to 5810C is chosen for making of glass ceramics
because below 5210C no crystallization will be there and after 5810C the entire sample will be
crystallized. As we require partial crystallization of glass where both glass and crystals will be
present and they show the respective properties. Increasing the dwelling time at ceramization
temperature will increase the crystal size. The onset of crystallization temperature is mentioned
to be Tx. the stability factor of a glass can be calculated from the formula Tx-Tg. In preheated
plate quenched base glass the stability factor is calculated to be around 1910C.
From the Figure 4.8 the sample is pure strontium base glass from the graph we could
see that the glass shows only one peak at 5930C. From the Figure 4.8 we could very well
observe that the glass transition temperature (Tg) is 3250C. The onset of crystallization
temperature is found to be around 5750C. So, a temperature between 5750C to 5930C was
chosen for making of glass ceramics because below 5750C no crystallization will be there and
Page 27
22 | P a g e
after 5930C the entire sample will be crystallized. As it requires partial crystallization of glass
where both glass and crystals will be present and they show the respective properties.
Increasing the dwelling time at ceramization temperature will increase the crystal size. The
onset of crystallization temperature is mentioned to be Tx. the stability factor of a glass can be
calculated from the formula Tx-Tg. In preheated plate quenched base glass the stability factor
is calculated to be around 2500C.
From the Figure 4.9 the sample is 0.1 mol % La2O3 glass from the graph we could see
that the glass shows only one peak at 6010C. From the Figure 4.9 we could very well observe
that the glass transition temperature (Tg) is 3200C. The onset of crystallization temperature is
found to be around 5800C. So, a temperature between 5750C to 5930C is chosen for making of
glass ceramics because below 5800C no crystallization will be there and after 6010C the entire
sample will be crystallized. As it requires partial crystallization of glass where both glass and
crystals will be present and they show the respective properties. Increasing the dwelling time
at ceramization temperature will increase the crystal size. The onset of crystallization
temperature is mentioned to be Tx. the stability factor of a glass can be calculated from the
formula Tx-Tg. In preheated plate quenched base glass the stability factor is calculated to be
around 2600C.
Page 28
23 | P a g e
Figure 4.5 DSC scan from room temperature to 800⁰C of pre-heated plate quench base glass
sample
Figure 4.6 DSC study of from room temperature to 700⁰C of air quenched base glass sample
Page 29
24 | P a g e
Figure 4.7 DSC study from room temperature to 800⁰C of pure strontium base glass sample
Figure 4.8 DSC study from room temperature to 700⁰C of 0.1 mol % La2O3 doped glass
sample
DENSITY MEASUREMENT
The density studies of the four samples were done. The two of them are glass samples
which are SBT base glass and 0.1 mol % La2O3 doped SBT glass. The other two samples are
Page 30
25 | P a g e
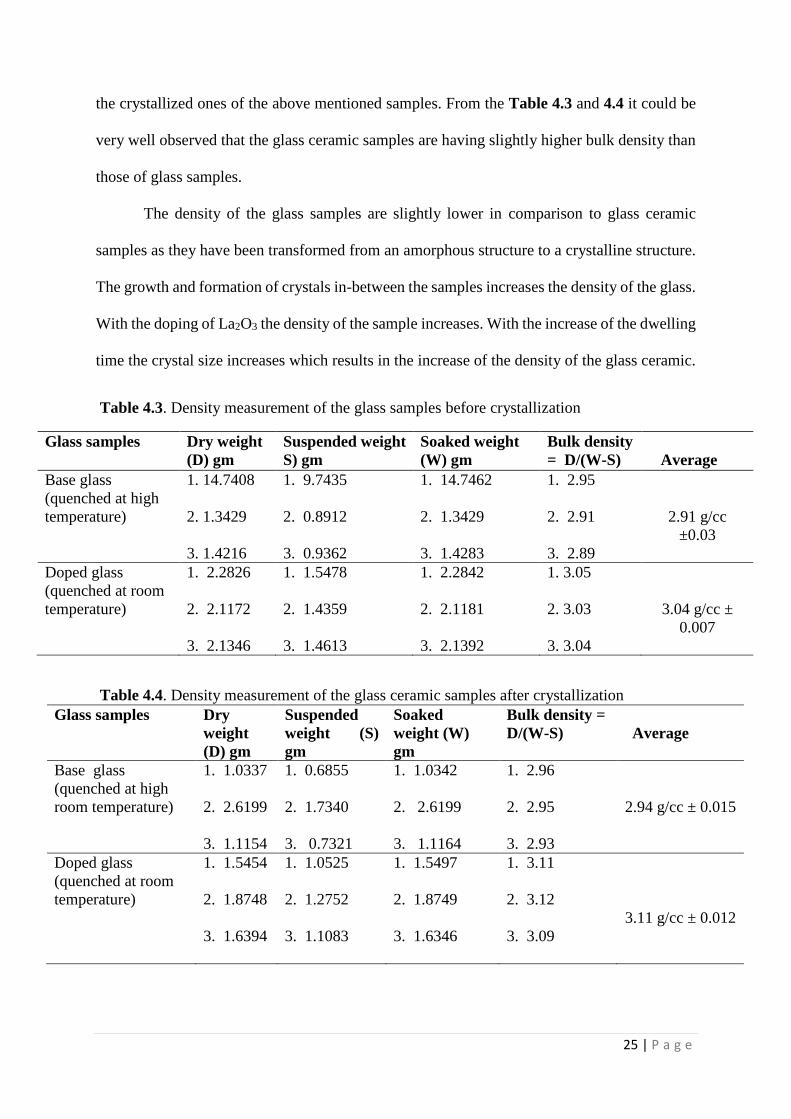
the crystallized ones of the above mentioned samples. From the Table 4.3 and 4.4 it could be
very well observed that the glass ceramic samples are having slightly higher bulk density than
those of glass samples.
The density of the glass samples are slightly lower in comparison to glass ceramic
samples as they have been transformed from an amorphous structure to a crystalline structure.
The growth and formation of crystals in-between the samples increases the density of the glass.
With the doping of La2O3 the density of the sample increases. With the increase of the dwelling
time the crystal size increases which results in the increase of the density of the glass ceramic.
Table 4.3. Density measurement of the glass samples before crystallization
Table 4.4. Density measurement of the glass ceramic samples after crystallization
Glass samples Dry weight
(D) gm
Suspended weight
S) gm
Soaked weight
(W) gm
Bulk density
= D/(W-S)
Average
Base glass
(quenched at high
temperature)
1. 14.7408
2. 1.3429
3. 1.4216
1. 9.7435
2. 0.8912
3. 0.9362
1. 14.7462
2. 1.3429
3. 1.4283
1. 2.95
2. 2.91
3. 2.89
2.91 g/cc
±0.03
Doped glass
(quenched at room
temperature)
1. 2.2826
2. 2.1172
3. 2.1346
1. 1.5478
2. 1.4359
3. 1.4613
1. 2.2842
2. 2.1181
3. 2.1392
1. 3.05
2. 3.03
3. 3.04
3.04 g/cc ±
0.007
Glass samples Dry
weight
(D) gm
Suspended
weight (S)
gm
Soaked
weight (W)
gm
Bulk density =
D/(W-S)
Average
Base glass
(quenched at high
room temperature)
1. 1.0337
2. 2.6199
3. 1.1154
1. 0.6855
2. 1.7340
3. 0.7321
1. 1.0342
2. 2.6199
3. 1.1164
1. 2.96
2. 2.95
3. 2.93
2.94 g/cc ± 0.015
Doped glass
(quenched at room
temperature)
1. 1.5454
2. 1.8748
3. 1.6394
1. 1.0525
2. 1.2752
3. 1.1083
1. 1.5497
2. 1.8749
3. 1.6346
1. 3.11
2. 3.12
3. 3.09
3.11 g/cc ± 0.012
Page 31
26 | P a g e
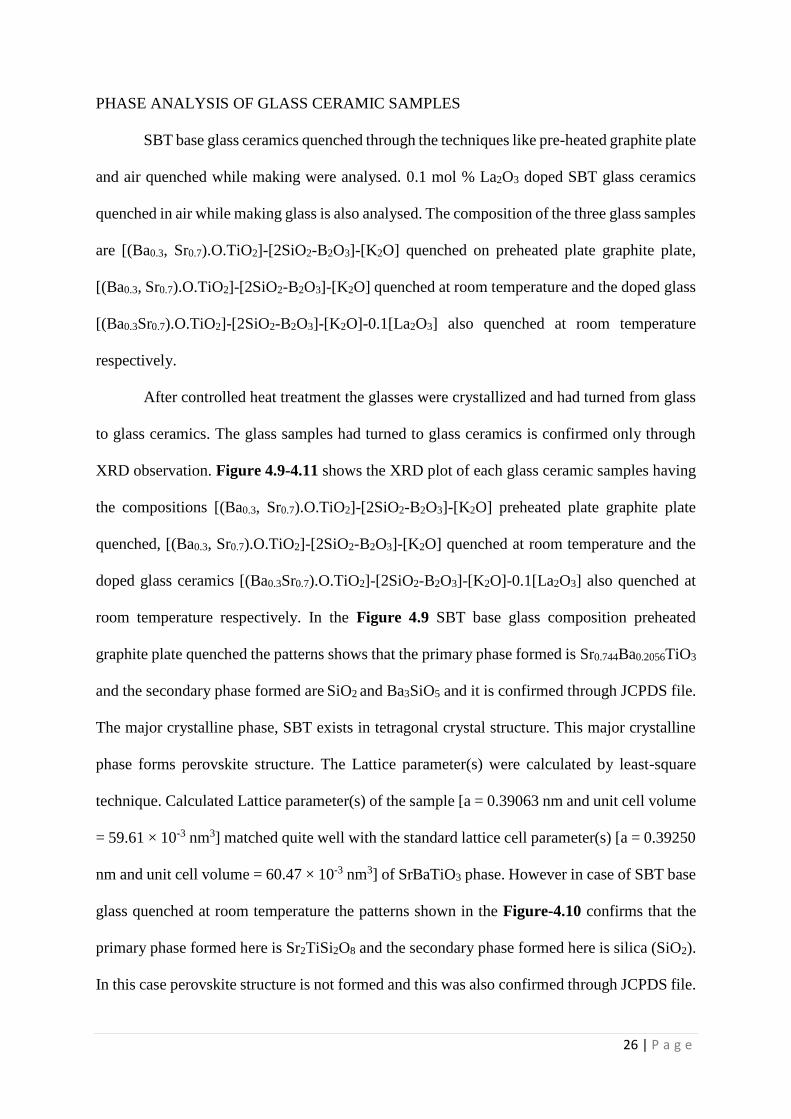
PHASE ANALYSIS OF GLASS CERAMIC SAMPLES
SBT base glass ceramics quenched through the techniques like pre-heated graphite plate
and air quenched while making were analysed. 0.1 mol % La2O3 doped SBT glass ceramics
quenched in air while making glass is also analysed. The composition of the three glass samples
are [(Ba0.3, Sr0.7).O.TiO2]-[2SiO2-B2O3]-[K2O] quenched on preheated plate graphite plate,
[(Ba0.3, Sr0.7).O.TiO2]-[2SiO2-B2O3]-[K2O] quenched at room temperature and the doped glass
[(Ba0.3Sr0.7).O.TiO2]-[2SiO2-B2O3]-[K2O]-0.1[La2O3] also quenched at room temperature
respectively.
After controlled heat treatment the glasses were crystallized and had turned from glass
to glass ceramics. The glass samples had turned to glass ceramics is confirmed only through
XRD observation. Figure 4.9-4.11 shows the XRD plot of each glass ceramic samples having
the compositions [(Ba0.3, Sr0.7).O.TiO2]-[2SiO2-B2O3]-[K2O] preheated plate graphite plate
quenched, [(Ba0.3, Sr0.7).O.TiO2]-[2SiO2-B2O3]-[K2O] quenched at room temperature and the
doped glass ceramics [(Ba0.3Sr0.7).O.TiO2]-[2SiO2-B2O3]-[K2O]-0.1[La2O3] also quenched at
room temperature respectively. In the Figure 4.9 SBT base glass composition preheated
graphite plate quenched the patterns shows that the primary phase formed is Sr0.744Ba0.2056TiO3
and the secondary phase formed are SiO2 and Ba3SiO5 and it is confirmed through JCPDS file.
The major crystalline phase, SBT exists in tetragonal crystal structure. This major crystalline
phase forms perovskite structure. The Lattice parameter(s) were calculated by least-square
technique. Calculated Lattice parameter(s) of the sample [a = 0.39063 nm and unit cell volume
= 59.61 × 10⁻³ nm3] matched quite well with the standard lattice cell parameter(s) [a = 0.39250
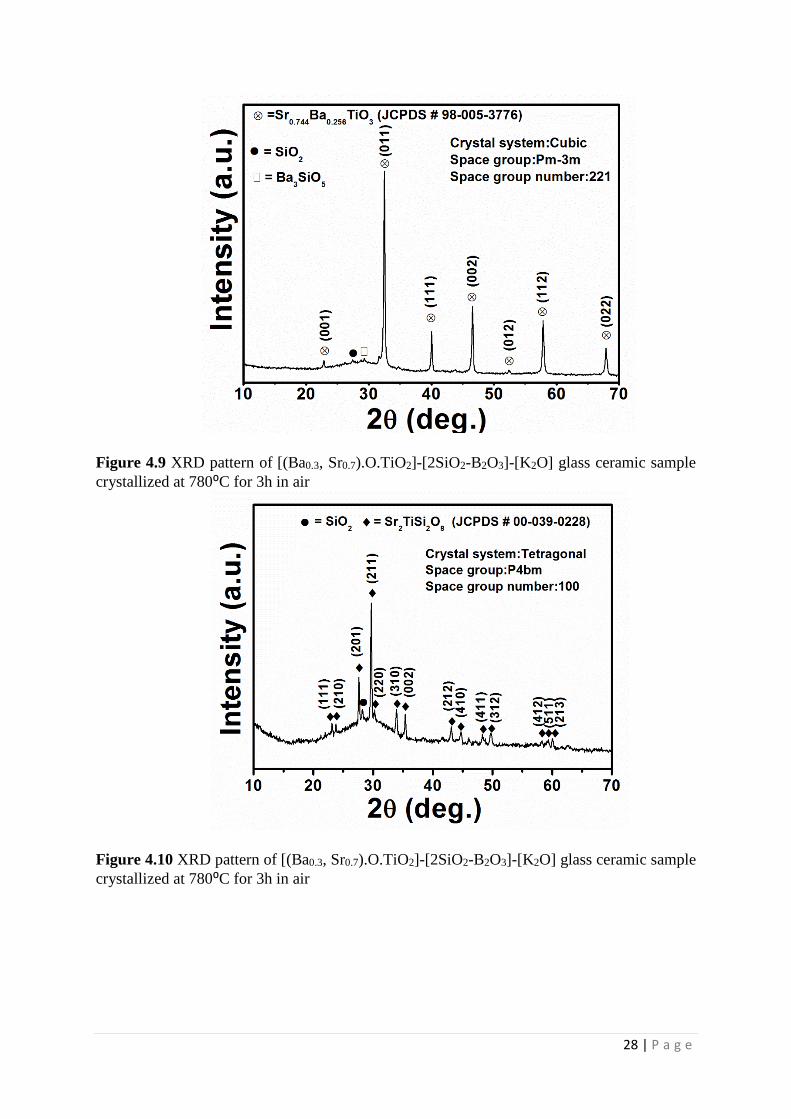
nm and unit cell volume = 60.47 × 10⁻³ nm3] of SrBaTiO3 phase. However in case of SBT base
glass quenched at room temperature the patterns shown in the Figure-4.10 confirms that the
primary phase formed here is Sr2TiSi2O8 and the secondary phase formed here is silica (SiO2).
In this case perovskite structure is not formed and this was also confirmed through JCPDS file.
Page 32
27 | P a g e
The require phase has not formed since it might require much higher temperature for its
formation. The energy barrier in this case might have been higher in comparison to the pre
heated graphite plate quenched glass ceramics. In the Figure 4.11 the XRD patterns confirms
that the primary phase formed after crystallization is Sr0.9La0.1TiO3 which is the required phase
along with the primary phase the secondary phases observed are SiO2 and Ba3SiO5 and it is
also confirmed through JCPDS file. The major crystalline phase, 0.1 mol % La2O3 SBT exists
in tetragonal crystal structure. This major crystalline phase forms perovskite structure. Lattice
parameter(s) were calculated by least-square technique. Calculated Lattice parameter(s) of the
sample [a = 0.39150 nm and unit cell volume = 60.01 × 10⁻³ nm3] matched quite well with the
standard lattice cell parameter(s) [a = 0.39111 nm and unit cell volume = 59.83 × 10⁻³ nm3] of
Sr0.9La0.1TiO3 phase. It can be seen that with the doping of La2O3 in the SBT glass, La2O3
promotes the crystallization and influences the degree of crystallinity. The substitution of La3+
ions into the Sr2+ sites enhanced the stability of the perovskite structure because of a higher
bond strength associated with the La-O compared to Ba-O bonds. Hence the formation of
stronger bonds would certainly suppress the formation of intrinsic defects [23].
From XRD data there is an indication that the doped glass gets crystallized at lower
temperature than the SBT base glass as the crystallized graph of SBT base glass is the sample
is crystallized at 7800C for 3hrs whereas the doped SBT glass gets crystallized at 7500C for
3hrs. Hence La2O3 here acts as a nucleating agent.
Page 33
28 | P a g e
Figure 4.9 XRD pattern of [(Ba0.3, Sr0.7).O.TiO2]-[2SiO2-B2O3]-[K2O] glass ceramic sample
crystallized at 780⁰C for 3h in air
Figure 4.10 XRD pattern of [(Ba0.3, Sr0.7).O.TiO2]-[2SiO2-B2O3]-[K2O] glass ceramic sample
crystallized at 780⁰C for 3h in air
Page 34
29 | P a g e
Figure 4.11 XRD pattern of [(Ba0.3, Sr0.7).O.TiO2]-[2SiO2-B2O3]-[K2O]-0.1 mol % [La2O3]
glass ceramic crystallized at 750⁰C for 3h in air
MICROSTURUTAL ANALYSIS OF GLASS CERAMIC SAMPLES
The surface morphology of SBT base glass ceramic having the composition [(Ba0.3,
Sr0.7).O.TiO2]-[2SiO2-B2O3]-[K2O] and also the surface morphology of 0.1 mol % La2O3 doped
SBT glass ceramics having the composition [(Ba0.3, Sr0.7).O.TiO2]-[2SiO2-B2O3]-[K2O]-
0.1[La2O3] were observed. SEM showed the detailed microstructural morphology analysis of
the samples. Elemental X-Ray mapping results were also obtained which shows the distribution
of the all the elements present in the microstructure. Energy Dispersive Spectroscopy (EDS)
results obtained shows the quantitative analysis of the microstructures present in the samples.
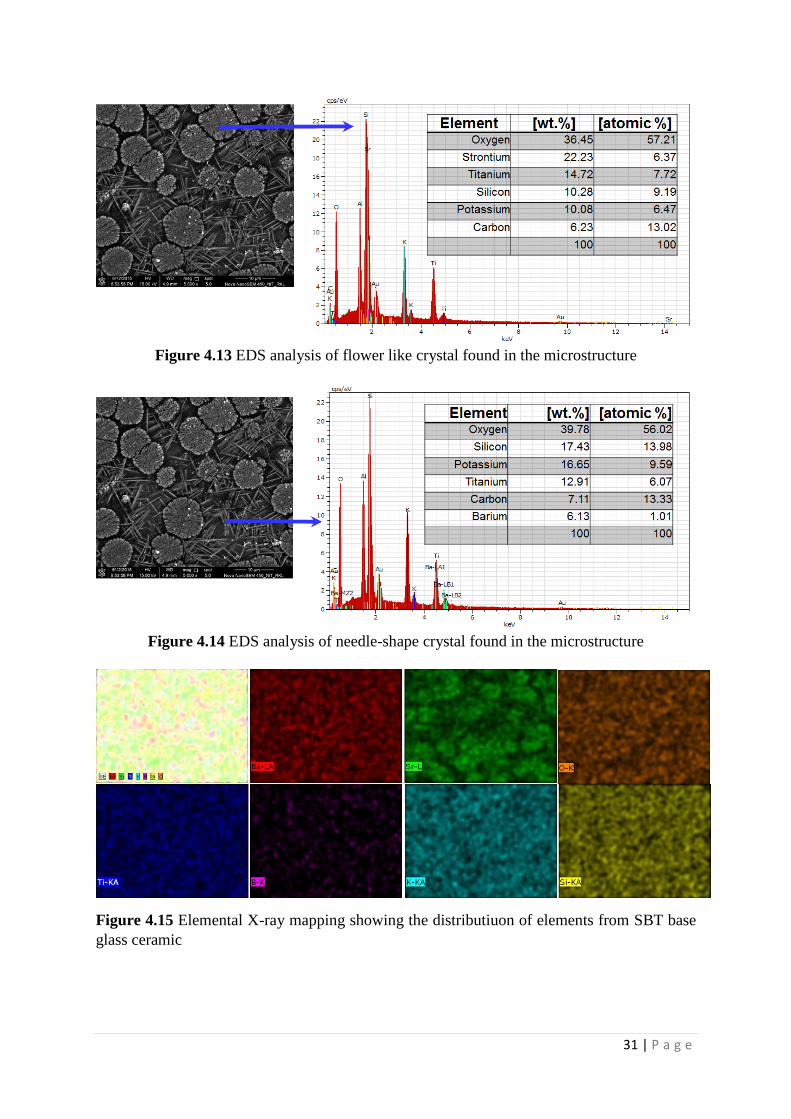
The Figure 4.12 shows the surface morphology of the SBT base glass ceramic. The
morphology shows there are two types of crystals formed within it one of them is flower-like
and the other one is needle-like. The elemental X-ray mapping and EDS gives us the detailed
composition of the both flower-like and needle-like crystals and are presented in Figure 4.13-
4.15 and from these data we could conclude that the flower-like crystals are rich in strontium
Page 35
30 | P a g e
as Sr2+/Ti4+ ratio ~0.8 matches with the ratio of Sr2+/Ti4+ (0.75) in the Sr0.744Ba0.256TiO3
composition. So we could very well conclude that the major phase formed in the flower like
crystal structure is Sr0.744Ba0.256TiO3. However the needle like crystals formed may form
barium silicate (Ba3Si2O8) phase and this is also known from the EDS analysis which is
presented in the Figure 4.14. The sample has borosilicate matrix may also be concluded.
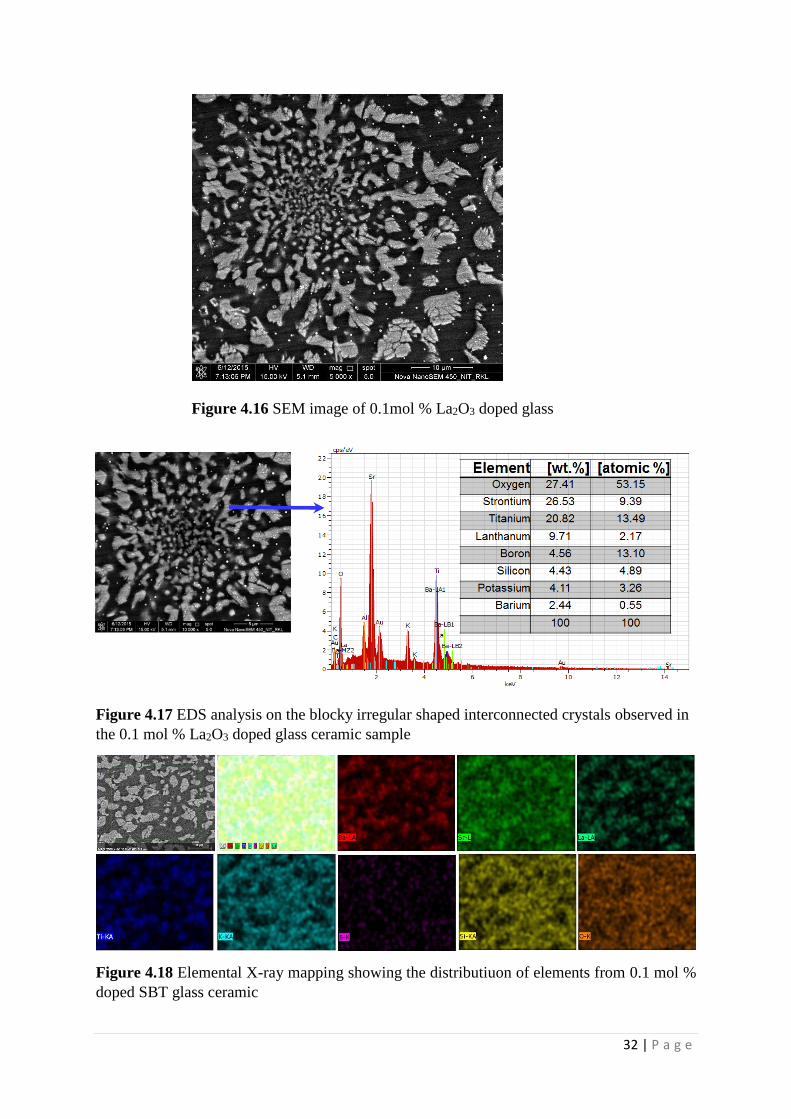
The Figure 4.16 shows the surface morphology of the 0.1 mol % La2O3 doped SBT
glass ceramics. The morphological analysis of the doped glass shows blocky irregular shaped
interconnected crystals are observed throughout the microstructure after controlled
crystallization. The elemental X-ray mapping and EDS gives us the detailed composition of
the blocky irregular shaped interconnected like crystals and are presented in Figure 4.17-4.18
and from these data we could conclude that blocky irregular shaped interconnected like crystals
are rich in strontium in the Sr0.9La0.1TiO3 composition. So we could very well conclude that
the major phase formed in the blocky irregular shaped interconnected like crystal structure is
Sr0.9La0.1TiO3. The EDS analysis also shows that some amount of barium is also present in the
blocky irregular shaped interconnected like crystal structure. The matrix in major may have the
borosilicate composition.
Figure 4.12 SEM image of SBT base glass ceramic
Page 36
31 | P a g e
Figure 4.13 EDS analysis of flower like crystal found in the microstructure
Figure 4.14 EDS analysis of needle-shape crystal found in the microstructure
Figure 4.15 Elemental X-ray mapping showing the distributiuon of elements from SBT base
glass ceramic
Page 37
32 | P a g e
Figure 4.16 SEM image of 0.1mol % La2O3 doped glass
Figure 4.17 EDS analysis on the blocky irregular shaped interconnected crystals observed in
the 0.1 mol % La2O3 doped glass ceramic sample
Figure 4.18 Elemental X-ray mapping showing the distributiuon of elements from 0.1 mol %
doped SBT glass ceramic
Page 38
33 | P a g e
DIELECTRIC ANALYSIS
The dielectric properties of glass ceramics are controlled by factors such as the nature and
amount of crystalline phases, crystallite size and morphology. The secondary phases, crystal
clamping and the connectivity of the high permittivity perovskite crystals in the low
permittivity glassy matrix. The nature of crystalline phases and micro-structure of glass
ceramics can be controlled in the heat treatment conditions. The dielectric measurement at
room temperature with varying frequency is also analysed.
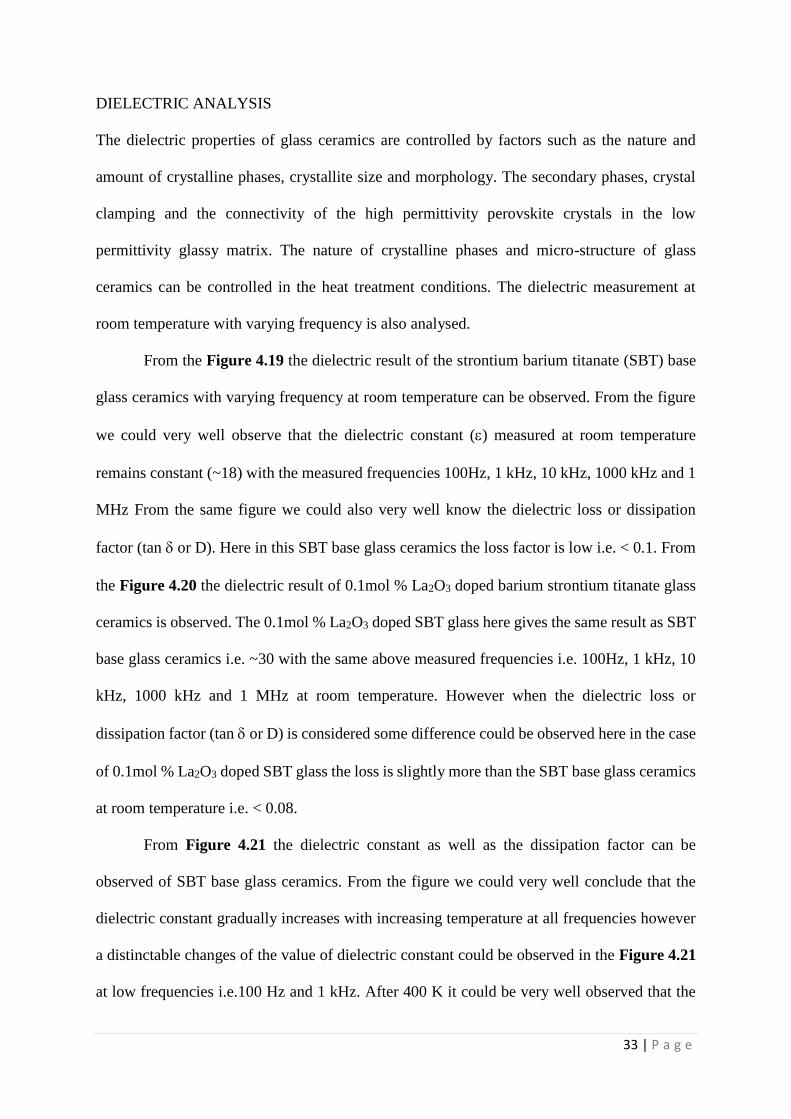
From the Figure 4.19 the dielectric result of the strontium barium titanate (SBT) base
glass ceramics with varying frequency at room temperature can be observed. From the figure
we could very well observe that the dielectric constant () measured at room temperature
remains constant (~18) with the measured frequencies 100Hz, 1 kHz, 10 kHz, 1000 kHz and 1
MHz From the same figure we could also very well know the dielectric loss or dissipation
factor (tan or D). Here in this SBT base glass ceramics the loss factor is low i.e. < 0.1. From
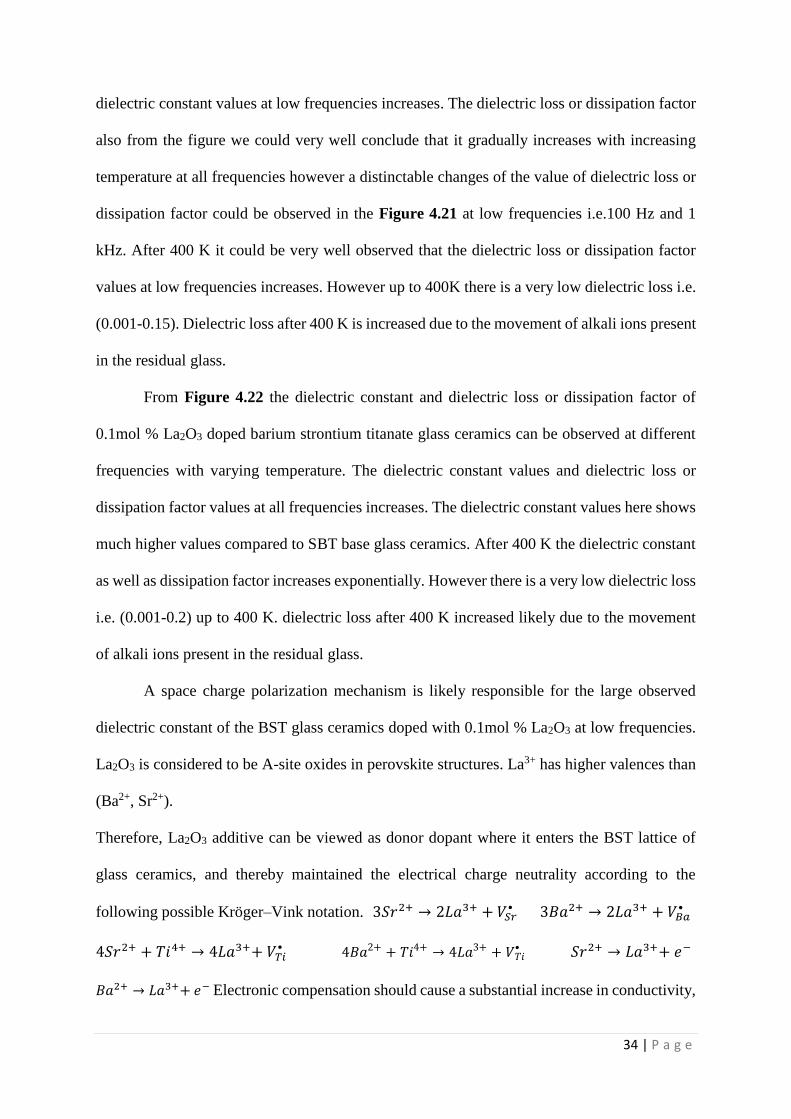
the Figure 4.20 the dielectric result of 0.1mol % La2O3 doped barium strontium titanate glass
ceramics is observed. The 0.1mol % La2O3 doped SBT glass here gives the same result as SBT
base glass ceramics i.e. ~30 with the same above measured frequencies i.e. 100Hz, 1 kHz, 10
kHz, 1000 kHz and 1 MHz at room temperature. However when the dielectric loss or
dissipation factor (tan or D) is considered some difference could be observed here in the case
of 0.1mol % La2O3 doped SBT glass the loss is slightly more than the SBT base glass ceramics
at room temperature i.e. < 0.08.
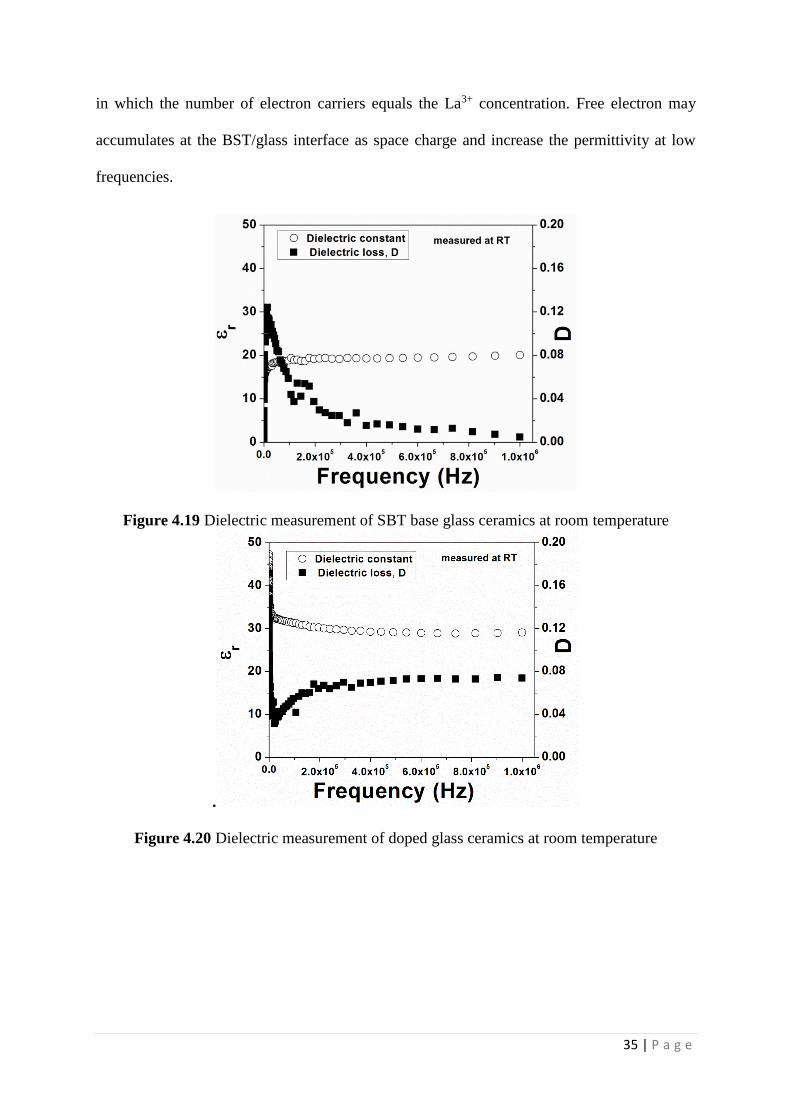
From Figure 4.21 the dielectric constant as well as the dissipation factor can be
observed of SBT base glass ceramics. From the figure we could very well conclude that the
dielectric constant gradually increases with increasing temperature at all frequencies however
a distinctable changes of the value of dielectric constant could be observed in the Figure 4.21
at low frequencies i.e.100 Hz and 1 kHz. After 400 K it could be very well observed that the
Page 39
34 | P a g e
dielectric constant values at low frequencies increases. The dielectric loss or dissipation factor
also from the figure we could very well conclude that it gradually increases with increasing
temperature at all frequencies however a distinctable changes of the value of dielectric loss or
dissipation factor could be observed in the Figure 4.21 at low frequencies i.e.100 Hz and 1
kHz. After 400 K it could be very well observed that the dielectric loss or dissipation factor
values at low frequencies increases. However up to 400K there is a very low dielectric loss i.e.
(0.001-0.15). Dielectric loss after 400 K is increased due to the movement of alkali ions present
in the residual glass.
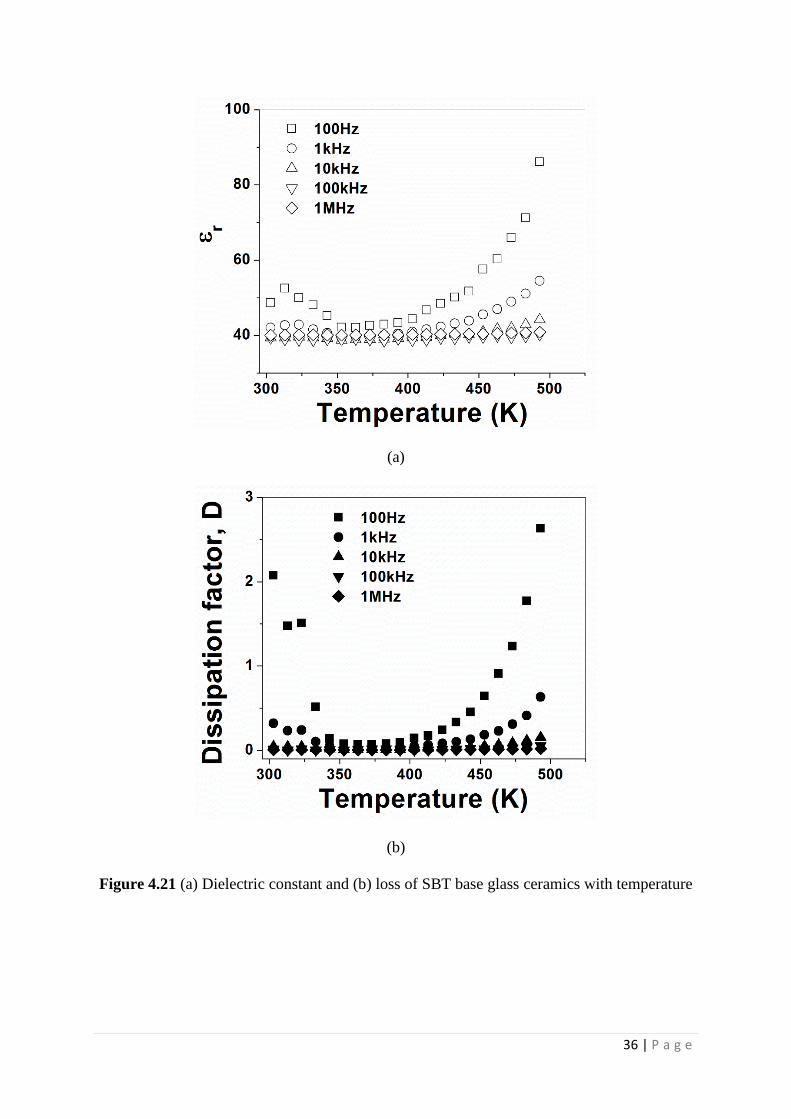
From Figure 4.22 the dielectric constant and dielectric loss or dissipation factor of
0.1mol % La2O3 doped barium strontium titanate glass ceramics can be observed at different
frequencies with varying temperature. The dielectric constant values and dielectric loss or
dissipation factor values at all frequencies increases. The dielectric constant values here shows
much higher values compared to SBT base glass ceramics. After 400 K the dielectric constant
as well as dissipation factor increases exponentially. However there is a very low dielectric loss
i.e. (0.001-0.2) up to 400 K. dielectric loss after 400 K increased likely due to the movement
of alkali ions present in the residual glass.
A space charge polarization mechanism is likely responsible for the large observed
dielectric constant of the BST glass ceramics doped with 0.1mol % La2O3 at low frequencies.
La2O3 is considered to be A-site oxides in perovskite structures. La3+ has higher valences than
(Ba2+, Sr2+).
Therefore, La2O3 additive can be viewed as donor dopant where it enters the BST lattice of
glass ceramics, and thereby maintained the electrical charge neutrality according to the
following possible Kröger–Vink notation. 3𝑆𝑟2+ → 2𝐿𝑎3+ + 𝑉𝑆𝑟• 3𝐵𝑎2+ → 2𝐿𝑎3+ + 𝑉𝐵𝑎
•
4𝑆𝑟2+ + 𝑇𝑖4+ → 4𝐿𝑎3++ 𝑉𝑇𝑖• 4𝐵𝑎2+ + 𝑇𝑖4+ → 4𝐿𝑎3+ + 𝑉𝑇𝑖
• 𝑆𝑟2+ → 𝐿𝑎3++ 𝑒−
𝐵𝑎2+ → 𝐿𝑎3++ 𝑒− Electronic compensation should cause a substantial increase in conductivity,
Page 40
35 | P a g e
in which the number of electron carriers equals the La3+ concentration. Free electron may
accumulates at the BST/glass interface as space charge and increase the permittivity at low
frequencies.
Figure 4.19 Dielectric measurement of SBT base glass ceramics at room temperature
.
Figure 4.20 Dielectric measurement of doped glass ceramics at room temperature
Page 41
36 | P a g e
(a)
(b)
Figure 4.21 (a) Dielectric constant and (b) loss of SBT base glass ceramics with temperature
Page 42
37 | P a g e
(a)
(b)
Figure 4.22 (a) Dielectric constant and (b) loss of 0.1mol % La2O3 doped SBT base glass
ceramics with temperature
Page 43
38 | P a g e
CONCLUSION
SBT glass was successfully synthesized using melt-quench method.
FTIR spectra of base glass and 0.1 mol% La2O3 doped glass shows the presence of
stretching vibration of O–H bond inside the glassy network. Asymmetric stretching
relaxation of the B-O bond of trigonal BO3 units, stretching vibrations of B-O-Si
linkage and deformation vibrations of the Si–O–Si bridges were also observed.
DSC scan of base glass and doped glass reveals that addition of 0.1 mol% La2O3
addition into SBT base glass composition elevates the onset of crystallization
temperature.
XRD shows the formation of Sr2TiSi2O8 and SiO2 phase upon crystallization at 780⁰C
for 3h in air for base glass sample obtained by air quench at room temperature.
However, base glass sample obtained by melt-quench on a preheated graphite plate
shows the formation of Sr0.744Ba0.2056TiO3, SiO2 and Ba3SiO5 phase. 0.1 mol% La2O3
doped glass sample upon crystallization at 750⁰C for 3h shows the formation of
Sr0.9La0.1TiO3, SiO2 and Ba3SiO5 phase.
SEM shows the formation of micron sized flower-like and needle shaped crystals
precipitated throughout the microstructure in case of base glass ceramic sample.
Addition of 0.1 mol % La2O3 modify the crystal structure to blocky precipitates.
A space charge polarization mechanism is likely responsible for the large observed
dielectric constant of the BST glass ceramics doped with 0.1mol % La2O3 at low
frequencies. Free electron may accumulated at the BST/glass interface as space charge
and increase the permittivity at low frequencies.
Page 44
39 | P a g e
REFERENCE
[1] Edgar Dutra Zanotto “A bright future for glass-ceramics”, American Ceramic Society
Bulletin, Vol. 89, No. 8.
[2] Jiangying, W., Xi Yao, Liangying Zhang “Preparation and dielectric properties of
barium strontium titanate glass-ceramics sintered from sol–gel-derived powders”,
Ceramics International 30 (2004) 1749–1752.
[3] Gene H. Haertling (Ferroelectric Ceramics: History and Technology) Journal of the
American Ceramic Society—Haertling.
[4-5] A.S. Bhalla, R. Guo and R. Roy, (The perovskite structure – a review of its role in
ceramic science and technology), Mat. Res. Innovat. 4, 3-26 (2000) and references
there in.
[6] Mats Johnsson and Peter Lemmens, (Crystallography and Chemistry of Perovskites),
[7] A.F. Wells, (1995) Structural Inorganic Chemsitry, Oxford Science publications U.
Müller, (1993). Inorganic Structural Chemistry, Wiley & Sons Ltd
[8-9] Xiangrong Wang, Yong Zhang *, Ivan Baturin , Tongxiang Liang (Blocking effect of
crystal–glass interface in lanthanum doped barium strontium titanate glass ceramics),
Materials Research Bulletin 48 (2013) 3817–3821.
[10] Yong Zhang, Tao Ma, Xiangrong Wang, Zongbao Yuan and Qian Zhang, (Two
dielectric relaxation mechanisms observed in lanthanum doped barium strontium
titanate glass ceramics) journal of applied physics 28 April 2011.
[11] Ozawa, T. Bull. Chem. Soc. Jpn., 1965, 35, 1881.
[12] P. G. Bray, “Interaction of Radiation with Solids,” Plenum, New York, 1967.
[13] R. V. Adams and R. W. Douglas, “Infrared Studies on Various Samples of Fused
Silica with Special Reference to the Bands Due to Water,” Journal of the
Society of Glass Technology, Vol. 43, 1959, pp. 147-158.
[14] H. Dunken and R. H. Doremus, “Short Time Reactions of a Na 2 O-CaO-SiO 2 Glass
With Water and Salt Solutions,” Journal of Non-Crystalline Solids, Vol. 92, No. 1,
1987, pp. 61-72. doi:10.1016/S0022-3093(87)80359-9
[15] R. D. Husung and R. H. Doremus, “Infrared Transmission Spectra of Four Silicate
Glasses before and after Exposure to Water,” Journal of Materials Research, Vol. 5,
No. 10, 1990, pp. 2209-2217. doi:10.1557/JMR.1990.2209
[16] G. Ramadevudu, S. R. L. Srinivasa, M. S. A. Hameed and M. C. Narasimha, “FTIR and
Some Physical Properties of Alkaline Earth Borate Glasses Containing Heavy
Metal Oxides,” International Journal of Engineering Science and Technology, Vol.
3, No. 9, 2011, pp. 6998-7005.
[17] N. A. Ghoneim, H. A. El Batal, N. Abdel Shafi and M. H. Azooz, “Synthesis and
Characterization of Cadmium Doped Lead-Borate Glasses,” Proceeding of the
Egyptian Conference of Chemistry, Cairo, 1996, p. 162.
Page 45
40 | P a g e
[18] F. M. Ezz Eldin, N. A. E. L. Alaily, F. A. Khalifa and H. A. E. L. Batal, “In
Fundamental of Glass Science and Technology,” 3rd E.S.G. Conference
Germany: Verlag Der Deutschen Lastechnischen Gesellschaft, 1995.
[19] A. S. Tenny and J. J. Wong, “Vibrational Spectra of Vapour Deposited Binary
Borosilicate Glasses,” Chemical Physics, Vol. 56, No. 11, 1972, pp. 5516-5523.
[20] H. Doweidar, M. A. A. Zeid and G. M. El-Damrawy, “Effect of Gamma Radiation
and Thermal Treatment on Some Physical Properties of ZnO-PbO-B 2 O 3 Glasses,”
Journal of Physics D, Vol. 24, No. 12, 1991, pp. 2222- 2228. doi:10.1088/0022-
3727/24/12/015
[21] M. Pal and B. Roy, “Structural Characterization of Borate Glasses Containing Zinc and
Manganese Oxides,” Journal of Modern Physics, Vol. 2, No. 9, 2011, pp. 1062-
1066. doi:10.4236/jmp.2011.29129
[22] K. El-Egili, “Infrared Studies of Na2O-B2O3 -SiO2 and Al2O3 -Na2O-B2 O3 -SiO2
Glasses,” Physic B, Vol. 325, 2003, pp. 340-348. Doi: 10.1016/S0921-
4526(02)01547-8
[23] A.K. Yadav, C.R. Gautam, P. Singh, New J. Glass Glass Ceram. 2, 126 (2012)