Prescription–Event Monitoring (PEM): The Evolution to the New Modified PEM and its Support of Risk ManagementDEBORAH LAYTON AND SAAD SHAKIRDrug Safety Research Unit, Southampton, UK and University of Portsmouth, Portsmouth, UK
The recognition that not all hazards could be known before a drug was marketed and that spon-taneous adverse drug reaction (ADR) reporting systems have limitations to identify all hazards led to several proposals for schemes based on the iden-tification of patients by means of prescription data. These schemes were largely intended to provide information on populations of known size so that the incidence of adverse reactions could be esti-mated with reasonable accuracy. This led to the founding of a prescription-based monitoring system to monitor events regardless of relatedness to drug exposure (Prescription-Event Monitoring (PEM)) by W. H. W Inman and the establishment of the Drug Safety Research Unit (DSRU). The DSRU is an independent registered medical non-
profit organization that operates in association with the University of Portsmouth.
The system’s key objective at inception in the 1980s was to recruit the first 10 000 patients who received a new drug of interest so that any adverse event that occurred in more than one in 1000 patients would be reliably identified. Based on the success of these standard PEM studies over a period of 30 years, this methodology has subsequently evolved in response to the require-ments for risk management of medicines to facil-itate more targeted safety surveillance. This has been achieved through the technique known as modified (M)-PEM, which retains all the strengths of the standard method with the same underly-ing process but also tries to overcome some of its limitations (further details in following sections).
360 MANN’S PHARMACOVIGILANCE
GENERAL PRINCIPLES
STUDY DESIGN
The general methodology common to both stand-ard and modified approaches uses a retrospective noninterventional observational cohort design to provide active surveillance of targeted medicines on a national scale in England. Data analysis utilizes several approaches that combine the application of epidemiological methods with medical evaluation to provide estimates of prevalence of selected drug utilization characteristics, incidence rates for events reported in the exposed cohort ,exploration of risk profiles within different subpopulations, and also provides the opportunity for further clinical evalu-ation of selected events of interest. Details of the methodology of standard PEM, including the methods of data coding, computerization, and analysis, have been provided in a number of publi-cations, and thus are not covered in detail in this chapter (Freemantle et al., 1997; Layton and Shakir, 2011). The majority of all new studies are now constructed using the M-PEM approach, and examples of bespoke analytical requirements neces-sary to achieve an M-PEM’s study aims and objec-tives are provided later.
The eligible cohort is identified based on a single common exposure identifier (a prescription for the new medication under surveillance). The method is noninterventional because the decision to prescribe has already been taken and there are no additional constraints on care imposed by subsequent partici-pation in the study. Confirmation of exposure status and outcome are ascertained retrospectively to assemble the evaluable cohort (i.e., the cohort available for analysis). The design is also longitudi-nal because health outcomes can be examined over a span of time. Furthermore, since prescription data collection begins immediately after the new drug has been launched (and covers the national population in England), evaluable patient cohorts can be accrued rapidly, which provides the oppor-tunity to detect safety issues as early as possible after market launch, a fundamental principle in pharmacovigilance. Furthermore, the study design is highly dynamic, such that newly emerging safety issues can be investigated while a study is in progress.
The evaluable cohort is also regarded as an inception cohort (where study drug is a new entity) or a new user cohort (e.g., where the drug under study might be a new formulation or new indica-tion). Here, the observation period begins as soon as the patient starts the medication, which is par-ticularly important if the risk of an event is higher in the early period after starting therapy. An advan-tage of an inception cohort is that potential con-founding factors can be measured before treatment starts and adjusted for in subsequent statistical analysis. Unlike standard PEM, the M-PEM methodology offers greater scope to collect this baseline data.
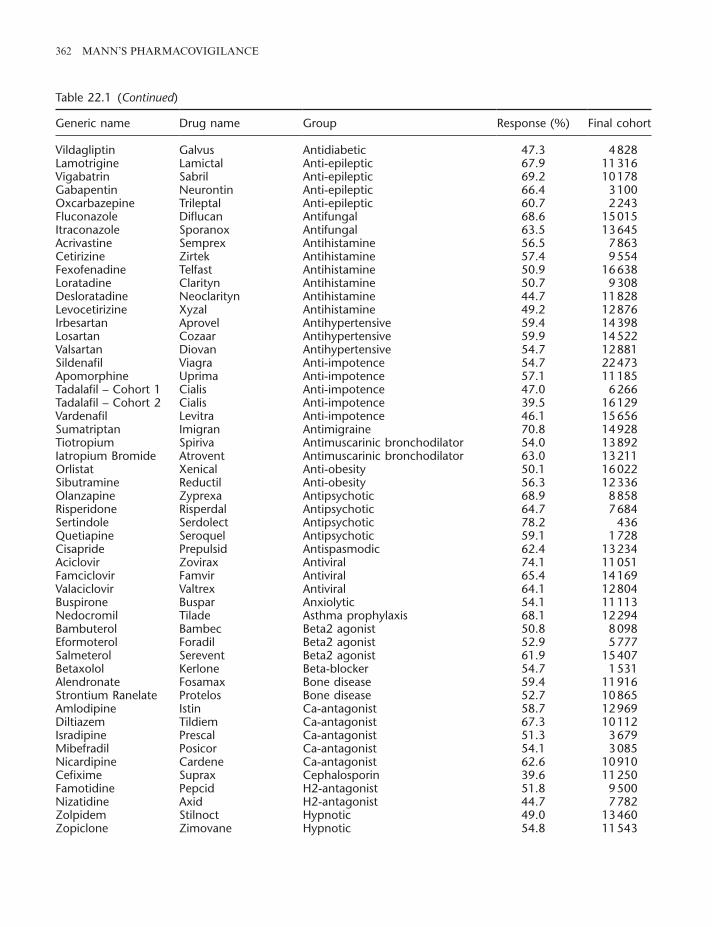
A wide range of drugs have been studied using one of the two approaches, including agents to treat hypertension, angina, asthma and chronic obstruc-tive pulmonary disease (COPD), diabetes, epilepsy, depression, schizophrenia, erectile dysfunction, urinary incontinence, and a number of nonsteroi-dal anti-inflammatory drugs (including selective COX-2 inhibitors). Thus, the drugs included in the system are those intended for widespread, long-term use, special emphasis being given to drugs for which treatment is likely to be both initiated and continued by the general practitioner (GP) (Anon., 1986; BMA, 2006). In addition to drugs that are taken regularly, it has also been possible to study products that are not used daily, such as sildenafil for erectile dysfunction (Shakir et al. 2001).
Of the 119 studies listed in Table 22.1, an average of 55.5% of the 108 standard PEM questionnaires sent out have been returned by the GPs to the DSRU with an average evaluable cohort size of 10 947. For the 11 M-PEM studies given in Table 22.1, an average of 58.8% of M-PEM question-naires sent have been returned, with a smaller average final evaluable cohort size of 6876 patients.
DATA SOURCE
Within the British National Health Service (NHS) structure, all individuals are registered with a primary-care GP. Medical records held by the GP are generally lifelong, transferable when a patient relocates, and include information on healthcare consultations and interventions provided by both primary and secondary care. The sampling frame is
MODIFIED PEM AND SUPPORT OF RISK MANAGEMENT 361
Table 22.1 List of 119 completed studies, by type (standard, modified).
Generic name Drug name Group Response (%) Final cohort
hierarchical, comprising of two levels: all GPs in England who prescribe the study drug and their patients. This wide coverage aims to provide an evaluable cohort that is representative of the whole population of patients who are registered with an NHS GP in England who take the study drug during the study period.
DATA COLLECTION PROCESS
This occurs through a two-phased approach, which is summarized in Figure 22.1. The first phase is the collection of prescription data to capture patient and prescriber details, and the second is the collec-tion of exposure and outcome data.
The first phase of the identification of prescrib-ers and patients relies on data from dispensed NHS prescriptions. Prescription data are provided to the DSRU under long-standing arrangements and through secure transmission, by a central NHS pre-scription processing center, known as the NHS
Business Services Authority (NHSBSA). This oper-ates for a length of time necessary for the DSRU to collect a sufficient number of prescriptions to identify the required study sample size. The NHSBSA receives remuneration from the DSRU for this service. These data are reconciled with GP identifier records available from the NHS Organisa-tion Data Services (ODS), to obtain prescriber contact details and, with existing records on the DSRU customized PEM database, to ascertain whether the data pertain to an existing eligible patient already within the DSRU PEM database. It should be noted that all relevant prescriptions are collected, irrespective of whether they are a new or repeat course.
The second phase involves secondary use of medical records data that have been entered into medical records as part of routine clinical care (EMA, 2012). For each eligible patient identified, a questionnaire is sent by post (according to chron-ological order of prescription issue date) to the
(Continued)
362 MANN’S PHARMACOVIGILANCE
Generic name Drug name Group Response (%) Final cohort
information bias through misclassification. GPs are offered a modest reimbursement to cover adminis-trative costs in recognition of the time spent com-pleting the more detailed M-PEM data collection forms.
Within the DSRU, each questionnaire is scanned into the system and the image is reviewed by a scientific member of the DSRU staff. This initial review aims to identify possible serious ADRs or events requiring action (e.g., external communica-tions or expedited follow-up). An aggregate as -sessment of drug-relatedness, clinical features/manifestations, clinical course, and prognosis of clinical conditions may be performed (see later). Supplemental information may be sought from GPs using targeted questionnaires, where such information is not obtained in the initial survey. Such questionnaires are sent within weeks of the initial review; but in some cases, where an objective of a study might be to monitor events with longer time to possible onset, a lag period may be intro-duced (e.g., 12 months from the date of first occur-rence of the event of interest), such as for androgenic manifestations with testosterone use in women using a testosterone patch for reduced sexual drive. A list of medically serious events (ICH, 2003) that have been associated with the use of medicines (e.g. aplastic anemia) has been compiled by the DSRU; such events routinely undergo further evaluation. All pregnancies reported during treatment or within
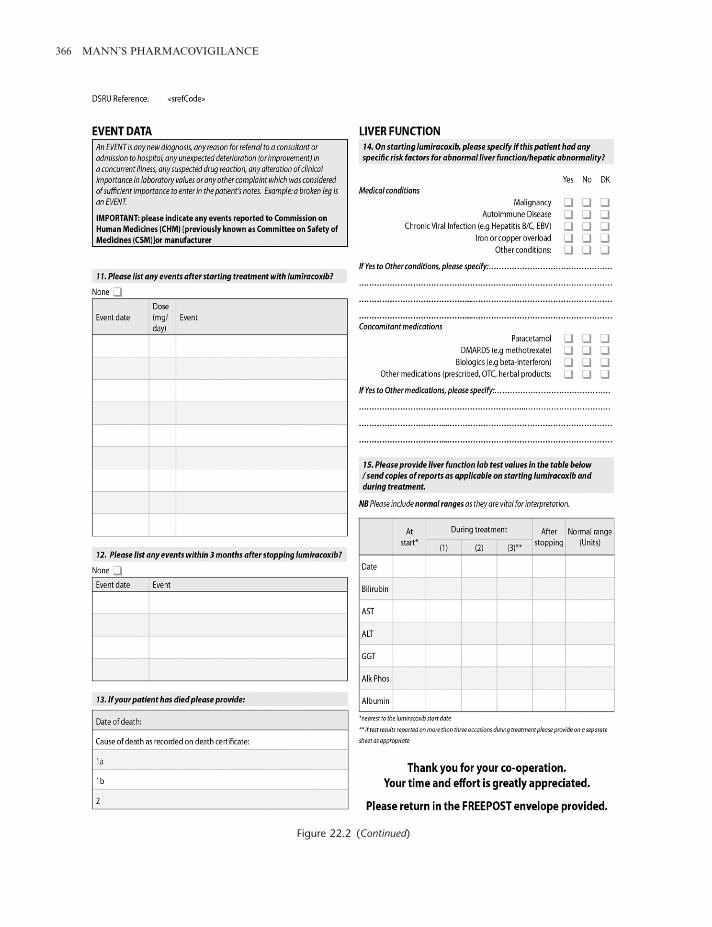
prescribing GP until the target sample size (usually many thousands of patients) is achieved. In order to avoid placing an unreasonable demand on the prescribers, no more than four questionnaires for each M-PEM study are sent to each doctor in any one month for any one study. Data collected include patient demographics (age, sex), prescribing infor-mation, and details of all significant events that have been recorded in the patient’s medical records during a specific time period after starting the study drug. Early modifications to the standard method-ology involved adding a small number of additional questions (with yes, no, don’t know answers) on the questionnaire. These focused on issues specific to the drug under study; for example, the standard questionnaire for the standard PEM study on the NSAID meloxicam included questions about previ-ous history of gastrointestinal conditions and intol-erance to NSAIDs to identify possible confounding by indication (Martin et al., 2000). The customized M-PEM format questionnaires were developed to collect relevant supplementary information in order to perform more detailed exploration of specific safety issues. An example is shown in Figure 22.2. The M-PEM questionnaire collects more detailed information on outcomes (including specific events that comply with prespecified case definitions), drug exposure, and other relevant disease risk factors at the start of treatment. This improves data accuracy and quality, reducing the possibility of
Figure 22.1 Common process of a standard PEM or M-PEM study.
DSRU noti�es NHS Prescription Services (NHSBSA) of study drug under surveillance↓
DSRU receives data from dispensed NHS prescriptions issued in England by GPs from the date of market launch, in strict con�dence from the NHSRxS
↓PEM (standard/modi�ed) questionnaires sent to GPs (e.g., ≥3/6/12 months after �rst primary care prescription
issued for patient)↓
Information requested on questionnaire includes baseline demographic data, drug exposure details, events and other outcomes, important risk factors , and prescribing patterns.
↓PEM (standard/modi�ed) questionnaires returned, scanned, reviewed, and data entered onto DSRU database
↓Selected events of medical interest (ADRs, rare and iatrogenic adverse reactions events, deaths (where cause not
known), pregnancies, and other outcomes which require further evaluation may be followed up[Patient con�dentiality maintained throughout]
MODIFIED PEM AND SUPPORT OF RISK MANAGEMENT 365
Figure 22.2 Example of M-PEM questionnaire.
366 MANN’S PHARMACOVIGILANCE
Figure 22.2 (Continued)
MODIFIED PEM AND SUPPORT OF RISK MANAGEMENT 367
known and there is an a priori hypothesis of the effect size, then it is possible to analyze the statisti-cal power of a study given a fixed sample size. For example, assuming 5% (two-sided test) significance, the power of a study based on 10 000 subjects to detect as statistically significant an increase in inci-dence from 0.1% to 0.2% would be 80% (Machin et al., 1997: Table 7.2). Because of the customized nature of M-PEM studies, a specific sample size is calculated depending on the research question of interest, for which the outcomes are chosen and defined through internal DSRU scientific discus-sion as those which best reflect the research ques-tion. For the majority of M-PEM studies that have been undertaken to date, the sample size has been smaller than the 10 000 required for standard PEM studies.
Importantly, the final evaluable cohort sizes and the duration of a study are dependent on the level of prescribing of the study drug in England by GPs. However, cohort accrual is likely to be faster and larger than in postmarketing clinical trials or exist-ing longitudinal medical records databases that sample from a subset of the population.
PRINCIPLES OF GOOD PHARMACOVIGILANCE PRACTICE
M-PEM studies are conducted according to national and international guidelines for ethical conduct of research involving human subjects (RCP, 1996; DOH, 2000; CIOMS and WHO, 2002; GMC, 2013). Following the principles of good pharmacovigilance practice (EMA, n.d.), a full protocol is written for each study to monitor and research the safety of medicines. In addition, under Section 251 of the NHS Act 2006, the DSRU has received support from the Ethics and Confidential-ity Committee of the National Information Gov-ernance Board2 to gain access to and process patient iden tifiable information without consent for the purposes of medical research (October 2009) (Health Research Authority, n.d.). Patient informa-tion security is assured through strict measures guided by DSRU policies. Highly confidential
3 months of stopping the drug are followed up using a supplementary questionnaire to determine the outcome of the pregnancy. All reported deaths for which no cause is specified are also followed up to try to establish the cause of death, provided the reporting GP has supplied a practice identification code for the patient.
For each report, trained coding staff prepare a computerized, longitudinal, chronological record of demographic, exposure, and outcome data asso-ciated with starting the study drug. All events reported on questionnaires are now coded onto a DSRU database using Medical Dictionary for Reg-ulatory Activities (MedDRA) terminology (this replaced the DSRU bespoke dictionary in 2012). Selected attributes are linked to selected data. For example, an event is coded as an ADR if the GP specified that the event is attributable to a drug (either the study drug, or another drug taken during the study observation period), if the event had a fatal outcome, or if the event was a reason for stop-ping. Data quality are assured through a number of methods based on error prevention, data moni-toring, data cleaning, and documentation.
SAMPLE SIZE
In standard PEM, the sample size of 10 000 exposed patients has been driven by the methodology’s orig-inal objective to bridge the gap between randomized trials and spontaneous reporting regarding sensi-tivity to rare and uncommon events that can be achieved by including a larger sample size than premarketing studies. Based on the general “rule of 3”,1 it follows that the larger the sample size, the rarer the event that can be detected (Strom, 1994). Thus, a sample size of 10 000 within a standard PEM should allow for the detection of at least three cases of an adverse event, with 85% power, if the event occurs at a rate of at least 1 in 2000 patients (assuming the background rate is zero) (Machin et al., 1997: Table 7.1). If the background rate is
1 The rule for safety data is commonly referred to as the “rule of 3.” In many situations involving rare reactions it is assumed that the frequency of the event is small, so that the occurrence of the event follows a Poisson distribution, and the 95% confi-dence interval is calculated based on the number of events. If no events are observed in a study of X individuals, then one can be 95% certain that the event occurs no more often that 3/X.
2 The responsibility for Section 251 was transferred to the Health Service Authority and the Confidentiality Advisory Group (CAG) in April 2013.
368 MANN’S PHARMACOVIGILANCE
patient data (name and address) supplied by the NHSBSA used to identify the patient to the pre-scriber are then made anonymous through use of a unique study identifier code assigned by the DSRU and separately one supplied by the GP on the ques-tionnaire at the point of return. The practice code or number is used for subsequent correspondence if additional information is sought from the doctor.
At least one interim report is written to summa-rize the data for each study based on per-protocol predefined milestones (e.g., annually, or number of evaluable patients). These reports may include a listing, by month since the beginning of treatment, of all events reported, and evaluation of factors that may affect cohort accrual and impact on the ability to meet study objectives. They are, if possi-ble, discussed with the marketing authorization holder (MAH) so that reporting obligations to the regulatory bodies can be fulfilled and any remedial action undertaken. Wherever possible each study is undertaken in a collaborative, but always independ-ent relationship with the MAH.
CONTRIBUTION OF STANDARD AND MODIFIED PRESCRIPTION-EVENT MONITORING TO PHARMACOVIGILANCE
The methodology is recognized as a tool for phar-macovigilance and risk management contributing to the monitoring of overall safety of newly mar-keted medicines as used in real-life clinical practice. It is included within EU regulatory guidelines as a pharmacoepidemiological method that can be used in post-authorization safety studies (PASS) (EMA, 2012).
As describe earlier, a number of M-PEM studies have been completed and several are ongoing. The results of these studies have been published sepa-rately elsewhere or the studies are in process; however, Tables 22.2 and 22.3 provide an overview of the methods used to illustrate the potential applications of M-PEM in the context of pharma-covigilance and risk management. These studies were designed to address specific research ques-tions, including characterization of real-life drug use, adherence to prescribing recommendations or guidelines, and targeted surveillance or analysis of
specific events, including those considered to require special monitoring by regulatory authorities. Through M-PEM it is possible to evaluate the safety of a medicine in particular subpopulations defined by particular prognostic characteristics or risk factors at various points in time (pre exposure and or at treatment index date and/or concurrent) during treatment which are considered important for the events of interest. In such studies, patients may be identified according to prespecified criteria (age, sex, indication) through use of an eligibility questionnaire. This may be necessary to define the incept cohort to exclude, for example, those who received the product prior to the approval of an extension to license subgroups (Davies et al., 2007; Aurich-Barrera et al., 2009) or following important changes in the product’s lifecycle (e.g., a licensing or formulation change) (ENCEPP n.d.e).
Examples of modifications to provide targeted safety surveillance for a specific ADR (and sequalae) are, for example, idiopathic bronchospasm in new users of chlorofluorocarbon (CFC)-free formula-tions of inhaled corticosteroids or anticholinergics (Perrio et al., 2007), misuse and diversion in new users of opioid products (Layton et al., 2011; Osborne et al., 2013), and psychiatric events in new users of rimonabant (Buggy et al., 2011). Examples of exploration of drug utilization and compliance with recommended prescribing regimens include the use of ivabradine in patients with conditions that are contraindicated or for whom special warn-ings apply (Doe et al., 2010), or use of selected medicines which, for example, affect cytochrome P450 metabolism and hence drug response, such as CYP3A4 moderate and strong inhibitors, which are contraindicated for use within 14 days prior to starting a novel formulation of fentanyl (Osborne et al., 2013).
SIGNAL DETECTION AND HYPOTHESIS TESTING
Signal detection and evaluation are the primary concerns of pharmacovigilance. Common to both standard and M-PEM study designs, several methods are applied for signal detection, both qual-itative and quantitative, not only to look for new unexpected adverse reactions, but also for further
MODIFIED PEM AND SUPPORT OF RISK MANAGEMENT 369
Table 22.2 Examples of applications of M-PEM methodology: completed studies.
Drug (n) Background Data collectionTargeted population or event surveillance Applications
UK license extended to treat mild to moderate chronic heart failure subject to supervision of hospital specialist
Patient demographics, treatment initiation and supervision, dose titration, severity of heart failure, pretreatment tests, past medical history, concomitant medication
Heart failure subgroup identified by initial eligibility questionnaire
Assessment of compliance with prescribing recommendations and clinical management guidelines post-license extension
Regulatory requirement to monitor introduction of CFC-free inhalers in Europe
Patient demographics, severity of indication, use of oral corticosteroids, spacer devices, and other respiratory treatments
Event rates compared for specific respiratory event rates (paradoxical bronchospasm) before and after starting CFC-free inhalers
Active surveillance post-formulation change from metered dose inhaler to CFC-free EvohalersTM
Identification of off-label use in COPD
Travoprost eye drops (Travatan™) (Davies et al., 2007) [Alcon Labs. UK Ltd] (n = 1441)
License extension to first-line use in the treatment of ocular hypertension in open-angle glaucoma granted in 2003
Patient demographics, hospital initiation and specific questions on the occurrence of abnormal eyelash growth, abnormal eyelid hair growth, and iris or periocular skin discoloration
Eligibility questionnaire used to identify population of patients who started treatment post-license extension
Incidence of specific ocular events reported in premarketing trials assessed
Active surveillance post-licence extension
Quantification and better understanding of specific events of interest
Modafinil (Provigil™) (Davies et al., 2013) [Cephalon (UK) Ltd.] (post-licence extension cohort; n = 1096)
License extended to include the treatment of “excessive sleepiness associated with chronic pathological conditions” in 2004. Low projected use
Prescribing patterns, plus selected aspects of patient management in terms of contraception. Data also collected on risk factors for cardiovascular and psychiatric adverse events and serious skin reactions
Subcohort of users identified post-license extension. Analyses further stratified by indication
Enhanced characterization of real-life drug use
Active surveillance post-license extension
(Continued)
370 MANN’S PHARMACOVIGILANCE
Drug (n) Background Data collectionTargeted population or event surveillance Applications
Anti-obesity drug launched in the UK in 2006 (product withdrawn from market during course of this study)
Patient demographic data, health status (body mass index, weight, smoking), past medical and psychiatric history and specific questions on events of depression, anxiety, insomnia and seizures
Comparison of specific psychiatric event rates occurring in the 6 months prior to and after starting treatment
Assessment of risk of specific psychiatric/nervous system events of regulatory concern
Smoking cessation therapy. Regulatory concern over psychiatric events (suicidal ideation)
Demographic data, past and current smoking habit, past medical history, current morbidities and reason for stopping (if stopped)
Focused time-to-event analysis on prespecified events of interest: myocardial infarction, depression, anxiety, aggression, suicidal ideation, and nonfatal self-harm
Characterization of real-life drug use
Hypothesis testing on pre-specified events of particular concern
Atomoxetine (Strattera™) (Davies et al., 2010) [Eli Lilly and Co. Ltd] (n = 5079)
Licensed for treatment of attention-deficit hyperactivity disorder. Regulatory concern over an increased risk of suicidal thinking (Layton et al., 2011)
Demographic data, prescribing patterns, targeted capture of data (both prior to and during usage) on psychiatric events, convulsions, abnormal liver function, and selected cardiovascular events
Matched cohort analysis on events of interest
Hypothesis testing on prespecified events of particular concern
Fentanyl buccal tablets (Effentora™) (Layton et al., 2011; Osborne et al., 2013) [Cephalon (UK) Ltd] (n = 556)
Launched in the UK in January 2009, licensed for the management of breakthrough pain in patients with cancer already receiving and tolerant to opioid therapy
Data collected on demographics, initiation of therapy (setting and titration) and past opioid use. Specific questions to identify potential misuse or inappropriate/off-label use
Targeted capture of data (both prior to and during usage), including respiratory, renal and hepatic conditions, and concomitant medication
Enhanced characterization of drug use and misuse
Specific evaluation of use of medicine in relation to concomitant medication or diseases that are contraindicated or where precautions are advised
Table 22.2 (Continued)
MODIFIED PEM AND SUPPORT OF RISK MANAGEMENT 371
Drug (n) Background Data collectionTargeted population or event surveillance Applications
Launched in the UK in 2010, licensed for the management of breakthrough pain in patients with cancer already receiving and tolerant to opioid therapy
Data collected on demographics, initiation of therapy (setting and titration) and past opioid use. Specific questions to identify potential misuse or inappropriate/off-label use
Targeted capture of data (both prior to and during usage), including respiratory, renal and hepatic conditions, and concomitant medication
Enhanced characterization of drug use and misuse
Specific evaluation of use of medicine in relation to concomitant medication or diseases that are contraindicated or where precautions are advised
Licensed in the UK in 2006 for treatment of chronic stable angina pectoris in patients with normal sinus rhythm, who have a contraindication or intolerance for β-blockers
Demographic data, information on treatment initiation, past medical history, current morbidities, contraindications for use, baseline and ongoing results of tests of heart rate and concomitant medications
Targeted data capture and analysis for selected ocular and cardiovascular events
Specific evaluation of use of ivabradine in relation to diseases/conditions that are contraindicated or where precaution is advised
Quantification and characterization of specific ocular and cardiovascular events of interest observed in premarketing clinical trials
Extended-release formulation licensed for the treatment of schizophrenia, manic episodes associated with bipolar disorder, or as add-on therapy for major depressive disorder
Data collected on demographics, use of medication that may cause somnolence or EPS and other risk factors for these events
Nested matched case–control study to explore relationship between dose and events of somnolence and EPS
Targeted data capture and analysis of pattern of events related to diabetes mellitus/metabolic syndrome over time
Hypothesis testing on prespecified events of particular concern in risk management plan
Once weekly injection launched in UK in April 2011 for treatment of diabetes mellitus
Data collected on demographics, initiation of therapy (setting and titration) and current/past antidiabetic medication use and adherence. Specific questions to identify risk factors for pancreatitis and gallstones
Targeted data capture and analysis of pattern of events related to diabetes and pancreatitis
Quantification and characterization of specific gastrointestinal events of interest observed in premarketing clinical trials
A novel atypical antipsychotic developed for treatment of moderate to severe manic episodes associated with bipolar disorder and schizophrenia
Data collected on demographics, initiation of therapy (setting and titration), and past antipsychotic use. Primary focus on somnolence and sedation, weight gain, oral hypoesthesia, swelling of the tongue and throat, and allergic reactions
Self-controlled case series study to explore temporal relationship between starting treatment and oral events
Targeted data capture and analysis time to event
Enhanced characterization of drug use and misuse
Specific evaluation of use of medicine in relation to concomitant medication or diseases that are contraindicated or where precautions are advised
Quantification and characterization of specific oral events of interest observed in premarketing clinical trials
A highly selective direct factor Xa indicated for the prevention of venous thromboembolism (VTE) in patients undergoing elective hip or knee replacements, prevention of stroke and systemic embolism in non-valvular atrial fibrillation (AF) and the treatment and prevention of deep vein thrombosis (DVT) and pulmonary embolism (PE)*
Data collected on patient demographics, medical history/ medication use, adherence, prescribing decisions. Primary focus on haemorrhagic events. Secondary foci on drug utilisation, off-label use and quantifying incidence of other events.
Specific evaluation of use in special populations
Targeted data capture and analysis time to event.
Quantification and characterization of haemorrhagic events and VTE events indicating failure of anticoagulation
*Also indicated for secondary prevention following an acute coronary syndrome in combination with aspirin alone or aspirin plus clopidogrel or ticlopidine.
MODIFIED PEM AND SUPPORT OF RISK MANAGEMENT 373
However, the principle statistic of interest IDt is the crude incidence density (ID) (or rate) that can be calculated for a given fixed time period t for all events reported in patients for a given time period, and expressed usually in units of first event reports per 1000 patient-months of treatment (or observa-tion). Since there are a large number of health out-comes of interest and the censoring would be different for each outcome, the denominator for the crude ID does not initially include censoring. These rates can be used to give estimates of the “real-world” frequency of reported events by estimating the cumulative incidence rate over fixed time periods. In standard PEM studies, these estimates are crude (unadjusted). For example, consider the standard PEM study of drospirinone/ethinyl estra-diol (Yasmin®), which identified 13 cases (five of deep vein thrombosis and eight of pulmonary embolism) in 15 645 females, each with possible risk factor(s). Applying complete case analysis, the crude incidence rate was 13.7 cases per 10 000 woman-years (95% confidence interval (CI): 7.3, 23.4) (Pearce et al., 2005). In the PEM study of strontium, which was an early example of modifica-tion collecting information on prior history of a targeted outcome (venous thromboembolism (VTE)), the crude annualized incidence of VTE was (95% Poisson exact CI) 6.24 (4.60–8.27) per 1000 patient-years strontium treatment (Osborne et al., 2010).
Compared with the “classic” cohort design with multiple exposure groups, the methodology is more efficient in terms of resources. However, the absence of data on a contextual comparator can, in some cases, be a limitation. To attempt to address this, it is possible to undertake calculations of measures of effect (risk or rate ratios) for internal comparisons within cohort according to time periods and/or between subgroups according to different defined particular characteristics, or external comparisons to carefully selected data sources. Again, common to both standard and M-PEM approaches, within-cohort estimates of crude ID rate differences or ratios can identify events that occur significantly more frequently soon after starting the study drug. The null hypothesis is that the incidence rates are constant between the two groups being compared; the alternative hypothesis is that the incidence rates
information regarding expected drug–adverse events associations of interest that might affect the benefit–risk balance of a drug. The M-PEM study design offers greater opportunity to systematically collect supplementary information at the patient level for the whole cohort, facilitating the investiga-tion and exploration of a range of additional research questions beyond that originally explored by the standard PEM approach.
INCIDENCE RISK AND INCIDENCE RATES (DENSITIES)
Both standard and M-PEM approaches enable analysis of longitudinal data and examination of temporal relationships of outcomes to new expo-sures. The methodological approach provides a numerator (the number of reports of an event), denominators not only in terms of the number of patients, but also number of patient-months of exposure to the drug, and a known time frame. This allows for event profiles over time to be examined through application of various statistical methods. In standard PEM, the scope for this analysis is limited to crude estimates, since information cannot be collected on all important risk factors that may be confounding factors for all outcomes because of the nature of the simple questionnaire design bal-anced with no remuneration to respondents. In M-PEM, additional information is collected for all patients within the cohort regarding relevant co-morbidities and other potential confounding factors, which can, through statistical modeling techniques, provide adjusted estimates for selected outcomes.
For both approaches, initial simple crude analy-sis of the incidence (risk) of events for an evaluable cohort by month by system organ class is an effec-tive descriptive method in which one may observe disproportionally higher counts than expected from summary of product characteristics or other drugs within the database. Examples of signals as seen in a standard PEM are gynaecomastia with finas-teride (Wilton et al., 1996) and hallucinations with tramadol (Dunn et al., 1997). An example seen in an M-PEM study is that of psychiatric events with varenicline (Buggy et al., 2013).
374 MANN’S PHARMACOVIGILANCE
high degree of correlation between these two sets of values. The values are presented for the standard PEM study of desloratadine in Table 22.4. These values can be used to compare and contrast drugs within one therapeutic class; for example, with anti-histamine drugs it shows that drowsiness and seda-tion are the most frequently reported events likely to be a drug side effect with levocetirizine, whereas this is far less common with desloratadine; simi-larly, lower respiratory tract infection (which occurs month in and month out in all cohorts and which is, with many drugs, unlikely to be related to either the drug or disease being treated) is fairly common among the ID values but virtually never appears among the common reasons for drug with -drawal. A more detailed exploration of associations between patient characteristics and reasons for stopping is possible within M-PEM. A recent example is the exploration of psychiatric events as reasons for treatment withdrawal for rimonabant (Willemen et al., 2012).
FURTHER QUANTITATIVE ENHANCEMENTS WITHIN MODIFIED PRESCRIPTION-EVENT MONITORING
For signal strengthening and exploration of specific safety issues, a key characteristic and advantage of M-PEM is the possibility to conduct comparisons, such as pre- and post-exposure periods, that help control for within-subject change in disease severity as well as reducing between-group differences. The bespoke M-PEM design offers greater scope for analysis within the cohort using self-controlled methodology, because it allows lines of enquiry about possible fixed and time-variant confounders.
Consider the ID rate or difference statistic. A significant result may be appear to be a safety signal arising for the product under study, but such events may be associated with the indication for treatment (confounding by indication), and/or or channeling (preferential prescribing to subsets of patients defined by specific characteristics, such as having a condition that is resistant to previous therapy) (Petri and Urquhart, 1991) and/or switching (past experience with an alternative drug may modify the risk of adverse events associated with current use of the study drug) (Ray, 2003). Examples include
are different. In rejecting the null hypothesis where substantial differences are observed, this could be explained by a number of factors, including drug treatment.
Most frequently, for signal generation purposes for general surveillance, for each reported event, the difference or ratio between time periods is calcu-lated to allow the examination of the null hypoth-esis; that is, the IDs in the first month after starting treatment and the IDs for months 2 to 6 (ID1 − ID2–6). A 95% CI is applied to the rate difference or ratio (based on the normal approximation). Thus, where the ID1 − ID2–6 value for an event is positive, or ID1/ID2–6 is above one and the confidence limits around the point estimate exclude the null value (zero or one respectively), the null hypothesis is rejected. This result can be considered to be a signal for an event associated with starting treatment with the study drug. If the rate of events in months 2 to 6 combined is considered to be significantly greater than during month 1, this result is considered to be a signal for a delayed-onset event. In comparing these two time periods, the assumption is made that, given an event, its reporting is equivalent in both periods in a fixed cohort. These signals then require confirmation or refutation by further study. An example of a signal as seen in standard PEM is the association of skin reactions with lamot -rigine (Mackay et al., 1997). For drugs where pattern of use is intermittent and/or short term, such summaries are also produced, but there are several differences. First, the numerator is based on total incident counts irrespective of treatment status (whether recorded during/post treatment or whether “unknown”) and the denominator takes into account the observation period (between start date and end of survey date). Second, the compara-tor (reference) period may be restricted. For example, in a standard PEM study of an antihista-mine (desloratadine) (Layton et al., 2009) intended for short term (<30 days) intermittent use, the second month was considered most appropriate as the reference period.
Other complementary quantitative analyses common to both standard and modified approaches include capturing information on and ranking by frequency the reasons for stopping and comparing with ranked IDs. In general, there appears to be a
MODIFIED PEM AND SUPPORT OF RISK MANAGEMENT 375
Table 22.4 Most frequently reported events during first 2 months of observation with the two antihistamine drugs desloratadine and levocetirizine, ranked in order of counts in first month N1.
Desloratadine Levocetirizine
DSRU dictionary higher term N1 N2 RFS DSRU dictionary higher term N1 N2 RFS
N1: total number of first reports of each event during observation in month 1; N2: total number of first reports of each event during observation in month 2. RFS: reasons for stopping.Desloratadine: total no. reports 3969 during months 1 and 2 of observation out of 5559 reports for whole study period in 5502 patients (46.5% of cohort) for whole study period.Levocetirizine: total no. reports 3732 during months 1 and 2 of observation out of 5509 reports for whole study period in 5453 patients (44.1% of cohort).aUnspecified: no event term currently exists in DSRU dictionary.
health outcomes and the population to whom the results may be applicable. Examples of particular design and analytical applications nested within M-PEM studies are provided below.
Drug Utilization
Drug utilization research describes the extent, nature, and determinants of drug exposure at the patient level. Data from M-PEM studies can inform about prescriber adoption of new drugs. The demo-graphic and clinical characteristics of new users can be described and examined in relation to signals of off-label use; for example, indications, dose, and conditions or other factors that are contraindicated or special warnings for use. An example is the M-PEM study of ivabradine (which is licensed for
paradoxical increase in rates of gastrointestinal adverse effects in users of COX-2-selective inhibi-tors at high baseline risk of gastrointestinal adverse effects. Selection bias introduced by these phenom-ena may affect the generalizability of the study results since the evaluable cohort may not be fully representative of the postmarketing users of the product. Other factors that may introduce selection bias are external influences on prescribing (such as expert committee guidelines and/or decisions for reimbursement). In M-PEM, whilst prescribing patterns of a new drug cannot be predicted or con-trolled for, the issues of prescribing governance, channeling, and influence of previous therapy can be examined through careful data capture and a variety of analytical methods to provide a better understanding of the cohort characteristics and
376 MANN’S PHARMACOVIGILANCE
The method itself overcomes some of the disadvan-tages associated with non-nested case–control studies while incorporating some of the advantages of a cohort study (Flanders and Louv, 1986). As a pharmacoepidemiologic tool for risk management plans, the design potentially offers reductions in costs and efforts of data collection and analysis compared with the full cohort approach, with rela-tively minor loss in statistical efficiency. M-PEM cohorts provide opportunities to conduct such nested case–control studies, for example, for patients who develop selected ADRs and matched patients who receive the same drug without devel-oping ADRs. Two prospectively designed nested case–control studies are underway to investigate the association between dose and the occurrence of two outcomes (extrapyramidal symptoms; somno-lence and sedation) in users of a new formulation of an atypical antipsychotic (ENCEPP, n.d.e).
Self-Controlled Case Series Analysis
Other methodologic developments that are being introduced to M-PEM studies to examine temporal associations between specific events of interest and starting treatment with a new drug include the application of the method of self-controlled case series studies proposed by Farrington et al. (1996). The method was originally developed to study adverse reactions to vaccines. The method uses only cases; no separate controls are required as the cases act as their own controls, thus minimizing the effect of confounding by factors that do not vary with time, such as genetics and gender. Each case’s given observation time is divided into control and risk periods. Time-varying confounding factors such as age can be allowed for by dividing up the observa-tion period further into age categories. Because the method requires time-varying covariate data on cases only and not for the whole cohort, it is effi-cient in terms of sample size and resource. The method requires that specific criteria are met (for example, occurrence of the event of interest should not affect subsequent exposure history or increase mortality) and thus is not applicable to all out-comes. Using this approach, measures of effect (risk or rate ratio estimates) are automatically adjusted for all fixed confounders. Non-cases can
chronic stable angina) and its utilization in patients under 40 years of age, in which use for other indica-tions was observed since the prevalence of angina (which is the indication for this product) is low in this age group (Doe et al., 2010). In addition, M-PEM studies can examine aspects of adherence to prescribing guidelines. One M-PEM study is underway to explore the impact of expert guide-lines on adoption within clinical practice of a novel anticoagulant (ENCePP, n.d.c; Layton et al., 2013).
Before and After Studies
“Before and after” studies compare the rate of par-ticular outcomes during a defined period of expo-sure (or observation) after starting the study drug with those rates in the same individuals during a defined period of observation before starting, using a repeated-measures matched-pair analysis. The null hypothesis is that event rates are the same prior and post starting treatment. One example within an M-PEM study was the examination of rates of res-piratory events with the introduction a CFC-free formulation of an anticholinergic (ipratropium) metered dose inhaler (MDI) in populations who were “switchers” from the original MDI and those naive to ipratropium treatment (Osborne et al., 2011). The analyses suggested that characteristics of these two subpopulations differed such that naive patients were more likely to be children, have an indication of asthma, and have milder disease severity, while switchers were more likely to be adults, have an indication of COPD, and have more severe disease. Such differences have an important impact on ongoing evaluation of risk–benefit balance of the new formulation. The matched anal-ysis in each subset revealed that, in naive patients, dyspnea was shown to be significantly lower in the “before” reference period (relative risk (RR) 0.6 (95% CI 0.40, 0.88) for post- versus pre-treatment), while dyspnea for switchers was shown to be signifi-cantly higher in the “after” high-risk period (RR 1.46 (95% CI 1.02, 1.81)).
Predictors of Risk
The nested case–control design is particularly advantageous for examining predictors of disease.
MODIFIED PEM AND SUPPORT OF RISK MANAGEMENT 377
important antidiabetic drugs. The null hypothesis was that the risk of these outcomes was the same regardless of treatment. Pioglitazone may be used alone or in combination with a sulfonylurea, metformin, or insulin as an adjunct to diet and exercise for the management of type 2 (noninsulin-dependent) diabetes mellitus. Though the combina-tion of pioglitazone and insulin is licensed and allows improvement of glycemic control, this com-bination is associated with increased risk of edema and may cause weight gain. The adjusted hazard ratios for each of the separate models based on PEM study data for patients taking pioglitazone–insulin combination compared with those taking pioglitazone monotherapy and/or pioglitazone with another antidiabetic (sulfonylurea or met-formin) were: edema 2.28 (95% CI: 1.37, 3.78); weight gain 2.03 (95% CI: 1.15, 3.58), and cardiac failure 1.73 (95% CI: 0.63, 4.74). This suggests that patients taking the pioglitazone–insulin combina-tion had higher risks than pioglitazone mono-therapy or pioglitazone combined with another antidiabetic drug.
ASSESSMENT OF THE EFFECTIVENESS OF RISK MANAGEMENT (RISK MINIMIZATION) PROGRAMS
Risk management is attracting immense interest in pharmacovigilance. M-PEM methodology contrib-utes not only to the identification and measurement of risks of medicines, but, with some additions, can also examine how the risks of medicines are being managed in real-world clinical settings. An example is theM-PEM study that was conducted to monitor the introduction of carvedilol for the treat-ment of cardiac failure (Aurich-Barrera et al., 2009). The product (combined alpha- and beta-adrenergic blockers) has been used for the treat-ment of angina and hypertension for some time, but there was concern about its appropriate use for cardiac failure in the community. The aim of the study was to monitor how the product is being managed in the community; for example: What investigations were undertaken prior to starting the drug? Who supervised the dose titration (GP or specialist)? Was the drug given to patients with the appropriate severity of heart failure? The design
be ignored without bias, while cases are self-matched. Conditional regression modeling will provide the adjusted estimate of relative incidence (with 95% CIs) of the outcome for the high-risk observation period of interest relative to the remain-ing observation time. M-PEM studies provide an ideal platform to enable the relative incidence of newly diagnosed outcomes of interest to be studied between predefined high- and low-risk periods in new users, thus enabling time-to-occurrence of selected events to be explored and reviewed for evi-dence of temporal patterns (ENCePP, n.d.b).
Time to Event Analysis
It is acknowledged in signal detection that the gen-eralized approach to segregation of time periods may not be appropriate for all events with respect to their most relevant time periods of excess. However, it is possible to explore the time of occur-rence of an event by using statistical methods, termed “time to event” analysis, based on survival methodology. Using these methods, a hazard func-tion can be estimated using an appropriate distribu-tion (e.g., Weibull) that shows the instantaneous risk of an event over time. The use of this technique is now incorporated within M-PEM studies to explore temporal relationships for targeted events of interest as an additional tool for signal genera-tion purposes. Examples include calculation of smoothed hazard functions in examining rates of hypoglycemia in thiazolidinedione antidiabetic drugs (Vlckova et al., 2009) and neuropsychiatric outcomes associated with varenicline (Buggy et al., 2013).
Modeling
Multiple regression modeling allows the simultane-ous testing and modeling of multiple independent variables on an outcome of interest. An example of a conditional logistic regression modeling was a within-PEM study comparison to examine the risk of pioglitazone treatment combinations (with insulin or other antidiabetic agents) on risk of edema, weight gain, cardiac failure, and anemia (Kasliwal et al., 2008). This was a standard PEM with modification to include history of use of
378 MANN’S PHARMACOVIGILANCE
dence of risk of 7.00 per 1000 patients (Wilton et al., 1999). Other events that routinely undergo evaluation include pregnancies and deaths. Data collected from reported pregnancies include the proportion and nature of congenital anomalies in babies born to women exposed to newly marketed drugs during pregnancy, in particular in the first trimester (Wilton et al., 1997). All deaths are fol-lowed up to ascertain cause of death where cause has not been reported.
SIGNAL STRENGTHENING
Signal strengthening can also be conducted through a variety of comparisons using selections of the PEM database (within therapeutic class, specific patient groups) (Layton et al., 2001, 2004, 2006; Acharya et al., 2005). Such comparisons are appro-priate because the database is comprised of new drug-user populations assembled at the same stage in time in the immediate postmarketing period since introduction of each product. As described previously, it is also possible to conduct external comparisons using demographic data of the popu-lation as a whole (Boshier et al., 2004).
The DSRU also receives requests from regula-tory authorities and manufacturers to investigate drug safety signals in the PEM database. Whenever possible the DSRU conducts retrospective analyses (which usually include follow up of reports for the drug in question and comparator drugs). Such analyses contribute to the debates on these signals and to regulatory and public health decisions. One example used data from a standard PEM study on sertindole (Wilton et al., 2001). Sertindole is an atypical antipsychotic known to be associated with prolongation of the QTc interval. The product was withdrawn from markets in the EU following reports of sudden death and serious cardiac arrhythmias. The comparative analyses of the PEM studies of sertindole and two other atypical antip-sychotics, risperidone and olanzapine, studied car-diovascular events, deaths from cardiovascular events, and deaths from other causes (such as suicide) and were considered to be a very important source of information for the regulatory decision on the matter. Other M-PEM studies where results informed regulatory decisions regarding ongoing
included sending an eligibility questionnaire fol-lowed by up to three detailed questionnaires for a period of up to 2 years.
EXPLORATION OF SIGNALS AND FOLLOW-UP OF IMPORTANT EVENTS
Analysis and evaluation of pharmacoepidemiologi-cal data should include medical assessment, both to improve the understanding of signals raised by epidemiological techniques and to raise (and evalu-ate) new signals or hypotheses by using medical judgment with appropriate systems for causal infer-ence. Once a signal has been recognized through either the standard or M-PEM approach, supple-mentary analysis is required to further characterize important attributes. Medical evaluation of reports is an important component. Further information on events of interest and/or signals may be obtained from the prescriber and a case series constructed. As highlighted previously, M-PEM design provides the opportunity for the collection of detailed infor-mation on targeted events of interest from the initial survey for the evaluable cohort, as opposed to case-only information for standard PEM studies.
Important safety signals have been generated and events of interest explored in this way. In the standard PEM study of the anti-epileptic drug vigabatrin, following published case reports of visual field defects associated with the use of the product, four cases of visual field defects were iden-tified initially in the PEM cohort. In view of the importance of the signal, 7228 patients who were reported to be taking the product by the end of the study were followed up by sending a simple ques-tionnaire to the GP to ask whether any serious adverse events or changes in vision had been reported since the initial study form had been returned. In addition, if the patient has been seen by an ophthalmologist for visual problems, the ophthalmologist was asked to complete a question-naire giving details of visual field testing before and during treatment with vigabatrin. In addition to the initial four reports, the follow-up information revealed 29 cases of visual field defects that were considered by the ophthalmologist to be probably or possibly related to vigabatrin, giving an inci-
MODIFIED PEM AND SUPPORT OF RISK MANAGEMENT 379
contributing to the monitoring of overall safety of newly marketed medicines as used in real-life clini-cal practice. M-PEM studies combine the advan-tages of standard PEM studies (in monitoring general safety and identification of unexpected risks of a medicine) with that of a more targeted safety study that addresses specific questions (to better understand known or partially known risks with a medicine).
The disadvantages and limitations of the meth-odology, like those of most of the available tech-niques of pharmacovigilance, are however real. They include the following:
1 Selection bias is possible, in that there is the potential that the PEM cohort is not representa-tive of the general population using NHS serv-ices. This cannot be assessed because PEM does not monitor an unexposed cohort concurrently. Non-response bias is another form of selection bias that is possible, since not all questionnaires sent are returned. The mean returns of the stand-ard PEM and M-PEM questionnaires sent out are 56% and 60%, respectively. These are signifi-cantly higher than the reporting rate in the yellow card and similar schemes (Heeley et al., 2001; Hazell and Shakir, 2006), but it cannot be estab-lished in each PEM study whether the patients whose doctors return the questionnaires are in any way different from those whose doctors fail to complete and return the questionnaire. We already know that the responding and nonre-sponding GPs differ very little in the distribution of ages in which they became principals or in their geographical distribution (Mackay, 1998; Key et al., 2002).
2 Until recently, the methodology did not involve monitoring within the secondary care setting. Thus, a “survivor bias” can operate whereby patients who both started and stopped a drug under hospital care may never receive a GP pre-scription and may, therefore, be undetected by PEM. None of the current methods of pharma-covigilance is ideal in respect of this problem – hence the importance of extending PEM methodology into hospital practice. The DSRU has adapted the principle method to examine drug initiations by specialists in the secondary
benefit–risk evaluations included those examining cardiovascular and gastrointestinal safety of COX-2 selective inhibitors (Kasliwal et al., 2005).
Where appropriate, comparisons are made between patients identified within an evaluable cohort and an external reference group, if a suitable internal reference cohort cannot be found within the DSRU database and the research question requires the result to be contextual. An example is the analysis of cardiovascular events of the PEM study on sildenafil (a phosphodiesterase type 5 inhibitor used for erectile dysfunction) (Boshier et al., 2004). Reported deaths from myocardial inf-arction and ischemic heart disease in users of silde-nafil in the PEM study were found to be no higher than expected according to national mortality sta-tistics. Similarly, death from ischemic heart disease in the bupropion PEM (when used for smoking cessation) was compared with external data and showed no difference in the standardized mortality ratio (Boshier et al., 2003). The precautions with regard to possible sources of bias and confounding also apply to external comparisons, principally due to differences in study design and data collection methods. Therefore, results of external compari-sons must be interpreted very carefully.
While such comparisons produce valuable addi-tions to the understanding of the safety of medi-cines, it is important to emphasize that comparisons of independent cohorts are subject to bias and con-founding that must be taken into consideration in the analysis and evaluation process. However, the paucity of postmarketing safety studies in large populations makes the information provided by these comparative studies very useful. Real benefit can only be achieved when not only the limitations of any postmarketing safety study are taken into consideration, but also when its results are consid-ered in relation to other studies that had been con-ducted on the same product.
DISCUSSION
PEM, and its modern replacement M-PEM, is a well-established postmarketing surveillance tech-nique in England, and internationally recognized as a tool for pharmacovigilance and risk management
380 MANN’S PHARMACOVIGILANCE
is between capturing the real-world and general-izable data through the observational design and randomization in clinical trials that in postmar-keting settings have many logistical and even ethical difficulties, as well as limited external validity caused by exclusion criteria and other restrictions.
5 One of the strengths of the PEM/M-PEM tech-nique is that it collects dispensed rather than prescribed data. This is in contrast to other data sources, such as data collected in the General Practice Research Database. However, while indeed compliance is not examined routinely in PEM/M-PEM, it is possible, if necessary, to monitor repeated dispensing for the same patient as an indicator of compliance and provide esti-mates of compliance with treatment regimen by calculating medication possession ratios.
The advantages of PEM and M-PEM are:
1 It is noninterventional, and thereby minimizes the selection biases that occur when the study design interferes with the doctor’s choice of drug for the individual patient. This means that in PEM/M-PEM, data are collected on patients who have received the study drug because the doctor considered it the most appropriate treat-ment for that patient, as in everyday “real-world” clinical practice.
2 It is national in scale, and the cohort comprises all patients given the drug usually immediately after its launch into general practice. In Europe it is the only database that can regularly identify cohorts of thousands of patients for newly introduced medicines soon after launch. This is in contrast to some data sources that have limited data on newly marketed products in this immediate postmarketing period because of small size of because of population exposed in the subset of the population monitored within these systems. The methodology prompts all prescribers to provide information on safety and use because they automatically receive a ques-tionnaire for each patient prescribed the drug being monitored. It is probably this prompting function that is responsible for the success of the methodology; it does not rely on the doctor
care setting (DSRU, 2013). An example of the specialist cohort event monitoring (SCEM) design is the Observational Assessment of Safety in Seroquel (OASIS) study (ENCEPP n.d.f). This was designed to examine the short-term (up to 12 weeks) safety and use of quetiapine fumarate in a prolonged-release formulation (Seroquel XL™), along with a comparator group started on the quetiapine immediate-release (IR) formulation. Any patient seen by a psychiatrist in England in the mental health care setting was considered eligible for inclusion where a clinical decision was made to prescribe either the XL or IR prepara-tion of quetiapine as part of normal clinical prac-tice for schizophrenia or mania associated with bipolar disorder. Other SCEM studies are under-way as PASS that support RMP (ENCePP, 2013; ENCEPP n.d.d.; Layton et al., 2013). The SCEM methodology facilitates the systematic collection and reporting of safety and utilization data on patients newly initiated within the secondary care setting and, thus, is complementary to M-PEM PASS, which are based in primary care.
3 Like other observational studies, PEM has limited ability to collect information on con-founding factors that might be important for all possible outcomes. The adoption of M-PEM methods has provided considerable opportuni-ties to enhance collection of supplementary data on important risk factors. Furthermore, as described earlier, new techniques are being introduced to examine temporal associations, such as the application of the methods of self-controlled case series studies. However, even without analysis, lists of reported events are useful to prescribing doctors for they show which events are reported in everyday clinical practice and the relative frequency with which these events will be seen. They are perhaps more useful than the unquantified long lists of pos-sible side effects given in the standard prescrib-ing information.
4 Whilst efficient in terms of resources, the single-group cohort design where evaluable patients are included on the basis of a single common expo-sure has the limitation that there is absence of an unexposed comparator. Thus, comparisons need to be undertaken with great care. The “trade-off”
MODIFIED PEM AND SUPPORT OF RISK MANAGEMENT 381
hazards and to further evaluate safety concerns identified by other pharmacovigilance methods or arising from regulatory concerns. Their cus-tomized sample size is advantageous in terms of study conduct, limiting costs, and providing timely information to the dynamic risk manage-ment process. Thus, they should be considered a valuable tool when developing a risk manage-ment plan for the evaluation of the safety a new medicine.
7 M-PEM contributes to risk management plans not only by the analysis and understanding of possible adverse events, including those consid-ered to be potential and identified risks in risk management plans, but also by providing oppor-tunities for studying drug utilization to answer questions regarding missing information and the characteristics of postmarketing users of medi-cines. Furthermore, M-PEM is being used to study the effectiveness of risk minimization methods.
FUTURE PLANS
The mission of the DSRU is to continue to improve its research methods and foster the conduct of innovative national and international collaborative research.
ACKNOWLEDGMENTS
Special gratitude goes to Professor Ron Mann for allowing the use material from the previous editions.
REFERENCES
Acharya, N.V., Pickering, R.M., Wilton, L.W., & Shakir, S.A. (2005) The safety and effectiveness of newer antiepileptics: a comparative postmarketing cohort study. J Clin Pharmacol, 45 (4), 385–393.
Aurich-Barrera, B., Wilton, L.V., & Shakir, S.A. (2009) Use and risk management of carvedilol for the treat-ment of heart failure in the community in England:
taking the initiative to report happenings. These features ensure that the studies are population based and that they disclose the real-life clinical experience with the drug; there are no exclu-sions, and all patients prescribed the drug are recruited even if they are very old, very young, or receiving several drugs concurrently for mul-tiple illnesses.
3 Exposure data are derived from dispensed pre-scriptions, with validation from prescribers through confirmation of such data on the ques-tionnaires. Considering the large proportion of patients who do not get a prescription dispensed (Beardon et al., 1993), this is an advantage in that exposure data are more accurate than that derived from records of physician-issued pre-scriptions (which are not always dispensed), as held in some databases.
4 Because the data are concerned with events, the system could detect side effects that none of the doctors have suspected to be due to the drug. The information provided by event reporting does not require the doctor to decide whether or not an individual event in a single patient is drug related. It thereby avoids a very difficult clinical decision, since as most reactions resemble fairly common clinical events, avoiding the doctor having to decide on causation may well encour-age reporting. The system allows direct contact between the doctors working in the DSRU and the GPs, so that follow-up surveillance of individual cases (including long-latency events) or deaths and all pregnancies is facilitated.
5 Additional advantages accrue from the increas-ing size of the PEM database, which has been built up since 1984. The database now contains information on 120 completed PEM/M-PEM studies and over 1 million patients. This has started to provide opportunities for comparing products and patient groups in the database. As time passes and more studies are completed, the value of the database as a research tool increases progressively.
6 A number of M-PEM studies have been under-taken to support the construction of risk man-agement plans by providing opportunities for a number of additional research applications that can be used to generate signals of potential safety
382 MANN’S PHARMACOVIGILANCE
Multi-centre research in the NHS – the process of ethical review when there is no local researcher. Department of Health. URL http://webarchive .nationalarchives.gov.uk/20130107105354/ [accessed 10 December 2013].
DSRU (2013) Studies in Secondary Care. URL: http://www.dsru.org/studies-for-risk-management/studies -in-specialist-hospital-care [accessed 23 January 2014].
Dunn, N., Wilton, L.V., Pearce, G., & Mann, R.D. (1997) The incidence of hallucinations associated with trama-dol. Pharmacoepidemiol Drug Saf, 6 (Suppl. 2), abstract 042.
EMA (2012) Guideline on good pharmacovigilance prac-tices. Module VIII –Post-authorisation studies, EMA/330405/2012, European Medicines Agency. URL http://www.ema.europa.eu/docs/en_GB/document_library/Scientific_guideline/2012/06/WC500129137 .pdf Date [accessed on 20 July 2012].
EMA (n.d.) Good pharmacovigilance practices. URL http://www.ema.europa.eu/ema/index.jsp?curl=pages/regulation/document_listing/document_listing _000345.jsp [accessed on 23 December 2013].
ENCePP (2013) ENCePP E-Register of Studies. DSRU. An observational post-authorisation safety specialist cohort monitoring study (SCEM) to monitor the safety and utilisation of asenapine (Sycrest™) in the mental health trust setting in England. URL: http://www.encepp.eu/encepp/studiesDatabase.jsp.
ENCePP (n.d.a) ENCePP E-Register of Studies. DSRU. An observational post-authorization modified prescription–event monitoring safety study to monitor the safety and utilization of exenatide once weekly (Bydureon™) in the primary care setting in England. URL http://www.encepp.eu/encepp./studiesDatabase .jsp.
ENCePP (n.d.b) ENCePP E-Register of Studies. DSRU. An observational post-authorization modified prescription–event monitoring safety study to monitor the safety and utilization of asenapine (Sycrest™) in the primary care setting in England. URL http://www.encepp.eu/encepp./studiesDatabase.jsp.
ENCePP (n.d.c) ENCePP E-Register of Studies. DSRU. An observational post-authorization modified prescription–event monitoring safety study to monitor the safety and utilization of rivaroxaban (Xarelto™) in the primary care setting in England. URL http://www.encepp.eu/encepp./studiesDatabase.jsp.
ENCEPP (n.d.d). ENCePP E-register of Studies. DSRU. An Observational Post-Authorization Safety Specialist Cohort Event Monitoring Study (SCEM) to Monitor the Safety and Utilization of Rivaroxaban (XareltoTM) for the Prevention of Stroke in Patients with AF, Treat-ment of DVT and PE, and the Prevention of Recurrent DVT and PE in the Secondary Care Hospital Setting in England and Wales. URL http://www.encepp.eu/encepp/studiesDatabase.jsp
results from a modified prescription-event monitoring study. Drug Saf, 32 (1), 43–54.
Beardon, P.H., McGilchrist, M.M., McKendrick, A.D. et al. (1993) Primary non-compliance with pre -scribed medication in primary care. BMJ, 307 (6908), 846–848.
BMA (2006) Reporting Adverse Drug Reactions. A Guide for Healthcare Professionals. British Medical Associa-tion Board of Science, British Medical Associa -tion Science & Education, London. URL http://bmaopac.hosted.exlibrisgroup.com/exlibris/aleph/a21_1/apache_media/GYVFNJ1RT2PFNDUJ8IUK PUNTFVRF8G.pdf [accessed on 10 December 2013].
Boshier, A., Wilton, L.V., & Shakir, S.A. (2003) Evalua-tion of the safety of bupropion (Zyban) for smoking cessation from experience gained in general practice use in England in 2000. Eur J Clin Pharmacol, 59 (10), 767–773.
Boshier, A., Wilton, L.V., & Shakir, S.A. (2004) Evalua-tion of the safety of sildenafil for male erectile dysfunc-tion: experience gained in general practice use in England in 1999. BJU Int, 93 (6), 796–801.
Buggy, Y., Cornelius, V., Wilton, L., & Shakir, S.A. (2011) Risk of depressive episodes with rimonabant: a before and after modified prescription event monitor-ing study conducted in England. Drug Saf, 34 (6), 501–509.
Buggy, Y., Cornelius, V., Fogg, C. et al. (2013) Neuropsy-chiatric events with varenicline: a modified prescription-event monitoring study in general practice. Drug Saf, 36 (7), 521–531.
CIOMS & WHO (2002) International Ethical Guidelines for Biomedical Research Involving Human Subjects. Council for International Organizations of Medical Sciences(CIOMS) and World Health Organiza -tion (WHO), Geneva. URL http://www.cioms.ch/publications/layout_guide2002.pdf [accessed on 10 December 2013].
Davies, M.N., Paiba, N., Wilton, L.W., & Shakir, S.A.W. (2007) A 12 month modified prescription-event moni-toring report for travoprost. Drug Saf, 30 (10), 919–990 (abstract P.020).
Davies, M., Tong, E., Fogg, C. et al. (2010) Atomoxetine end of modified PEM study report. Drug Safety Research Unit, Southampton.
Davies, M., Wilton, L., & Shakir, S. (2013) Safety profile of modafinil across a range of prescribing indications, including off-label use, in a primary care setting in England: results of a modified prescription-event mon-itoring study. Drug Saf, 36 (4), 237–246.
Doe, C., Fogg, C., Layton, D., & Shakir, S.A.W. (2010) Interim results of a modified prescription event moni-toring study on ivabradine: case series of utilisation in patients under the age of 40 years. Pharmacoepidemiol Drug Saf, 19 (Suppl. 1), abstract 330.
DOH (2000) Supplementary operational guidelines for NHS research ethics committees – November 2000.
doctors in a prescription event monitoring study of drug safety. Pharmacoepidemiol Drug Saf, 11 (2), 143–148.
Layton, D. & Shakir, S.A.W. (2011) Prescription-event monitoring. In: B.L. Strom, S.E. Kimmel, & S. Hen-nessy (eds), Pharmacoepidemiology, 5 edn, pp. 301–330. John Wiley & Sons, Ltd, Chichester.
Layton, D., Clark, D.W., Pearce, G.L., & Shakir, S.A. (2001) Is there an association between selective serot-onin reuptake inhibitors and risk of abnormal bleed-ing? Results from a cohort study based on prescription event monitoring in England. Eur J Clin Pharmacol, 57 (2), 167–176.
Layton, D., Heeley, E., & Shakir, S.A.W. (2004) Identifi-cation and evaluation of a possible signal of exacerba-tion of colitis during rofecoxib treatment, using prescription-event monitoring (PEM) data. J Clin Pharm Ther, 29 (2) 171–181.
Layton, D., Wilton, L., Boshier, A. et al. (2006) Com-parison of the risk of drowsiness and sedation between levocetirizine and desloratadine: a prescription-event monitoring study in England. Drug Saf, 29 (10), 897–909.
Layton, D., Wilton, L., & Shakir, S.A. (2009) Examining the tolerability of the non-sedating antihistamine desloratadine: a prescription-event monitoring study in England. Drug Saf, 32 (2), 169–179.
Layton, D., Osborne, V., Al-Shukri, M., & Shakir, S.A.W. (2011) Indicators of dependence and aberrant behav-iours during post-marketing use of fentanyl buccal tablets: risk scores in support of risk management [abstract OP22]. In: 11th Annual Conference of the International Society of Pharmacovigilance (ISOP), 26–28 October, Istanbul, Turkey.
Layton, D., Davies, M., Evans, A., & Shakir, S.A.W. (2013) Methodological considerations in evaluating the safety of novel anticoagulants in secondary care setting in the UK: defining the contextual comparator cohort. Pharmacoepidemiol Drug Saf, 22 (Suppl. 1), abstract 216.
Machin, D., Campbell, M., Fayers, P. & Pinol, A. (1997) Sample Size Tables for Clinical Studies. Blackwell Science, Ltd, Oxford.
Mackay, F.J. (1998) Post-marketing studies: the work of the Drug Safety Research Unit. Drug Saf, 19 (5), 343–353.
Mackay, F.J., Wilton, L.V., Pearce, G.L. et al. (1997) Safety of long-term lamotrigine in epilepsy. Epilepsia, 38 (8), 881–886.
Martin, R.M., Biswas, P., & Mann, R.D. (2000) The incidence of adverse events and risk factors for upper gastrointestinal disorders associated with meloxicam use amongst 19,087 patients in general practice in England: cohort study. Br J Clin Pharmacol, 50 (1), 35–42.
Osborne, V., Layton, D., Perrio, M. et al. (2010) Incidence of venous thromboembolism in users of
ENCEPP (n.d.e). ENCePP E-register of Studies. DSRU. Modified Prescription-Event-Monitoring Study on Extended-Release Quetiapine (Seroquel XL™) . URL http://www.encepp.eu/encepp/studiesDatabase.jsp
ENCEPP (n.d.f). ENCePP E-register of Studies. DSRU. Observational Assessment of Safety in Seroquel (OASIS) Study. URL http://www.encepp.eu/encepp/studiesDatabase.jsp
Farrington, C.P., Nash, J., & Miller, E. (1996) Case series analysis of adverse reactions to vaccines: a comparative evaluation. Am J Epidemiol, 143 (11), 1165–1173.
Flanders, W.D. & Louv, W.C. (1986) The exposure odds ratio in nested case–control studies with competing risks. Am J Epidemiol, 124 (4), 684–692.
Freemantle, S.N., Pearce, G.L., Wilton, L.W. et al. (1997) The incidence of the most commonly reported events with 40 newly marketed drugs – study by prescription-event monitoring. Pharmacoepidemiol Drug Saf, 6 (Suppl. 1), 1–8.
GMC (2013) Good Medical Practice. General Medical Council. URL http://www.gmc-uk.org/Prescribing_Guidance__2013__50955425.pdf [accessed on 23 December 2013].
Hazell, L. & Shakir, S.A. (2006) Under-reporting of adverse drug reactions: a systematic review. Drug Saf, 29 (5), 385–396.
Health Research Authority (n.d.) Confidentiality Advi-sory Group advice and approval decisions. Prescription–event monitoring, CAG ref: ECC 5-07(b)/2009. URL: http://www.hra.nhs.uk/about-the-hra/our-committees/section-251/cag-advice-and-approval-decisions/ [accessed on 23 December 2013].
Heeley, E., Riley, J., Layton, D. et al. (2001) Prescription-event monitoring and reporting of adverse drug reac-tions. Lancet, 358 (9296), 1872–1873.
ICH (2003) ICH Harmonised Tripartite Guideline. Post-Approval Safety Data Management: Definitions and Standards for Expedited Reporting E2D. The Interna-tional Conference on Harmonisation of Technical Requirements for Registration of Pharmaceuticals for Human Use, Geneva.
Kasliwal, R., Layton, D., Harris, S. et al. (2005) A com-parison of reported gastrointestinal and thromboem-bolic events between rofecoxib and celecoxib using observational data. Drug Saf, 28 (9), 803–816.
Kasliwal, R., Cornelius, V., Wilton, L.W., & Shakir, S.A.W. (2008) Combined pioglitazone-insulin use: analysis from the pioglitazone PEM study. Phar-macoepidemiol Drug Saf, 17 (Suppl. 1), abstract 255.
Kasliwal, R., Wilton, L.V., & Shakir, S.A. (2009) Safety and drug utilization profile of varenicline as used in general practice in England: interim results from a prescription-event monitoring study. Drug Saf, 32 (6), 499–507.
Key, C., Layton, D., & Shakir, S.A. (2002) Results of a postal survey of the reasons for non-response by
Shakir, S.A., Wilton, L.V., Boshier, A. et al. (2001) Car-diovascular events in users of sildenafil: results from first phase of prescription event monitoring in England. BMJ, 322 (7287), 651–652.
Strom, B. (1994) Sample size considerations for pharma-coepidemiology studies. In: B. Strom (ed.), Pharma-coepidemiology, 2nd edn. John Wiley & Sons, Ltd, Chichester.
Vlckova, V., Cornelius, V., Kasliwal, R. et al. (2009) Hypoglycaemia with oral antidiabetic drugs: results from prescription-event monitoring cohorts of rosigli-tazone, pioglitazone, nateglinide and repaglinide. Drug Saf, 32 (5), 409–418.
Willemen, M., Mantel-Teeuwisse, A.K., Buggy, Y. et al. (2012) Reasons for and time to discontinuation of rimonabant therapy. Drug Saf, 35 (12), 1147–1158.
Wilton, L., Pearce, G., Edet, E. et al. (1996) The safety of finasteride used in benign prostatic hypertrophy: a non-interventional observational cohort study in 14,772 patients. Br J Urol, 78 (3), 379–384.
Wilton, L.V., Mackay, F., Pearce, G., & Mann, R.D. (1997) The outcomes of pregnancy in women pre-scribed newly marketed drugs in 24 studies con -ducted by prescription–event monitoring (PEM). Pharmacoepidemiol Drug Saf, 6 (Suppl. 2), abstract 072.
Wilton, L.V., Heeley, E.L., Pickering, R.M., & Shakir, S.A. (2001) Comparative study of mortality rates and cardiac dysrhythmias in post-marketing surveillance studies of sertindole and two other atypical antipsy-chotic drugs, risperidone and olanzapine. J Psychop-harmacol, 15 (2), 120–126.
strontium ranelate: an analysis of data from a prescription-event monitoring study in England. Drug Saf, 33 (7), 579–591.
Osborne, V., Layton, D., Tong, E., & Shakir, S.A.W. (2011) Safety of Atrovent® CFC-free MDI (metered dose inhaler): an example of protopathic bias in obser-vational cohort studies. Pharmacoepidemiol Drug Saf, 20 (Suppl. 1), abstract 305.
Osborne, V., Al-Shukri, M., Gilchrist, A. et al. (2013) A modified prescription event monitoring study on fen-tanyl pectin nasal spray (PecFent®) for the manage-ment of breakthrough cancer pain. Final Study Report. Drug Safety Research Unit, Southampton.
Osborne, V., Layton, D., Fogg, C. et al. (2013) Utilisation of fentanyl buccal tablets in England: exploring off-label use reported in a cohort study. Eur J Pain, in press. doi: 10.1002/j.1532-2149.2013.00389.x.
Pearce, H.M., Layton, D., Wilton, L.V., & Shakir, S.A. (2005) Deep vein thrombosis and pulmonary embo-lism reported in the prescription event monitoring study of Yasmin. Br J Clin Pharmacol, 60 (1), 98–102.
Perrio, M.J., Wilton, L.V., & Shakir, S.A. (2007) A modi-fied prescription-event monitoring study to assess the introduction of Flixotide Evohaler into general prac-tice in England: an example of pharmacovigilance planning and risk monitoring. Pharmacoepidemiol Drug Saf, 16 (9), 969–978.
Petri, H. & Urquhart, J. (1991) Channeling bias in the interpretation of drug effects. Stat Med, 10 (4), 577–581.
Ray, W.A. (2003) Evaluating medication effects outside of clinical trials: new-user designs. Am J Epidemiol, 158 (9), 915–920.
RCP (1996) Guidelines on the Practice of Ethical Com-mittees in Medical Research involving Human Subjects. Royal College of Physicians of London.