50
Group #1 Case: Investment Analysis and Lockheed Tri Star Members: Spencer Cheung Jorge Chumpitaz Wenqian (Chloe) Jin Xia Lei Kyle Stowell
| Date post: | 12-Feb-2017 |
| Category: |
Documents |
| Upload: | spencer-cheung |
| View: | 496 times |
| Download: | 10 times |

Group #1
Case:
Investment Analysis and Lockheed Tri StarMembers:
Spencer Cheung
Jorge Chumpitaz
Wenqian (Chloe) Jin
Xia Lei
Kyle Stowell

Rainbow Products
Purchasing a paint mixer machine for estimated additional cash flows of $5000 a year for the next 15 years
Initial Cost will be $35000 Determined Cost of Capital to be 12% So: CF= $5000 per year T= 15 years Initial Outlay=-$35000 K=12%

Assuming there are no taxes Payback Period: time required for
the amount invested into the project to be repaid by the cash flows generated from the project
$35000 initial investment/$5000 annual cash flow = 7 years
Advantage: It is very simple and easy to use
Disadvantage: Does not take into account the time value of money
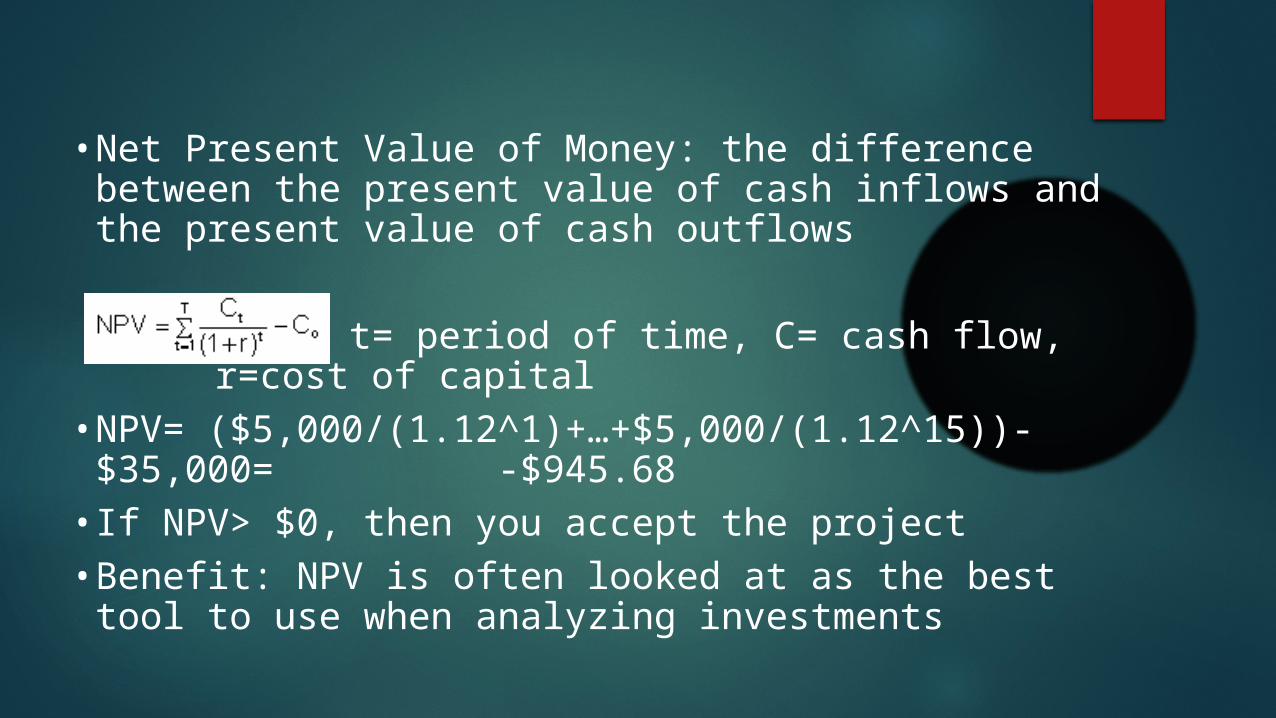
• Net Present Value of Money: the difference between the present value of cash inflows and the present value of cash outflows
where t= period of time, C= cash flow, r=cost of capital
• NPV= ($5,000/(1.12^1)+…+$5,000/(1.12^15))-$35,000= -$945.68
• If NPV> $0, then you accept the project• Benefit: NPV is often looked at as the best tool to use
when analyzing investments
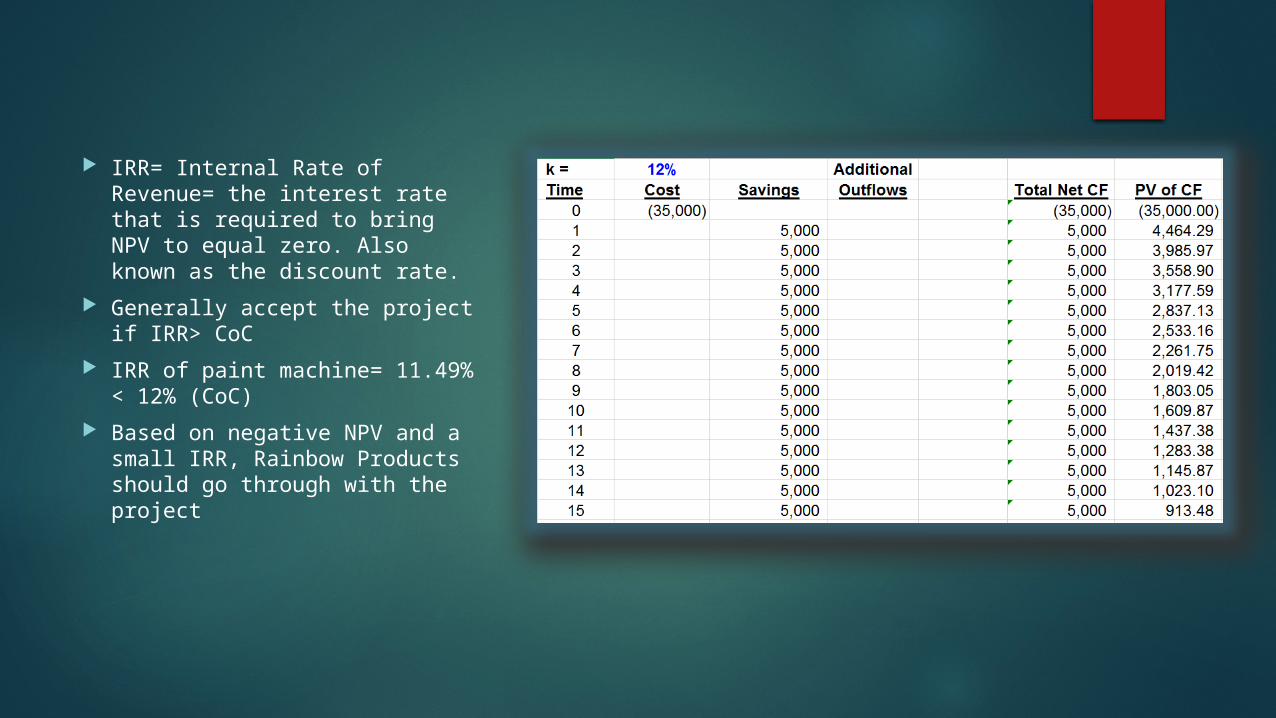
IRR= Internal Rate of Revenue= the interest rate that is required to bring NPV to equal zero. Also known as the discount rate.
Generally accept the project if IRR> CoC
IRR of paint machine= 11.49% < 12% (CoC)
Based on negative NPV and a small IRR, Rainbow Products should go through with the project
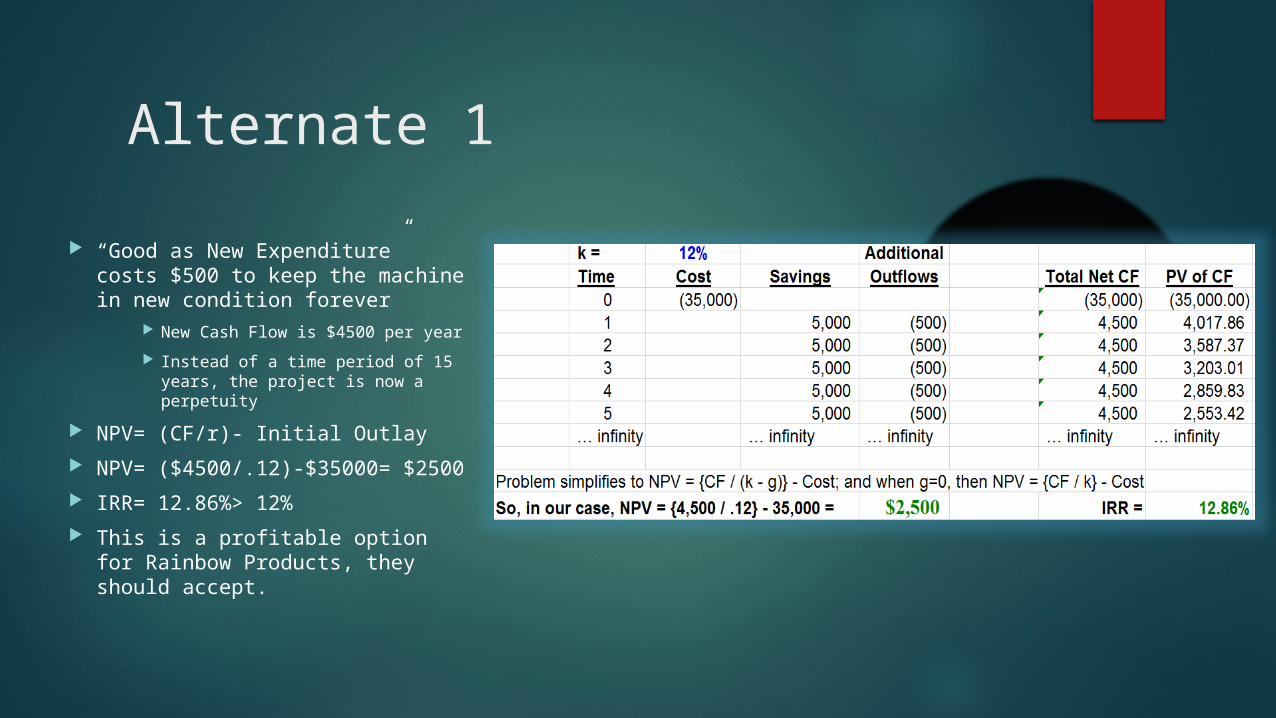
Alternate 1 “Good as New Expenditure” costs
$500 to keep the machine in new condition forever
New Cash Flow is $4500 per year Instead of a time period of 15
years, the project is now a perpetuity
NPV= (CF/r)- Initial Outlay NPV= ($4500/.12)-$35000= $2500 IRR= 12.86%> 12% This is a profitable option for
Rainbow Products, they should accept.
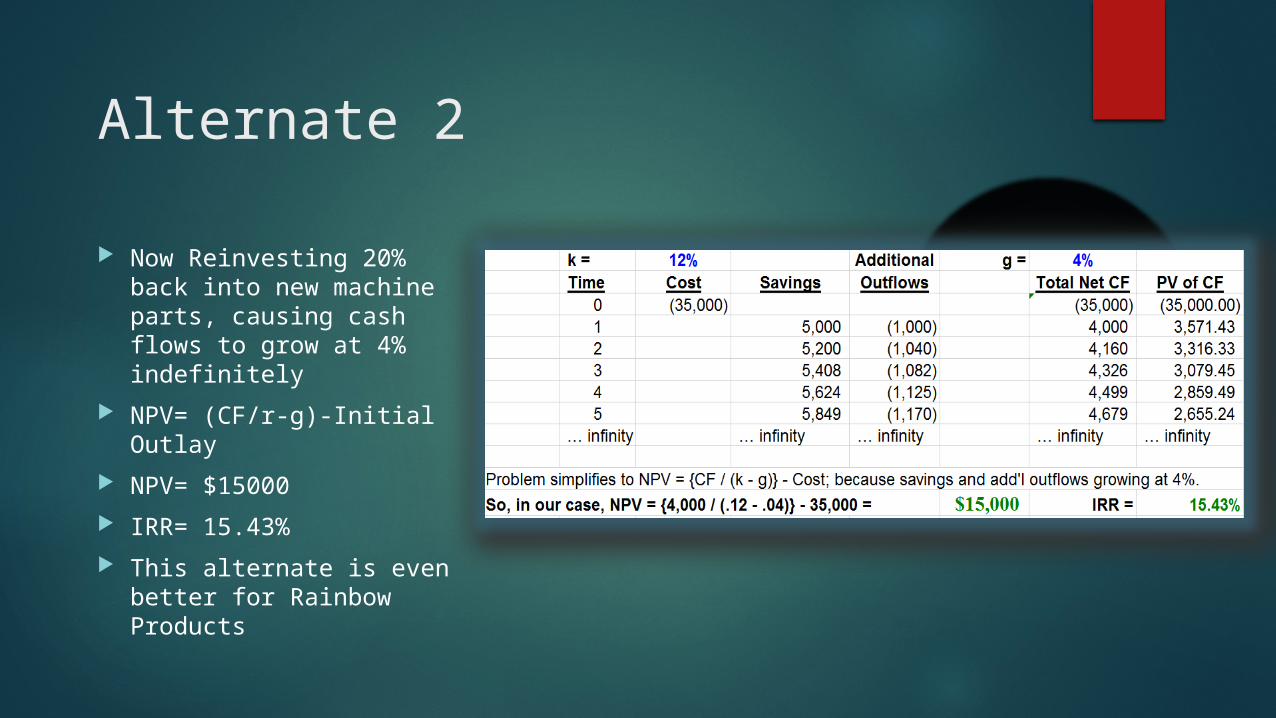
Alternate 2
Now Reinvesting 20% back into new machine parts, causing cash flows to grow at 4% indefinitely
NPV= (CF/r-g)-Initial Outlay
NPV= $15000 IRR= 15.43% This alternate is even
better for Rainbow Products
HOT DOGS, PEANUTS,POPCORN, BEER
Suppose you own a concession stand that sells hot
dogs, peanuts, popcorn, and beer at a ball park.You have
three years left on the contract with the ball park, and you
do not expect it to be renewed.Long lines limit sales and
profits. You have developed four different proposals to
reduce the lines and increase profits.

FIRST PROPOSAL
The first proposal is to renovate by adding another window. The second is to update the equipment at the existing windows. These two renovation projects are not mutually exclusive; you could take both projects. The third and fourth proposals involve abandoning the existing stand.The third proposal is to build a new stand. The fourth proposal is to rent a larger stand in the ball park. This option would involve $1,000 in up-front investment for new signs and equipment installation the incremental cash flows shown in later years are net of lease payments.

You have decided that a 15% discount rate is appropriate for this type of investment. The incremental cash flows associated with each of the proposals are:
Incremental Cash Flows
Project Investment Year 1 Year 2 Year 3
Add a New Window -$75,000 44,000 44,000 44,000
Update Existing Equipment -50,000 23,000 23,000 23,000
Build a New Stand -125000 70,000 70,000 70,000
Rent a Larger Stand -1,000 12,000 13,000 14,000

1 Using the internal rate of return rule (IRR), which proposal(s) do you recommend?|
2 Using the net present value rule (NPV), which proposal(s) do you recommend?|
3 How do you explain any differences between the IRR and NPV rankings? Which rule is better?
|
IRR vs NPV
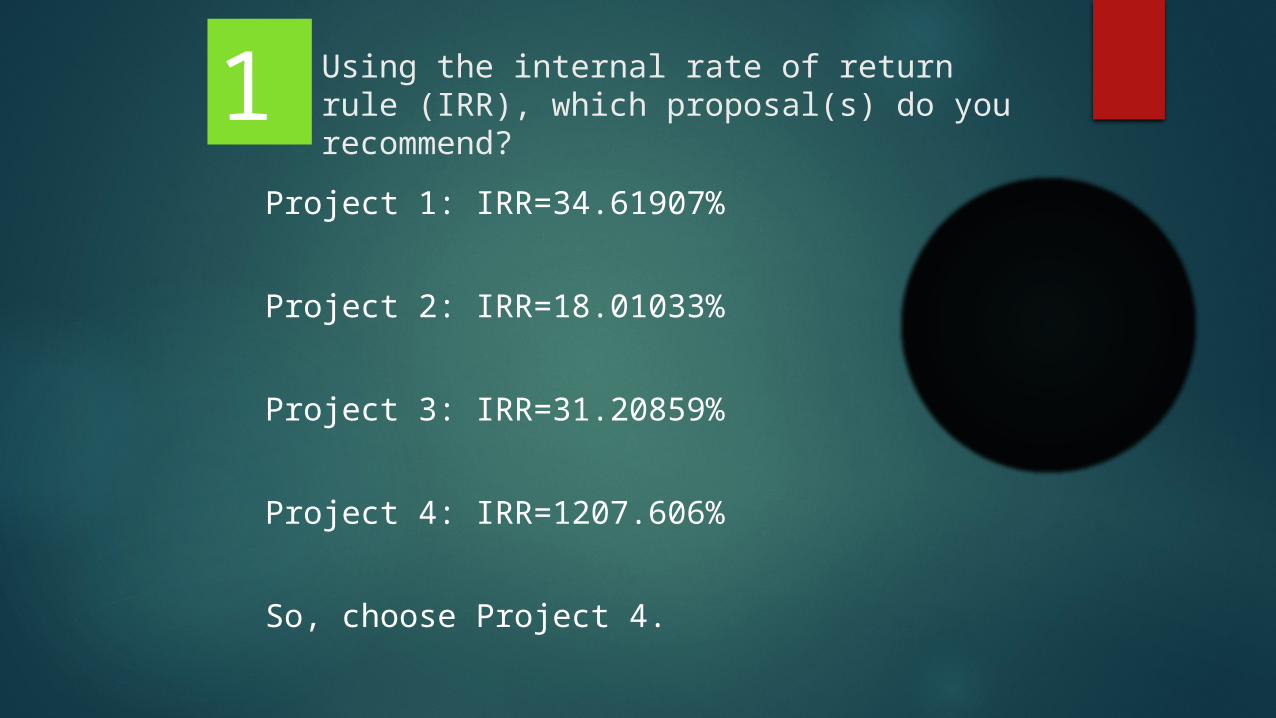
Using the internal rate of return rule (IRR), which proposal(s) do you recommend?
Project 1: IRR=34.61907%
Project 2: IRR=18.01033%
Project 3: IRR=31.20859%
Project 4: IRR=1207.606%
So, choose Project 4.
1

Using the net present value rule (NPV), which proposal(s) do you recommend?
Project 1: NPV=$25,462
Project 2: NPV=$2,514
Project 3: NPV=$34,826
Project 4: NPV=$28,470
So, choose Project 3.
2

How do you explain any differences between the IRR and NPV rankings? Which rule is better?
Incremental Cash Flows
Project Investment Year 1 Year 2 Year 3 IRR NPV
Add a New Window -$75,000 44,000 44,000 44,000 34.61907% $25,462
Update Existing Equipment
-50,000 23,000 23,000 23,000 18.01033% $2,514
Build a New Stand -125000 70,000 70,000 70,000 31.20859% $34,826
Rent a Larger Stand
-1,000 12,000 13,000 14,000 1207.606% $28,470
3

Subsidy Definition | Investopedia http://w
ww
.investopedia.com
/terms/s/subsidy.asp#ixzz3pAY
OX
oU3
MBATech INC. Bean City
Some Information We are hired by the mayor of Bean City The city has agreed to subsidize MBAT
Subsidize- A benefit given by the government to groups or individuals usually in the form of a cash payment or tax reduction. The subsidy is usually given to remove some type of burden and is often considered to be in the interest of the public.
MBATech, Inc. has given us 4 choices

MBATech INC. Bean City: Original CF
Cash Flows P0- ($1,000,000) P1- $371,739 P2- $371,739 P3- $371,739 P4- $371,739
Discount Rate 20% NPV (37666.4)
-$1,000,000 + (371739/1.2) + (371739/1.2^2) + (371739/1.2^3) + (371739/1.2^4)
IRR 18%

MBATech Inc. Bean City
MBATech Inc. Proposed 4 proposalA. Subsidize their project to bring its IRR to 25%B. Subsidize their project to provide two-year paybackC. Subsidize the project to provide an NPV of $75,000 when cash flows
are discounted at 20%D. Subsidize their project to providing an accounting rate of return
(ARR) of 40%. Quick Note: ARR= (Average Annual Cash Flow-(Investment/# of
years))/(Investment/2) We are here to recommend a subsidy that minimize costs
to the city
MBATech Inc. Bean City
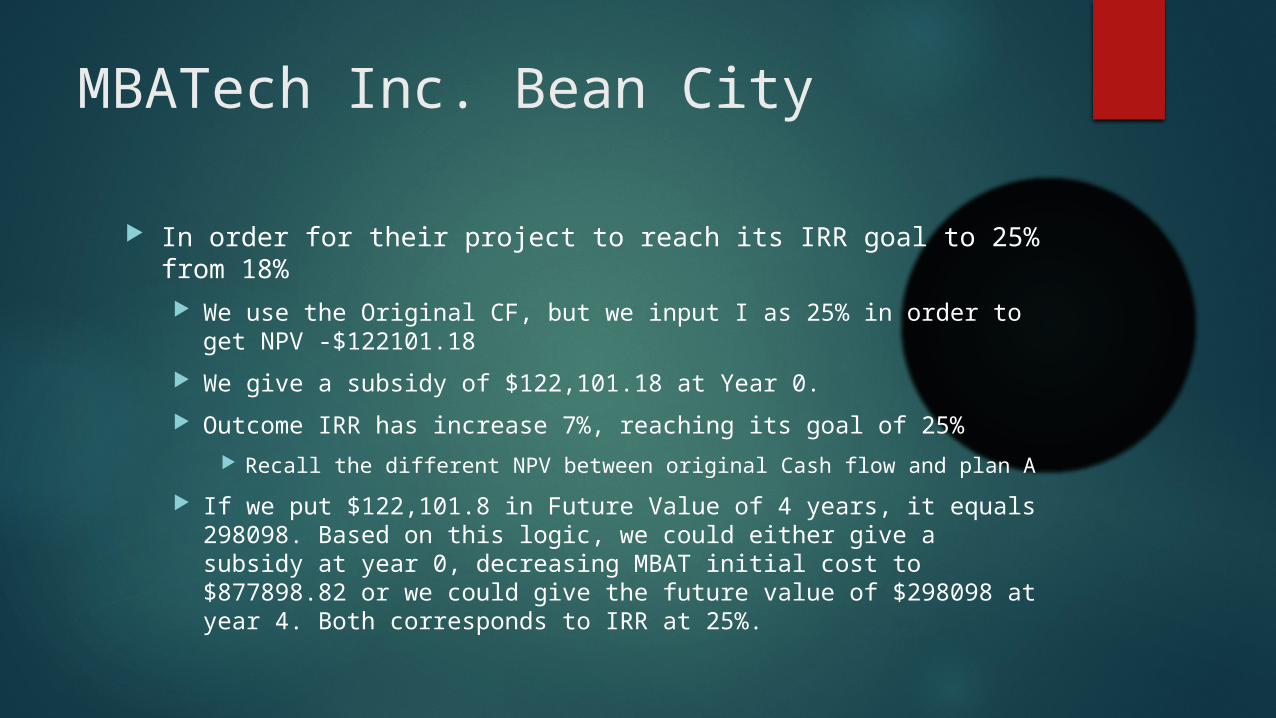
In order for their project to reach its IRR goal to 25% from 18% We use the Original CF, but we input I as 25% in order to get NPV -
$122101.18 We give a subsidy of $122,101.18 at Year 0. Outcome IRR has increase 7%, reaching its goal of 25%
Recall the different NPV between original Cash flow and plan A If we put $122,101.8 in Future Value of 4 years, it equals 298098.
Based on this logic, we could either give a subsidy at year 0, decreasing MBAT initial cost to $877898.82 or we could give the future value of $298098 at year 4. Both corresponds to IRR at 25%.
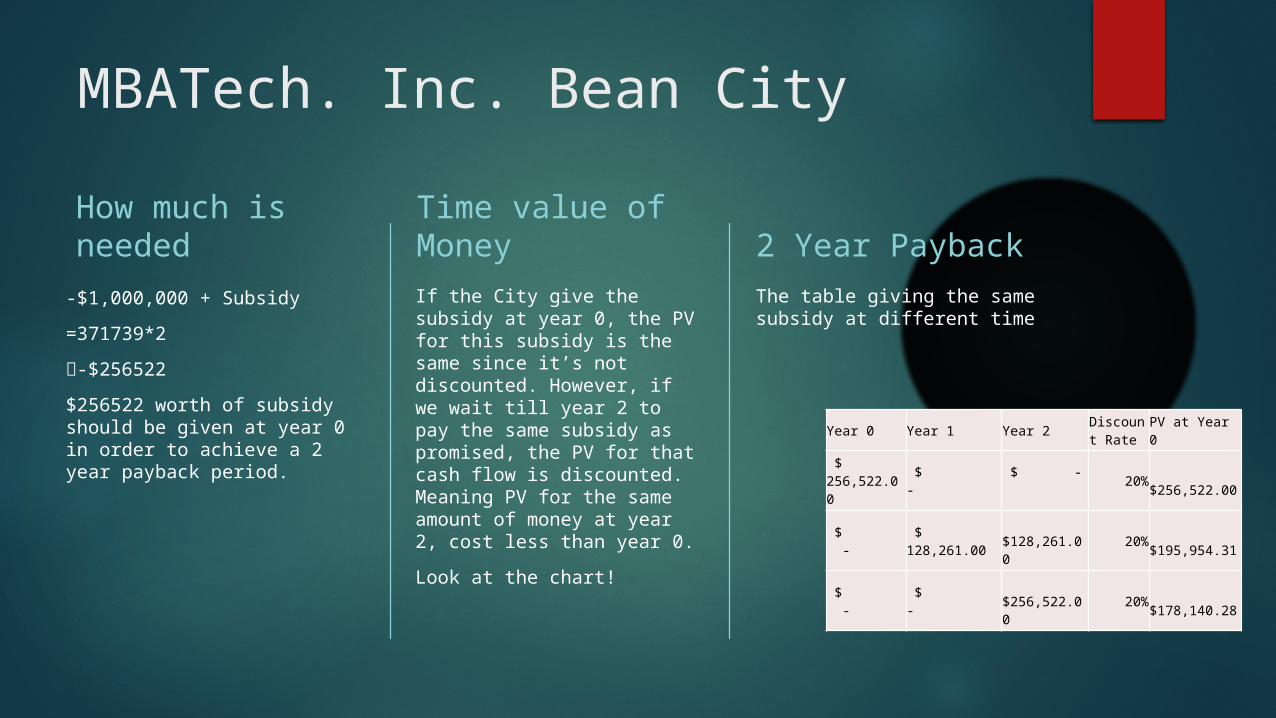
MBATech. Inc. Bean City How much is needed
-$1,000,000 + Subsidy=371739*2-$256522$256522 worth of subsidy should be given at year 0 in order to achieve a 2 year payback period.
Time value of MoneyIf the City give the subsidy at year 0, the PV for this subsidy is the same since it’s not discounted. However, if we wait till year 2 to pay the same subsidy as promised, the PV for that cash flow is discounted. Meaning PV for the same amount of money at year 2, cost less than year 0. Look at the chart!
2 Year PaybackThe table giving the same subsidy at different time
Year 0 Year 1 Year 2 Discount Rate PV at Year 0
$ 256,522.00 $ - $ - 20% $256,522.00
$ - $ 128,261.00
$128,261.00 20% $195,954.31
$ - $ - $256,522.00 20% $178,140.28

MBATech Inc. Bean City
MBATech Inc. proposed NPV of $75,000 when CF are discounted at 20%
We calculate NPV value for original, it was -$37666.4 In order to achieve NPV $75,000. $75,000-(-37666.4) which is the subsidy at year 0, 112,666.4
FV of 233,625.05 would be the same as giving 112,666.4 at year 0.
Year 0 Year 1 Year 2 Year 3 Year 4 Discount Rt $ (1,000,000.00) $ 371,739.00 $ 371,739.00 $371,739.00 $371,739.00 20%
Discounted $ (1,000,000.00) 309782.5 258152.0833 215126.7361 179272.2801Total $ $ (37,666.40)NPV TGT $75,000 Subsidy $112,666.40 Sub at YR 0 ($887,333.60) 371739 371739 371739 371739 20%NPV $75,000.00 FV of Sub $ 233,625.05 1122666.4*(1+.2)^4Sub at YR 4 $ (1,000,000.00) 371739 371739 371739 605364.048 20%NPV $ 75,000.00
MBATech, Inc. Bean City
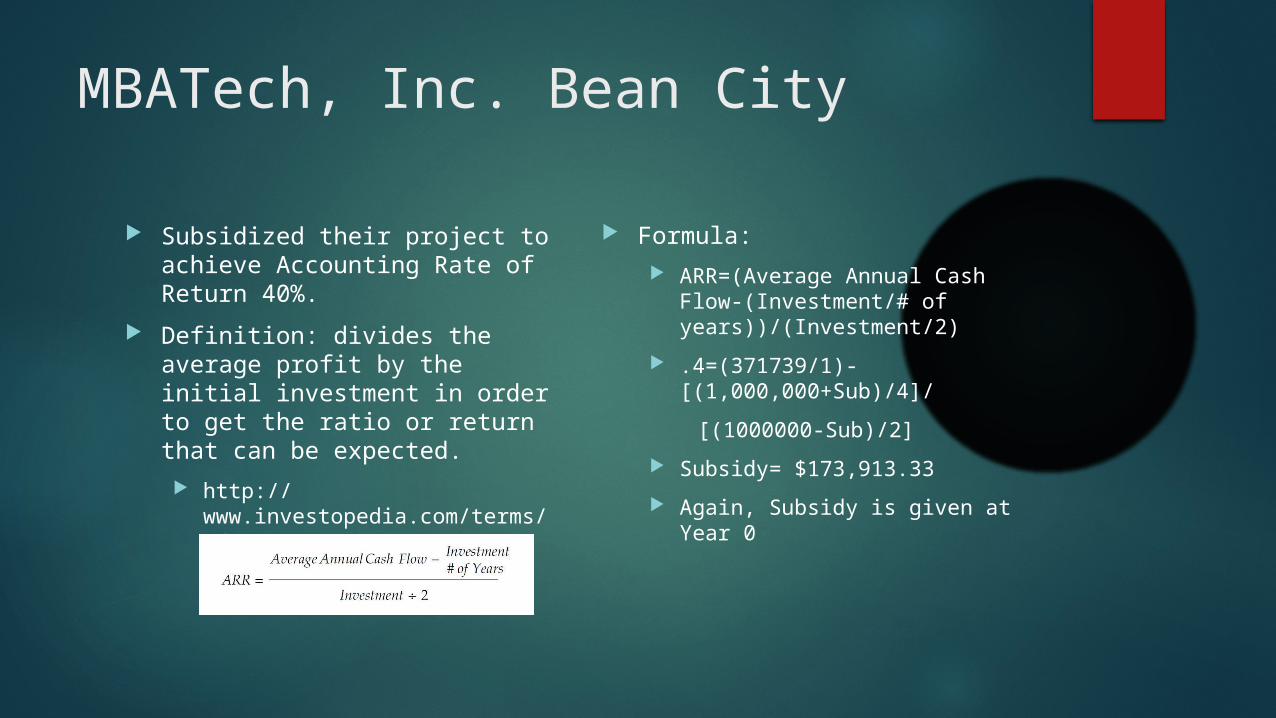
Subsidized their project to achieve Accounting Rate of Return 40%.
Definition: divides the average profit by the initial investment in order to get the ratio or return that can be expected. http://www.investopedia.com/
terms/a/arr.asp
Formula: ARR=(Average Annual Cash Flow-
(Investment/# of years))/(Investment/2)
.4=(371739/1)-[(1,000,000+Sub)/4]/
[(1000000-Sub)/2] Subsidy= $173,913.33 Again, Subsidy is given at Year 0
MBATech, Inc. Bean City
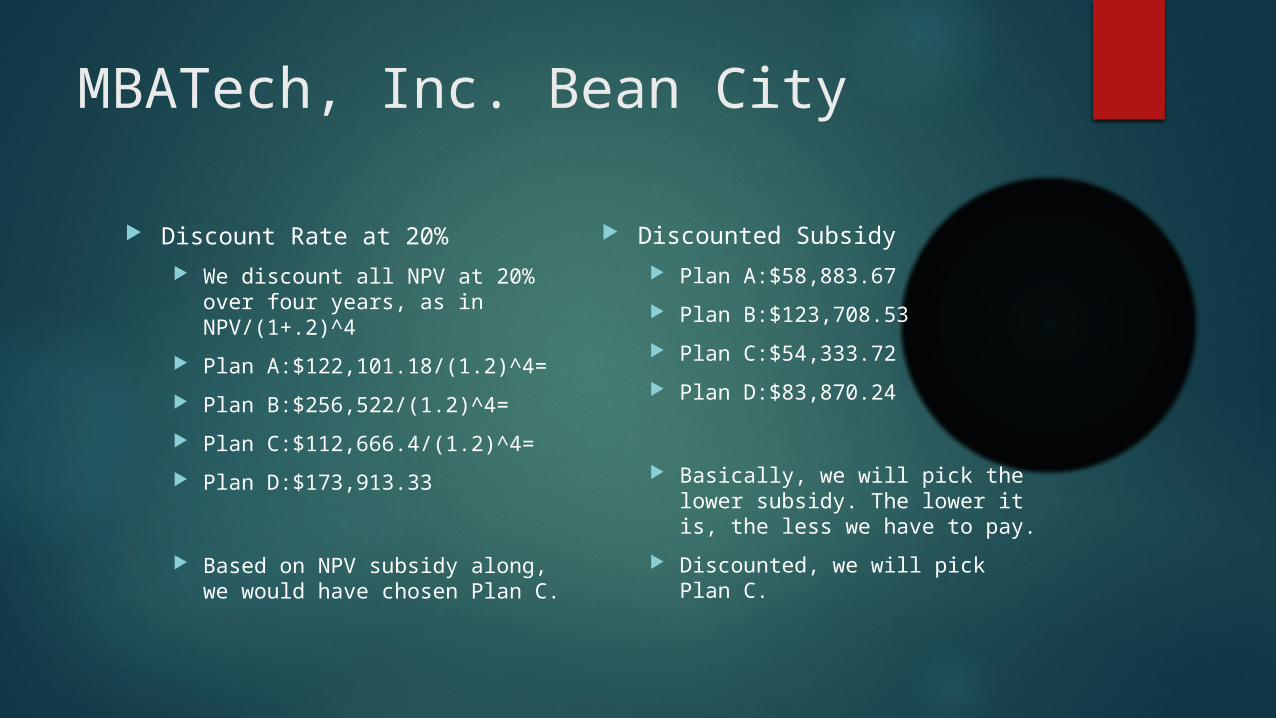
Discount Rate at 20% We discount all NPV at 20% over
four years, as in NPV/(1+.2)^4 Plan A:$122,101.18/(1.2)^4= Plan B:$256,522/(1.2)^4= Plan C:$112,666.4/(1.2)^4= Plan D:$173,913.33
Based on NPV subsidy along, we would have chosen Plan C.
Discounted Subsidy Plan A:$58,883.67 Plan B:$123,708.53 Plan C:$54,333.72 Plan D:$83,870.24
Basically, we will pick the lower subsidy. The lower it is, the less we have to pay.
Discounted, we will pick Plan C.
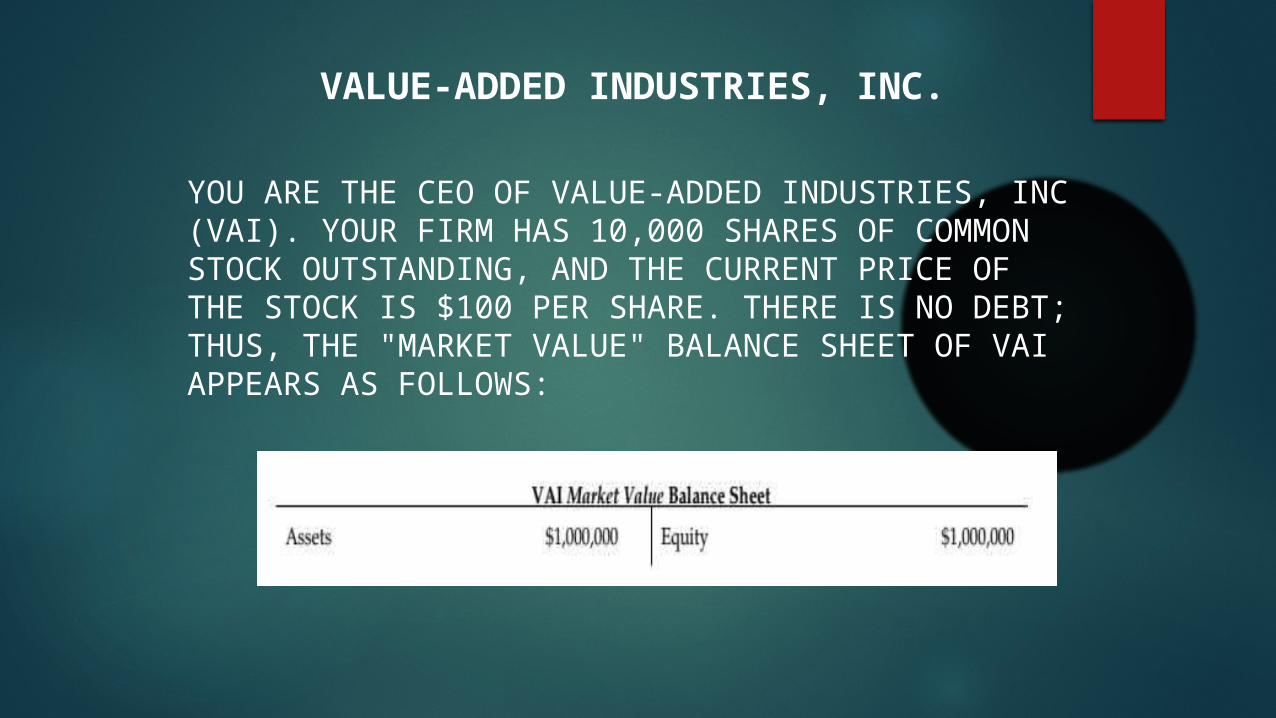
VALUE-ADDED INDUSTRIES, INC.
YOU ARE THE CEO OF VALUE-ADDED INDUSTRIES, INC (VAI). YOUR FIRM HAS 10,000 SHARES OF COMMON STOCK OUTSTANDING, AND THE CURRENT PRICE OF THE STOCK IS $100 PER SHARE. THERE IS NO DEBT; THUS, THE "MARKET VALUE" BALANCE SHEET OF VAI APPEARS AS FOLLOWS:
You then discover an opportunity to invest in a new project that produces positive net cash flows with a present value of $210,000. Your initial costs for investing and developing the project are only $110,00. You will raise the necessary capital for this investment by issuing new equity. All potential purchasers of your common stock will be fully aware of the project’s value and cost, and are willing to pay “fair value” for the new shares of VAI common.

Let’s summarize our information
Total existing asset Liabilities + Equity= $0+$1,000,000=$1,000,000 New Project Cash flows: PV= $210,000 Initial costs: $100,000
Now we need to raise additional capital for our new investment.

What is the net present value of this project? NPV= PV of Cash Inflows- PV of Cash
Outflows = $210,000-$100,000 = $110,000
The net present value of this project is $110,000.

How many shares of common stock must be issued, and
at what price, to raise the required capital?
The equity and total asset of the company changes.
Therefore, the market price also changes.

We assume that we will issue n additional shares of stocks at price p to raise capital
n*p=$110,000 Total asset= Equity + Cash Inflows of project =$1,000,000+$210,000 =$1,210,000 Total asset = (n+10,000) *p =n*p+10,000p=$1,210,000 n*p=$110,100 => 10,000p=$1,100,000 p= 1,100,000/10,000= $110 n=110,000/110= 1,000 shares Therefore, the company should issue 1000 shares of
stocks at price $110.
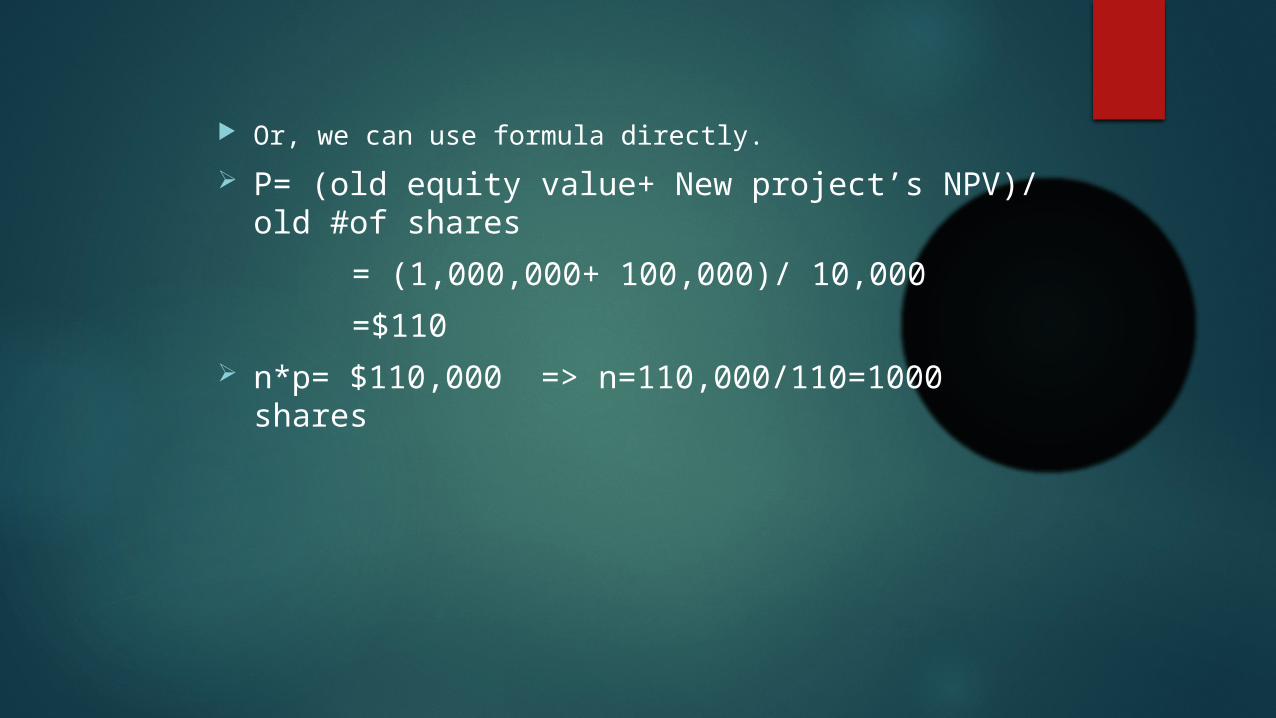
Or, we can use formula directly. P= (old equity value+ New project’s NPV)/ old #of
shares = (1,000,000+ 100,000)/ 10,000 =$110 n*p= $110,000 => n=110,000/110=1000 shares

What is the effect, if any, of this new project on the value of the
stock of the existing shareholders?
The old price of stocks is $100.
$1,000,000/10,000=$100
Now the price increases to $110.
Existing shareholders will get extra $10 from each share they
have.
Investment Analysis and Lockheed Tri Star
LOCKHEED TRI STAR and CAPITAL BUDGETING
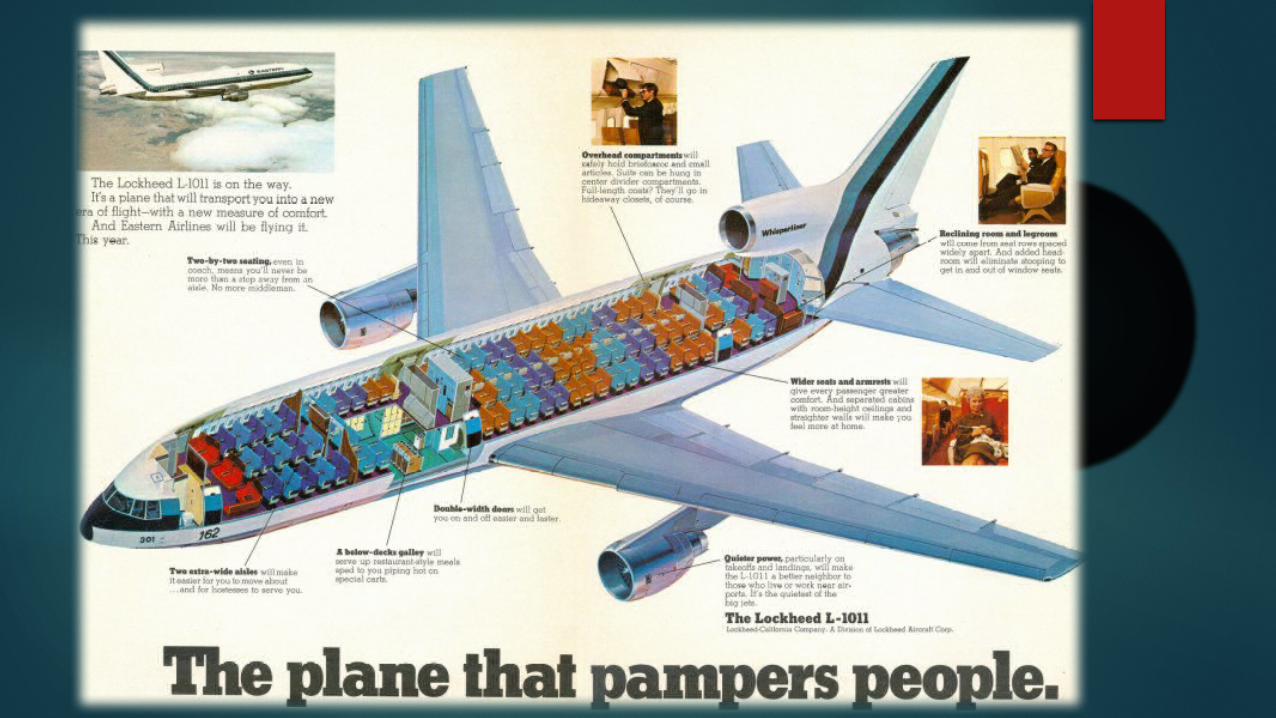


L-1011 Tri Star Airbus commercial jet aircraft; capacity of up 400 passengers.Competitors: DC-10 trijet and the A-300B
Capital Budgeting
The process in which a business determines whether projects such as building a new
plant or investing in a long-term venture are worth pursuing. (Investopedia)
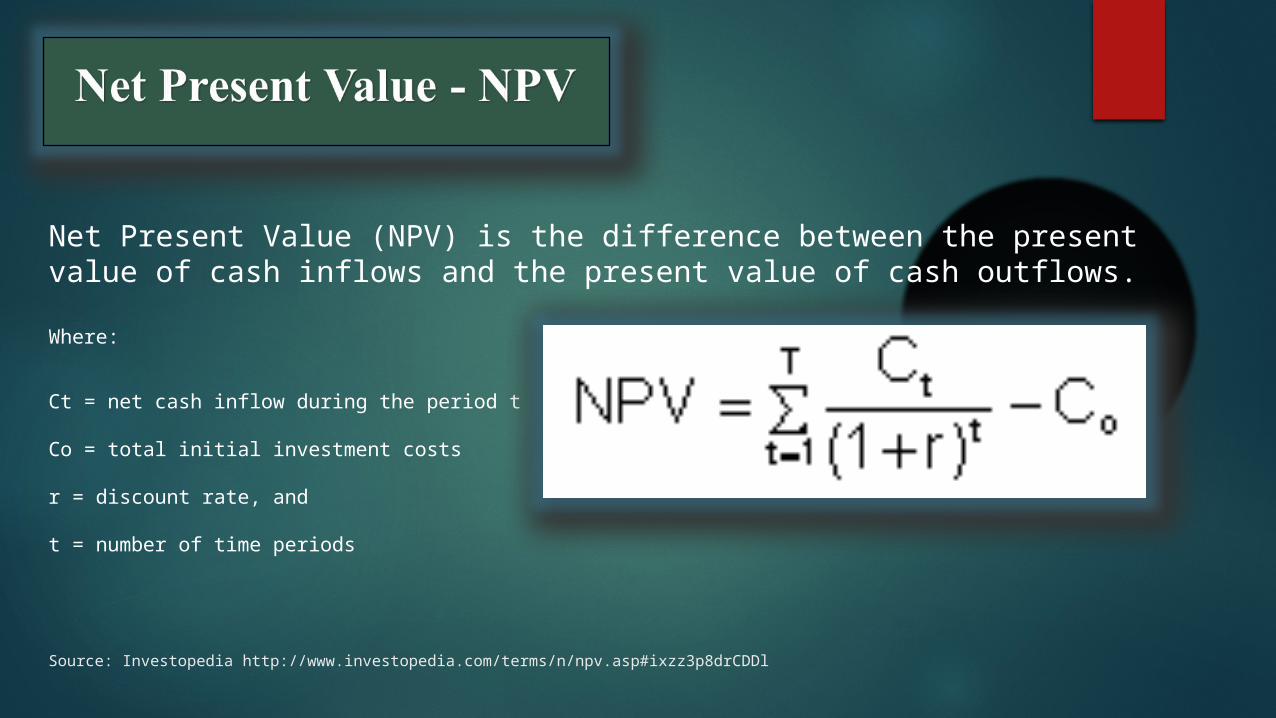
Net Present Value (NPV) is the difference between the present value of cash inflows and the present value of cash outflows.
Where:
Ct = net cash inflow during the period t
Co = total initial investment costs
r = discount rate, and
t = number of time periods
Source: Investopedia http://www.investopedia.com/terms/n/npv.asp#ixzz3p8drCDDl
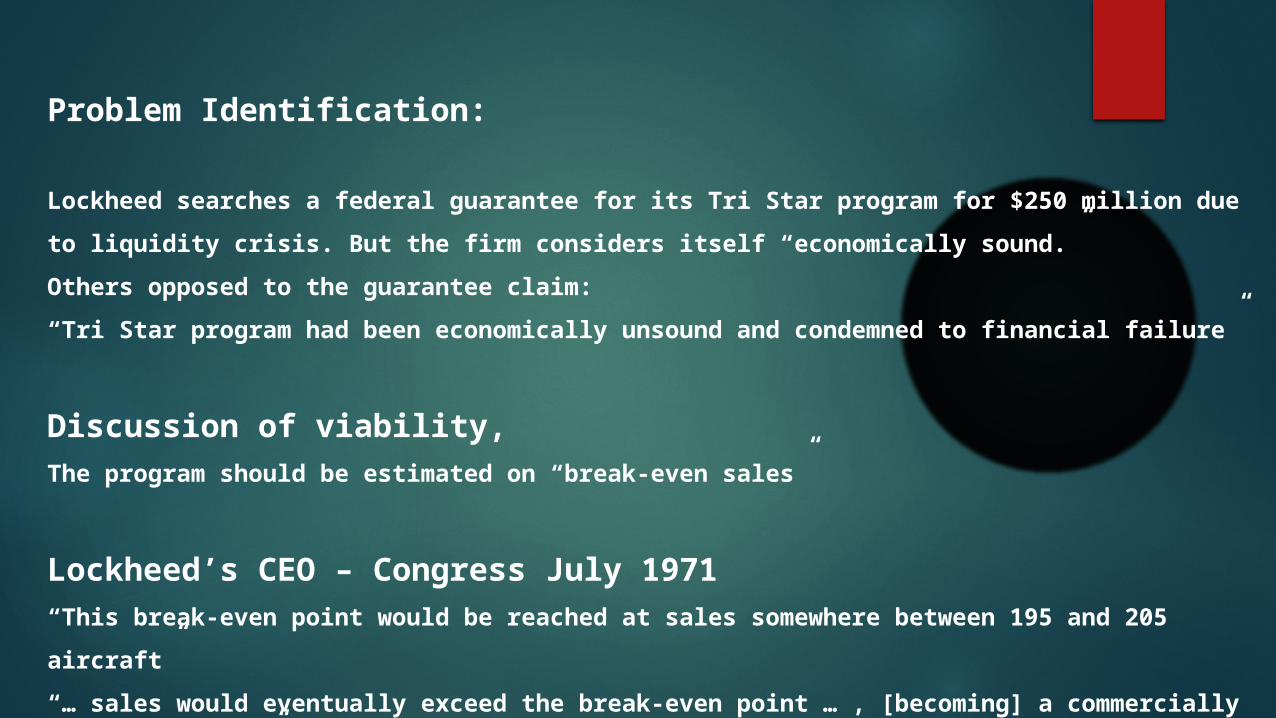
Problem Identification:
Lockheed searches a federal guarantee for its Tri Star program for $250 million due to liquidity crisis. But the firm
considers itself “economically sound.”
Others opposed to the guarantee claim:
“Tri Star program had been economically unsound and condemned to financial failure”
Discussion of viability,The program should be estimated on “break-even sales”
Lockheed’s CEO – Congress July 1971“This break-even point would be reached at sales somewhere between 195 and 205 aircraft”
“… sales would eventually exceed the break-even point … , [becoming] a commercially viable endeavor”
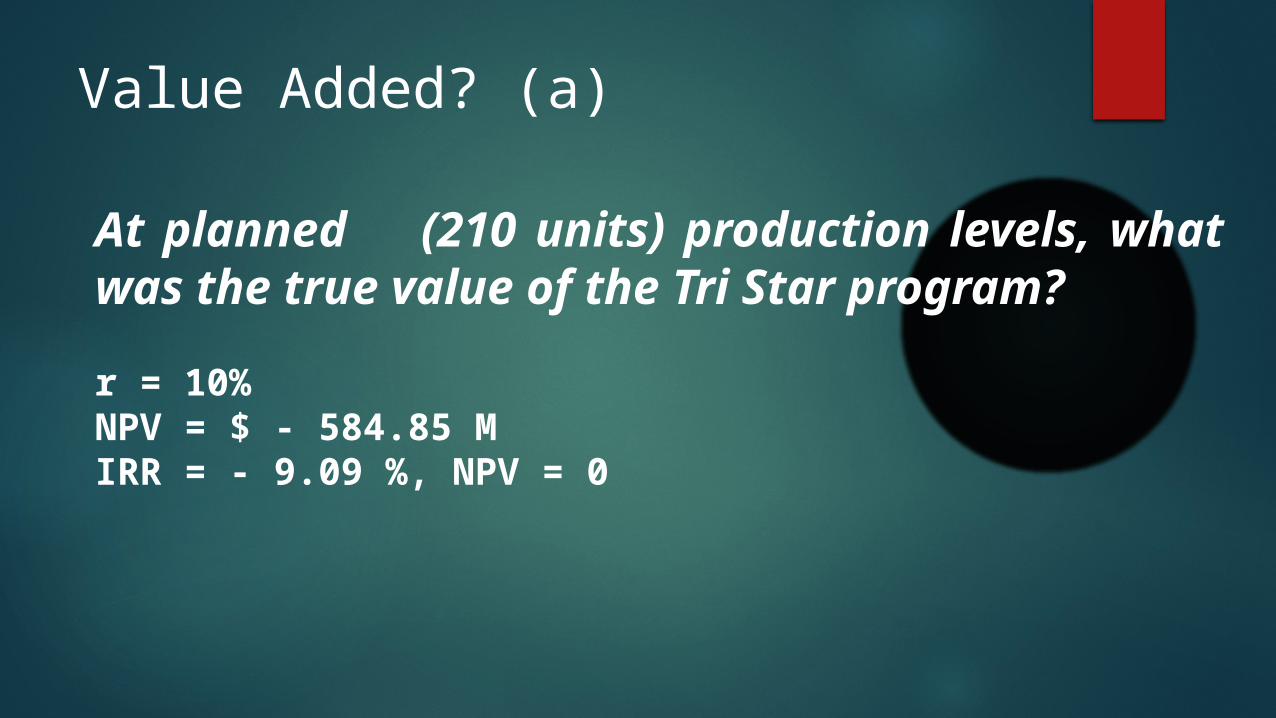
Value Added? (a)
At planned (210 units) production levels, what was the true value of the Tri Star program?
r = 10%NPV = $ - 584.85 MIRR = - 9.09 %, NPV = 0

Lockheed Tri Star - Capital BudgetingFederal Guarantee 250 millionInvestment (Preproduction outflows) 1967-1971 periodProduction outflows 1971-1976 periodRevenue inflows 1972-1977 periodAverage production cost 14 millionRevenue per aircraft 16 millionBefore Guarantee 210 aircrafts
t = 0 t = 1 t = 2 t = 3 t = 4 t = 5 t = 6 t = 7 t = 8 t = 9 t = 101967 1968 1969 1970 1971 1972 1973 1974 1975 1976 1977
Investment (pre-production) (100.00) (200.00) (200.00) (200.00) (200.00) Average Production Cost (490.00) (490.00) (490.00) (490.00) (490.00) (490.00) Revenues 420.00 420.00 420.00 420.00 420.00 420.00 Deposits toward future deliveries 140.00 140.00 140.00 140.00 140.00 140.00 Cash Flow (100.00) (200.00) (200.00) (60.00) (550.00) 70.00 70.00 70.00 70.00 (70.00) 420.00
Time "Index"Years


Value Added? (b)
At a “break-even” production of roughly 300 units, did Lockheed really break even in value terms?
r = 10%NPV = $ - 274.38 MIRR = 2.38%, NPV = 0
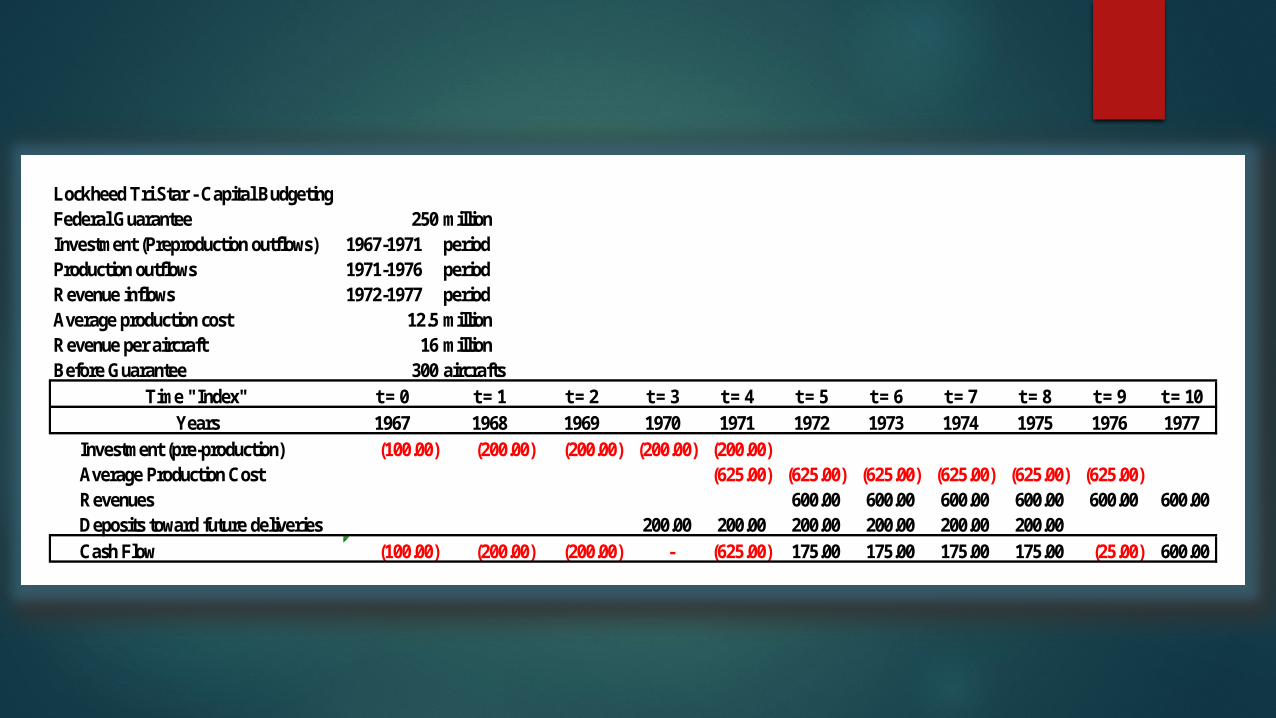
Lockheed Tri Star - Capital BudgetingFederal Guarantee 250 millionInvestment (Preproduction outflows) 1967-1971 periodProduction outflows 1971-1976 periodRevenue inflows 1972-1977 periodAverage production cost 12.5 millionRevenue per aircraft 16 millionBefore Guarantee 300 aircrafts
t = 0 t = 1 t = 2 t = 3 t = 4 t = 5 t = 6 t = 7 t = 8 t = 9 t = 101967 1968 1969 1970 1971 1972 1973 1974 1975 1976 1977
Investment (pre-production) (100.00) (200.00) (200.00) (200.00) (200.00) Average Production Cost (625.00) (625.00) (625.00) (625.00) (625.00) (625.00) Revenues 600.00 600.00 600.00 600.00 600.00 600.00 Deposits toward future deliveries 200.00 200.00 200.00 200.00 200.00 200.00 Cash Flow (100.00) (200.00) (200.00) - (625.00) 175.00 175.00 175.00 175.00 (25.00) 600.00
Time "Index"Years

Value Added? (c)
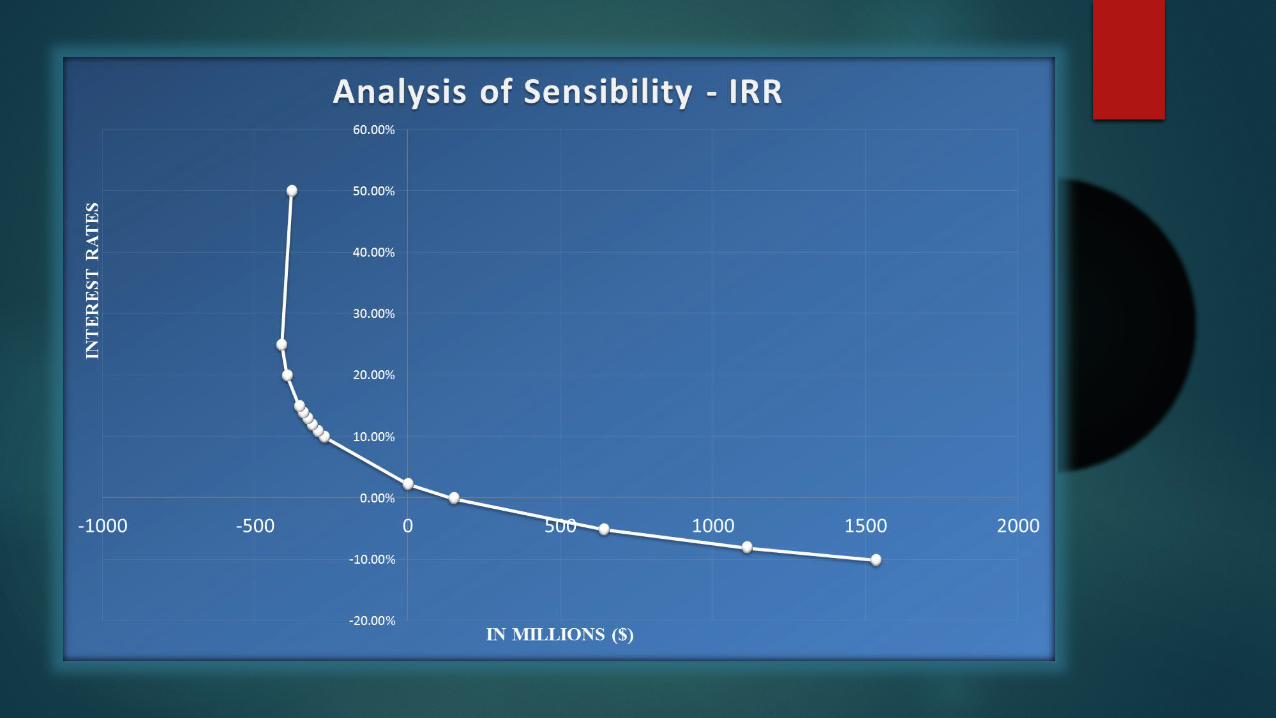
At what sales volume did the Tri Star program reach the true economic (as opposed to accounting) break-even?
The Tri Star program reached the true economic break-even (NPV) to a level of 420 aircrafts produced.

ECONOMIC BREAK-EVEN ACCOUNTING BREAK-EVEN
The difference is the opportunity cost or discount rate [hurdle rate]
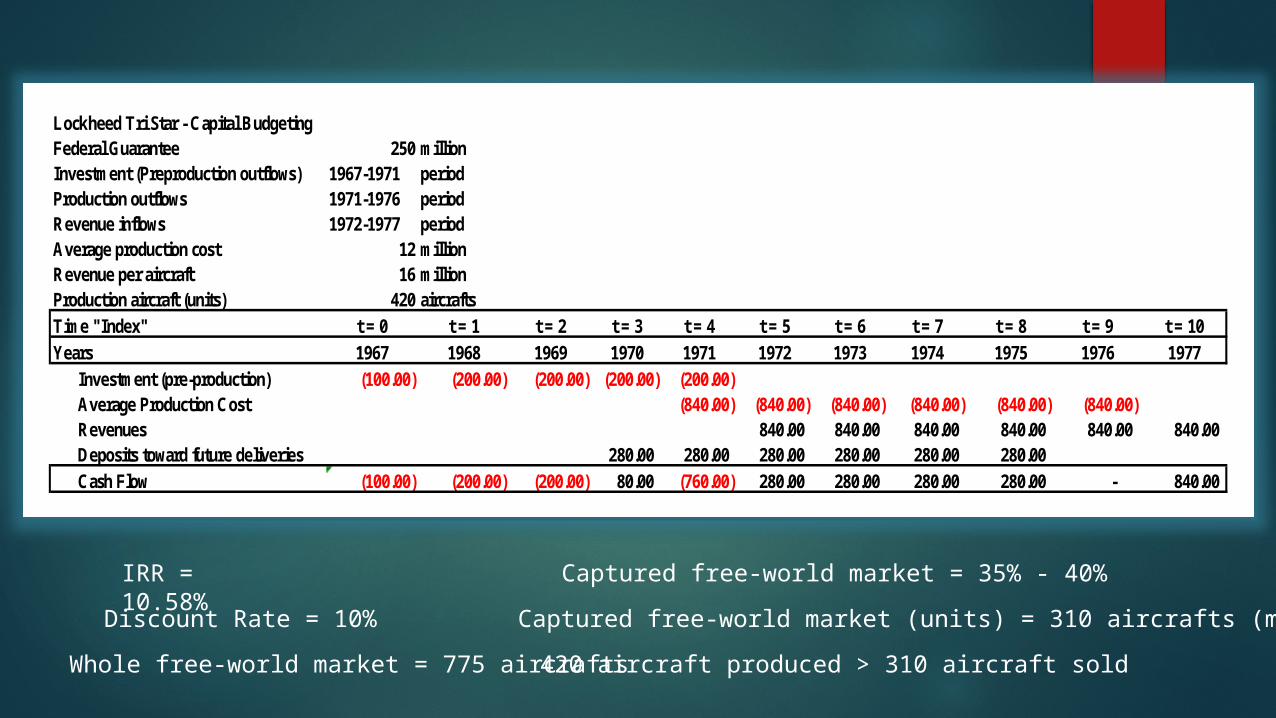
Lockheed Tri Star - Capital BudgetingFederal Guarantee 250 millionInvestment (Preproduction outflows) 1967-1971 periodProduction outflows 1971-1976 periodRevenue inflows 1972-1977 periodAverage production cost 12 millionRevenue per aircraft 16 millionProduction aircraft (units) 420 aircraftsTime "Index" t = 0 t = 1 t = 2 t = 3 t = 4 t = 5 t = 6 t = 7 t = 8 t = 9 t = 10Years 1967 1968 1969 1970 1971 1972 1973 1974 1975 1976 1977
Investment (pre-production) (100.00) (200.00) (200.00) (200.00) (200.00) Average Production Cost (840.00) (840.00) (840.00) (840.00) (840.00) (840.00) Revenues 840.00 840.00 840.00 840.00 840.00 840.00 Deposits toward future deliveries 280.00 280.00 280.00 280.00 280.00 280.00 Cash Flow (100.00) (200.00) (200.00) 80.00 (760.00) 280.00 280.00 280.00 280.00 - 840.00
IRR = 10.58%Discount Rate = 10%
Whole free-world market = 775 aircrafts
Captured free-world market = 35% - 40%Captured free-world market (units) = 310 aircrafts (max.)420 aircraft produced > 310 aircraft sold

Lockheed Tri Star - Capital BudgetingFederal Guarantee 250 millionInvestment (Preproduction outflows) 1967-1971 periodProduction outflows 1971-1976 periodRevenue inflows 1972-1977 periodAverage production cost 11 millionRevenue per aircraft 16 millionProduction aircraft (units) 500 aircraftsTime "Index" t = 0 t = 1 t = 2 t = 3 t = 4 t = 5 t = 6 t = 7 t = 8 t = 9 t = 10Years 1967 1968 1969 1970 1971 1972 1973 1974 1975 1976 1977
Investment (pre-production) (100.00) (200.00) (200.00) (200.00) (200.00) Average Production Cost (625.00) (625.00) (625.00) (625.00) (625.00) (625.00) Revenues 1,000.00 1,333.33 1,333.33 1,333.33 1,333.33 1,333.33 Deposits toward future deliveries 333.33 333.33 333.33 333.33 333.33 333.33 Cash Flow (100.00) (200.00) (200.00) 133.33 (491.67) 708.33 1,041.66 1,041.66 1,041.66 708.33 1,333.33
IRR = 45.71%Discount Rate = 10%
Whole free-world market = 775 aircrafts
Captured free-world market = 35% - 40%Captured free-world market (units) = 310 aircrafts

Value Added? (d)
- Was the decision to pursue the Tri Star program a reasonable one?
No, it was not a reasonable one because its NPV was negative to IRR of 10%.
- What were the effects of this “project” on Lockheed shareholders?
The effects of this “project” were negative. The common stock prices went
down from $70 per share in 1967 to $3.25 in 1974.


Thank You


