28
1 2021 Interim Results Presentation for the six months ended 30 June 2021

1
2021 Interim ResultsPresentation for the six months ended 30 June 2021
2
CAUTIONARY STATEMENT
Disclaimer: This presentation has been prepared by Thungela Resources Limited (“Thungela”) and comprises the written materials/slides for a presentation concerning Thungela. By attending this presentation and/or reviewing the slides you agree to be bound bythe conditions set out herein. The release, presentation, publication or distribution of this document, in whole or in part, in certain jurisdictions may be restricted by law or regulation and persons into whose possession this document comes should inform themselvesabout, and observe, any such restrictions.
This presentation is for information purposes only and does not constitute, nor is to be construed as, an offer to sell or the recommendation, solicitation, inducement or offer to buy, subscribe for or sell shares in Thungela or any other securities by Thungela or anyother party. Further, it should not be treated as giving investment, legal, accounting, regulatory, taxation or other advice and has no regard to the specific investment or other objectives, financial situation or particular needs of any recipient.
No representation or warranty, either express or implied, is provided, nor is any duty of care, responsibility or liability assumed, in each case in relation to the accuracy, completeness or reliability of the information contained herein. None of Thungela or each of itsaffiliates, advisors or representatives shall have any liability whatsoever (in negligence or otherwise) for any loss howsoever arising from any use of this material or otherwise arising in connection with this material.
Forward-looking statements and third party information
This presentation includes forward-looking statements. All statements other than statements of historical facts included in this presentation, including, without limitation, those regarding Thungela’s financial position, business, acquisition and divestment strategy,dividend policy, plans and objectives of management for future operations (including development plans and objectives relating to Thungela’s products, production forecasts and Reserve and Resource positions) and environmental, social and corporate governancegoals and aspirations, are forward-looking statements. By their nature, such forward-looking statements involve known and unknown risks, uncertainties and other factors which may cause the actual results, performance or achievements of Thungela or industryresults to be materially different from any future results, performance or achievements expressed or implied by such forward-looking statements.
Such forward-looking statements are based on numerous assumptions regarding Thungela’s present and future business strategies and the environment in which Thungela will operate in the future. Important factors that could cause Thungela’s actual results,performance or achievements to differ materially from those in the forward-looking statements include, among others, levels of actual production during any period, levels of global demand and thermal coal market prices, resource exploration and developmentcapabilities, recovery rates and other operational capabilities, safety, health or environmental incidents, the effects of global pandemics and outbreaks of infectious diseases, the outcome of litigation or regulatory proceedings, the availability of mining and processingequipment, the ability to produce and transport products profitably, the availability of transport infrastructure, the impact of foreign currency exchange rates on market prices, the availability of sufficient credit, the effects of inflation, political uncertainty and economicconditions in South Africa, the actions of competitors, activities by courts, regulators and governmental authorities and changes in taxation or safety, health, environmental or other types of regulation in the countries where Thungela operates and such other riskfactors identified in Thungela’s Pre-Listing Statement and Prospectus. Forward-looking statements should, therefore, be construed in light of such risk factors and undue reliance should not be placed on forward-looking statements. These forward-looking statementsspeak only as of the date of this presentation. Thungela expressly disclaims any obligation or undertaking (except as required by applicable law, the JSE Listings Requirements of the securities exchange of the JSE Limited in South Africa, the UK Listing Rules, theDisclosure and Transparency Rules of the Financial Conduct Authority and any other applicable regulations) to release publicly any updates or revisions to any forward-looking statement contained herein to reflect any change in Thungela’s expectations with regardthereto or any change in events, conditions or circumstances on which any such statement is based.
Nothing in this presentation should be interpreted to mean that future earnings per share of Thungela will necessarily match or exceed its historical published earnings per share. Certain statistical and other information about Thungela included in this presentation issourced from publicly available third party sources. As such it has not been independently verified and presents the views of those third parties, but may not necessarily correspond to the views held by Thungela and Thungela expressly disclaims any responsibilityfor, or liability in respect of, such information.
No Investment Advice
This presentation has been prepared without reference to your particular investment objectives, financial situation, taxation position and particular needs. It is important that you view this presentation in its entirety. If you are in any doubt in relation to these matters,you should consult your stockbroker, bank manager, solicitor, accountant, taxation adviser or other independent financial adviser (where applicable, as authorised under the Financial Advisory and Intermediary Services Act 37 of 2002 in South Africa, or, in the UK,under the Financial Services and Markets Act 2000, or under any other applicable legislation).
Alternative Performance Measures
Throughout this presentation a range of financial and non-financial measures are used to assess our performance, including a number of financial measures that are not defined or specified under IFRS (International Financial Reporting Standards), which are termed‘Alternative Performance Measures’ (APMs). Management uses these measures to monitor the Group’s financial performance alongside IFRS measures to improve the comparability of information between reporting periods and business units. These APMs shouldbe considered in addition to, and not as a substitute for, or as superior to, measures of financial performance, financial position or cash flows reported in accordance with IFRS. APMs are not uniformly defined by all companies, including those in the Group’sindustry. Accordingly, it may not be comparable with similarly titled measures and disclosures by other companies.
3
RESULTS OVERVIEWJuly Ndlovu01
OPERATIONAL PERFORMANCEJuly Ndlovu02
FINANCIAL PERFORMANCEDeon Smith03
OUTLOOK AND CONCLUSIONJuly Ndlovu04
Q&AQuestions through Webinar and Conference Call05
AGENDA

4
Results OverviewJuly Ndlovu | Chief Executive Officer

5
H1 2021 KEY FEATURES
SUCCESSUL TRANSITION
Listed on JSE and LSE on 7 June
One month of economic and operational independence
ROBUST FINANCIAL POSITION
Net cash position of R3.0bn at 30 June 2021 with strong cash generation in June
SAFETY & HEALTH FOCUS
Loss of life incident in H1
Comprehensive COVID-19 response
PRODUCTION AND COST OUTLOOK CONFIRMATION
Export Saleable Production: 15-16Mt
FOB cost per export tonne flat in real terms ~R830
STRONG EARNINGS
Operating Profit of R990m and Adjusted EBITDA1 of R1.9bn
DISCIPLINED CAPITAL ALLOCATION
Low end of capex guidance (R2.6bn to R3.0bn)
Remain committed to dividend policy
Notes:1. Adjusted EBITDA: Profit/(loss) before net finance costs, tax, impairment losses, restructuring costs and termination benefits and depreciation and amortisation
6
SAFETY
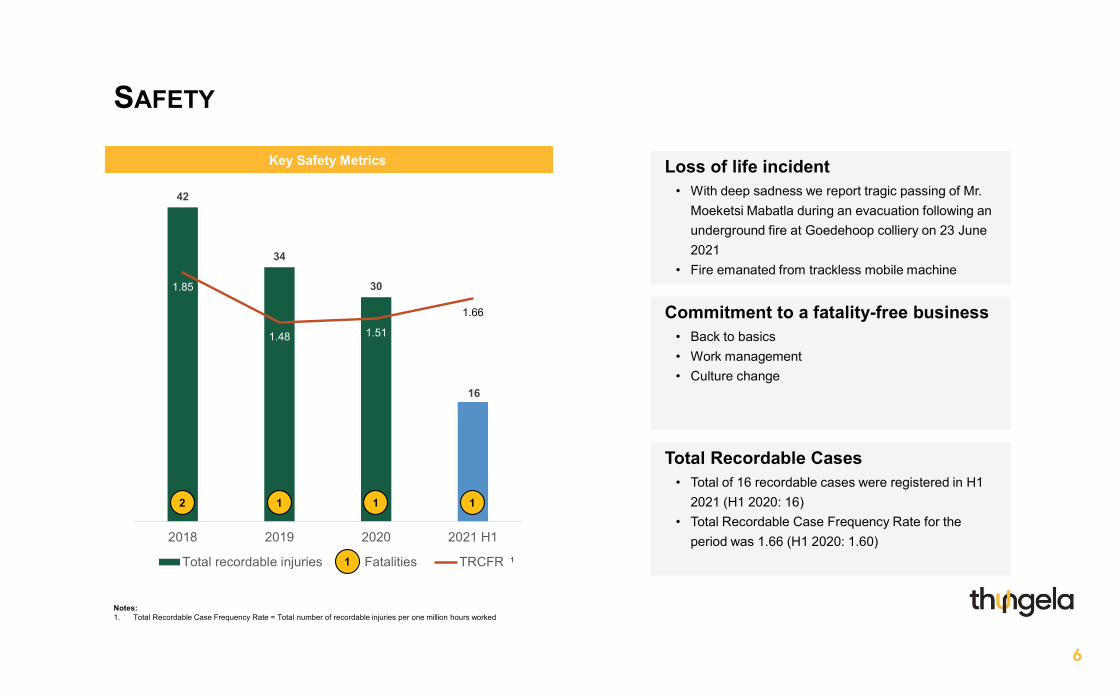
42
34
30
16
1.85
1.48 1.51
1.66
0
0.5
1
1.5
2
2.5
0
5
10
15
20
25
30
35
40
45
2018 2019 2020 2021 H1
Total recordable injuries Fatalities TRCFR
Key Safety Metrics
1
Loss of life incident• With deep sadness we report tragic passing of Mr.
Moeketsi Mabatla during an evacuation following an underground fire at Goedehoop colliery on 23 June 2021
• Fire emanated from trackless mobile machine
Total Recordable Cases• Total of 16 recordable cases were registered in H1
2021 (H1 2020: 16)• Total Recordable Case Frequency Rate for the
period was 1.66 (H1 2020: 1.60)
Commitment to a fatality-free business• Back to basics• Work management• Culture change
1
2 1 1 1
Notes:1. Total Recordable Case Frequency Rate = Total number of recordable injuries per one million hours worked

7
COMPREHENSIVE RESPONSE TO COVID-19 PANDEMIC
We continue to mount a resilient and effective response• Development of COVID-19 critical controls for on-site management of the pandemic
• Procedures include testing, ensuring that social distancing can be maintained in the workplace and detailed contact tracing programmes
• Allows our operations to continue operating safely
Vaccination programme being rolled-out• Highveld Hospital has been approved as a vaccination site
• Currently administering vaccinations to eligible employees, including contractors
• Up to 500 persons vaccinated per week on average
Actions taken have prepared us well for subsequent waves• Highveld Hospital adapted for COVID-19 response
• Established a COVID-19 PCR testing laboratory
• Installed 50 new bed units
• Provision of personal protective equipment, medical supplies and clinical support to 8 clinics

8
SUCCESSFUL LISTING
Listing of Thungela Resources Limited
Thungela Resources Limited on JSE (TGA)
Economic and operational independence• Demerger effective from 4 June 2021• TGA started trading on JSE (Primary Listing) and LSE
(Standard Listing) on 7 June 2021• One month of economic and operational independence
Fully-fledged standalone business• Critical functions and services standalone within Thungela• Some services provided under Transitional Services
Agreements• Planning started to initiate final transition to full standalone
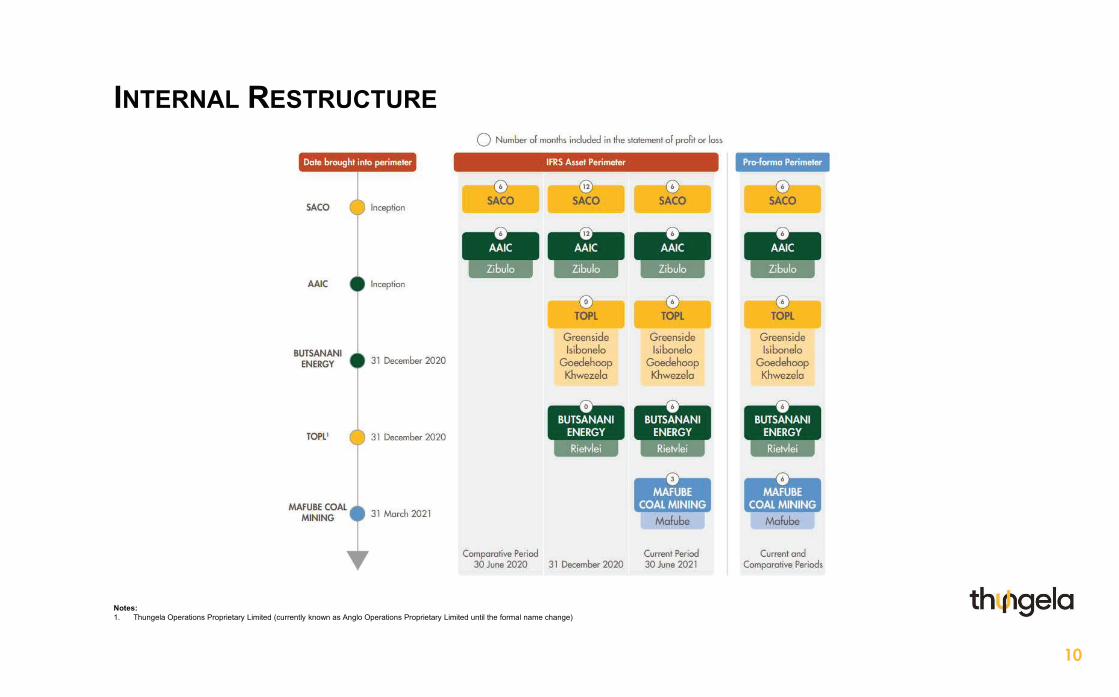
Demerger preparation and regulatory approval• Internal Restructure commenced in 2020 and completed
immediately prior to Demerger • Resultant comparative complexities necessitated having to
present IFRS and Pro Forma Information
0
5
10
15
20
25
30
35
40
45
50
List
ing
on
7 Ju
n 20
21
R/share
11 A
ug 2
021
30 J
un 2
021

9
CREATING SHARED VALUE
Thungela Community and Employee Partnership Plans
Community Partnership Plan
Employee Partnership Plan
SACO1
5% 5%90%
Lasting benefits for stakeholders• Nkulo Community Partnership Plan• SACO Employee Partnership Plan • Each plan purchased 5% of the issued share capital
of SACO1 from Thungela immediately before the Demerger
Additional minimum benefits• Community Partnership Trust entitled to a
preference dividend2 of a minimum of R6m p.a. until 2024 - first payment to Trust made in June 2021
• Employee Partnership Trust entitled to minimum dividend2 of R4,000 pa3 per eligible employee
Unique fully funded model• Purchase of the shares fully funded by Thungela• Trusts entitled to 10% collectively of ordinary
dividends declared by SACO through holding of ordinary shares
Notes:1. South Africa Coal Operations Proprietary Limited 2. Special share classes established to facilitate the payment of the minimum dividends to both the employee and community partnership plans (additional benefits to the ordinary shares)3. Qualifying employees only. Guaranteed until 2024. Vesting three years after grant date.
10
INTERNAL RESTRUCTURE
Notes:1. Thungela Operations Proprietary Limited (currently known as Anglo Operations Proprietary Limited until the formal name change)
11
Operational PerformanceJuly Ndlovu | Chief Executive Officer
12
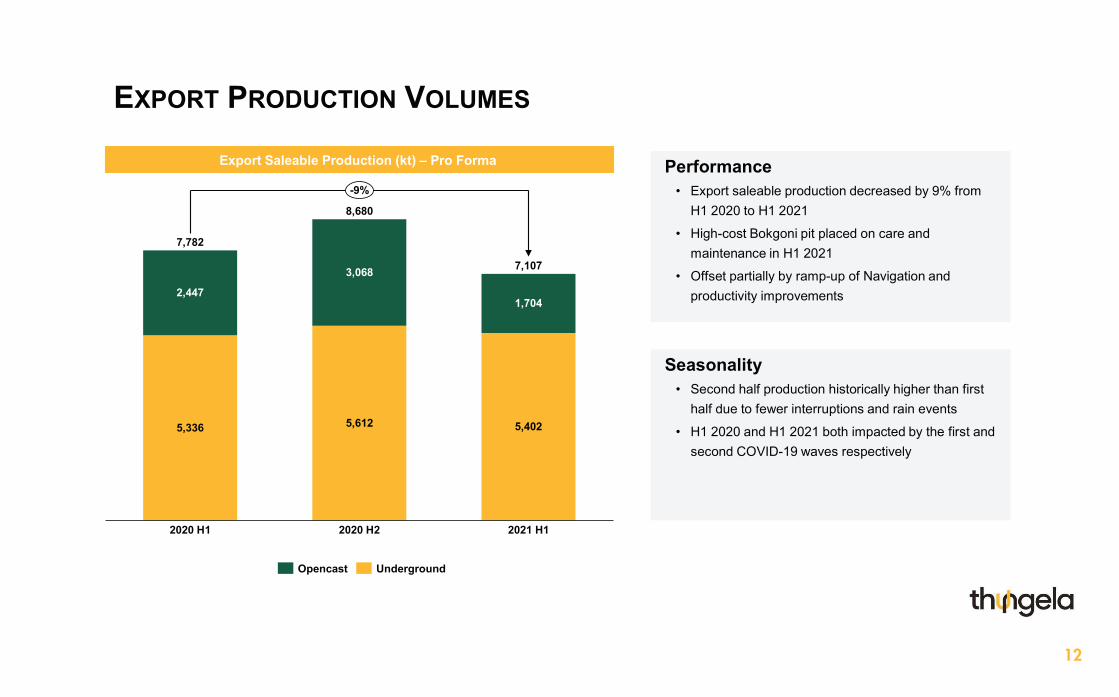
EXPORT PRODUCTION VOLUMES
Export Saleable Production (kt) – Pro Forma Performance• Export saleable production decreased by 9% from
H1 2020 to H1 2021
• High-cost Bokgoni pit placed on care and maintenance in H1 2021
• Offset partially by ramp-up of Navigation and productivity improvements
Seasonality• Second half production historically higher than first
half due to fewer interruptions and rain events
• H1 2020 and H1 2021 both impacted by the first and second COVID-19 waves respectively
2020 H1
7,782
8,680
7,107
2020 H2 2021 H1
2,447
5,336
3,068
5,612
1,704
5,402
-9%
Opencast Underground

13
EXPORT PRODUCTION VOLUMES
Export Saleable Production (kt) Structure impact on IFRS vs. Pro Forma• IFRS H1 2020 included only AAIC
• IFRS H1 2021 included Mafube from 1 April 2021
• Pro Forma adjustments made to reflect the current and forward-looking asset perimeter
Khwezela reconfiguration• High-cost volumes removed at Bokgoni
• Navigation ramp-up progressing
• Umlalazi continues to ramp down towards end of 2021 as reserves are depleted
COVID-19 impact• H1 2020 hard lockdown: most pronounced
pandemic-related operational interruption to date
• H1 2021 Wave 2 impact offset by productivity improvements
389 446
H1 2020 IFRS
6,247
Care and maintenance
Structure H1 2020 Pro Forma
Productivity and ramp-up
1,064
H1 2021 Pro Forma
Structure H1 2021 IFRS
1,535
7,782
7,107
6,661

14
Financial PerformanceDeon Smith | Chief Financial Officer
15
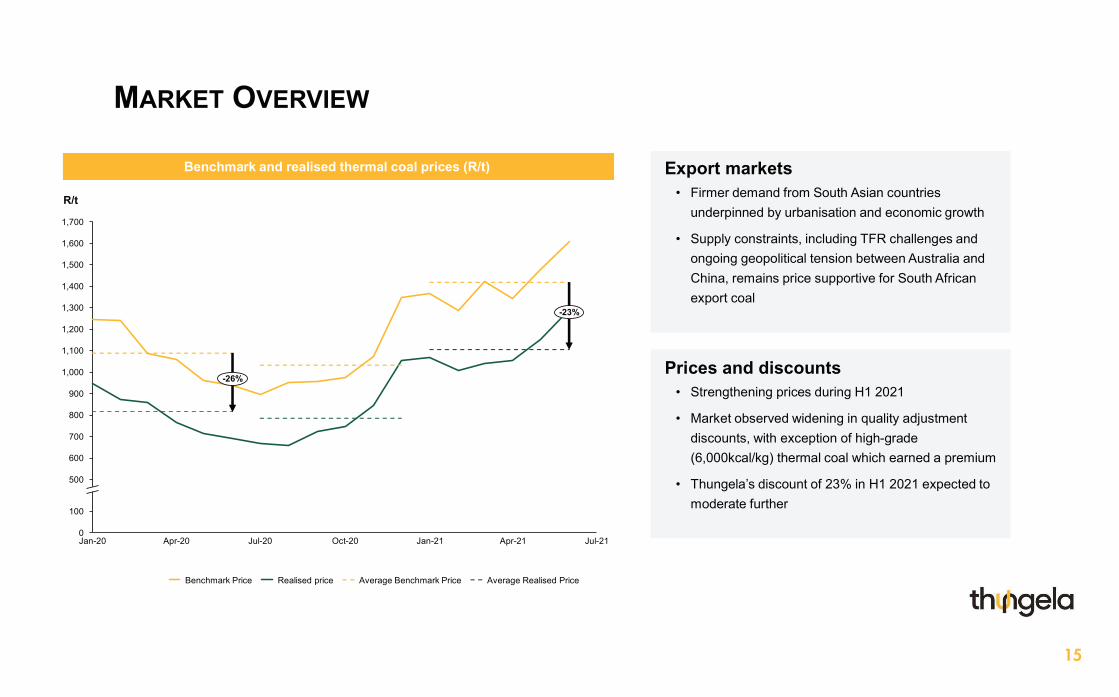
MARKET OVERVIEW
Export markets• Firmer demand from South Asian countries
underpinned by urbanisation and economic growth
• Supply constraints, including TFR challenges and ongoing geopolitical tension between Australia and China, remains price supportive for South African export coal
Prices and discounts• Strengthening prices during H1 2021
• Market observed widening in quality adjustment discounts, with exception of high-grade (6,000kcal/kg) thermal coal which earned a premium
• Thungela’s discount of 23% in H1 2021 expected to moderate further
Benchmark and realised thermal coal prices (R/t)
R/t
600
Jul-20 Apr-21 Jul-21
100
1,400
0
500
800
900
1,100
1,000
Jan-21Oct-20
700
Apr-20
1,500
Jan-20
1,600
1,300
1,200
1,700
-23%
-26%
Benchmark Price Realised price Average Benchmark Price Average Realised Price
16
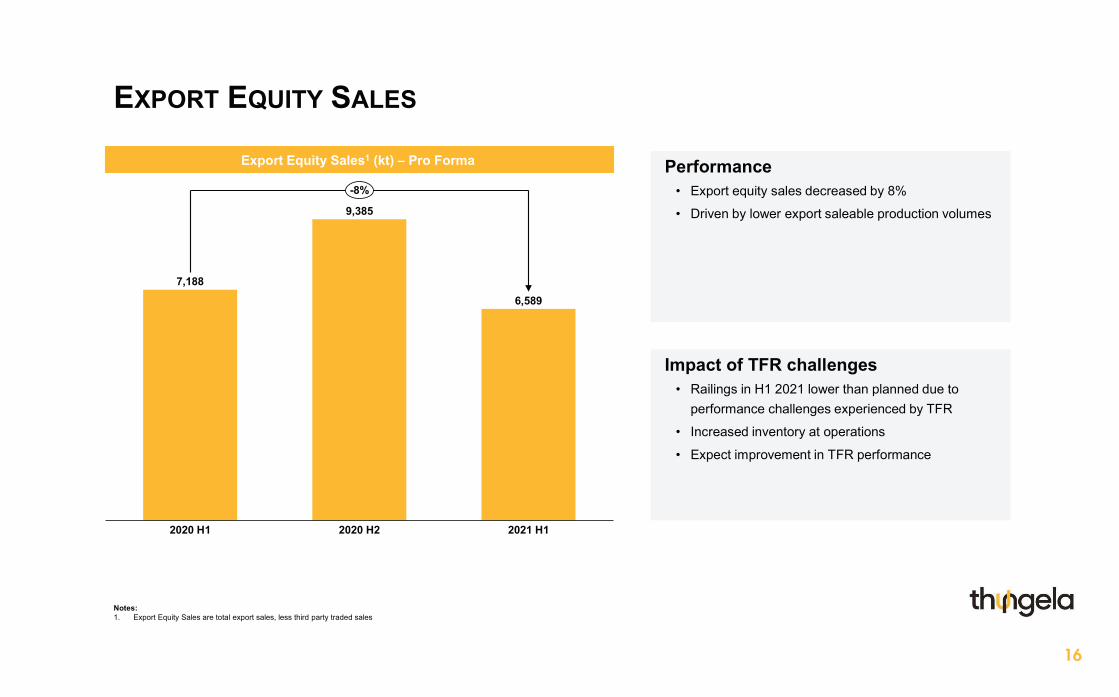
EXPORT EQUITY SALES
Export Equity Sales1 (kt) – Pro Forma Performance• Export equity sales decreased by 8%
• Driven by lower export saleable production volumes
Impact of TFR challenges• Railings in H1 2021 lower than planned due to
performance challenges experienced by TFR
• Increased inventory at operations
• Expect improvement in TFR performance
Notes:1. Export Equity Sales are total export sales, less third party traded sales
2020 H1 2020 H2
7,188
2021 H1
9,385
6,589
-8%
17
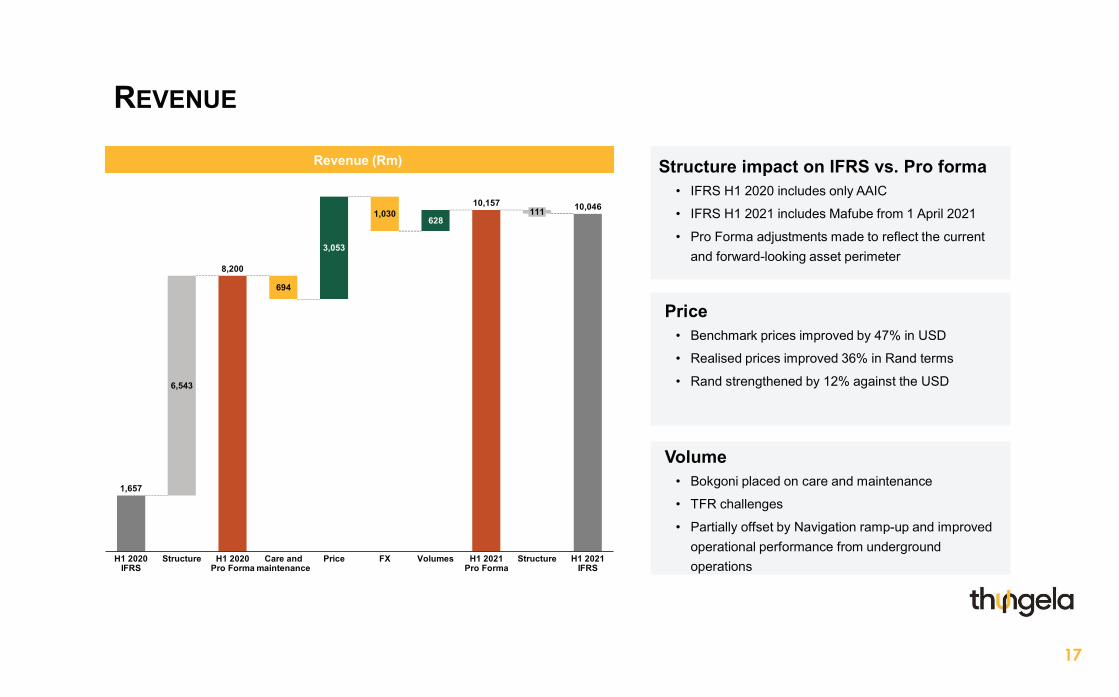
REVENUE
Price• Benchmark prices improved by 47% in USD
• Realised prices improved 36% in Rand terms
• Rand strengthened by 12% against the USD
Revenue (Rm)
Volume• Bokgoni placed on care and maintenance
• TFR challenges
• Partially offset by Navigation ramp-up and improved operational performance from underground operations
Structure impact on IFRS vs. Pro forma• IFRS H1 2020 includes only AAIC
• IFRS H1 2021 includes Mafube from 1 April 2021
• Pro Forma adjustments made to reflect the current and forward-looking asset perimeter
694
628
3,053
H1 2020 Pro Forma
Care and maintenance
H1 2020 IFRS
6,543
Structure Price
1,030
FX Volumes H1 2021 Pro Forma
111
Structure H1 2021 IFRS
8,200
1,657
10,157 10,046
18
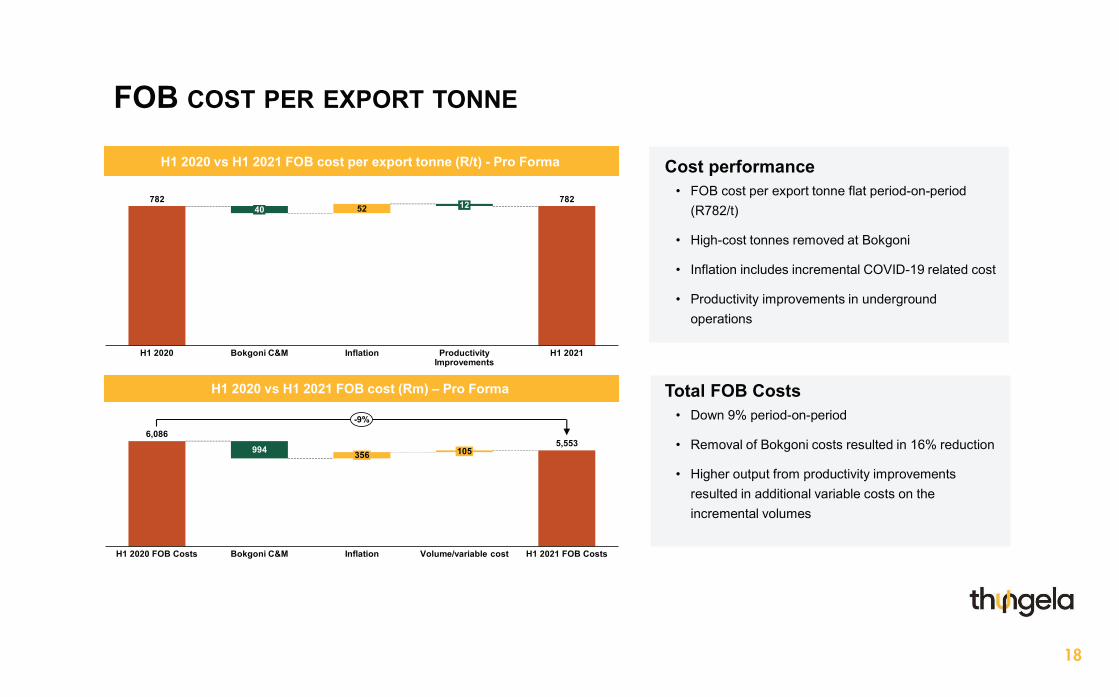
FOB COST PER EXPORT TONNE
H1 2020 vs H1 2021 FOB cost per export tonne (R/t) - Pro Forma
H1 2020 vs H1 2021 FOB cost (Rm) – Pro Forma
Cost performance• FOB cost per export tonne flat period-on-period
(R782/t)
• High-cost tonnes removed at Bokgoni
• Inflation includes incremental COVID-19 related cost
• Productivity improvements in underground operations
Total FOB Costs• Down 9% period-on-period
• Removal of Bokgoni costs resulted in 16% reduction
• Higher output from productivity improvements resulted in additional variable costs on the incremental volumes
782 78252
Productivity Improvements
Bokgoni C&MH1 2020
40
Inflation
12
H1 2021
994
Bokgoni C&MH1 2020 FOB Costs
356 105
Inflation Volume/variable cost H1 2021 FOB Costs
6,0865,553
-9%
19
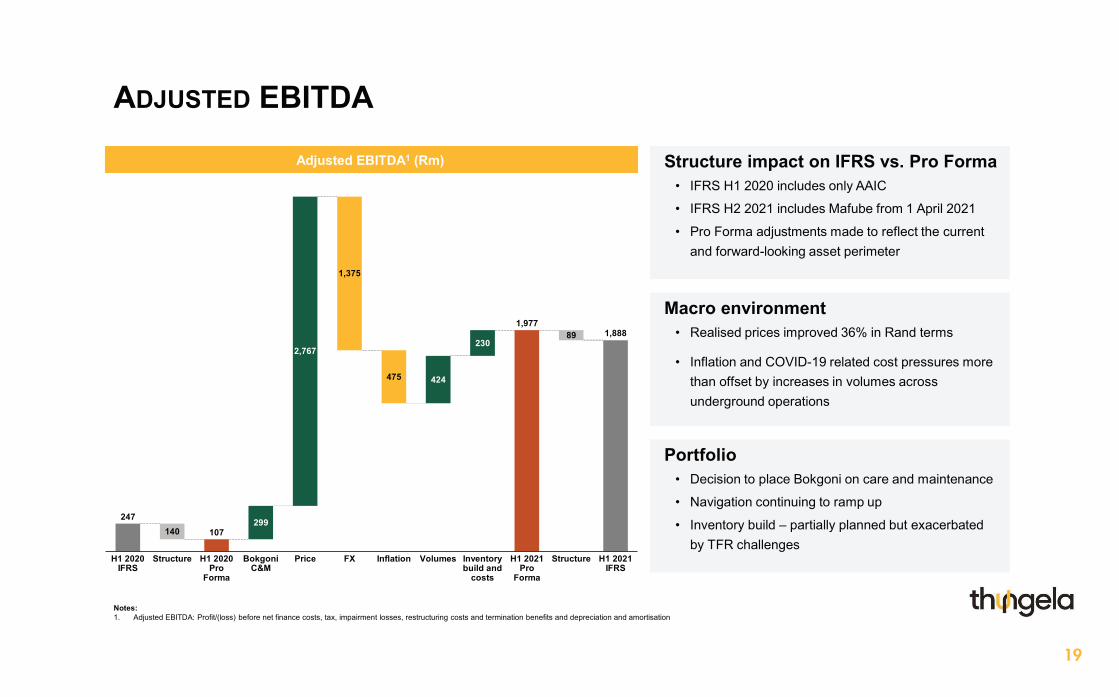
ADJUSTED EBITDA
Macro environment• Realised prices improved 36% in Rand terms
• Inflation and COVID-19 related cost pressures more than offset by increases in volumes across underground operations
Adjusted EBITDA1 (Rm)
Portfolio• Decision to place Bokgoni on care and maintenance
• Navigation continuing to ramp up
• Inventory build – partially planned but exacerbated by TFR challenges
Structure impact on IFRS vs. Pro Forma• IFRS H1 2020 includes only AAIC
• IFRS H2 2021 includes Mafube from 1 April 2021
• Pro Forma adjustments made to reflect the current and forward-looking asset perimeter
247107140
299
475 424
23089
Bokgoni C&M
2,767
Structure PriceH1 2020 IFRS
H1 2020 Pro
Forma
1,375
FX Inflation Volumes Inventory build and
costs
H1 2021 Pro
Forma
Structure H1 2021 IFRS
1,9771,888
Notes:1. Adjusted EBITDA: Profit/(loss) before net finance costs, tax, impairment losses, restructuring costs and termination benefits and depreciation and amortisation
20
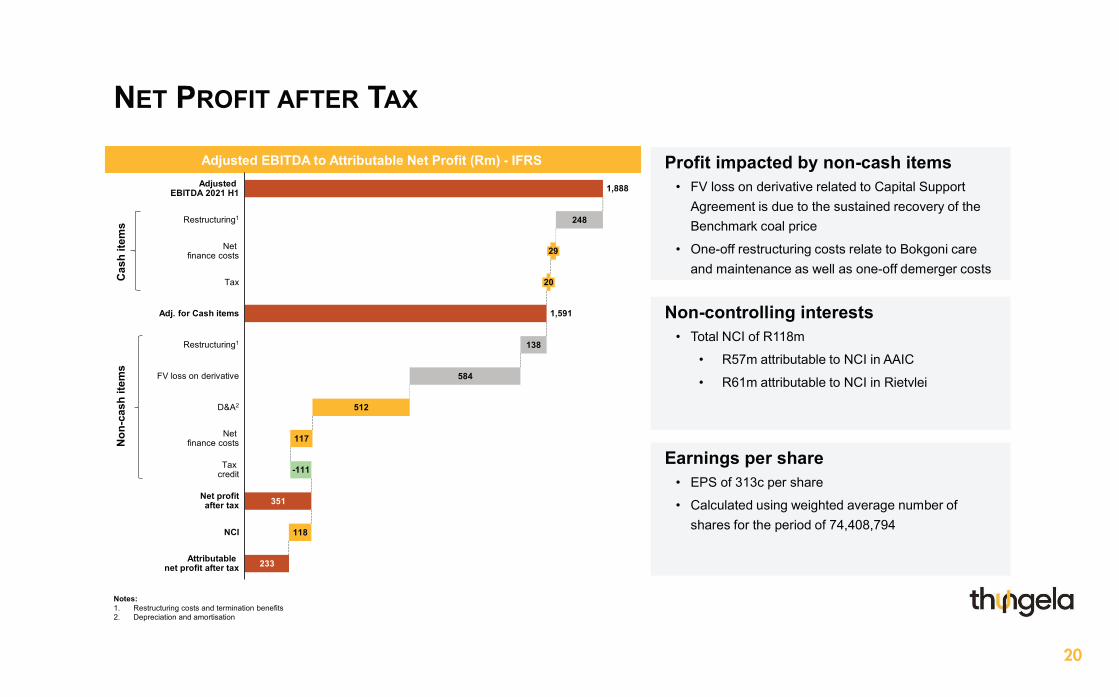
NET PROFIT AFTER TAX
Profit impacted by non-cash items• FV loss on derivative related to Capital Support
Agreement is due to the sustained recovery of the Benchmark coal price
• One-off restructuring costs relate to Bokgoni care and maintenance as well as one-off demerger costs
Earnings per share• EPS of 313c per share
• Calculated using weighted average number of shares for the period of 74,408,794
Non-controlling interests• Total NCI of R118m
• R57m attributable to NCI in AAIC
• R61m attributable to NCI in Rietvlei
Adjusted EBITDA to Attributable Net Profit (Rm) - IFRS
351
233
248
138
584
512
117
118
Tax
Restructuring1
20
29
Restructuring1
Adjusted EBITDA 2021 H1
D&A2
Net finance costs
Adj. for Cash items
FV loss on derivative
Net profitafter tax
Net finance costs
-111Tax credit
NCI
Attributable net profit after tax
1,888
1,591
Cas
h ite
ms
Non
-cas
h ite
ms
Notes:1. Restructuring costs and termination benefits2. Depreciation and amortisation
21
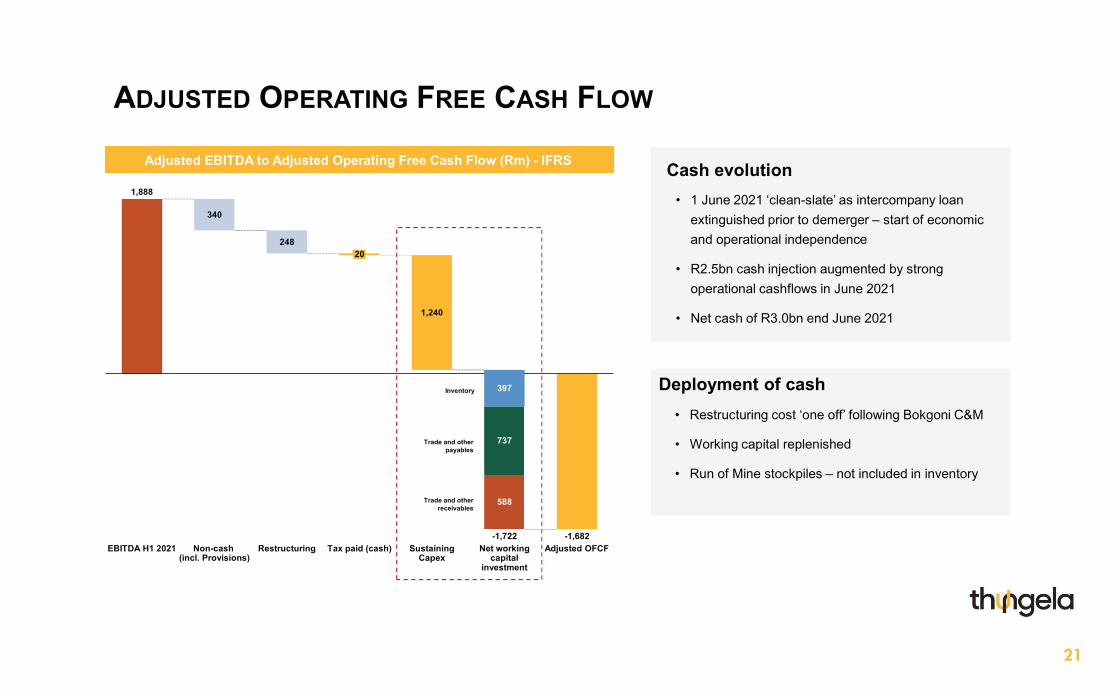
ADJUSTED OPERATING FREE CASH FLOW
Adjusted EBITDA to Adjusted Operating Free Cash Flow (Rm) - IFRS Cash evolution• 1 June 2021 ‘clean-slate’ as intercompany loan
extinguished prior to demerger – start of economic and operational independence
• R2.5bn cash injection augmented by strong operational cashflows in June 2021
• Net cash of R3.0bn end June 2021
Inventory
Trade and other payables
Trade and other receivables
Deployment of cash• Restructuring cost ‘one off’ following Bokgoni C&M
• Working capital replenished
• Run of Mine stockpiles – not included in inventory
340
24820
Sustaining Capex
RestructuringEBITDA H1 2021 Non-cash (incl. Provisions)
1,240
Tax paid (cash)
397
-1,722
737
588
Net working capital
investment
Adjusted OFCF
1,888
-1,682
22
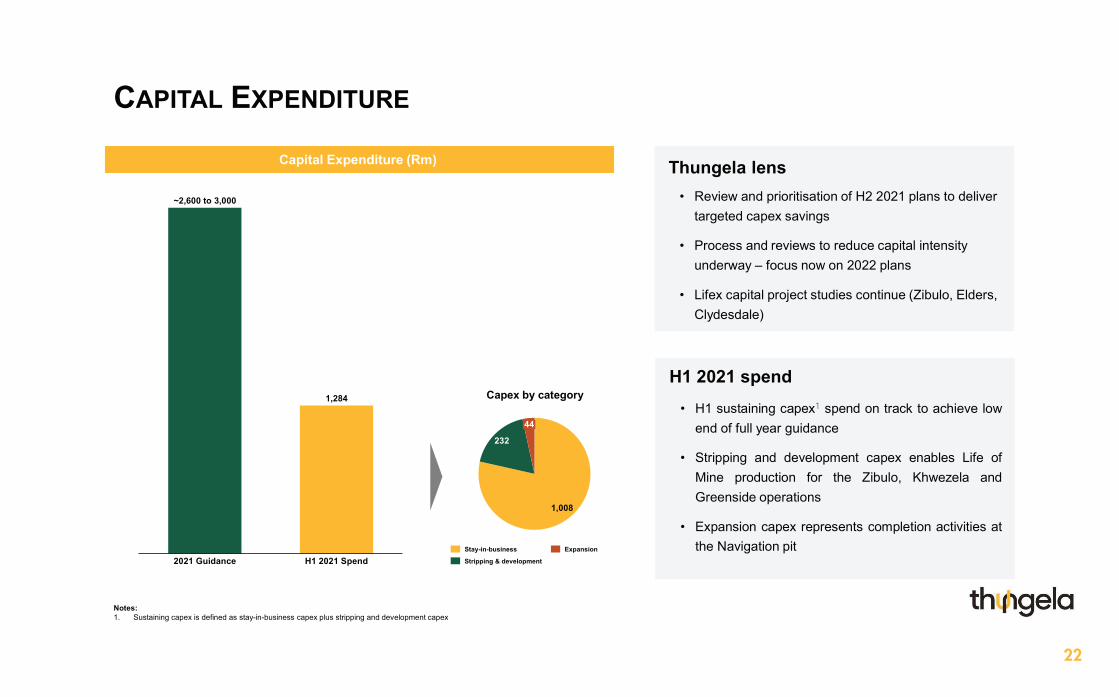
CAPITAL EXPENDITURE
Capital Expenditure (Rm)
H1 2021 spend• H1 sustaining capex1 spend on track to achieve low
end of full year guidance
• Stripping and development capex enables Life ofMine production for the Zibulo, Khwezela andGreenside operations
• Expansion capex represents completion activities atthe Navigation pit
Thungela lens• Review and prioritisation of H2 2021 plans to deliver
targeted capex savings
• Process and reviews to reduce capital intensity underway – focus now on 2022 plans
• Lifex capital project studies continue (Zibulo, Elders, Clydesdale)
1,008
232
44
ExpansionStay-in-business
Stripping & development2021 Guidance H1 2021 Spend
1,284
~2,600 to 3,000
Capex by category
Notes:1. Sustaining capex is defined as stay-in-business capex plus stripping and development capex
23
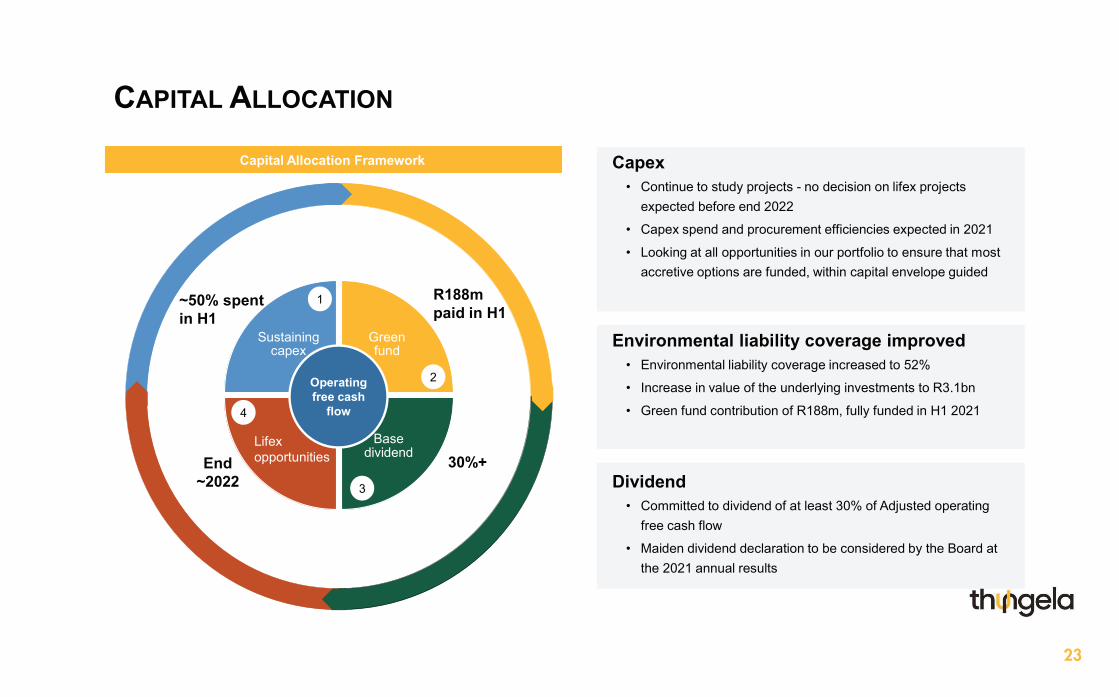
CAPITAL ALLOCATION
Dividend• Committed to dividend of at least 30% of Adjusted operating
free cash flow
• Maiden dividend declaration to be considered by the Board at the 2021 annual results
Capex• Continue to study projects - no decision on lifex projects
expected before end 2022
• Capex spend and procurement efficiencies expected in 2021
• Looking at all opportunities in our portfolio to ensure that most accretive options are funded, within capital envelope guided
Environmental liability coverage improved• Environmental liability coverage increased to 52%
• Increase in value of the underlying investments to R3.1bn
• Green fund contribution of R188m, fully funded in H1 2021
Sustainingcapex
Green fund
Base dividend
Operating free cash
flow
Lifex opportunities
1
2
3
4
30%+End~2022
~50% spent in H1
R188m paid in H1
Capital Allocation Framework

24
Outlook & ConclusionJuly Ndlovu | Chief Executive Officer
25
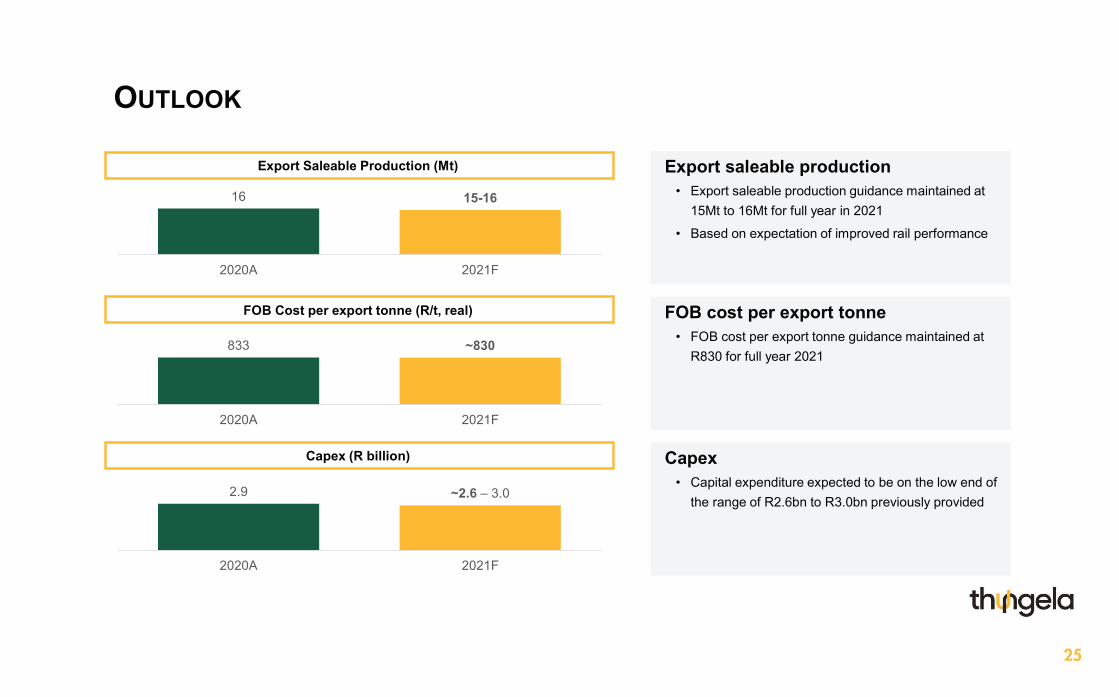
OUTLOOK
Export Saleable Production (Mt) Export saleable production• Export saleable production guidance maintained at
15Mt to 16Mt for full year in 2021
• Based on expectation of improved rail performance
Capex• Capital expenditure expected to be on the low end of
the range of R2.6bn to R3.0bn previously provided
FOB cost per export tonne• FOB cost per export tonne guidance maintained at
R830 for full year 2021
16 15-16
2020A 2021F
FOB Cost per export tonne (R/t, real)
833 ~830
2020A 2021F
Capex (R billion)
2.9 ~2.6 – 3.0
2020A 2021F
26
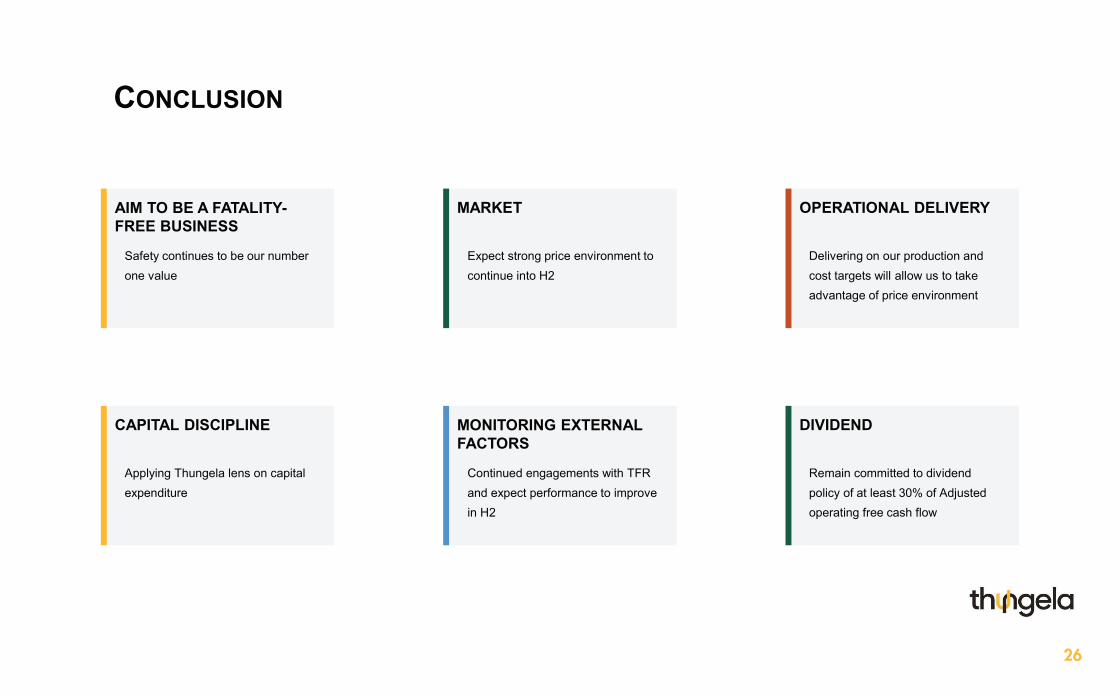
CONCLUSION
AIM TO BE A FATALITY-FREE BUSINESS
Safety continues to be our number one value
CAPITAL DISCIPLINE
Applying Thungela lens on capital expenditure
MARKET
Expect strong price environment to continue into H2
MONITORING EXTERNAL FACTORS
Continued engagements with TFR and expect performance to improve in H2
OPERATIONAL DELIVERY
Delivering on our production and cost targets will allow us to take advantage of price environment
DIVIDEND
Remain committed to dividend policy of at least 30% of Adjusted operating free cash flow

27
Q&A
28
Thank you


