16
September 2017

September 2017

Table of Contents
• Investment Styles
• Product Rationale
• Current Investment Strategy
• The Matching Principle Explained
• Fund Suitability
• Why HDFC Top 200?
• Portfolio Facts
• Product Features
• Asset Allocation
• Performance
• Disclaimer & Risk Factors
2

Investment Styles
• Active Management: Refers to the use of a human element, such as a single manager, co-managers or a team of managers, toactively manage a fund’s portfolio. They rely on analytical research, forecasts and their own judgment and experience inmaking investment decisions. They believe it is possible to profit from the stock market through any number of strategies thataim to identify mis-priced securities
• Passive Management: An investment strategy that mirrors a market index and does not attempt to beat the market
3
HDFC Mutual Fund/AMC is not guaranteeing returns on investments made in this scheme. The current investment strategy is subject to change depending on the market conditions

Product Rationale
• In the nature of an Index + Fund (active + passive); internal guidelines of matched positions with the index (refer slides 7&8)
• Focus on GARP (growth at reasonable price) for active positions
• Limited exposure to mid-caps; avoids large individual positions in mid-caps
• Offers portfolio diversification comparable to market indices
4
HDFC Mutual Fund/AMC is not guaranteeing returns on investments made in this scheme. The current investment strategy is subject to change depending on the market conditions

Current Investment Strategy
• The investment portfolio for equity and equity linked instruments will be primarily drawn from the companies in the S&P BSE 200 Index
• The fund seeks to invest in higher quality, competitive, sustainable businesses by primarily restricting the equity portfolio to the S&P BSE 200 Index scrips; this is intended to reduce risks while maintaining steady growth
• Focuses on secular growth companies compared to cyclicals; this strategy reduces risk on one hand and improves chances of positive returns over the long term
• This includes participation in large IPO’s wherein the market capitalization of the company based on issue price would make the company a part of the top 200 companies listed on the BSE based on market capitalization
5
HDFC Mutual Fund/AMC is not guaranteeing returns on investments made in this scheme. The current investment strategy is subject to change depending on the market conditions
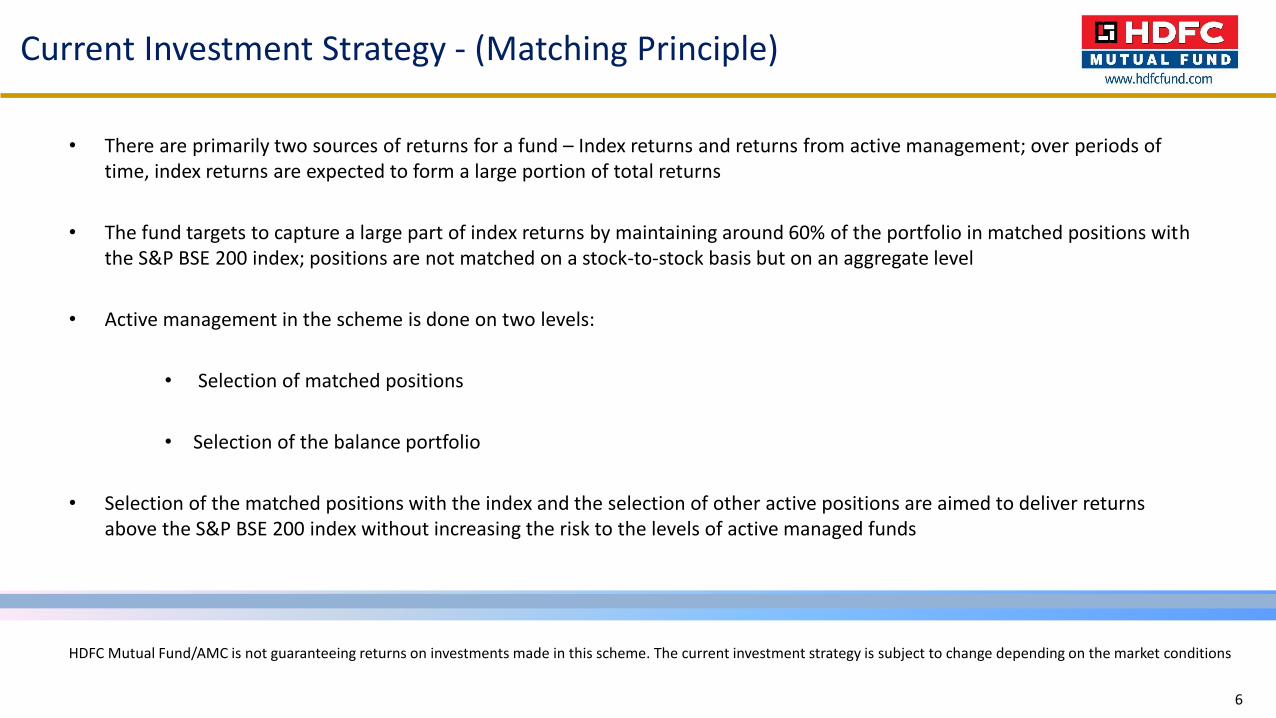
Current Investment Strategy - (Matching Principle)
• There are primarily two sources of returns for a fund – Index returns and returns from active management; over periods of time, index returns are expected to form a large portion of total returns
• The fund targets to capture a large part of index returns by maintaining around 60% of the portfolio in matched positions with the S&P BSE 200 index; positions are not matched on a stock-to-stock basis but on an aggregate level
• Active management in the scheme is done on two levels:
• Selection of matched positions
• Selection of the balance portfolio
• Selection of the matched positions with the index and the selection of other active positions are aimed to deliver returns above the S&P BSE 200 index without increasing the risk to the levels of active managed funds
6
HDFC Mutual Fund/AMC is not guaranteeing returns on investments made in this scheme. The current investment strategy is subject to change depending on the market conditions

Stocks referred above are purely illustrative and are not recommended by HDFC Mutual Fund / HDFC Asset Management Company Ltd. The Fund may or may not have any presentor future position in these stocks.
Name of the Company
Weight on The S&P BSE 200 (%)
% of NAV Matched Weight (%)
SBI 2.32 7.51 2.32
ITC Ltd 3.76 3.83 3.76
HDFC BANK 2.67 3.10 2.67
Infosys Ltd. 2.73 6.94 2.73
||
Top 200 Companies
||
Contribute roughly 50% of the NAV
||
Contribute roughly 60% of the Matched Weight
The Matching Principle Explained
7
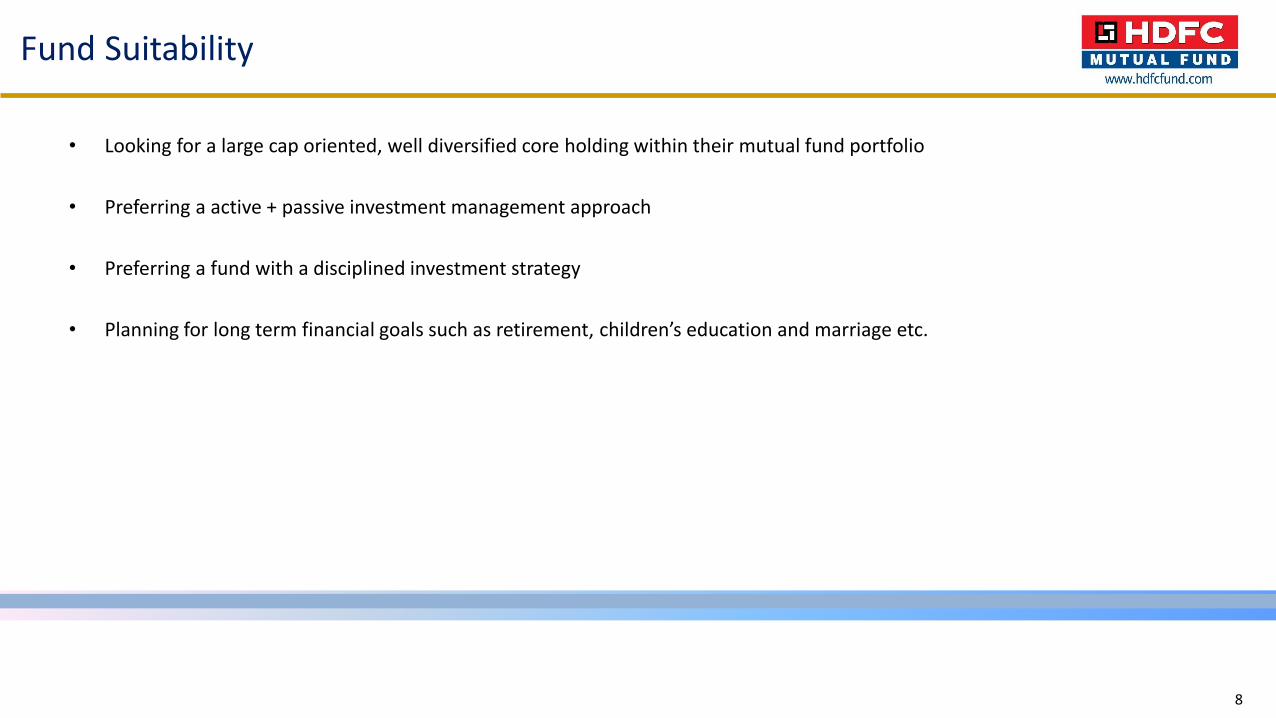
Fund Suitability
• Looking for a large cap oriented, well diversified core holding within their mutual fund portfolio
• Preferring a active + passive investment management approach
• Preferring a fund with a disciplined investment strategy
• Planning for long term financial goals such as retirement, children’s education and marriage etc.
8

Why HDFC Top 200 Fund?
• The fund is by design well diversified, hence is a lower risk product compared to less diversified funds
• Well defined investment universe primarily comprising S&P BSE 200 companies and Top 200 capitalized companies supports good quality of portfolio, which also reduces risk
• Well established track record of ~ 20 years*
*Past performance may or may not be sustained in the future. Please refer scheme performance summary on slide 14.
9

31.68
11.47
6.28 6.04 5.7 5.45 5.13 4.663.37 3.02
15.68
0
5
10
15
20
25
30
35
Banks Software Power ConstructionProject
Auto Finance PetroleumProducts
Pharmaceuticals Consumer NonDurables
Ferrous Metals Others (11Sectors)
Portfolio Classification by Asset Class(%)
Portfolio Facts
** Average AUM for the month of August 2017.Sectors referred above are as per the current portfolio of the HDFC top 200 fund and may or may not be held in the future. For complete portfolio details visitwww.hdfcfund.com
10
ParticularsTop 10 Equity & Equity Related
Holdings
Total Equity & Equity Related
Holdings
Other Cash, Cash Equivalents And Net
Current Assets
Average AUM (Rs. In Crore)
% To Net Assets 48.42 98.48 1.52 14,910.06**

Dividend History
• Consistent dividends across market cycles
• Uninterrupted dividend track record of over 16 years.
** NAV of the Direct Plan - Dividend Option = Rs. 54.388^Past performance may or may not be sustained in the future.All dividends are on face value of Rs. 10 per unit. After payment of the dividend, the per Unit NAV falls to the extent of the payout and statutory levy (if applicable). There is no
assurance or guarantee to unit holders as to rate/quantum of dividend distribution nor that the dividends will be paid regularly. Please log on to www.hdfcfund.com
for Record Date-wise listing of dividends declared. 11
Record Date Feb-06 Feb-07 07-Feb-08 Mar-09 Mar-10 Mar-11 Mar-12 Mar-13 Mar-14 Mar-15 Mar-16 Mar-17
Cum Dividend NAV per Unit
(Rs.) 36.41 42.97 48.13 23.36 46.58 48 42.78 43.25 42.48 58.08 43.23 52.76
Dividend ^Per Unit (Rs.)
4.5 5 5 3 4 4 4 4 4 5 3.5 4.5
Dividend Yield 12.36% 11.64% 10.39% 12.84% 8.59% 8.33% 9.35% 9.25% 9.42% 8.61% 8.09% 8.53%

Product Features
Type of Scheme Open-ended Growth Scheme
Inception Date(Date of allotment)
October 11, 1996
Investment Objective To generate long term capital appreciation from a portfolio of equity and equity-linked instruments primarily drawn from the companies in theBSE 200 index
Fund Manager $ Prashant Jain
Investment Plan Direct Plan, Regular Plan
Investment Options Under Each Plan : Growth & Dividend. The Dividend Option offers Dividend Payout and Reinvestment facility.
Minimum Application Amount(Under Each Plan /Option)
Purchase: Rs. 5,000 and any amount thereafterAdditional Purchase: Rs. 1,000 and any amount thereafter
Load Structure Entry Load: Not Applicable. Upfront commission shall be paid directly by the investor to the ARNHolder (AMFI registered Distributor) based on the investor’s assessment of various factors includingthe service rendered by the ARN Holder.Exit Load:
• In respect of each purchase / switch – in of units, an exit load of 1.00% is payable if units are redeemed / switched – out within 12months from the date of allotment.
• No exit load is payable if units are redeemed / switched out after 12 months from the date of allotment.
In respect of Systematic Transactions such as SIP, GSIP, STP, Flex STP, Swing STP, Flex index, Exit Load, if any, prevailing on the date ofregistration / enrolment shall be levied. For further details on load structure, please refer to the Scheme Information Document/Keyinformation memorandum of the Scheme.
Benchmark S&P BSE 200 Index
$ Dedicated Fund Manager for Overseas Investments: Mr. Rakesh VyasFor further details please refer SID/KIM available on www.hdfcfund.com and at Investor Service Centers of HDFC Mutual Fund
12
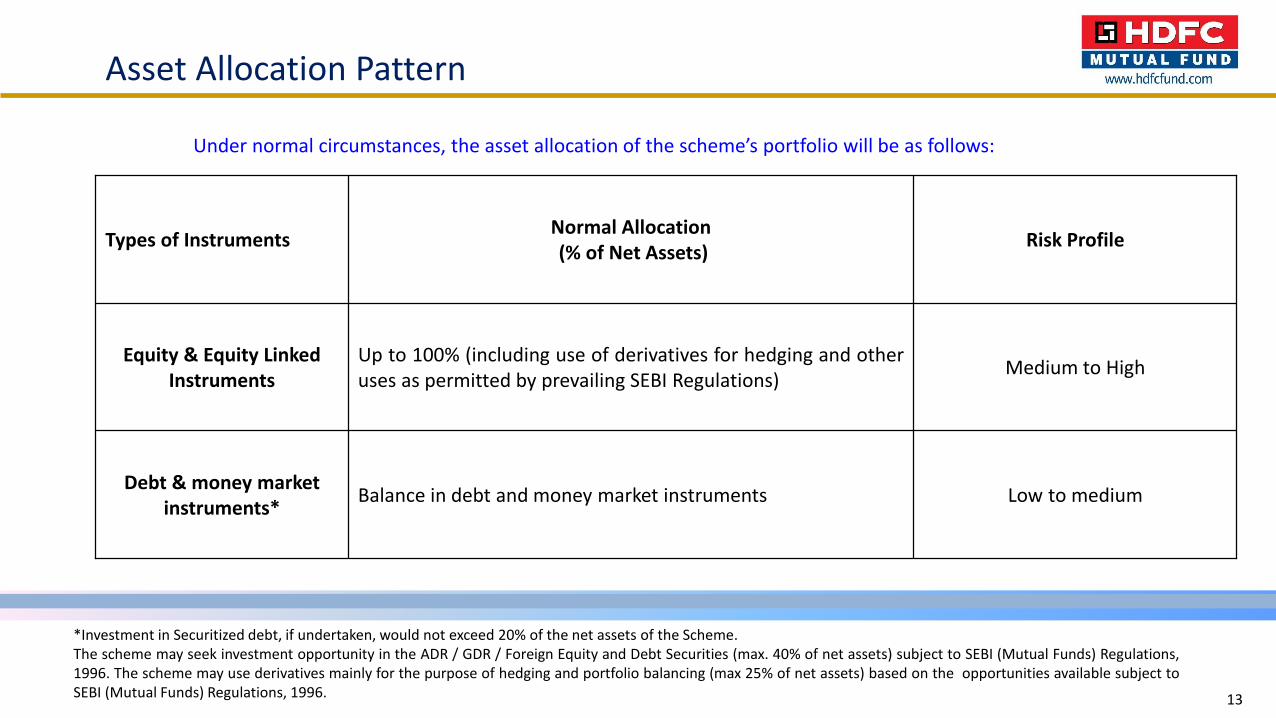
*Investment in Securitized debt, if undertaken, would not exceed 20% of the net assets of the Scheme.The scheme may seek investment opportunity in the ADR / GDR / Foreign Equity and Debt Securities (max. 40% of net assets) subject to SEBI (Mutual Funds) Regulations,1996. The scheme may use derivatives mainly for the purpose of hedging and portfolio balancing (max 25% of net assets) based on the opportunities available subject toSEBI (Mutual Funds) Regulations, 1996.
Asset Allocation Pattern
Under normal circumstances, the asset allocation of the scheme’s portfolio will be as follows:
Types of InstrumentsNormal Allocation(% of Net Assets)
Risk Profile
Equity & Equity Linked Instruments
Up to 100% (including use of derivatives for hedging and otheruses as permitted by prevailing SEBI Regulations)
Medium to High
Debt & money market instruments*
Balance in debt and money market instruments Low to medium
13
Scheme Performance Summary
14
Scheme Returns
(%)$$
Benchmark
Returns (%) #
Additional
Benchmark
Returns (%) ##
Scheme $$ Benchmark Additional
Benchmark
Last 1 year 16.95 15.02 11.52 11,695 11,502 11,152
Last 3 years 10.08 10.22 5.98 13,353 13,405 11,912
Last 5 years 17.37 15.32 12.72 22,282 20,407 18,205
Since inception 20.87 13.39 11.67 525,356 138,242 100,396
Performance of other schemes managed by Prashant Jain
3 year 5 year
CAGR (in %) CAGR (in %)
HDFC Equity Fund 19-Jun-03 17.89 10.33 18.88
NIFTY 500 Index 16.08 10.94 16.05
HDFC Prudence Fund 19-Jun-03 16.78 11.61 18.42
CRISIL Balanced Fund –
Aggressive Index11.78 9.02 12.38
HDFC MF Monthly Income
Plan - LTP# 26-Dec-0310.33 10.68 11.96
CRISIL MIP Blended Index 9.93 10.63 10.3
Prashant Jain manages 4 schemes
Past performance may or may not be sustained in the future. Returns greater than 1 year period are compounded annualised (CAGR). The above
returns are of Regular plan -growth option. #The Scheme is co - managed by Prashant Jain(Equities) and Shobhit Mehrotra (Debt). Load is not taken
into consideration for computation of performance. On account of difference in the type of the Scheme, asset allocation, investment strategy,
inception dates, the performance of these schemes is strictly not comparable. Returns as on 31st August 2017
Different plans viz. Regular Plan and Direct Plan have a different expense structure. The expenses of the Direct Plan under the Scheme will be lower
to the extent of the distribution expenses/ commission charged in the Regular Plan
Value of Rs 10,000 invested
Past performance may or may not be sustained in the future. Returns greater than 1 year period are compounded annualized (CAGR). Load is not
taken into consideration for computation of performance. # S&P BSE 200 ## S&P BSE SENSEX. $$ All dividends declared prior to the splitting of the
Scheme into Dividend & Growth Options are assumed to be reinvested in the units of the Scheme at the then prevailing NAV (ex-dividend NAV).
Different plans viz. Regular Plan and Direct Plan have a different expense structure. The expenses of the Direct Plan under the Scheme will be lower
to the extent of the distribution expenses / commission charged in the Regular Plan. Returns as on 31th August 2017
Scheme
Tenure for
managing the
scheme
Cumulative Performance
1 year

Disclaimer & Risk Factors
This presentation dated 14th September 2017 has been prepared by HDFC Asset Management Company Limited (HDFC AMC) basedon internal data, publicly available information and other sources believed to be reliable. Any calculations made areapproximations, meant as guidelines only, which you must confirm before relying on them. The information contained in thisdocument is for general purposes only. The document is given in summary form and does not purport to be complete. Thedocument does not have regard to specific investment objectives, financial situation and the particular needs of any specificperson who may receive this document. The information/ data herein alone are not sufficient and should not be used for thedevelopment or implementation of an investment strategy. The statements contained herein are based on our current views andinvolve known and unknown risks and uncertainties that could cause actual results, performance or events to differ materiallyfrom those expressed or implied in such statements. Past performance may or may not be sustained in future. Neither HDFC AMCand HDFC Mutual Fund nor any person connected with them, accepts any liability arising from the use of this document. Therecipient(s) before acting on any information herein should make his/her/their own investigation and seek appropriateprofessional advice and shall alone be fully responsible / liable for any decision taken on the basis of information contained herein.
MUTUAL FUND INVESTMENTS ARE SUBJECT TO MARKET RISKS, READ ALL SCHEME RELATED DOCUMENTS CAREFULLY.
15

Thank You


