1 Press Release Information for Investors: Information for Media: Bryan Hipsher Michelle Kersch Black Knight Black Knight 904.854.3219 904.854.5043 [email protected][email protected]Black Knight Reports Fourth Quarter and Full Year 2017 Financial Results Full Year 2017 • Revenues of $1,051.6 million and Adjusted Revenues of $1,056.1 million • Net earnings attributable to Black Knight of $182.3 million, or $1.47 per diluted share, and Adjusted Net Earnings of $209.6 million, or $1.38 per diluted share • Adjusted EBITDA of $505.8 million and Adjusted EBITDA Margin of 47.9% Fourth Quarter 2017 • Revenues of $267.5 million and Adjusted Revenues of $268.4 million • Net earnings attributable to Black Knight of $147.2 million, or $0.97 per diluted share, and Adjusted Net Earnings of $56.6 million, or $0.37 per diluted share • Adjusted EBITDA of $131.9 million and Adjusted EBITDA Margin of 49.1% JACKSONVILLE, Fla. - February 7, 2018 - Black Knight, Inc. (NYSE: BKI), a leading provider of software, data and analytics solutions to the mortgage and consumer loan, real estate and capital markets verticals, today announced unaudited financial results for the fourth quarter and year ended December 31, 2017. Revenues for the fourth quarter of 2017 increased 2% to $267.5 million from $261.5 million in the prior year quarter. Net earnings attributable to Black Knight for the fourth quarter of 2017 were $147.2 million, or $0.97 per diluted share, compared to $11.8 million, or $0.17 per diluted share, in the prior year quarter. The results for the fourth quarter of 2017 include an income tax benefit of $110.9 million related to the revaluation of our net deferred income tax liability as a result of the Tax Cuts and Jobs Act of 2017 (the "Tax Reform Act"). Adjusted Revenues for the fourth quarter of 2017 increased 2% to $268.4 million from $263.0 million in the prior year quarter. Excluding the effect of the Property Insight realignment, Adjusted Revenues growth for the fourth quarter of 2017 was 5%. Adjusted Net Earnings for the fourth quarter of 2017 increased 25% to $56.6 million, or $0.37 per diluted share, compared to $45.2 million, or $0.30 per diluted share, in the prior year quarter. Adjusted EBITDA for the fourth quarter of 2017 increased 13% to $131.9 million from $116.7 million in the prior year quarter. Adjusted EBITDA Margin was 49.1% compared to 44.4% in the prior year quarter. Black Knight Executive Chairman Bill Foley said, “2017 was another successful year for Black Knight as we continued to execute against our long-term strategic initiatives to drive organic growth. In particular, we expanded and extended our relationships with
Depreciation and amortization 52.3 54.1 206.5 208.3
Transition and integration costs 4.6 0.1 13.1 2.3
Total expenses 198.2 203.4 789.1 793.2
Operating income 69.3 58.1 262.5 232.8
Other income and expense: Interest expense (12.7 ) (17.0 ) (57.5 ) (67.6 )
Other income (expense), net 4.5 (0.2 ) (12.6 ) (6.4 )
Total other expense, net (8.2 ) (17.2 ) (70.1 ) (74.0 )
Earnings before income taxes 61.1 40.9 192.4 158.8
Income tax (benefit) expense (86.1 ) 6.6 (61.8 ) 25.8
Net earnings 147.2 34.3 254.2 133.0
Less: Net earnings attributable to noncontrolling interests — 22.5 71.9 87.2
Net earnings attributable to Black Knight $ 147.2 $ 11.8 $ 182.3 $ 45.8
Three months ended December 31, Year ended December 31,
2017 2016 2017 2016
Earnings per share: Net earnings per share attributable to Black Knight common shareholders: Basic $ 0.98 $ 0.18 $ 2.06 $ 0.69
Diluted(1) $ 0.97 $ 0.17 $ 1.47 $ 0.67
Weighted average shares of common stock outstanding: Basic 150.9 66.1 88.7 65.9
Diluted(1) 151.6 68.1 152.4 67.9
______________
(1) For the periods presented, potentially dilutive securities include unvested restricted stock awards and the shares of Class B common stock prior to the Distribution. The shares of
Class B common stock did not share in the earnings or losses of Black Knight and were, therefore, not participating securities. Accordingly, basic and diluted net earnings per share
of Class B common stock have not been presented. The numerator in the diluted net earnings per share calculation is adjusted to reflect our income tax expense at an expected
effective tax rate assuming the conversion of the shares of Class B common stock into shares of Class A common stock on a one-for-one basis, prior to the Distribution, for the year
ended December 31, 2017. The effective tax rate for the year ended December 31, 2017 was (16.7)%, including the effect of the benefit related to the revaluation of our net deferred
income tax liability and certain other discrete items recorded during the year. The denominator includes approximately 63.1 million shares of Class B common stock outstanding for
the year ended December 31, 2017. However, the approximately 84.8 million shares of Class B common stock for the three months and year ended December 31, 2016 have been
excluded in computing diluted net earnings per share because including them on an "if-converted" basis would have an anti-dilutive effect. The denominator also includes the dilutive
effect of approximately 0.7 million and 0.6 million shares of unvested restricted shares of common stock for the three months and year ended December 31, 2017, respectively, and
approximately 2.0 million shares for the three months and year ended December 31, 2016.
Year ended
December 31,
2017
Earnings before income taxes $ 192.4
Income tax benefit excluding the effect of noncontrolling interests (32.2 )
Net earnings $ 224.6
Diluted shares 152.4
Diluted net earnings per share $ 1.47
9
SCHEDULE III
BLACK KNIGHT, INC.
Condensed Consolidated Statements of Cash Flows
(Unaudited)
(In millions)
Year ended December 31,
2017 2016
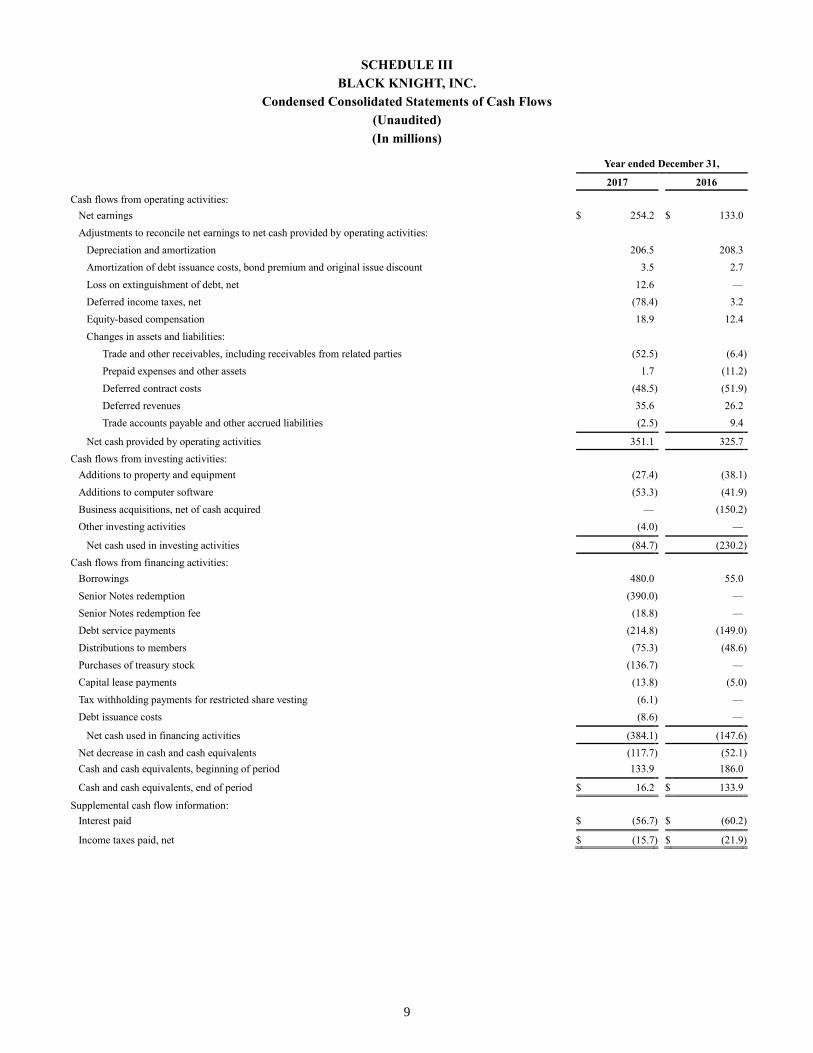
Cash flows from operating activities: Net earnings $ 254.2 $ 133.0
Adjustments to reconcile net earnings to net cash provided by operating activities: Depreciation and amortization 206.5 208.3
Amortization of debt issuance costs, bond premium and original issue discount 3.5 2.7
Loss on extinguishment of debt, net 12.6 —
Deferred income taxes, net (78.4 ) 3.2
Equity-based compensation 18.9 12.4
Changes in assets and liabilities: Trade and other receivables, including receivables from related parties (52.5 ) (6.4 )
Prepaid expenses and other assets 1.7 (11.2 )
Deferred contract costs (48.5 ) (51.9 )
Deferred revenues 35.6 26.2
Trade accounts payable and other accrued liabilities (2.5 ) 9.4
Net cash provided by operating activities 351.1 325.7
Cash flows from investing activities: Additions to property and equipment (27.4 ) (38.1 )
Additions to computer software (53.3 ) (41.9 )
Business acquisitions, net of cash acquired — (150.2 )
Other investing activities (4.0 ) —
Net cash used in investing activities (84.7 ) (230.2 )
Cash flows from financing activities: Borrowings 480.0 55.0
Senior Notes redemption (390.0 ) —
Senior Notes redemption fee (18.8 ) —
Debt service payments (214.8 ) (149.0 )
Distributions to members (75.3 ) (48.6 )
Purchases of treasury stock (136.7 ) —
Capital lease payments (13.8 ) (5.0 )
Tax withholding payments for restricted share vesting (6.1 ) —
Debt issuance costs (8.6 ) —
Net cash used in financing activities (384.1 ) (147.6 )
Net decrease in cash and cash equivalents (117.7 ) (52.1 )
Cash and cash equivalents, beginning of period 133.9 186.0
Cash and cash equivalents, end of period $ 16.2 $ 133.9
Depreciation and amortization 24.0 4.1 24.2 (2) 52.3
Operating income (loss) 111.1 4.9 (46.7 ) 69.3
Interest expense (12.7 )
Other income, net 4.5
Earnings before income taxes 61.1
Income tax benefit (86.1 )
Net earnings $ 147.2
________________________
Note: The Software Solutions segment was formerly known as the Technology segment.
(1) Revenues for Corporate and Other represent deferred revenue purchase accounting adjustments recorded in accordance with GAAP.
(2) Depreciation and amortization for Corporate and Other primarily represents net incremental depreciation and amortization adjustments associated with the
application of purchase accounting recorded in accordance with GAAP.
Three months ended December 31, 2016
Software
Solutions Data and
Analytics Corporate
and Other Total
Revenues $ 219.2 $ 43.8 $ (1.5 ) (1) $ 261.5
Expenses:
Operating expenses 94.8 39.3 15.1 149.2
Transition and integration costs — — 0.1 0.1
EBITDA 124.4 4.5 (16.7 ) 112.2
Depreciation and amortization 26.0 2.3 25.8 (2) 54.1
Operating income (loss) 98.4 2.2 (42.5 ) 58.1
Interest expense (17.0 )
Other expense, net (0.2 )
Earnings before income taxes 40.9
Income tax expense 6.6
Net earnings $ 34.3
________________________
Note: The Software Solutions segment was formerly known as the Technology segment.
(1) Revenues for Corporate and Other represent deferred revenue purchase accounting adjustments recorded in accordance with GAAP.
(2) Depreciation and amortization for Corporate and Other primarily represents net incremental depreciation and amortization adjustments associated with the
application of purchase accounting recorded in accordance with GAAP.
11
SCHEDULE IV (CONTINUED)
BLACK KNIGHT, INC.
Segment Information
(Unaudited)
(In millions)
Year ended December 31, 2017
Software
Solutions Data and
Analytics Corporate
and Other Total
Revenues $ 893.8 $ 162.3 $ (4.5 ) (1) $ 1,051.6
Expenses:
Operating expenses 370.8 130.4 68.3 569.5
Transition and integration costs — — 13.1 13.1
EBITDA 523.0 31.9 (85.9 ) 469.0
Depreciation and amortization 98.9 15.1 92.5 (2) 206.5
Operating income (loss) 424.1 16.8 (178.4 ) 262.5
Interest expense (57.5 )
Other expense, net (12.6 )
Earnings before income taxes 192.4
Income tax benefit (61.8 )
Net earnings $ 254.2
________________________
Note: The Software Solutions segment was formerly known as the Technology segment.
(1) Revenues for Corporate and Other represent deferred revenue purchase accounting adjustments recorded in accordance with GAAP.
(2) Depreciation and amortization for Corporate and Other primarily represents net incremental depreciation and amortization adjustments associated with the
application of purchase accounting recorded in accordance with GAAP.
Year ended December 31, 2016
Software
Solutions Data and
Analytics Corporate
and Other Total
Revenues $ 855.8 $ 177.5 $ (7.3 ) (1) $ 1,026.0
Expenses:
Operating expenses 368.0 151.0 63.6 582.6
Transition and integration costs — — 2.3 2.3
EBITDA 487.8 26.5 (73.2 ) 441.1
Depreciation and amortization 106.2 8.8 93.3 (2) 208.3
Operating income (loss) 381.6 17.7 (166.5 ) 232.8
Interest expense (67.6 )
Other expense, net (6.4 )
Earnings before income taxes 158.8
Income tax expense 25.8
Net earnings $ 133.0
________________________
Note: The Software Solutions segment was formerly known as the Technology segment.
(1) Revenues for Corporate and Other represent deferred revenue purchase accounting adjustments recorded in accordance with GAAP.
(2) Depreciation and amortization for Corporate and Other primarily represents net incremental depreciation and amortization adjustments associated with the
application of purchase accounting recorded in accordance with GAAP.
12
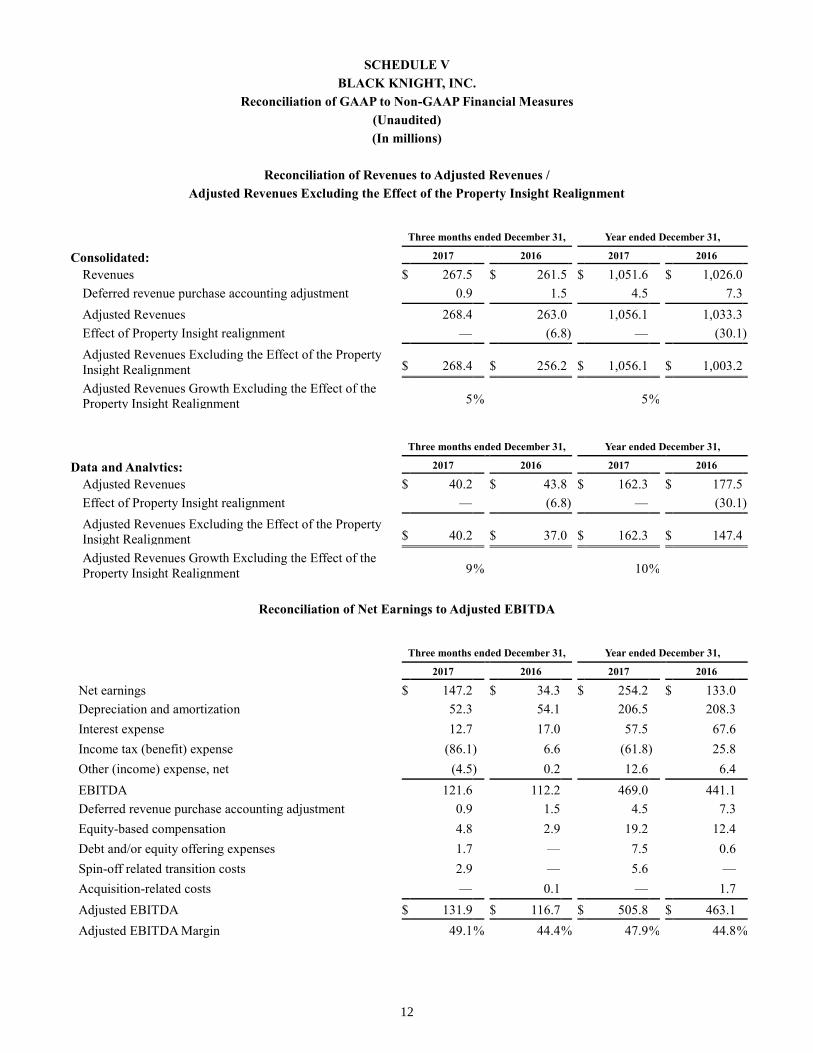
SCHEDULE V
BLACK KNIGHT, INC.
Reconciliation of GAAP to Non-GAAP Financial Measures
(Unaudited)
(In millions)
Reconciliation of Revenues to Adjusted Revenues /
Adjusted Revenues Excluding the Effect of the Property Insight Realignment
Three months ended December 31, Year ended December 31,