56
Prevention of Significant Deterioration (PSD) NSR Program Jessica Montañez U.S. Environmental Protection Agency Office of Air Quality Planning and Standards 919-541-3407, [email protected]
| Date post: | 29-Dec-2015 |
| Category: |
Documents |
| Upload: | candice-brooks |
| View: | 219 times |
| Download: | 3 times |

Prevention of Significant Deterioration (PSD) NSR Program
Jessica MontañezU.S. Environmental Protection Agency
Office of Air Quality Planning and Standards919-541-3407, [email protected]

2
Agenda
1. PSD Applicability1. PSD Applicability
2. PSD Requirements 2. PSD Requirements
3. NSR Applicability Example3. NSR Applicability Example

Prevention of Significant Deterioration (PSD) NSR Program Basics

Which sources might be subject to the major PSD program?
• Sources locating in areas attaining the National Ambient Air Quality Standards or areas that are unclassifiable
New major sources Existing major sources making major modifications
Physical or operational changes at the source Change should show significant net emissions increase
4
5
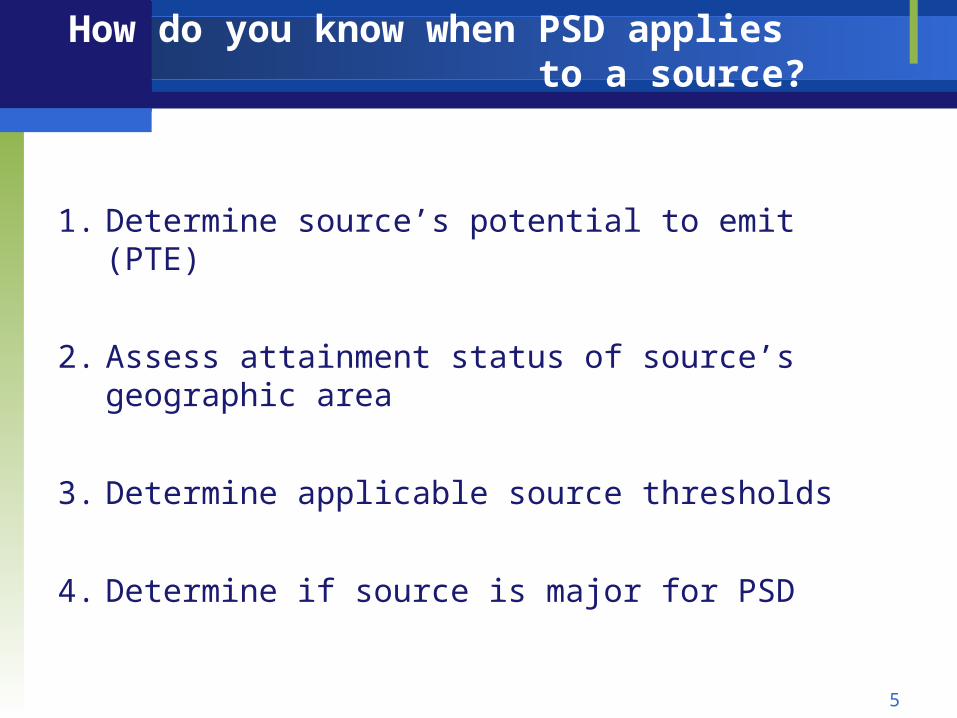
How do you know when PSD applies to a source?
1. Determine source’s potential to emit (PTE)
2. Assess attainment status of source’s geographic area
3. Determine applicable source thresholds
4. Determine if source is major for PSD
6
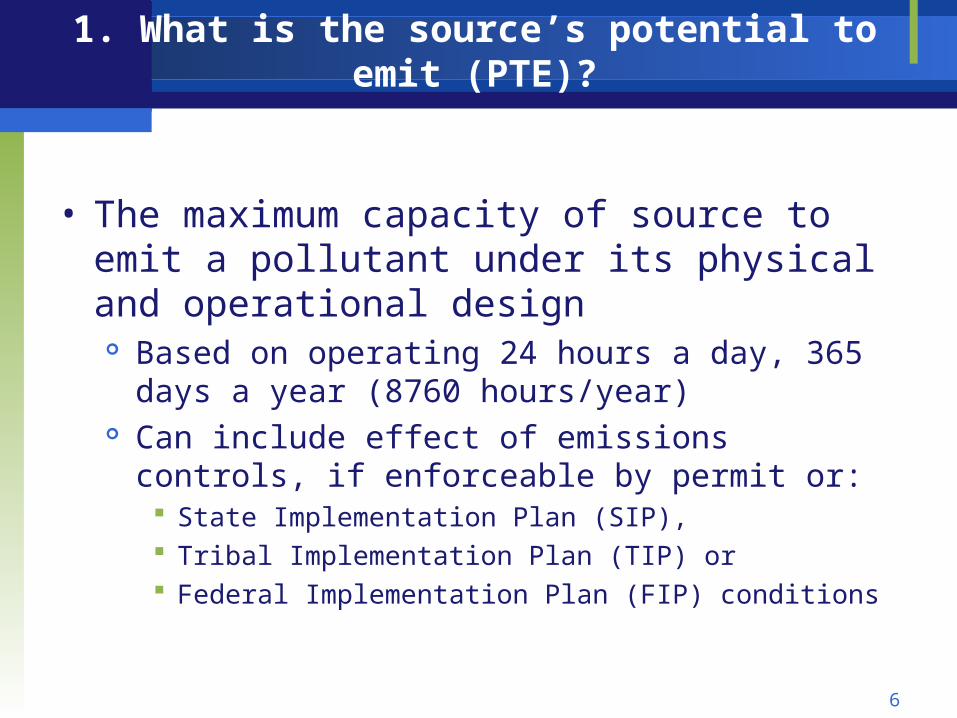
1. What is the source’s potential to emit (PTE)?
• The maximum capacity of source to emit a pollutant under its physical and operational design
Based on operating 24 hours a day, 365 days a year (8760 hours/year)
Can include effect of emissions controls, if enforceable by permit or: State Implementation Plan (SIP), Tribal Implementation Plan (TIP) or Federal Implementation Plan (FIP) conditions
7
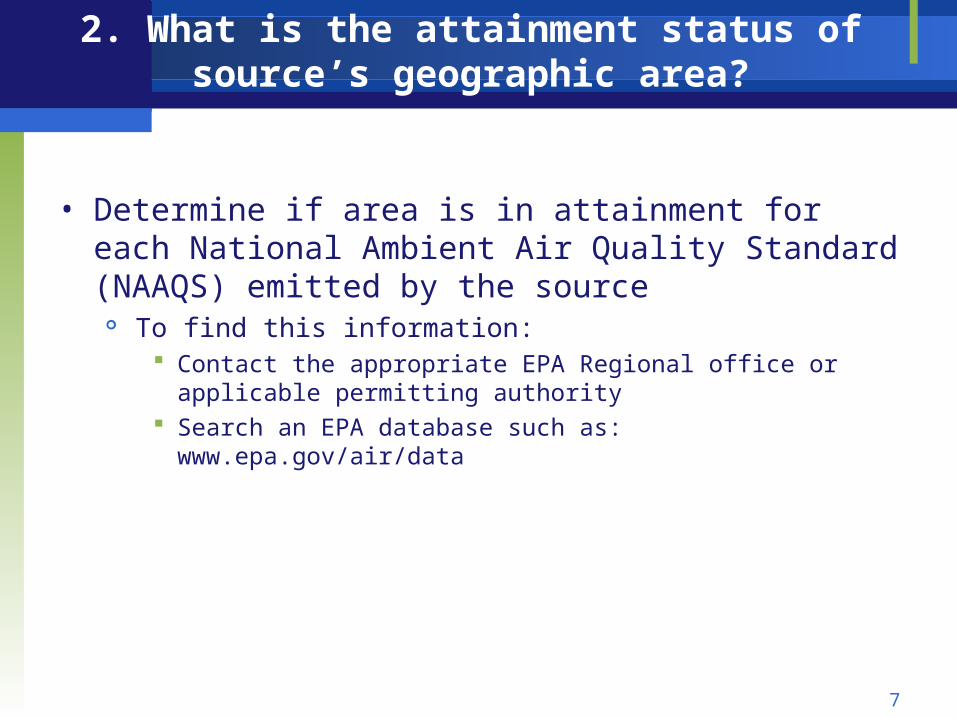
2. What is the attainment status of source’s geographic area?
• Determine if area is in attainment for each National Ambient Air Quality Standard (NAAQS) emitted by the source
To find this information: Contact the appropriate EPA Regional office or applicable permitting
authority Search an EPA database such as: www.epa.gov/air/data
8
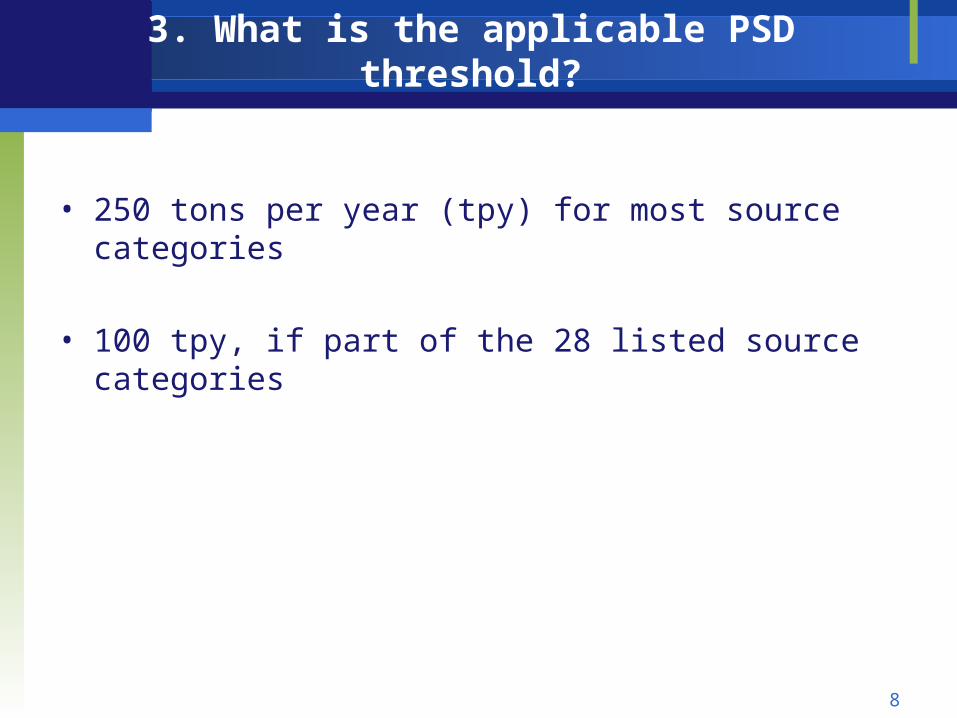
3. What is the applicable PSD threshold?
• 250 tons per year (tpy) for most source categories
• 100 tpy, if part of the 28 listed source categories
9
4. How do you determine if a source is major for PSD?
• For each pollutant, compare the source’s PTE with applicable threshold
• If PTE is equal to or higher than threshold, source is major for PSD
• For example: Source PTE for NO2 is 300 tpy 300 tpy > 250 tpy, source is subject to PSD

10
When might a modification be subject to the PSD program?
• Based on significant net emissions increase Determine if proposed source emissions exceeds significant
emissions rate (SER)
Determine net emissions increase (NEI) Sum of contemporaneous emissions increases and decreases to
the proposed modification increase NEI = PMEI + CEI – CED (ERC) where:
PMEI – Proposed modification emissions increase CEI – Creditable emissions increase CED – Creditable emissions decreases ERC – Emissions reduction credit(s)
Check if NEI is greater than SER, if so, source is major
11
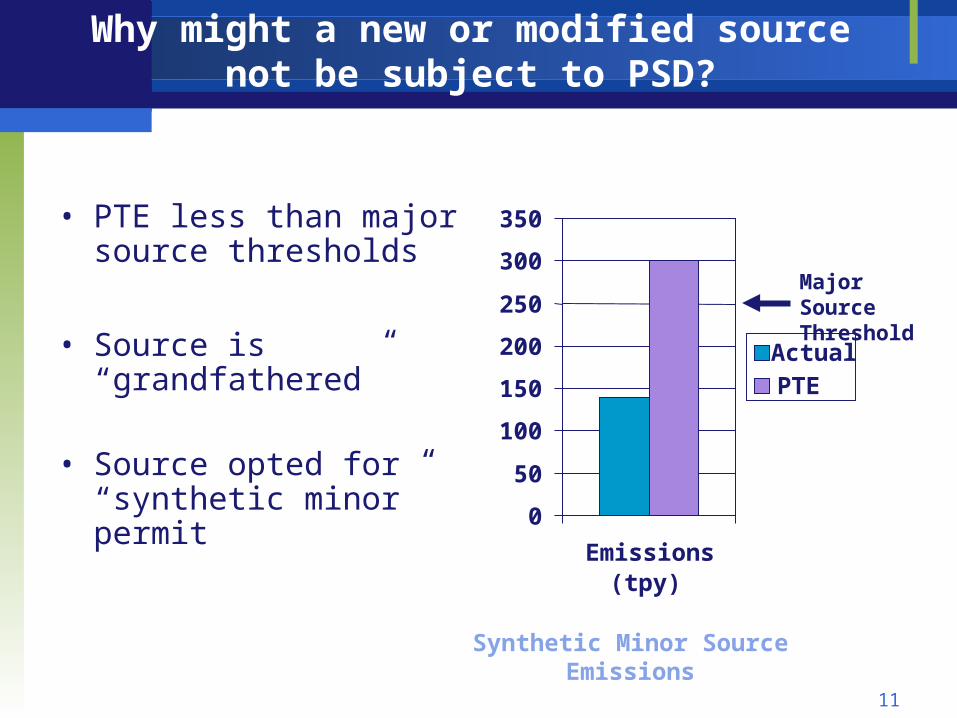
Why might a new or modified source not be subject to PSD?
• PTE less than major source thresholds
• Source is “grandfathered”
• Source opted for “synthetic minor” permit
Major Source Threshold
0
50
100
150
200
250
300
350
Emissions(tpy)
ActualPTE
Synthetic Minor Source Emissions
12
In what other circumstances can a source be subject to PSD?
• Once it is determined that a source is major for PSD, source also has to review pollutants that are below the thresholds by comparing PTE to Significant Emissions Rate (SER)
Pollutants for which the area is in attainment (NAAQS) Other pollutants
• Emissions equal to or higher than SER make pollutant also subject to PSD
• Concept known as “Major for one Major for all”
13
What must a major source subject to PSD do?
• Install of Best Available Control Technology (BACT)
• Perform air quality analysis
• Perform class I area analysis
• Perform additional impacts analysis
• Allow opportunities for public involvement

NSR Applicability Example

15
Which pollutants are subject to PSD, NA NSR, and minor NSR permitting?
• New Kraft Pulp Mill
• PTE’s: PM-10 – 10 tpy VOC – 80 tpy SO2 – 185 tpy
• Area: In attainment for PM-10
and VOC In moderate
nonattainment for SO2
Kraft pulp mill’s produce the dark colored wood pulp used in the manufacture of a variety of paper products.
htt
p:/
/esa
sk.u
reg
ina
.ca
16
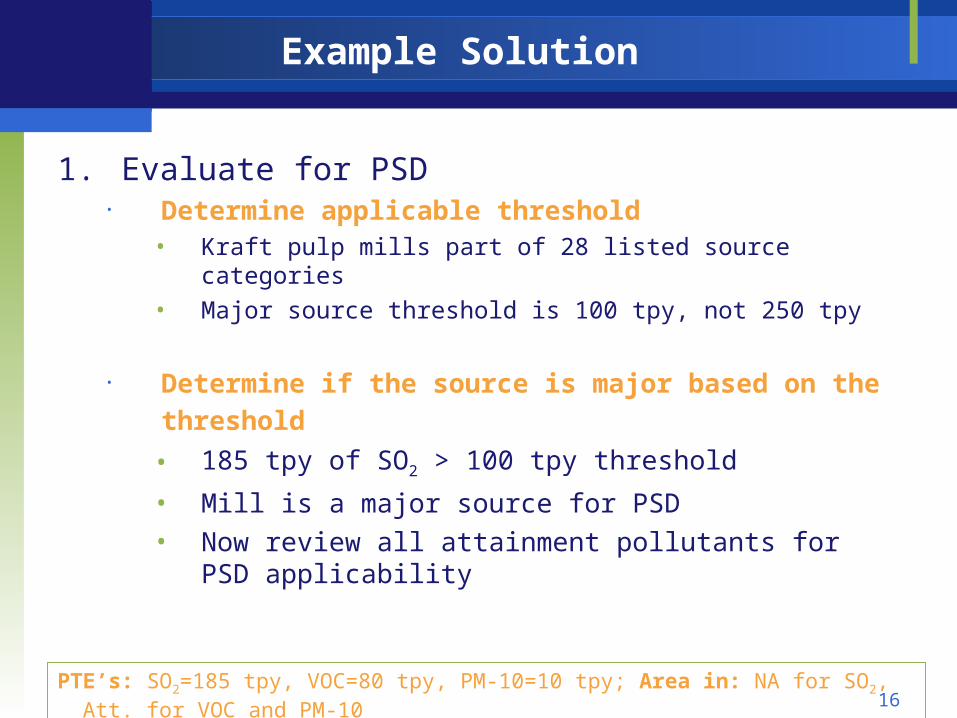
Example Solution
1. Evaluate for PSD• Determine applicable threshold
• Kraft pulp mills part of 28 listed source categories
• Major source threshold is 100 tpy, not 250 tpy
• Determine if the source is major based on the threshold • 185 tpy of SO2 > 100 tpy threshold
• Mill is a major source for PSD• Now review all attainment pollutants for PSD applicability
PTE’s: SO2=185 tpy, VOC=80 tpy, PM-10=10 tpy; Area in: NA for SO2, Att. for VOC and PM-10

17
Example Solution (Continued)
• Review the two attainment pollutants based on their SER VOC:
PTE = 80 tpy, VOC not on SER list However, VOC is ozone precursor
Ozone on list, SER = 40 tpy
80 tpy of VOC > 40 tpy ozone SER, VOC subject to PSD
PM-10: PTE = 10 tpy PM-10 SER = 15tpy 10 tpy of PM-10 < 15 tpy SER, PM-10 not subject to PSD
PTE’s: SO2=185 tpy, VOC=80 tpy, PM-10=10 tpy; Area in: NA for SO2, Att. for VOC and PM-10

18
Example Solution (Continued)
PTE’s: SO2=185 tpy, VOC=80 tpy, PM-10=10 tpy; Area in: NA for SO2, Att. for VOC and PM-10
2. Evaluate for NA NSR• Determine applicable threshold
• Major source threshold for moderate NA is 100 tpy• Determine if the source is major based on the threshold
• Only NA pollutant is SO2
• 185 tpy of SO2 > 100 tpy threshold, SO2 subject to NA NSR
3. Evaluate for Minor NSR• PM-10 PTE = 10 tpy• PM-10 may be subject to minor NSR
• Proposed minor Tribal NSR rule, PM-10 Att. threshold = 5 tpy• 10 tpy of PM-10 > 5 tpy threshold, PM-10 subject to minor NSR
PSD Requirements Details
20
Agenda
1. PSD Requirements Details1. PSD Requirements Details
2. Refinements of Increment Modeling Procedures Proposal2. Refinements of Increment Modeling Procedures Proposal

21
Review: What must a major source subject to PSD do?
• Install of Best Available Control Technology (BACT)
• Perform air quality analysis
• Perform class I area analysis
• Perform additional impacts analysis
• Allow opportunities for public involvement
22
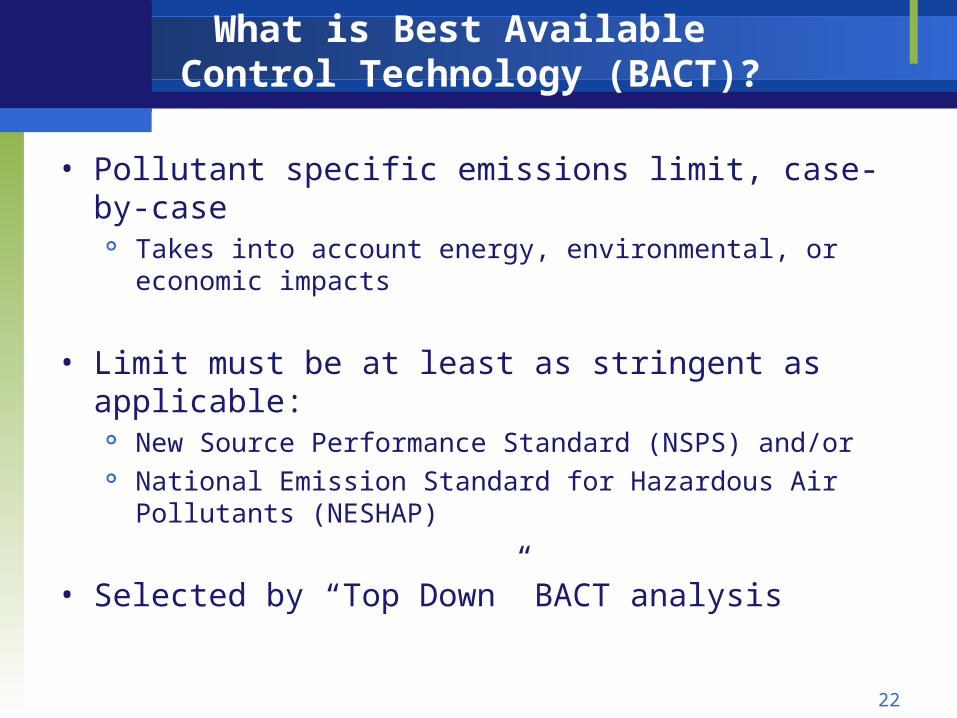
What is Best Available Control Technology (BACT)?
• Pollutant specific emissions limit, case-by-case Takes into account energy, environmental, or economic impacts
• Limit must be at least as stringent as applicable: New Source Performance Standard (NSPS) and/or National Emission Standard for Hazardous Air Pollutants
(NESHAP)
• Selected by “Top Down” BACT analysis

23
What are the requirements for the “Top-down” BACT analysis?
1. Identify all available air pollution control technologies, regardless of cost
2. Eliminate technical infeasible control options
3. Rank remaining control technologies according to control effectiveness. For each pollutant, list includes: – Control efficiency (percent of pollutant removed)– Expected emissions reduction (tons/year)– Economic Impacts– Environmental Impacts (i.e. significant impact on surface water)– Energy Impacts
4. Evaluate most effective controls based on all the factors in step 3 and document results
5. Select BACT
24
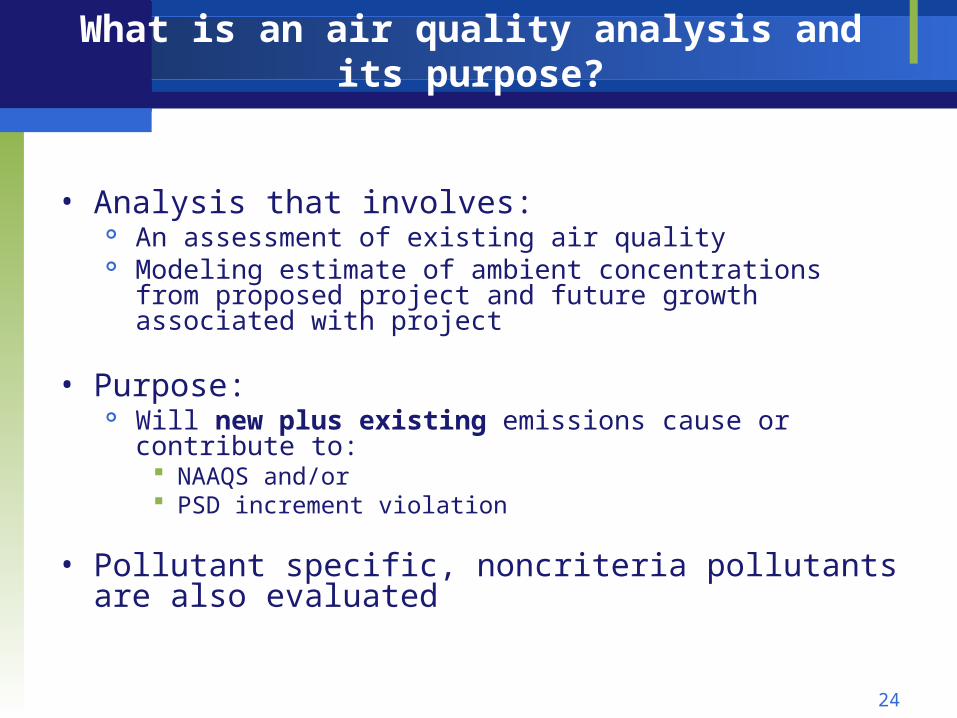
What is an air quality analysis and its purpose?
• Analysis that involves: An assessment of existing air quality Modeling estimate of ambient concentrations from proposed
project and future growth associated with project
• Purpose: Will new plus existing emissions cause or contribute to:
NAAQS and/or PSD increment violation
• Pollutant specific, noncriteria pollutants are also evaluated

25
What are the steps of the air quality analysis?
Model Impact of Proposed and Other Emission Sources
Ambient Concentration
s Above Air Quality
Significance Level
Determine Impact Area
Model Impact of Proposed and Other Emission Sources
Develop Emissions Inventories of Other Sources
No Further NAAQS or PSD Increment Analysis Performed for Pollutant
Demonstration of Compliance
Yes
No
Determine Need for Pre-application Monitoring
Source Input Data (Pollutants with Significant Emissions)
Meteorological Data
Source Input Data (Pollutants with Significant Emissions)
Meteorological Data

26
What do we require for an increment analysis?
• A new source or modification cannot cause or contribute to significant deterioration of air quality in attainment areas
• Maximum amount of deterioration allowed is called an increment
• Change in air quality measured against a certain baseline
• Not all sources consume increment
27
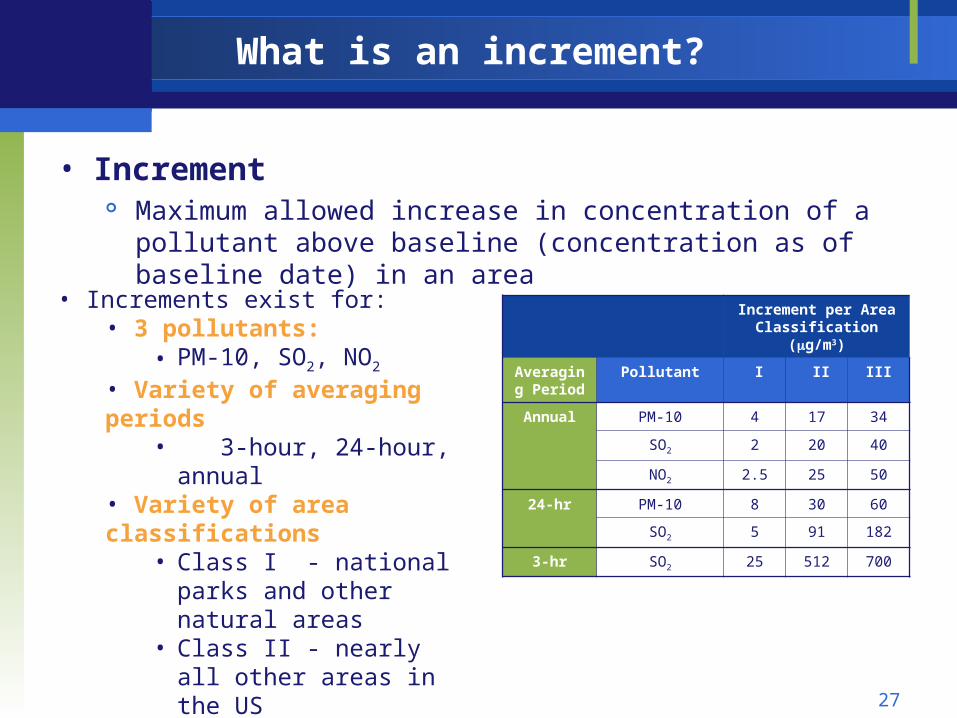
What is an increment?
• Increment Maximum allowed increase in concentration of a pollutant above
baseline (concentration as of baseline date) in an area
Increment per Area Classification (g/m3)
Averaging Period
Pollutant I II III
Annual PM-10 4 17 34
SO2 2 20 40
NO2 2.5 25 50
24-hr PM-10 8 30 60
SO2 5 91 182
3-hr SO2 25 512 700
• Increments exist for:• 3 pollutants:
• PM-10, SO2, NO2 • Variety of averaging periods
• 3-hour, 24-hour, annual• Variety of area classifications
• Class I - national parks and other natural areas
• Class II - nearly all other areas in the US
• Class III - areas targeted for industrial development

28
How is increment compliance determined?
• By using air quality models
• Preliminary analysis (significant impact analysis) Screening type models Representative meteorology Only proposed source emissions Refined receptor grids
• Full impact analysis (cumulative impact analysis) Refined model Representative meteorology All applicable increment affecting sources More refined receptor grids (smaller grid spacing)

29
How is increment compliance determined? (cont.)
1. Determine Need for Pre-application Monitoring If existing ambient impact is less than the Significant
Monitoring Concentration (SMC), permitting agency can exempt an applicant from monitoring

30
How is increment compliance determined? (cont.)
2. Conduct Significant Impact Analysis• Acquire meteorological and source emissions data (actual
emissions)
• Model impact of proposed source If source ambient concentrations are:
Lower than the Significant Impact Levels* (SILs), no further analysis needed
Higher than the SILs, full impact analysis is needed
*EPA’s current PSD regulations do not contain SILs, but they have been widely used as a screening tool.

31
How is increment compliance determined? (cont.)
3. Determine Baseline Area(s) • All portions of the attainment or unclassifiable area in which
the PSD applicant proposes to locate (See section 107 of the Act) and/or
• Any attainment or unclassifiable area in which the PSD applicant would have a significant ambient impact (i.e. higher than SIL)
• Limited to intrastate areas• Baseline areas not triggered across state lines
32
How is increment compliance determined? (cont.)
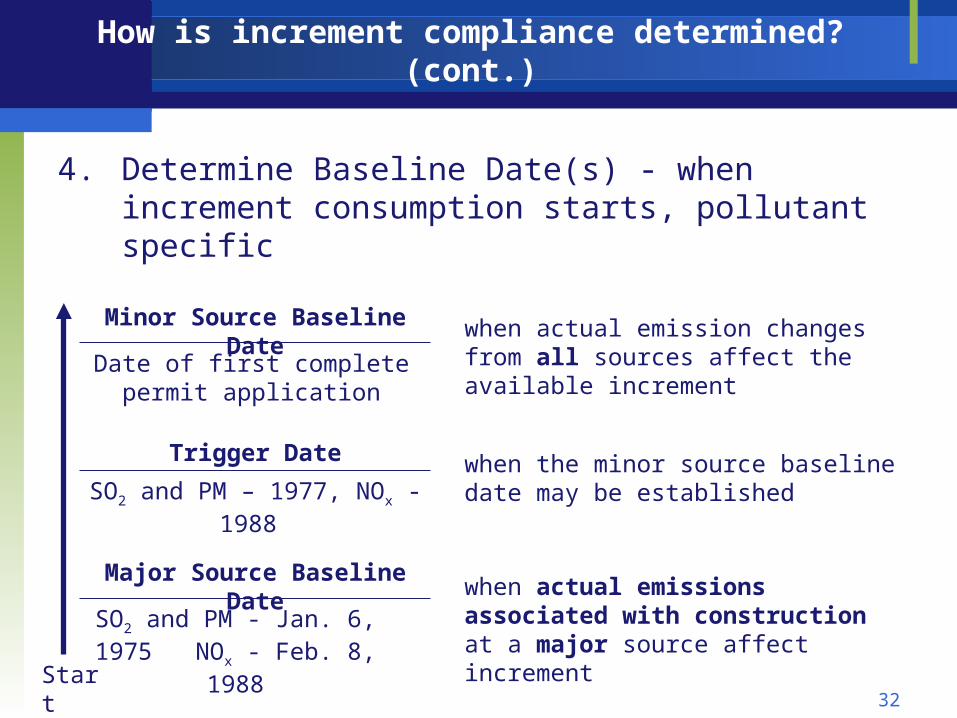
4. Determine Baseline Date(s) - when increment consumption starts, pollutant specific
Major Source Baseline Date
Trigger Date
Minor Source Baseline Date
SO2 and PM - Jan. 6, 1975 NOx - Feb. 8, 1988
SO2 and PM – 1977, NOx - 1988
Date of first complete permit application
when actual emission changes from all sources affect the available increment
when actual emissions associated with construction at a major source affect increment
when the minor source baseline date may be established
Start

33
How is increment compliance determined (cont.)?
• Example: Baseline Areas and Dates
New source planned for Iowa county, Wisconsin
Wisconsin lists attainment status by counties
Minor source baseline dates (if already established) for Iowa and surrounding counties listed below
PM-10 SO2 NO2
County Date Date Date
Dane 09/13/1998 09/13/1998 09/13/1998
Iowa -- -- --
Sauk 09/27/2002 -- --

34
How is increment compliance determined? (cont.)
• Source: Is major for SO2 and PM-10 (area in
attainment for both pollutants) Submits complete PSD application
on November 30, 2007
• What is the baseline area? Dispersion modeling shows impact
area covers Iowa, Sauk and Dane counties (e.g., ambient concentrations for SO2 and PM-10 exceed 1g/m3 annual SIL)
• What are the baseline dates? Iowa – November 30, 2007 for SO2
and PM-10 Sauk –November 30, 2007 for SO2:
September 27, 2002 for PM-10 Dane –September 13, 1998 for SO2
and PM-10
Significant Impact Area
PM-10 SO2 NO2
County Date Date Date
Dane 09/13/1998 09/13/1998 09/13/1998
Iowa -- -- --
Sauk 09/27/2002 -- --
35
How is increment compliance determined? (cont.)
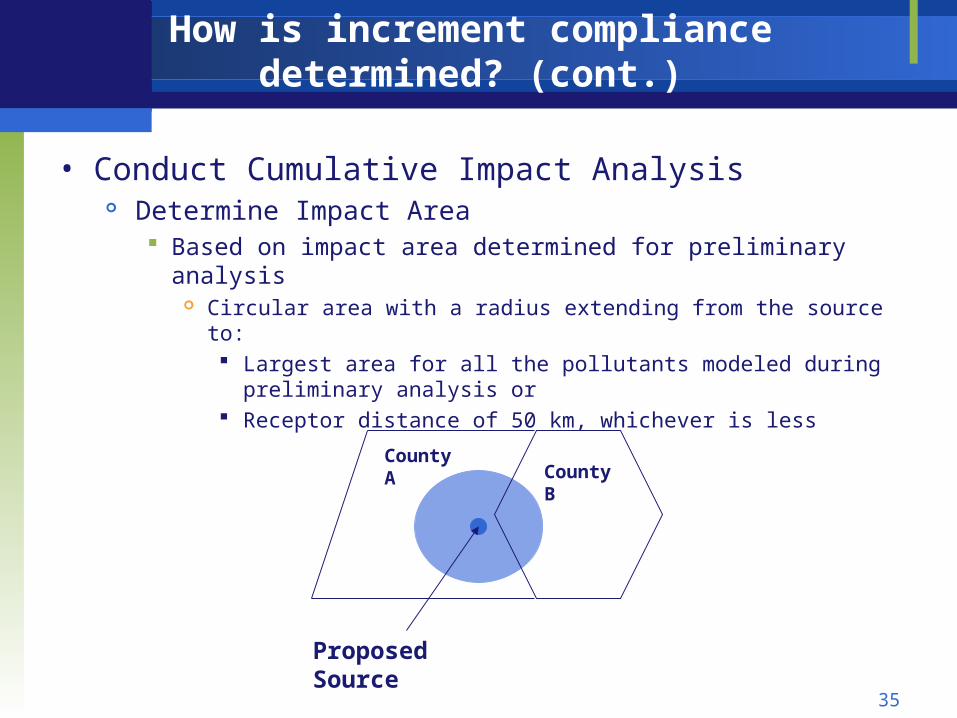
• Conduct Cumulative Impact Analysis Determine Impact Area
Based on impact area determined for preliminary analysis Circular area with a radius extending from the source to:
Largest area for all the pollutants modeled during preliminary analysis or
Receptor distance of 50 km, whichever is less
Proposed Source
County BCounty A
36
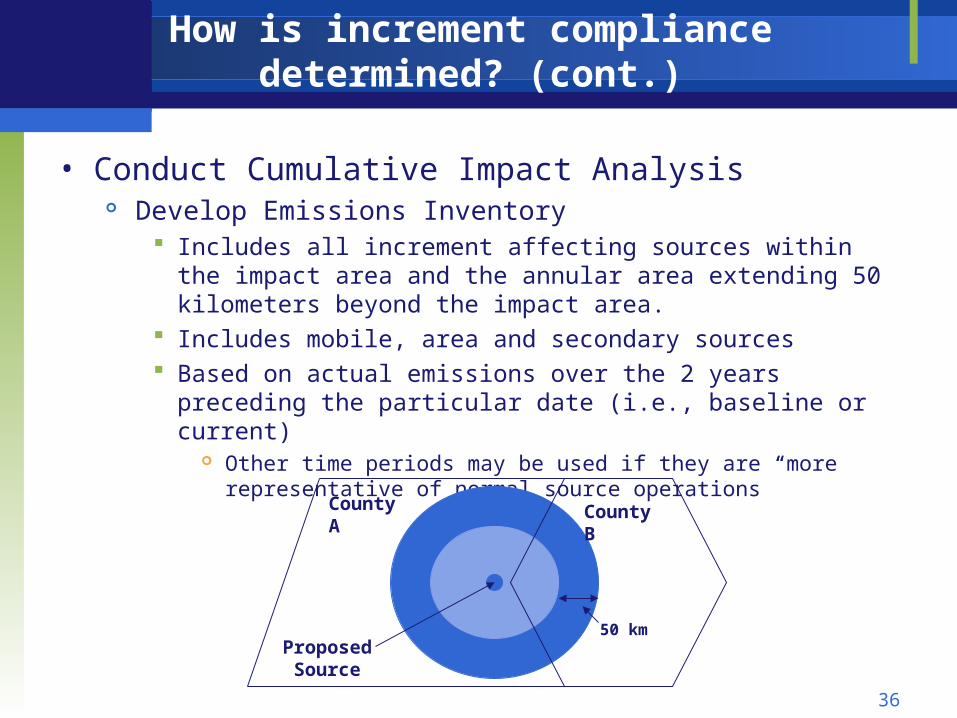
How is increment compliance determined? (cont.)
• Conduct Cumulative Impact Analysis Develop Emissions Inventory
Includes all increment affecting sources within the impact area and the annular area extending 50 kilometers beyond the impact area.
Includes mobile, area and secondary sources Based on actual emissions over the 2 years preceding the particular
date (i.e., baseline or current) Other time periods may be used if they are “more representative of
normal source operations”
Proposed Source
County BCounty A
50 km

37
How is increment compliance determined? (cont.)
5. Conduct Cumulative Impact AnalysisC. Model Impact of Proposed and Existing Sources
Uses emission inventory data and meteorology to determine the change (Δ) in concentration from baseline
D. Determination of Compliance If model output for each pollutant and averaging period is higher
than the increment, the permit: Is denied or Granted, if emissions are “offset’ by other sources in the area

38
What do we require for the NAAQS analysis?
• A new source or modification cannot cause or contribute to a violation of any NAAQS in any area
• Compliance with any NAAQS is based on proposed source and all other sources in baseline area
No baseline dates exist Analysis requirements similar to increment analysis
• NAAQS analysis independent from increment analysis
39
What is an class I area impact analysis?
• Evaluation of NAAQS, PSD increments and Air Quality Related Values (AQRVs) when a major source’s emissions may affect a Class I area
AQRVs – feature or property of a Class I Area that may be affected by a change in air quality
Differ for each Class I area Defined by the Federal Land Manager (FLM) for Federal lands, or
by the applicable State or Indian Governing body for nonfederal lands
Generally for sources within 100 km of Class I area, not always
FLM must be notified of potential impacts Determines data and analyses needed

40
What is an additional impact analysis?
• Assesses potential effects of increased pollution from new source and associated growth on:
Soils and Vegetation Visibility
• Pollutant specific• Performed within the impact area of the proposed source• Depends on:
existing air quality quantity and type of emissions sensitivity of local soils and vegetation (especially commercial
crops) general visibility concerns
41
What is done with the PSD information?
• Source submits the analyses in PSD permit application to permitting authority
• Permitting authority evaluates analyses/application to determine requirements for PSD permit
• Reviewing authority then prepares or provides: Draft permit Adequate public notice to affected and general public 30-day public comment period on draft permit Opportunity for public hearing on draft permit
• If all requirements met, permitting authority grants permit
Proposed Refinements to Increment Modeling Procedures Rule

43
Refinements of Increment Modeling Procedures Proposal
• Purpose: Clarifies the status of existing PSD increment guidance Addresses how the emissions and meteorology inventory for
increment purposes can be developed Seeks comment on some of the Western States Air Resources
Council (WESTAR) recommendations for improving the PSD program
Addresses the issue of Class I Federal Land Manager (FLM) variances
• Proposal: Published in Federal Register on June 6, 2007
• Promulgation: Scheduled for December 2008

44
What have been some difficulties in increment modeling?
• Often don’t have adequate older emissions data
• Don’t have direct emissions data for all averaging periods
• Don’t have hourly data for any sources other than utilities
• Don’t have older meteorological data
• Regions and states using different methods

45
Issues Addressed in the Proposal
• What is the effect of the 1990 Draft NSR Workshop Manual?
Manual not a binding regulation, not final agency policy
• How are emissions estimated for increment purposes? No prescribed method, reviewing authority discretion allowed
Requested comment on WESTAR’s recommended approaches: menu of acceptable emissions calculation approaches for both short-
term and annual increments set of guiding principles for selecting the most appropriate option from
the menu
Mobile sources emissions should be included Other time periods may be used to establish actual emissions if
they are “more representative of normal source operations”

46
Issues Addressed in the Proposal (cont.)
• How are meteorological data estimated for increment purposes?
Reviewing authorities have discretion for using prognostic meteorological models (models that fill gaps in data)
Years of Data Needed: Observational data: 5 years and at least 1 year for site specific data Prognostic data: less than 5, but at least 3 years of data
If proprietary data or software needed, reviewing authority has discretion for:
requiring independent review of the proprietary data and conducting the review, provided that confidential information is protected
determining software acceptability based on the: (1) reproducibility of the data or model simulation and (2) quality assurance procedures used in its development

47
Issues Addressed in the Proposal (cont.)
• How future sources in the area where a variance has been granted treat the emissions from the source who received the variance?
Variances – approval of permit when increment is exceeded, but AQRVs are not impacted
• We proposed: Area now has to comply with two increments: the Class I and
Class II increments. The Class II increment can never be exceeded.
Variance source(s) emissions not counted in future Class I increment analyses, counted toward future Class II analyses
Implementation Plans (SIPs) not amended to correct violation

48
Appendix

49
What are the pollutants regulated by the NSR program?
• The National Ambient Air Quality Standards (NAAQS) pollutants
• Any NAAQS precursors
• Any pollutant regulated under the New Source Performance Standards (CAA, Section 111)
• Any pollutant otherwise regulated under the Act, except the National Emission Standards for Hazardous Air Pollutants (CAA Section 112)
• Any Class I or Class II substance regulated by Title VI of the Act, Stratospheric Ozone Protection
50
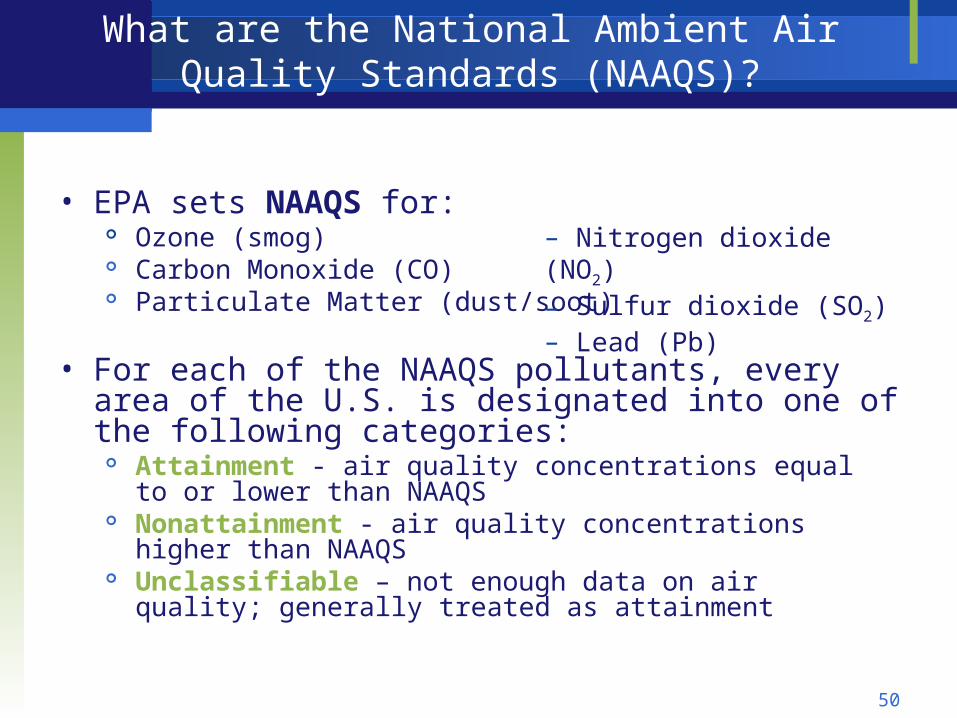
What are the National Ambient Air Quality Standards (NAAQS)?
• EPA sets NAAQS for: Ozone (smog) Carbon Monoxide (CO) Particulate Matter (dust/soot)
• For each of the NAAQS pollutants, every area of the U.S. is designated into one of the following categories:
Attainment - air quality concentrations equal to or lower than NAAQS
Nonattainment - air quality concentrations higher than NAAQS Unclassifiable – not enough data on air quality; generally
treated as attainment
– Nitrogen dioxide (NO2)– Sulfur dioxide (SO2)– Lead (Pb)
51
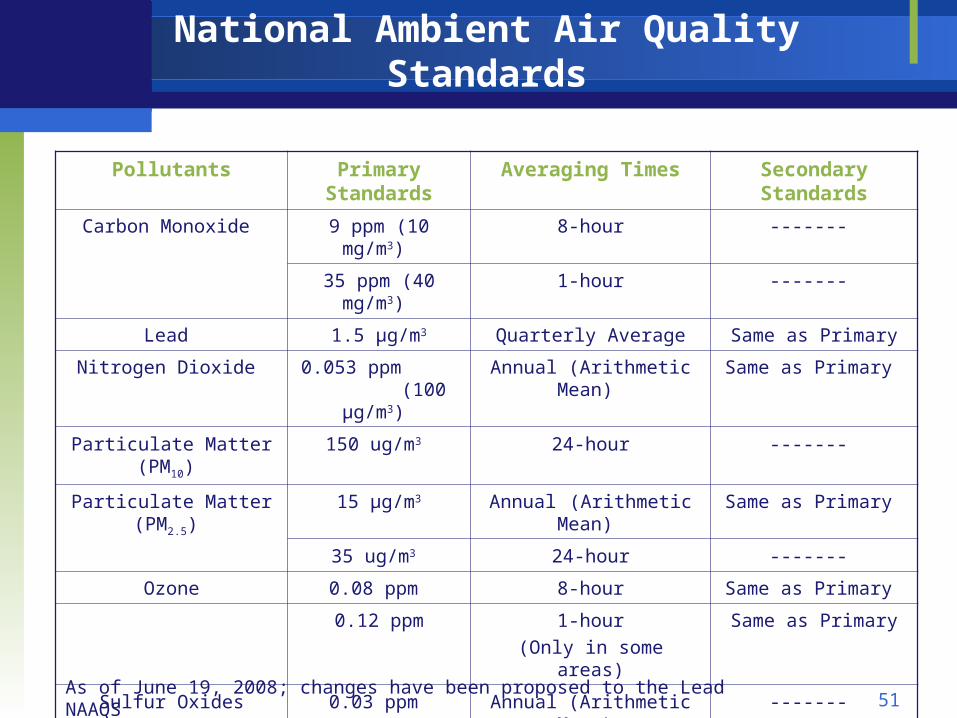
National Ambient Air Quality Standards
Pollutants Primary Standards
Averaging Times Secondary Standards
Carbon Monoxide 9 ppm (10 mg/m3) 8-hour -------
35 ppm (40 mg/m3) 1-hour -------
Lead 1.5 µg/m3 Quarterly Average Same as Primary
Nitrogen Dioxide 0.053 ppm (100 µg/m3)
Annual (Arithmetic Mean) Same as Primary
Particulate Matter (PM10) 150 ug/m3 24-hour -------
Particulate Matter (PM2.5) 15 µg/m3 Annual (Arithmetic Mean) Same as Primary
35 ug/m3 24-hour -------
Ozone 0.08 ppm 8-hour Same as Primary
0.12 ppm 1-hour
(Only in some areas)
Same as Primary
Sulfur Oxides 0.03 ppm Annual (Arithmetic Mean) -------
0.14 ppm 24-hour -------
------- 3-hour 0.5 ppm (1300 ug/m3)
As of June 19, 2008; changes have been proposed to the Lead NAAQS

52
PSD 28 Source Categories with 100 tpy thresholds
1. Coal cleaning plants (with thermal dryers) 15. Coke oven batteries
2. Kraft pulp mills 16. Sulfur recovery plants
3. Portland cement plants 17. Carbon black plants (furnace process)
4. Primary zinc smelters 18. Primary lead smelters
5. Iron and steel mills 19. Fuel conversion plants
6. Primary aluminum ore reduction plants 20. Sintering plants
7. Primary copper smelters 21. Secondary metal production plants
8. Municipal incinerators capable of charging more than 250 tons of refuse per day
22. Chemical process plants
9. Hydrofluoric acid plants 23. Petroleum storage and transfer units with a total storage capacity exceeding 300,000 barrels
10. Sulfuric acid plants 24. Taconite ore processing plants
11. Nitric acid plants 25. Glass fiber processing plants
12. Petroleum refineries 26. Charcoal production plants
13. Lime plants 27. Fossil fuel-fired steam electric plants of more than 250 million British thermal units (BTU)/hour heat input
14. Phosphate rock processing plants 28. Fossil-fuel boilers (or combination thereof) totaling more than 250 million BTU/ hour heat input

53
SER – a rate of emissions that would equal or exceed any of the following rates:
Notwithstanding the above, any emissions rate or any net emissions increase associated with a major stationary source or major modification, which could construct within 10 km of a Class I area, and have
an impact on such area equal to or greater than 1 g/m3 (24-hour average)
Significant Emission Rates (SERs)
Pollutant SER (tpy)
Pollutant SER (tpy)
Carbon Monoxide 100 Hydrogen sulfide(H2S) 10
Nitrogen Oxides 40 Total reduced sulfur (including H2S) 10
Sulfur Dioxide 40 Reduced sulfur compounds (includes H2S) 10
Particulate Matter (PM10) 15 Municipal waste combustor organics 3.5 x 10⁻⁶
Ozone 40 of VOCs or NOx Municipal waster combustor metals 15
Lead 0.6 Municipal waste combustor acid gases 40
Fluorides 3 Municipal solid waste landfills emissions 50
Sulfuric acid mist 7
As of June 19, 2008; SER has been proposed for PM-2.5

54
Significant Impact Levels (SILs)
Proposed Significant Impact Levels (µg/m3)61 Fed. Reg. 38250; July 23, 1996
Pollutant Averaging Time Class I Class II Class III
Sulfur Dioxide (SO2) Annual 0.1 1.0 1.0
24- hour 0.2 5.0 5.0
3-hour 1.0 25.0 25.0
Particulate Matter (10µm)
Annual 0.2 1.0 1.0
24- hour 0.3 5.0 5.0
Nitrogen Oxides (NO2) Annual 0.1 1.0 1.0
SILs– air quality concentrations below which a full impact analysis may be exempted by the permitting authority
As of June 19, 2008; SIL has been proposed for PM-2.5

55
SMCs– air quality concentrations below which monitoring may be exempted by the permitting authority
Significant Monitoring Concentrations (SMCs)
Pollutant SMC (µg/m3) and Averaging Time
Carbon Monoxide 575 (8-hour)
Nitrogen Dioxide 14 (Annual)
Sulfur Dioxide 13 (24-hour)
Particulate Matter (PM10) 10 (24-hour)
Lead 0.1 (3-month)
Fluorides 0.25 (24-hour)
Hydrogen sulfide (H2S) 0.2 (1 hour)
Reduced sulfur compounds (includes H2S) 10 (1 hour)
Ozone Applicants with a net emissions increase of 100 tons/year or more of VOC’s or NOx required to monitor
As of June 19, 2008; SMC has been proposed for PM-2.5

56
Air Quality Models
• Screening Models Used to determine if a more refined air quality model is needed
Examples: SCREEN3/AERSCREEN
• Preferred/Recommended Models (40 CFR Appendix W) Required for NSR permitting and SIPs. These models include:
AERMOD source-oriented dispersion model that characterizes atmospheric processes by
dispersing a directly emitted pollutant plume to predict concentrations at selected downwind locations
CALPUFF dispersion model that simulates the effects of time- and space-varying
meteorological conditions on pollution transport, transformation, and removal May be applied for long-range transport and for complex terrain on a case-by-
case basis
• Alternative Models Not listed in Appendix W, can be used in regulatory applications with
case-by-case justification (See Section 3.2 in 40 CFR Appendix W)


