Page 1
Price Instability in the U.S. Natural Gas Industry
Historical Perspective and Overview
Prepared for
The Task Force on Natural Gas Market Stability
Richard G. Smead
Director
Navigant Consulting, Inc.
July 15, 2010
Page 2
1
Table of Contents
I. Introduction and Overview ................................................................................................................... 2
A. The Basic Role of Natural Gas and the Issue of Volatility ................................................................. 4
B. The American Gas Foundation Study for the Oakridge National Laboratories ................................ 7
C. Definition of Price Volatility .............................................................................................................. 9
II. Historical Evolution of and Price Volatility in U.S. Natural Gas Markets ............................................ 12
A. Period 1, 1976 to 1990: Transition from Regulated Prices to Statutory Prices to Free Prices ...... 12
B. Period 2, 1990 to 2000: The Transition to Decontrol .................................................................... 17
C. Period 3—2000 to 2010: Crisis, Volatility, Growth and New Natural Gas Abundance .................. 24
1. 2000-2001—The California Crisis ................................................................................................ 30
2. Katrina/Rita, and the 2005 Loss of Offshore Supply ................................................................... 34
3. 2008, Prices Run with Oil ............................................................................................................ 38
III. Storage and Other Mitigation Measures ........................................................................................ 40
A. Storage—Is it the Answer? ............................................................................................................. 40
B. Other Mitigation Measures—Financial Tools ................................................................................. 42
C. Conclusion as to Storage and Other Mitigation Measures ............................................................. 43
IV. Overall Conclusion .......................................................................................................................... 44
V. Bibliography ........................................................................................................................................ 45
Page 3
2
I. Introduction and Overview
The American Clean Skies Foundation and the National Commission on Energy Policy, along with
multiple other sponsors,1 have undertaken an extensive multi-study effort (the Task Force on Natural
Gas Market Stability, or “Task Force”) to understand natural gas price volatility from multiple
perspectives. The intent of the Task Force effort is to determine the reasons for natural gas price
volatility, to assess the past and present behavior of prices in the industry (and their drivers), to evaluate
the prospects for future behavior, and to analyze any potential public or private policies or initiatives
that could cause price volatility to be less of an impediment to healthy growth and use of the nation’s
natural gas resource.
This paper is the introductory, overview piece, designed to set the stage for questions to be
addressed by multiple experts engaged in the Task Force effort. It is intentionally written by, and from
the perspective of, a non-economist industry veteran, in order to frame issues in a way that can be
openly and easily discussed among a wide range of policy analysts and policy makers. It will explore the
history of the industry’s pricing experience against the industry’s evolving institutional framework and
against the behavior of supply-demand fundamentals. It will identify and draw from work performed
previously around this issue, by both public and private entities, where possible correlating their
observations with today’s facts. And it will touch on and try to structure the major options and
questions that will be addressed in much more depth through both the work of the many other experts
involved in this effort, and the roundtable workshops that will be used to attempt to reach a common
view of industry behavior among multiple sectors and points of view.
1 Project Sponsors include the National Commission on Energy Policy, the American Clean Skies Foundation
(ACSF), the American Gas Association, ConocoPhillips, the Consumer Advocate Division of the Public Service
Commission of West Virginia, The Dow Chemical Company, the Natural Resources Defense Council, PG&E
Corporation, Southern Company, and Spectra Energy.
Page 4
3
An important caveat to be observed in reviewing this paper is that it is not designed to
recommend specific courses of action, but rather to frame the questions that must be addressed by the
broader group before such future courses of action might be considered. Where options or “straw
man” theses are presented herein, they are strictly intended to help structure the understanding of the
questions raised by industry history and the behavior of its fundamentals. For example, anywhere that
it is observed that changes in regulatory oversight or public policy may have had a particular impact,
there is no intent herein to suggest implicitly that there should be some new exercise of governmental
intervention. Indeed, as is demonstrated in the discussion of industry history up until the early 1990s,
governmental intervention in gas markets has been a fairly uniform failure. Thus, any inference that
goes beyond the simple raising of questions in this paper should be clarified in accordance with this
explanation of the intended scope.
Page 5
4
A. The Basic Role of Natural Gas and the Issue of Volatility
First, what is at stake for the nation? Based upon widely accepted analyses by most experts, the
United States has available an unprecedented abundance of natural gas resource. Last year’s biennial
estimate by the Potential Gas Committee placed the recoverable resource at approximately 100 years’
worth of current production, with some estimates being even higher.2 History over the past decade and
expectations for the future as to the pace of development, the growth in deliverability, are fairly wide-
ranging, but equally robust.3 Given the overarching global challenge of carbon’s role in climate change
and the low-carbon chemical composition of natural gas as compared with other fossil fuels, as well as
the ongoing concern over U.S. dependence on foreign sources of crude oil, the nation’s ability to
produce natural gas rates above historic levels, at a rapidly escalating (and sustained) pace, is potentially
a major strategic asset.
However, such development faces various hurdles. The leading edge, the driving engine of U.S.
natural gas growth, especially onshore where hurricanes and sensitivity over offshore drilling are not
issues, is the enormous shale gas resource. 4 The sustained development of this resource requires two
major elements to be in place: (1) the resolution of various environmental, water, and land-access
2 Navigant Consulting, Inc, “North America Natural Gas Supply Assessment” Study prepared for American Clean
Skies Foundation, July- 2008. (“North America Natural Gas Supply Assessment”).
Also see: Colorado School of Mines, “Potential Gas Committee Reports Unprecedented Increase in Magnitude of
U.S. Natural Gas Resource Base”, Press release by Potential Gas Agency, June, 18, 2009: 1. 3 U.S. Energy Information Administration, “Annual Energy Outlook 2010”. May 11, 2010: 72-73. Available online at:
http://www.eia.doe.gov/oiaf/aeo/index.html?featureclicked=1&.
See also: American Clean Skies Foundation, “The Recognition of Natural Gas Abundance Continues to Grow”, a
publication portraying the North America Natural Gas Supply Assessment performed by Navigant Consulting, Inc.
July, 2008: 2. 4 Op. cit. North America Natural Gas supply Assessment.
Page 6
5
issues that attend the drilling and stimulation of the large number of wells involved,5 and (2) a stable,
sustained and growing consumption market that can produce prices sufficient for the development.6
This second requirement for robust and successful development of the U.S. natural gas resource
is seriously undermined by a lack of trust in price stability on the part of large, very price-sensitive
consumers. Consumers such as the chemical industry and competitive power generators have been
reluctant to commit to U.S. natural gas because of the perception that natural gas prices exhibit
unacceptable volatility. These consumers base their lack of trust on history, both long-term history and
the very recent behavior of the natural gas market. Figure No. 1 shows a snapshot of the recent pricing
at the Henry Hub, the primary price reference point in the U.S. natural gas industry.
5 Interstate Oil and Gas Compact Commission, “Issues Briefing: Hydraulic Fracturing”, IOGCC,
http://www.iogcc.state.ok.us/hydraulic-fracturing. 6 EOG Resources, “EOG Resources Q1 2010 Earnings Call Transcript”, May 4, 2010:4 -5. Available online at:
http://seekingalpha.com/article/202833-eog-resources-q1-2010-earnings-call-transcript:
See also: Chesapeake Energy, “Chesapeake Energy Q1 2010 Earnings Call Transcript”, May 5, 2010: 12-13.
Available online at: http://seekingalpha.com/article/203225-chesapeake-energy-q1-2010-earnings-call-transcript.
0.00
2.00
4.00
6.00
8.00
10.00
12.00
14.00
Jan
-07
Ap
r-0
7
Jul-
07
Oct
-07
Jan
-08
Ap
r-0
8
Jul-
08
Oct
-08
Jan
-09
Ap
r-0
9
Jul-
09
Oct
-09
Jan
-10
Ap
r-1
0
$/M
MB
tu
Henry Hub Monthly Average Spot PriceFigure No. 1
Source: Platts
Page 7
6
This is what consumers have seen in the industry, a price that moved from a range of $6.00 -
$8.00 per million Btus in 2007, as high as $13.00 in 2008, then as low as $2.00 in 2009. For price-
sensitive consumers, such price movement makes planning extremely difficult, makes any degree of
long-term commitment very risky, and generally has made natural gas more of an opportunistic fuel
source than a base fuel and feedstock source if there is another choice.7
Currently, prices have recovered to the $4.00 to $5.00 range. However, this then highlights the
other sector that is very dissatisfied with natural gas price volatility: producers. At $4.00 to $5.00,
producers have indicated that steady, sustained development of the nation’s extensive natural gas
resource is problematic. At these price levels, drilling is currently continuing, but in large part driven by
the requirements of existing leases and by the ability to focus only on the “sweet” spots in the various
shale gas basins.8 Additionally, in some basins, the presence of hydrocarbon liquids--crude oil, natural
gasoline, etc.--support the economics of some drilling even with inadequate natural gas prices.9 In other
words, the producers are picking and choosing, based on factors other than an overall healthy natural
gas market with adequate, stable prices.
It would seem that an industry wherein both producers and consumers are dissatisfied with the
unpredictability of price behavior would be able to achieve some meeting of the minds to stabilize
supply-demand relationships. However, that has not happened in the natural gas industry—equilibrium
has apparently been hard to find. One objective of the Task Force is to understand the reasons, whether
those reasons pertain in the same degree in the future, and what, if anything, might be done about
them in the private and public arenas.
7 Rich Wells, Vice-President Energy, The Dow Chemical Company, “Testimony on What’s Cooking with Gas: the
Role of Natural Gas in Energy Independence and Global Warming Solutions before the Select Committee on Energy
Independence and Global Warming”, July 30, 2008:4-6. Available online at:
http://republicans.globalwarming.house.gov/Media/file/PDFs/Hearings/2008/073008CookingWithGas/RichWellsT
estimony.pdf. 8 Op. cit. Chesapeake Energy Earnings Call: 5. Statements by Marcus Rowland.
9 Op.cit. EOG Earnings Call: 2.
Page 8
7
B. The American Gas Foundation Study for the Oakridge National Laboratories
The issue of gas price volatility has long been recognized and has particularly gained a high level
of visibility over the last decade. For example, in October 2003, the U.S. Department of Energy’s
Oakridge National Laboratories sponsored, through the American Gas Foundation, a very extensive, 320-
page study of the subject (the “AGF Study”). 10 That study concluded that for a variety of reasons price
volatility was a necessary and healthy attribute of an efficient market, that changes made in the industry
by legislative action and by the Federal Energy Regulatory Commission (“FERC”) had intentionally
favored efficiency over stability, and that, coupled with the nature of the supply-demand balance,
sustained and increasing price volatility was expected to be a permanent characteristic of the industry.
The AGF Study started out by indicating (in 2003) that:
Over the last five years, price volatility has become the most significant issue facing the natural
gas industry and its customers. Natural gas, electricity, crude oil and oil product markets have all
exhibited extreme price volatility for some portion of the period. But the volatility of natural gas
and electricity prices increased more dramatically than the rest. The increase in price volatility
has contributed to a climate of uncertainty for energy companies and investors and a climate of
distrust among consumers, regulators, and legislators.11
As noted, the AGF Study is over 300 pages long including its appendices. However, its conclusions are
stated very concisely in the Summary and Findings of the study:
Over the next twenty years, the natural gas market will rely less on the conventional sources of
natural gas supply that have supplied most of the natural gas consumed in the past.
Increasingly, new sources of natural gas will need to be developed to meet demand. Much of
the new supply will come from frontier gas resources that are not currently an important part
of the overall supply portfolio. These frontier resources will include a mix of LNG imports,
Arctic gas from Alaska and Canada, Canadian Maritimes production, deep offshore
production, and other sources of remote supply. Some mix of these sources of supply is clearly
needed to meet gas requirements. These supplies will result in increased availability of gas
supply and a lower average price than would occur in the absence of these sources of gas.
However, these frontier supplies will not reduce volatility. Rather, reliance on these resources
tends to increase natural gas volatility relative to other more conventional supply sources due to
several of the characteristics of frontier supplies.
10
American Gas Foundation, Natural Gas and Energy Price Volatility prepared for the Oak Ridge National
Laboratory – Energy and Environmental Analysis, INC., October 2003 (“AGF, Natural Gas and Energy Price Volatility
Study”). 11
AGF, Natural Gas and Energy Price Volatility Study, Summary and Findings: SF-1, ¶1
Page 9
8
Frontier projects tend to require huge up-front investments, but have very low incremental
costs after the initial investment is completed. As a result, there is a stronger than normal
incentive to maintain maximum production levels from frontier projects and the price at which a
production shut-in would occur is typically lower than for conventional resources. This tends to
decrease short-term supply response to price. Most frontier projects can be expected to flow at
as close to capacity as is operationally possible, regardless of market conditions.
Daily demand volatility is also expected to continue to increase over time in absolute terms. The
growth in weather sensitive load will increase demand response to changes in weather,
increasing overall demand volatility. In addition, the growth in power generation load is
expected to increase daily demand volatility in most regions. The majority of the new natural
gas power generating stations will be used to meet peak and intermediate electric load
requirements. As a result, they will cycle on and off as the marginal sources of electricity
supply, leading to larger day-to-day swings in natural gas demand.
Without structural changes in natural gas and electricity markets, the analysis conducted in this
study effort concludes that natural gas markets will remain volatile, with potentially even larger
price swings in the future.
Unfortunately, there is no “silver bullet” available to address volatility. There are real and
potentially substantial costs associated with any of the approaches identified in this analysis. It is
important that industry, consumers, regulators, and policymakers consider the alternatives in an
informed manner to develop a consensus approach to addressing energy price volatility.12
It is very important to note the two portions of the AGF Study conclusions that have been
emphasized with boldface type. First, as of 2003, the expectation was that any incremental supply
response to increased demand would come from remote, highly capital-intensive sources, such as
liquefied natural gas (LNG) and Alaska. That expectation also was a major outcome of the 2003 National
Petroleum Council Natural Gas Study requested by and performed for the Secretary of Energy.13 The
emergence of unconventional natural gas supplies, especially shale gas, in the lower 48 United States
has fundamentally changed this expectation. Thus, in a comprehensive updated examination of natural
gas price volatility, a key question is what impact this change in supply expectation, often referred to as
a “game changer,” might have on the supply-demand balance driving price behavior.
12
AGF, Natural Gas and Energy Price Volatility Study, Summary and Findings: SF-1, ¶4, emphasis added. 13
National Petroleum Council Committee on Natural Gas, “Balancing Natural Gas Policy: Fueling the demands of a
growing economy”, Study prepared for the U.S. Secretary of Energy by the National Petroleum Council, September,
2003: 4 – 5 ( Executive Summary).
Page 10
9
Second, the AGF Study acknowledged that a great deal of gas-fired power generation had been
built, but expected that generation to be on-again/off-again in such a way that it would exacerbate
unpredictable price volatility. To date, this has in fact been the role and behavior of the extensive fleet
of gas-fired power generation.14 However, throughout the Task Force’s effort a legitimate question to
examine is whether and how a changing role for gas-fired power generation in addressing carbon
mitigation, reducing other pollutants, or enhancing energy efficiency might have an impact on price
stability.
Various references will be made to the AGF Study throughout this paper, in that the AGF Study
constitutes the most recent comprehensive review of gas price volatility, and carries the credibility being
commissioned under the auspices of the U.S. Department of Energy and directed with the broad
industry perspective of the AGF. However, since circumstances in the natural gas industry have changed
so fundamentally since 2003, this paper will undertake to examine the history and current state of gas
price volatility from a fresh point of view, rather than simply updating previous work.
C. Definition of Price Volatility
The AGF Study recites multiple definitions of price volatility. However, a more recent, much
shorter analysis of natural gas price volatility performed by an analyst at the U.S. Energy Information
Administration (EIA) provides a concise definition of what the statistically sophisticated market analyst
would mean by volatility15:
Historical price volatility is the primary measure used in this paper. It is defined as the standard
deviation of daily relative changes in price. A natural log transformation is used to calculate the
daily relative price change, Δpt, for trading day t (Equation 1).
Equation 1: Δpt=ln(pt/ pt -1)
14
Richard G. Smead, “Better Use of Gas Fired Generation Damps Volatility, Cuts Back CO2” Natural Gas and
Electricity 26 no. 10, May – 2010: 29-32, Wiley Periodicals Inc.. This article also outlines the natural gas capacity
and capacity factors as follows: “Although gas-fired generation is 40 percent of capacity, it is only used for 21
percent of actual generation”. 15
U.S. Energy Information Administration, Office of Oil and Gas, “An Analysis of Price Volatility in Natural Gas
Markets”, August-2007:3 – 4. Available online at:
http://www.eia.doe.gov/pub/oil_gas/natural_gas/feature_articles/2007/ngprivolatility/ngprivolatility.pdf.
Page 11
10
Volatility is calculated by multiplying the standard deviation of the daily logarithmic price
changes, Δp, for all trading days within a certain time period by the square root of the number
of trading days within the time period, NT (Equation 2).
Equation 2:
This is a probably too much obscure algebra and statistical analysis to help a layman’s
understanding of the issue, but in fact it highlights a fundamental disconnect between “volatility” as
technical analysts think of it and “price instability” as high-load-factor end users such as chemical plants
and base-load generators think of it. Under this sort of definition, a market that moves from $7 to $13
over six months might not look volatile at all—if it moves smoothly. However, for an end-user who
committed to natural gas at market prices in a $6 to $8 market, sustained increases to double-digits (as
in the steady climb to $13 in 2008) are a far larger issue than the daily fluctuations represented by the
technical concept of volatility.
Very simply, if a natural gas user achieves a fairly steady take pattern (such as in a chemical
feedstock process or a base-load generator), avoiding daily volatility can be as simple as buying gas by
the month, at “bid week” prices. Similarly, temperature-sensitive loads such as residential and
commercial heating customers should generally be protected from daily price volatility by their utility’s
portfolio of supplies and by infrastructure such as storage. It should only be the on-again/off-again load
such as a peaking generator unprotected by storage or by other backstop supply arrangements, and the
trader making and losing money on daily purchases and sales who are particularly at risk from daily price
volatility. Thus, for the captive gas utility customer (whom public policy is designed to protect) and for
the high-load-factor industrial or generation customer (whom the natural gas industry needs to attract
to support sustained development), it is the large, sustained, chronic movement of prices that poses the
most concern and risk. Accordingly, the bulk of the discussion and historical review in this paper will
center around monthly and even seasonal price movements.
Page 12
11
This leads to the following working definition of price volatility for purposes of this paper:
“Sustained, unpredictable price movements that frustrate the economics of high-load-factor use of
natural gas in industrial, chemical, and power-generation applications (on the upside), or frustrate the
organized, sustained growth of deliverability from domestic onshore unconventional resources.” Daily
and short-term volatility will be addressed periodically, but will always be referenced as “short-term
volatility.”
Page 13
12
II. Historical Evolution of and Price Volatility in U.S. Natural Gas Markets
The U.S. natural gas industry has been in existence at least since the 1920s.16 However, the
genuinely free, competitive natural gas market in place today is only seventeen years old. Until the
Natural Gas Wellhead Decontrol Act of 198917 (implemented in the 1990-1991 time frame) and FERC
Order No. 63618 (issued in 1992, with implementation in 1993), the natural gas industry was
characterized by significant dysfunction, dysfunction which led first to chronic shortages, then to
significant oversupply with radically varying prices and little communication between the supply and
demand ends of the pipeline.
Thus, the pricing dynamics of the industry will be examined here in three periods:
(1) 1976 to 1990: Transition from Regulated Prices to Statutory Prices to Free Prices;
(2) 1990 to 2000: The Transition to Decontrol; and
(3) 2000 to 2010: Crisis, Volatility, Growth and New Natural Gas Abundance.
A. Period 1, 1976 to 1990: Transition from Regulated Prices to Statutory Prices to Free Prices
In 1976, the natural gas industry reached the depths of a supply shortage in interstate markets
that had been in place and worsening since the late 1960s. The basic reason for the shortage was the
effect of cost-based wellhead pricing imposed in 1954 as the result of the U.S. Supreme Court’s decision
in the Phillips case.19 The national ceiling price for natural gas at the wellhead was 52 cents per thousand
cubic feet, set by the Federal Power Commission (“FPC,” the predecessor to the FERC), at the same time
16
Richard Pierce, “Reconstituting the Natural Gas Industry from Wellhead to Burnertip”, Energy Law Journal 9 no.
1 (1998): 1-2. 17
The Natural Gas Wellhead Decontrol Act of 1989, Pub. L. No. 101-60, 103 Stat. 157, (1989). Available online at:
http://www4.law.cornell.edu/uscode/15/3301.notes.html. 18
Order No. 636, Pipeline Services Obligations and Revisions to Regulations Governing Self-Implementing
Transportation; and Regulation of Natural Gas Pipelines After Partial Wellhead Decontrol, 57 Fed. Reg. 13267 (April
16, 1992), 1992 FERC Statutes and Regulations (CCH) 30,939 (April 8, 1992); order on reh'g, Order No. 636-A, 57
Fed. Reg. 36,128 (August 12, 1992), 1992 FERC Statutes and Regulation (CCH) 30,950, order on reh'g, Order 636-B,
57 Fed. Reg. 57,911 (December 8, 1992), 61 FERC 61,272 (CCH) (November 27, 1992). Available online at:
http://www.ferc.gov/legal/maj-ord-reg/land-docs/rm91-11-000.txt. 19
Phillips Petroleum' Co. v. Wisconsin, 347 U.S. 672 (1954). Print
Page 14
13
that prices in the non-Federally regulated intrastate markets of Texas and Louisiana were running at
several times that, approximately $2.50. The FPC spent much of its time in administrative curtailment
proceedings to allocate scarce gas supplies among markets, but some areas of the country still
experienced crippling shortages—albeit at stable prices.20 That year, 1976, the FPC attempted a limited
remedy by significantly raising the cost-based ceiling, from 52 cents to $1.42 per thousand cubic feet.
Then in 1977, Jimmy Carter became President and embarked on two natural gas initiatives:
First, he called for and secured passage of the Emergency Natural Gas Act of 1977,21 designed to allow
more flexible movement of gas and emergency response by the FPC (and at the same time passed the
Energy Organization Act,22 converting the FPC to the FERC). Then, after a long struggle, President Carter
and the Congress passed and enacted the Natural Gas Policy Act of 1978 (“NGPA”).23 The NGPA was
part of a package of statutes designed to reform energy regulation. Among other things, the NGPA
prescribed new, non-cost-based prices for natural gas, intended to focus the greatest economic
incentives on new gas and particularly deep gas. Old regulated gas was essentially frozen at its old,
regulated price.
As a result, when the NGPA took full effect in 1979, the natural gas industry was subject to 27
different ceiling prices, ranging from approximately 40 cents to approximately $7.00 (with some
categories being altogether deregulated over time). It was thought that by offering high prices for new
supply, new drilling would take place, while by freezing most flowing gas at its old prices, consumer
impact would be mitigated.24
During this period, virtually all natural gas in interstate commerce was purchased and sold by
interstate pipelines, who could thus aggregate a portfolio of, for example, 40-cent gas, $2.00 gas, and
20
Op. cit. Pierce. 21
Emergency Natural Gas Act of 1977, Pub. L. No. 95-2, 91 Stat. 4, (1977). 22
Department of Energy Organization Act in 1977, Pub .L. No 95-91, 91 Stat. 565, (1977). 23
Natural Gas Policy Act of 1978, Pub. L. No. 95-621, 92 Stat. 3350 (1978). 24
Op.cit. Pierce
Page 15
14
$7.00 gas, resulting in a weighted-average cost of gas, or WACOG, of $3.00. This WACOG was the only
price actually seen by consumers. Further, if the WACOG changed during a year to levels higher than
those estimated in rates—if, for example, the pipeline purchased relatively more $7.00 gas and
relatively less 40 cent gas, the pricing effect would not be seen until the subsequent year, in a
reconciling surcharge designed to balance revenues with costs. In other words, the pipeline’s
purchasing decisions were not in any way directly responsible to market discipline at the consuming
end.
Various regulatory and contractual complexities further compounded this economically
inefficient system. Many pipelines had “minimum bills,” whereby they could require their customers to
take a certain percentage of their sales contracts, regardless of price. Most producers had “take or pay”
contracts with the pipelines, whereby a minimum level of deliverability had to be taken or paid for, and
even many “must-take” contracts, in which the pipeline was required to take gas physically and pay for
it, even if there was no place for the gas to go.
In 1984, the FERC issued Order No. 380, 25eliminating the pipeline’s ability to force customers to
take a certain amount of gas. However, pipelines still had their take-or-pay and must-take contracts
with producers. These onerous provisions tended to apply most strongly to the highest-priced producer
supplies. Thus, when the $3.00 average price cited above failed to clear the market and customers now
had the option of not taking the gas (and exercised that option), the pipelines cut the only supplies
where they had flexibility—the low-cost old supplies. The end result was a WACOG that spiraled out of
control, massive market distortions, and what looked like price volatility—that is, pipeline prices
reflecting this dysfunctional supply situation escalated rapidly, but because of a change in mix, not
because of market forces.
25
Docket No. RM 83-71-000, Elimination of Variable Costs from Certain Natural Gas Pipeline Minimum Commodity
Bill Provisions, FERC Stat. & Reg. (CCH) 30,571 (1984).
Page 16
15
In fact, market forces were trying to push in the other direction. The high prices for new gas had
been so successful in bringing forth substantial new supplies (and consuming markets had been
depressed by erratically high pipeline prices and by statutory mandates to limit the use of natural gas),
that the industry entered a long period of oversupply. It was in large part this oversupply that ultimately
allowed the industry to make a smooth transition into the current unregulated environment.26
Lessons Learned from the Regulated Era and Questions for Today
The relevance of this long-past history is twofold: First, it helps to explain some of the deep and
long-held distrust of natural gas markets among large consuming entities. They have seen shortages,
they have seen statutory bars on their use of gas supply, and they have seen prices that seemed to
move around with no regard for logical economic forces, all within the last twenty years. Second, the
long series of statutory and regulatory “Band-aids” from 1954 through the late 1980s proved many
times the law of unintended consequences. Every artificial constraint or incentive created by legislative
or regulatory fiat created some other incentive, or some other interaction with institutional forces, that
caused suboptimal behavior. Meanwhile, the pipeline merchant function, when it was supported by
minimum bills at the customer end and disciplined by take-or-pay contracts at the supply end, exhibited
remarkable stability of consumer pricing, reliability, and utility-type service. But that stability came at
the cost of losing all direct interaction between supply and demand.
The gas market has changed so fundamentally since the dysfunction of the regulated era that
there are few open questions from that era still worth answering. Probably the most significant would
be this: If public entities take any action that attempts to guide or to limit free-market activity (including
such elements as enforcement actions for suspected market manipulation and the current legislative
initiatives to restrict financial derivatives, or any initiatives that might be undertaken to reduce price
26
Thomas J. Norris, “Federal Regulatory Policy in Gas Has Evolved to Looser Controls” in Natural Gas industry
Analysis, ed. Robert E. Willet, 183, (Houston: Financial Communications Company, 2000).
Page 17
16
volatility), how best can real-world communication be achieved with commercial markets, such that
unintended consequences may be better anticipated and factored into the policy choices? This clearly
was not done effectively in the 1970s and 1980s, and the potential for new extra-market discontinuities
to emerge from new legislative or regulatory actions today must be recognized—and compensating for
such discontinuities must find a way to benefit from today’s superior understanding of natural gas
market structure.
Page 18
17
B. Period 2, 1990 to 2000: The Transition to Decontrol
As of 1990, a parallel system of open-access transportation had evolved in the natural gas
industry, under FERC Order No. 436,27 and Congress had passed the Wellhead Decontrol Act, fully
deregulating all wellhead natural gas prices. As noted, accomplishing this change without a fly-up in
prices was possible because the industry had built up a relatively large backlog of excess supply
capability. Meanwhile, most flowing gas was still under contract to pipelines, with the open-access
transportation of newly deregulated supplies being an alternative for price-sensitive markets, but not
the primary vehicle for natural gas service and reliability.
Then in 1992, the FERC issued Order No. 636, essentially completing the transition to a
responsive market. By that order, interstate pipelines were taken out of the merchant role entirely—
now consumers would in effect purchase natural gas directly from producers, paying separately for the
pipeline transportation and storage services necessary to deliver the gas. This direct communication
between ultimate buyers and the original suppliers of gas allowed (and still allows) supply and demand
to interact directly and quickly.
The 1990 to 2000 period, with the introduction in 1993 of universal “unbundled” service under
Order No. 636 saw very stable prices. Figure Nos. 2, 3, and 4 recount the experience of the decade,
from 1990 to the beginning of 2000 (Henry Hub prices actually first became available February 9, 1990).
Figure No. 2 shows monthly average Henry Hub prices, starting somewhat below $2.00 as
decontrol began, settling in at $2.00 until 1996, spiking briefly to $5.50 during an unusually cold winter,
then settling back down to levels that hovered around $2.00, but beginning a climb to higher levels that
would manifest itself the following year.
27
Order No 436, Regulation of Natural Gas Pipelines After Partial Wellhead Decontrol FERC Stat. & Reg. (CCH)
30,665 (1985), order on reh'g, Order 463-A FERC Stat. & Reg. (CCH) 30,675 (1985), order on reh'g, Order 463-B
FERC Stat. & Reg. (CCH) 30,688 (1986).
Page 19
18
It is important to note that the prices in Figure No. 2 are Henry Hub spot prices, not reflective of
the overall, more stable pricing inclusive of non-spot contracts. Figure No. 3 depicts the average actual
wellhead prices during the same period, as recorded by the Energy Information Administration.
0.00
2.00
4.00
6.00
8.00
10.00
12.00
14.00
Jan
-90
Jan
-91
Jan
-92
Jan
-93
Jan
-94
Jan
-95
Jan
-96
Jan
-97
Jan
-98
Jan
-99
Jan
-00
$/M
MB
tu
Henry Hub Monthly Average Spot PriceFigure No. 2
Source: Platts
0.00
2.00
4.00
6.00
8.00
10.00
12.00
14.00
Jan
-90
Jan
-91
Jan
-92
Jan
-93
Jan
-94
Jan
-95
Jan
-96
Jan
-97
Jan
-98
Jan
-99
Jan
-00
$/M
MB
tu
Monthly Average Wellhead PricesFigure No. 3
Source: EIA U.S. Natural Gas Prices, Release 4/29/10
Page 20
19
Reflective of the higher stability of actual prices, the 1996 spike in Henry Hub prices did not
manifest itself at all in monthly averages, beyond a slight uptick in pricing from 1995 to 1996 at the
$2.00 level. However, a similar Henry Hub jump in 1997 did have a corresponding increase in average
prices, indicating more contracts nationwide being indexed to the Henry Hub. This increasing reliance
on index prices to set contractual prices is a theme that would become more pronounced in later years.
Last, we see the daily activity at the Henry Hub, corresponding with the monthly average Henry
Hub prices depicted in Figure No. 2. Figure No. 4 indicates that daily volatility was fairly high, especially
during the 1996 price spike—momentary spot prices reached as high as $14.00 in late February.
However, that daily volatility did not appear to affect very many consumers, based on the average
actual prices.
-
2.00
4.00
6.00
8.00
10.00
12.00
14.00
01
-Ja
n-9
0
01
-Ja
n-9
1
01
-Ja
n-9
2
01
-Ja
n-9
3
01
-Ja
n-9
4
01
-Ja
n-9
5
01
-Ja
n-9
6
01
-Ja
n-9
7
01
-Ja
n-9
8
01
-Ja
n-9
9
01
-Ja
n-0
0
$/M
MB
tu
Henry Hub Daily Spot PriceFigure No. 4
Source: Platts
Page 21
20
Thus, with the exception of the short-term jump in spot prices that did not have any apparent
major impact on consumer prices, the first decade after wellhead decontrol was characterized by very
stable pricing. Why? It was noted earlier that the excess supply overhang was a major asset in
Congress’s ability to deregulate prices without any precipitous price movement. How did that excess
deliverability behave during the transition through the decade, into the 2000s when we will see very
different pricing behavior?
Figure No. 5, adapted from the 2003 AGF Study discussed earlier, shows the evolution of
deliverability vs. production. In 1995, deliverability exceeded production by approximately 5.5 billion
cubic feet per day (8 percent). The spike in consumption caused by unusually cold weather in 1996 (and
the resulting elevated production in 1996 and 1997) was easily absorbed by the excess deliverability.
However, by 2000, the relationship had tightened to a difference of only approximately one billion cubic
feet per day (2 percent)—the excess-supply bubble was essentially gone, foreshadowing extreme
sensitivity to the supply-demand balance.
66.00
67.00
68.00
69.00
70.00
71.00
72.00
73.00
1995 1996 1997 1998 1999 2000
North American Dry Gas Deliverability vs.
Production, 1995 through 2000
Figure No. 5
Source: Adapted from AGF 2003 Study, Figure 1-16,
based on Energy and Environmental Analysis Inc. 2002 Monthly Update
Deliverability
ProductionBC
Fp
er
Da
yD
ry
Page 22
21
This comparison of available supply with the supply actually being used highlights one of the
AGF’s Study’s most important conclusions, from the 2003 vantage point from which it was performed.
The AGF Study considered three potential primary drivers for the post-2000 price volatility at the time:
Tightening of the supply/demand balance, the impact of evolving technical trading techniques, and
market-design imperfections that might have allowed some degree of manipulation. The AGF Study
concluded:
Of these three factors, the tightening of the overall supply-demand balance and the limited size
of the demand response to price changes accounted for the vast majority of the volatility in gas
prices since 2000.28
What caused the increase in production that absorbed the excess deliverability? Very simply,
expanding needs for electricity, ease of siting and installation of gas-fired generation, and low, stable
natural gas prices led to a significant increase in the use of natural gas to generate power. Figure Nos. 6,
7, and 8 indicate the pace and impact of this increase, from 1990 to 2000—an increase of 57 percent in
capacity, 61 percent in generation, and 54 percent in gas use.
28
AGF, “Natural Gas and Energy Price Volatility”, Summary and Findings: SF-2.
140,000
150,000
160,000
170,000
180,000
190,000
200,000
210,000
220,000
19
90
19
91
19
92
19
93
19
94
19
95
19
96
19
97
19
98
19
99
20
00
Gas-Fired Summer Generation Capacity
Total United States, 1990 - 2000
Figure No. 6
MW
Source: EIA Electric Power Annual 2008 - State Data Tables
Page 23
22
.
Most notably, from 1990 to 2000, gas-fired generation added 5.5 billion cubic feet a day of gas demand,
coincidentally the same volume as the oversupply of deliverability in North America in the early 1990s.
In essence, new gas-fired generation absorbed the oversupply, but prices were inadequate for
300,000
350,000
400,000
450,000
500,000
550,000
600,000
19
90
19
91
19
92
19
93
19
94
19
95
19
96
19
97
19
98
19
99
20
00
Gas-Fired Annual Generation
Total United States, 1990 - 2000Figure No. 7
1,0
00
MW
Ho
urs
Source: EIA Electric Power Annual 2008 - State Data Tables
10.00
11.00
12.00
13.00
14.00
15.00
16.00
19
90
19
91
19
92
19
93
19
94
19
95
19
96
19
97
19
98
19
99
20
00
Gas Used for Power Generation
Total United States, 1990 - 2000
Figure No. 8
BC
F p
er
Da
y
Source: EIA Electric Power Annual 2008 - State Data Tables
Page 24
23
deliverability to increase with the growth in use. Demand and supply had not found economic
equilibrium.
Lessons Learned from the Transition to Decontrol and Questions for Today
The excess supply throughout the 1980s and into the 1990s was referred to as the “supply
bubble,” but then, when it lasted much longer than anyone had expected, it became known as the
“supply sausage.”29 This extended oversupply clearly provided the cushion for a smooth transition from
static, regulated prices to unregulated prices that could move as far and as often as the market chose for
them to move. That smooth transition, with low, stable prices for several years, was the underpinning
for significant growth in gas-fired power generation—which unfortunately occurred without a
corresponding increase in deliverability. The primary lesson to be drawn from this fairly stable decade is
that prices low enough to stimulate significant growth in demand can be insufficient to bring additional
supply forward—the $2.00 prices prevalent during most of the decade did not lead to an increase, or
even a maintenance, of deliverability.
The questions lingering from what really was a strikingly successful transition to an unregulated
commodity market, wherein suppliers and consumers were now connected through a new, and very
effective suite of pipeline services are, essentially, what went right and what went wrong? Power
generation responded rationally to the economic signal of low, stable prices and more-than-adequate
supply, to use more gas in existing plants and to build a great deal of new gas-fired capacity. Supply
markets were constrained by a perception that new supplies were unlikely to be found in large
quantities in the United States, and responded rationally to low prices and oversupply by not taking a
great deal of risk on new development. The question relevant to today’s situation going forward is how
the two ends of the supply chain—marginal consumers such as power generators, and producers whose
29
Conrad de Aenlle, “Is there Energy in Oil stocks?” The New York Times, April 24, 1993. Available online at:
http://www.nytimes.com/1993/04/24/your-money/24iht-mraa_2.html?pagewanted=print -
Page 25
24
marginal drilling activity is very much a function of the expected price situation—can be brought to find
a different equilibrium than (1) over-consumption/high, demand-frustrating prices, or (2)
oversupply/low, development-frustrating prices. This question is particularly relevant in today’s
environment of an apparently abundant resource base with a manufacturing-type economic equation
controlling its rate of development—that is, producers are no longer required to be incented to take
unspecified “wildcat” geological risk, but they do need to be incented to weigh present capital
investment against uncertain future revenue streams. How can that be done, such that supply-demand
communication and planning are more effective than they were in the 1990s?
C. Period 3—2000 to 2010: Crisis, Volatility, Growth and New Natural Gas Abundance
The most recent decade has seen a substantial increase in large gas-price movement,
highlighted by four very noteworthy events: The California energy crisis of 2000-2001, the severe price
fly-up following the hurricanes in 2005, the steady, and pronounced price escalation of 2008, and the
virtual collapse of natural gas prices from the summer of 2008 forward, against a backdrop of apparent
supply abundance. The characteristics of these four reference points are different enough, and the
direct relevance to today’s price-volatility questions is strong enough, that each will be examined in its
own section. However, first, an overview of price behavior from 2000 to 2010 will be presented, along
with some broad observations as to key drivers.
High Volatility at Henry Hub
Figure No. 9 follows the monthly-average prices of the Henry Hub during Period 3. As noted,
there are large price spikes corresponding with the three high-price period that will be examined in
detail, and then there is the severe drop-off to today’s price levels.
Page 26
25
Although 2000-2001 corresponds to the California crisis, these are Henry Hub prices, in
Louisiana. In other words, prices ramped up to relatively high levels nationally, irrespective of the
dynamics in California. Similar movement was observed in the actual average wellhead prices around
the country. Figure No. 10 sets forth these averages.
0.00
2.00
4.00
6.00
8.00
10.00
12.00
14.00
Jan
-00
Jan
-01
Jan
-02
Jan
-03
Jan
-04
Jan
-05
Jan
-06
Jan
-07
Jan
-08
Jan
-09
Jan
-10
$/M
MB
tu
Henry Hub Monthly Average Spot Price Figure No. 9
Source: Platts
0.00
2.00
4.00
6.00
8.00
10.00
12.00
14.00
Jan
-00
Jan
-01
Jan
-02
Jan
-03
Jan
-04
Jan
-05
Jan
-06
Jan
-07
Jan
-08
Jan
-09
Jan
-10
$/M
MB
tu
Monthly Average Wellhead PricesFigure No. 10
Source: EIA U.S. Natural Gas Prices, Release 4/29/10
Page 27
26
It should be recalled (from Figure Nos. 2 and 3, above) that during the previous decade the
average prices actually paid around the country exhibited significantly less movement than Henry Hub
spot prices. However, an overlay of Figure Nos. 9 and 10, set forth in Figure No. 11, shows that in the
most recent decade, price movements were remarkably similar—implying that much more gas supply is
indexed to spot prices than was the case previously.
One implication of this linkage is that reported prices at major market points such as the Henry
Hub can actually drive the price levels for multiple non-spot contracts throughout the industry. With
most trading heavily automated, tracking index prices, there is the concern that large swings in the
market can happen because of relatively small transactions, or because of incorrectly reported
information. This situation contrasts with the early days of the decontrolled market, when spot prices
were reported, but the vast bulk of transactions were still bilateral negotiations that just used the
reported prices as a data point.30
30
FERC, “Report on Natural Gas and Electricity Price Indices”, Dockets No. PL03-3-004 and No. AD03-7-004, May 5,
2004: C. Survey Results, Reporting Practices of Respondents Have Improved Since the First Survey: 32; C.
Commission and Industry Actions To Improve Confidence in Price Formation: 10.
0.00
2.00
4.00
6.00
8.00
10.00
12.00
14.00
20
00
20
01
20
02
20
03
20
04
20
05
20
06
20
07
20
08
20
09
20
10
$/M
MB
tu
Henry Hub and Average Wellhead Overlaid Figure No. 11
Source: Platts
Henry Hub
Wellhead Average
Page 28
27
Before getting into the specific occurrences of the past decade, what background factors
created the environment in which such large price movement was likely? First, the growth of natural
gas use for power generation continued, although in a somewhat different configuration than had been
the case up until 2000. Figure Nos. 12, 13, and 14 depict the growth of gas-fired generation capacity,
actual gas-fired generation, and gas use for generation, up through 2008.
200,000
220,000
240,000
260,000
280,000
300,000
320,000
340,000
360,000
380,000
400,000
2000 2001 2002 2003 2004 2005 2006 2007 2008
Gas-Fired Summer Generation Capacity
Total United States, 2000 - 2008Figure No. 12
MW
Source: EIAElectric Power Annual 2008 - State Data Tables
600,000
650,000
700,000
750,000
800,000
850,000
900,000
2000 2001 2002 2003 2004 2005 2006 2007 2008
Gas-Fired Annual Generation
Total United States, 2000 - 2008Figure No. 13
1,0
00
MW
Ho
urs
Source: EIAElectric Power Annual 2008 - State Data Tables
Page 29
28
Gas generation capacity increased by 178,000 MW, or 81 percent. However, actual use of gas-
fired generation increased only 47 percent, and the fuel use of natural gas for generation increased by
just 3.3 billion cubic feet per day, or 21 percent. The disparity between capacity growth and generation
growth was symptomatic of the difficulty faced by new natural gas units to be base loaded, largely
because economic dispatch rules in most markets are driven by the marginal cost of fuel, and gas was
more expensive than coal. The disparity between the generation increase and the fuel increase was a
symptom of the very high efficiency of new gas-fired combined-cycle units.31 In any event, all three
metrics did increase significantly, in a market already under supply-demand stress.
That supply-demand stress was a continuation of the narrowing deliverability-production margin
that had steadily evolved through the late 1990s. As noted in the AGF Study, significant excess
deliverability was virtually gone by 2001. Figure No. 15 continues the deliverability-production
comparison for North America begun in Figure No. 5, above.
31
Op. cit. Richard G. Smead, “Natural Gas and Electricity – Better Use of Gas-Fired Generation Damps Volatility,
Cuts Back CO2”.
15.00
16.00
17.00
18.00
19.00
20.00
21.00
2000 2001 2002 2003 2004 2005 2006 2007 2008
Gas Used for Power Generation
Total United States, 2000 - 2008
Figure No. 14
BC
F p
er
Da
y
Source: EIAElectric Power Annual 2008 - State Data Tables
Page 30
29
The AGF Study thoroughly analyzes, from the standpoint of basic economic theory, the reasons
causing natural gas pricing to respond with large swings when supply and demand become tight. It is
clear that as excess deliverability was used up at the end of the 1990s and the current decade was
entered with a tight supply-demand balance, the stage was set for large pricing discontinuities.
This paper will now review and examine the three most noteworthy pricing spikes, California,
the 2005 hurricanes, and 2008, analyzing each individually. Very importantly, there are specific lessons
to be learned from all three, lessons that could lead to action items in both public and private arenas to
prevent or ameliorate the degree of price activity that took place. There are also questions, especially
with respect to 2008, that might ultimately suggest some form of broad industry outreach to learn
more.
66
67
68
69
70
71
72
73
1998 1999 2000 2001 2002
North American Dry Gas Deliverability
vs. Production, 1998 through 2002
Figure No. 15
Source: Adapted from AGF 2003 Study, Figure 1-16,
based on Energy and Enviromental Analysis Inc. 2002 Monthly Update
BC
F p
er
Da
y D
ry
Page 31
30
1. 2000-2001—The California Crisis
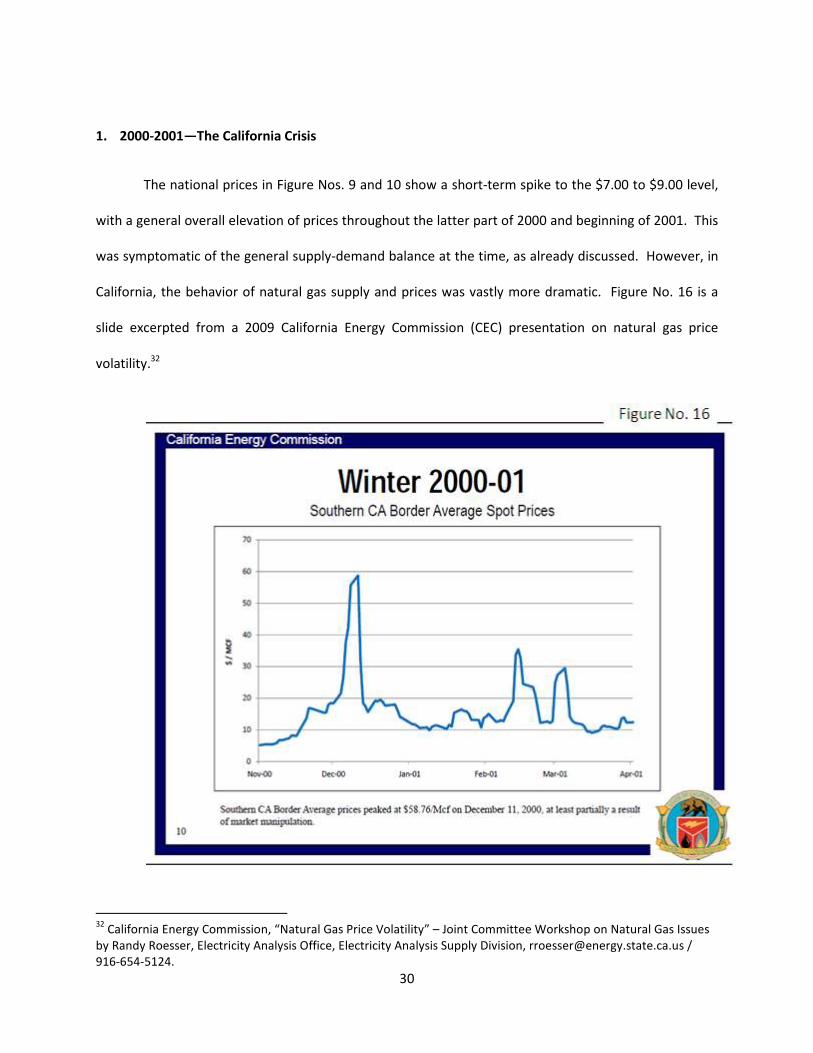
The national prices in Figure Nos. 9 and 10 show a short-term spike to the $7.00 to $9.00 level,
with a general overall elevation of prices throughout the latter part of 2000 and beginning of 2001. This
was symptomatic of the general supply-demand balance at the time, as already discussed. However, in
California, the behavior of natural gas supply and prices was vastly more dramatic. Figure No. 16 is a
slide excerpted from a 2009 California Energy Commission (CEC) presentation on natural gas price
volatility.32
32
California Energy Commission, “Natural Gas Price Volatility” – Joint Committee Workshop on Natural Gas Issues
by Randy Roesser, Electricity Analysis Office, Electricity Analysis Supply Division, [email protected] /
916-654-5124.
Page 32
31
We see a California border price spiking to almost $60, then later reaching as high as $35—this
in a national market that came nowhere near those levels. In fact, the same CEC presentation indicates
that while Henry Hub prices reached as high as $10 for a brief period in December, that was the only
spike in the national-market price of any size that winter. The CEC presentation indicates that the
national price movement was the result of physical supply/demand factors, while, as shown in Figure
No. 16, some of the California movement was ascribed to price manipulation.
Certainly, there were many allegations, many investigations, and some fairly substantial
economic damage settlements surrounding that year in California.33 However, with the backdrop of the
AGF Study’s explanation of the circumstances in which supply-demand imbalances can cause extremely
large price movement, the 2000-2001 situation in California’s natural gas market can be fairly
completely explained in terms of fundamentals. That explanation leads us beyond the immediate
reaction to alleged manipulation, which resulted in Federal legislation in 200534 and substantial corollary
FERC enforcement activity.
The 2000-2001 California natural gas crisis resulted in major part from a perfect storm of sudden
demand increase, impaired physical capacity, natural gas diversion, and inadequate storage fill. The
quick summary is as follows: Low hydroelectric availability in 2000, coupled with a modest increase in
overall power needs resulted in a substantial increase in gas-fired generation usage, with little
preparation. California’s bifurcated gas market, in which some gas and capacity was labeled as “core,”
or necessary to utility service, and much was labeled “non-core,” or able to be managed commercially
without regulatory oversight, allowed much of the market to divert to gas power generation gas which
would have gone into non-core storage. Simultaneously, customers upstream of California on the
largest interstate pipeline serving the state were able to use a longstanding regulatory settlement
33
See, e.g., Public Utilities Commission of the State of California v. El Paso Natural Gas Company, El Paso Merchant
Energy Gas, L.P., El Paso Merchant Energy Company, Docket No. RP00-241. 34
Energy Policy Act of 2005, Pub. L. No. 109-58, 100 Stat. 567. Available online at http://www.ferc.gov/legal/fed-
sta/ene-pol-act.asp.
Page 33
32
provision to divert gas to markets in Arizona, New Mexico, and Nevada, reducing substantially the
amount that could reach California. Then, in August 2000, that largest interstate pipeline suffered a
major rupture in New Mexico that, even after repair, resulted in safety-related reductions in capacity.
The end result was that California went into the 2000-2001 winter approximately 250 billion cubic feet
short in storage, with impaired interstate pipeline capacity and some of the gas in that impaired capacity
diverted to other markets.35 This meant that the 7 billion-cubic-foot-a-day California market was as
much as 1.5 to 2 billion cubic feet a day short, in terms of physical capacity.
As noted, there were many commercial, legal and regulatory reactions to the California
experience, including the construction of new pipeline capacity into the state,36 FERC investigation of
gas price reporting throughout the industry,37 revamping of services and capacity entitlements on the
largest pipeline into the state,38 and the passage of the Energy Policy Act of 2005.39 However, a key
lesson for the entire industry and its regulators is the paradox surrounding California’s core/non-core
bifurcation of the market. In the original 1988 split of utility customers into core and non-core groups,40
the Public Utilities Commission of California (CPUC) basically determined that large power generators
and industrial customers could look out for their own interests, that the public-protection objectives of
the CPUC did not need to apply to them. This lifting of regulatory oversight extended to the timing and
level of those customers’ storage injections. Theoretically, if they failed to fill their “non-core” portion
of storage, they could be precluded from relying on the utility to backstop their failure. However, what
became clear in 2001 was that the physical deliverability available from in-state storage was a key
35
Sources for this account include the various FERC proceedings (Docket No. RP00-241, Docket No. RP00-338,
analysis of EIA generation and gas-supply data for the period, and author’s personal experience. 36
Most notably, a full looping of the Kern River Gas Transmission System from Wyoming to central California. 37
FERC, “Report on Natural Gas and Electricity Price Indices”, Dockets No. PL03-3-004 and No. AD03-7-004, May 5,
2004. 38
El Paso Corp's request for modification to FERC official service list under CP99-614 et al. Docket No. RP00-338
and El Paso Natural Gas Company’s Pro-Forma Tariff Sheets, Docket No. RP05-422-000 (Dec. 12, 2005). 39
See footnote 34. 40
California Public Utilities Commission, “California Natural gas Infrastructure Outlook 2002 – 2006”, November
2001: A. Regulatory History and Current Structure, Table: “Core” and “Non Core” Customers: 4.
Page 34
33
infrastructure component, along with interstate pipeline capacity, in simply serving the overall peak
physical demands in the state.
Lessons Learned and Potential Mitigation
In other words, the substantial “hole” in non-core storage inventory and the resulting loss of
deliverability basically crippled the combined peak-day infrastructure serving the state. The lesson to be
learned and translated to each market around the country, in order to avoid price fly-up even in normal
weather, is that even when it is determined that the commercial trading in the gas commodity can be
left up to market forces, it is critical to ensure that any market participant’s control of key infrastructure
still is subject to enough regulatory oversight that reliability can be maintained to meet normal utility
functions. Thus, for example, where storage on an interstate pipeline system acts as a surrogate for
pipeline capacity, enabling the winter peak to be met without larger capacity from producing areas,
someone needs to be sure that storage is full, even if the customers of the storage are commodity-
speculative marketers. Had similar oversight been applied to the operation of non-core California
storage in 2000-2001, much of the crisis need not have occurred.
The other lesson to be learned from California centers around the rapid escalation in gas-fired
generation as a result of low hydroelectric availability. The decision to divert storage-injection gas to
the high-value generation markets was perfectly rational in a short-term commercial sense. However,
someone should have been aware that the increased generation was being served by diverting supply,
not by increasing supply. What action might have been taken is speculation at this point. But it appears
that no one was aware of the magnitude of the problem that was being created.
In today’s national arena, as was discussed earlier above, this gets to the critical need for
effective communication between the demand sector and the supply sector—now that the domestic
natural gas industry is capable of a substantial long-term ramp-up in supply, rapid increases in gas-fired
Page 35
power generation should always be accompanied by some confirmation that increased supplies are
coming to market in response to that demand. This sort of balance is difficult in today’s price
environment, so should be a fertile subject for discussion in workshop roundtables.
2. Katrina/Rita, and the 2005 Loss of Offshore Supply
The situation surrounding the 2005 hurricanes is not nearly as complex as was the California
crisis. Very simply, 6 billion cubic a feet a day of offshore supply was lost for an extended period of time,
as offshore platforms, major processing facilities, and major pipeline segments were damaged or
destroyed. Representing 10 percent
the supply-demand balance, causing an extreme escalation of prices that peaked in December, at prices
in excess of $15.00. Figure No. 17 is an excerpt from the 200
the daily price behavior that year. Note the gaps, where the Henry Hub itself was out of commission.
34
power generation should always be accompanied by some confirmation that increased supplies are
coming to market in response to that demand. This sort of balance is difficult in today’s price
ment, so should be a fertile subject for discussion in workshop roundtables.
Rita, and the 2005 Loss of Offshore Supply
The situation surrounding the 2005 hurricanes is not nearly as complex as was the California
billion cubic a feet a day of offshore supply was lost for an extended period of time,
as offshore platforms, major processing facilities, and major pipeline segments were damaged or
10 percent of the nation’s total gas supply, this loss put extreme pressure on
demand balance, causing an extreme escalation of prices that peaked in December, at prices
in excess of $15.00. Figure No. 17 is an excerpt from the 2009 CEC report on price volatility, recounting
Note the gaps, where the Henry Hub itself was out of commission.
power generation should always be accompanied by some confirmation that increased supplies are
coming to market in response to that demand. This sort of balance is difficult in today’s price
The situation surrounding the 2005 hurricanes is not nearly as complex as was the California
billion cubic a feet a day of offshore supply was lost for an extended period of time,
as offshore platforms, major processing facilities, and major pipeline segments were damaged or
, this loss put extreme pressure on
demand balance, causing an extreme escalation of prices that peaked in December, at prices
CEC report on price volatility, recounting
Note the gaps, where the Henry Hub itself was out of commission.
Page 36
35
There was the expectation that this price escalation would go on nationwide, to unprecedented
levels, with severe impacts on consumers and local distribution companies (“LDCs”).41 However, the
winter turned out to be extraordinarily mild, the warmest in 112 years.42 As a result, prices plummeted
in January and stayed in the $6.00 to $7.00 range throughout 2006 and 2007.
Figure No. 18 shows the history of the offshore Gulf of Mexico offshore production (Federal
waters, only) from the beginning of 2005 through the period immediately prior to the hurricanes of
2008.
From a high of almost 10 billion cubic feet a day in July, production dropped to 4 billion cubic feet a day
very precipitously as Katrina and Rita hit the offshore facilities back-to-back. Recovery to the 7 billion-
cubic-foot a day level was achieved by the beginning of the year, but half of the loss was never made
up—production hovered around the same level for the next two years.
41
Navigant Consulting, Inc., “Local Distribution Company Recovery of Gas Cost – Mechanics and Issues” by Richard
G. Smead, Director, September 20, 2005. 42
Navigant Consulting, Inc., NG Market Notes, Energy Practice, Issue 52, April 2006.
3.00
4.00
5.00
6.00
7.00
8.00
9.00
10.00
Jan
-05
Ap
r-0
5
Jul-
05
Oct
-05
Jan
-06
Ap
r-0
6
Jul-
06
Oct
-06
Jan
-07
Ap
r-0
7
Jul-
07
Oct
-07
Jan
-08
Ap
r-0
8
Jul-
08
Bcf
pe
r D
ay
Offshore Gulf of Mexico Dry Gas Production Figure No. 18
Source: EIA Form 914, adjusted to net dry
Page 37
36
However, contributing to the resumption of lower prices and generally making up for the
sustained loss of offshore supply, total lower-48 production increased substantially during the same
period, driven by onshore unconventional supply. Figure No. 19 shows the total picture, which included
an overall increase of 6 billion cubic feet a day between July 2005 and July 2008.
Very simply, new onshore production replaced three times the sustained loss of offshore supply. It was
for this reason that relatively more severe offshore outages in hurricanes Gustav and Ike in 2008,
bringing offshore production as low as 2 billion cubic feet a day, had no upward impact on prices—in
fact, prices went down during the September and October impact of the two storms, as shown below in
Figure No. 20:
40.00
42.00
44.00
46.00
48.00
50.00
52.00
54.00
56.00
58.00
60.00Ja
n-0
5
Ap
r-0
5
Jul-
05
Oct
-05
Jan
-06
Ap
r-0
6
Jul-
06
Oct
-06
Jan
-07
Ap
r-0
7
Jul-
07
Oct
-07
Jan
-08
Ap
r-0
8
Jul-
08
Bcf
pe
r D
ay
Total Lower 48 US Dry Gas Production Figure No. 19
Source: EIA Form 914, adjusted to net dry
Page 38
Lessons Learned and Open Questions
The 2005 lessons are very simple: (1) To be less vulnerable to hurricane
best answer is to be relatively more supported by onshore production that is
Directly or indirectly, the industry acted on that lesson between 2005 and 2008, making hurricane
induced price volatility much less of an issue if onshore production growth can be susta
Massive loss of supply does not necessarily have an impact if the weather cooperates
mild weather could somehow be transferred between periods longer than a year, perhaps the
amelioration caused by warm weather in 2006 could
This is a subject ripe for roundtable discussion
instruments that could in essence use actuarial techniques to smooth price impacts between warm and
cold years, such that in a year such as 2005, the anticipated impact of normal weather in a short
situation could have already been paid for through the equival
5.00
5.50
6.00
6.50
7.00
7.50
8.00
8.50
9.00
9.50
1-A
ug
-08
11
-Au
g-0
8
$/M
MB
tu
37
Lessons Learned and Open Questions
The 2005 lessons are very simple: (1) To be less vulnerable to hurricane-induced outages, the
y more supported by onshore production that is immune
Directly or indirectly, the industry acted on that lesson between 2005 and 2008, making hurricane
induced price volatility much less of an issue if onshore production growth can be susta
Massive loss of supply does not necessarily have an impact if the weather cooperates—
mild weather could somehow be transferred between periods longer than a year, perhaps the
amelioration caused by warm weather in 2006 could be duplicated and managed.
This is a subject ripe for roundtable discussion—can storage be an answer, are there
that could in essence use actuarial techniques to smooth price impacts between warm and
cold years, such that in a year such as 2005, the anticipated impact of normal weather in a short
situation could have already been paid for through the equivalent of insurance premiums?
21
-Au
g-0
8
31
-Au
g-0
8
10
-Se
p-0
8
20
-Se
p-0
8
30
-Se
p-0
8
10
-Oct
-08
20
-Oct
-08
30
-Oct
-08
Henry Hub Daily Spot PriceFigure No.
Source: Platts
Gustav
&
Ike
induced outages, the
immune to hurricanes.
Directly or indirectly, the industry acted on that lesson between 2005 and 2008, making hurricane-
induced price volatility much less of an issue if onshore production growth can be sustained. (2)
—so if the effect of
mild weather could somehow be transferred between periods longer than a year, perhaps the
can storage be an answer, are there financial
that could in essence use actuarial techniques to smooth price impacts between warm and
cold years, such that in a year such as 2005, the anticipated impact of normal weather in a short-supply
ent of insurance premiums?
30
-Oct
-08
Figure No. 20
Page 39
38
3. 2008, Prices Run with Oil
Of all the price activity reviewed for this paper, the least understandable is the price escalation
from the $6.00 to $7.00 levels of 2007 to the $13.00 level of the summer of 2008. The two key
explanatory phenomena were that during this period oil prices rose above $140 a barrel, which equates
to $23 per million Btus, or $23 per thousand cubic feet of natural gas, and both the industry and many
policy makers believed that global LNG, priced at oil-equivalent prices, was permanently the price-
setting marginal natural gas supply.43
However, every indication now is that as this price run-up occurred, the industry was actually
over-supplied, as a result of the rapid increase in unconventional domestic supply. This is the reason
that the hurricane-induced loss of offshore supply in 2008 had no material upward price impact.
Simply put, prices more or less tracked oil until mid- July 2008, increasing as shown in Figure No.
21, then dropping throughout late July and August (prior to the onset of financial turmoil, and prior to
the drop in oil prices):
43
Natural Gas Council, “Carbon Reduction Requires Natural Gas”, February 2008.
5.00
6.00
7.00
8.00
9.00
10.00
11.00
12.00
13.00
14.00
1-J
an
-08
16
-Ja
n-0
8
31
-Ja
n-0
8
15
-Fe
b-0
8
1-M
ar-
08
16
-Ma
r-0
8
31
-Ma
r-0
8
15
-Ap
r-0
8
30
-Ap
r-0
8
15
-Ma
y-0
8
30
-Ma
y-0
8
14
-Ju
n-0
8
29
-Ju
n-0
8
14
-Ju
l-0
8
29
-Ju
l-0
8
13
-Au
g-0
8
28
-Au
g-0
8
$/M
MB
tu
Henry Hub Daily Spot PriceFigure No. 21
Source: Platts
Page 40
39
Lessons Learned and Open Questions
The key question to guide future understanding of natural gas price movements is why this
happened, why an apparently oversupplied market behaved as if demand exceeded supply. Certainly,
the expectation was that demand would eventually exceed supply.44 Certainly, there was a general
belief in the industry that as long as natural gas was cheaper than oil, it was a bargain.
But in July, two events took place, apart from physical market activity. First, the EIA announced
that first-quarter 2008 production had exceeded the same quarter of 2007 by 9 percent.45 Second, a
highly publicized study was released by the American Clean Skies Foundation, quantifying for the first
time the full aggregate impact of unconventional supply growth and the apparent resulting
abundance.46 Then prices promptly broke, and returned to 2007 levels, before other factors such as the
Lehman bankruptcy, the banking crisis, and the onset of the recession took hold.
This is a key question for roundtable discussion—is there a long-term psychological factor that
can drive prices, even when supply-demand fundamentals would have driven them in a different
direction? Is there a way to exploit today’s understanding of the potential for supply abundance to build
in “resistance points” in the market, such that irrational price escalation is questioned much earlier? Is
there a role for an outreach effort, a series of interviews or focused industry roundtables, to gather real-
world traders’ perspectives on what happened in 2008 and why?
44
Ibid. 45
EIA Energy in Brief – What everyone should know about energy, “Is US natural gas production increasing?”, June
11, 2008. 46
Op. cit. North America Natural Gas Supply Assessment.
Page 41
40
III. Storage and Other Mitigation Measures
A. Storage—Is it the Answer?
An obvious mechanism for smoothing inter-period price behavior and to guard against
unanticipated upsets is physical storage. The United States has approximately 4.2 trillion cubic feet of
storage working capacity, the quantity of gas that can be injected and withdrawn. This is about 18
percent of a year’s consumption. Of that, 85 percent is in depleted gas production fields, 9.5 percent is
in aquifer fields, and 5.5 percent is in salt-dome facilities. 47
In 2004, the FERC Staff prepared an excellent comprehensive report on natural gas storage,
explaining the different types, their purposes and limitations.48 It is recommended reading for anyone
interested in the potential of storage to deal with price volatility.
Only salt domes offer very quick-response, quick-turnaround, high deliverability that can
address short-term price volatility. Thus, there has been a great deal of new salt-dome construction in
production areas. The basic economics of a salt-dome facility are usually driven by perceived and
expected daily price volatility.49
At the other end of the spectrum are aquifer fields, such as those in the Midwest.50 These are
characterized by the need for very stable withdrawal rates, and an absolute requirement to remove all
the working gas by the end of the heating season.51 Thus, they are good for responding to predictable
seasonal variations, but not for responding to the unexpected, or for long-term backstop storage.
In the middle, with a great deal of variation, are the depleted gas fields that represent 85
percent of capacity. Some can be turned from injection to withdrawal fairly quickly, and, although it is
47
EIA, Underground Natural Gas Storage Capacity, http://www.eia.doe.gov/dnav/ng/ng_stor_cap_dcu_nus_a.htm 48
FERC Staff Report, “Current State of and Issues Concerning Underground Natural Gas Storage”, Docket No.
AD04-11-000, 2004. 49
Ibid, Storage Economics:18. 50
Ibid, Aquifer: 5 and 32. 51
Ibid.
Page 42
41
generally not preferred, some can be used for long-term (greater than one year) storage.52 However,
the existing fleet of storage fields are fully needed for existing seasonal variation, for the role as a
surrogate for transmission pipe, and for general operational purposes. In short, without the
construction of fairly massive new storage capacity, there is not the prospect of the gas equivalent of
the Strategic Petroleum Reserve (“SPR”), wherein gas would sit in the ground for years, until needed to
make up for upsets, or to ameliorate extreme price activity. While quick-response salt-dome storage is
a useful tool for managing short-term volatility, storage is otherwise already doing its job to balance
supply and demand between seasons, and to create enough infrastructure flexibility to avoid many
supply-demand anomalies.
It is the author’s perception that the industry’s equivalent of the SPR is the massive resource
base of shale gas, wherein the location is known and the ability to drill and develop has a fairly short
time frame. This would be a good topic for roundtable discussion.
Having suggested that storage is not necessarily the universal antidote to price volatility, the
California experience discussed in II C 1., above, shows what can happen when storage is not used
properly. The fill and withdrawal of storage has infrastructure implications far beyond the commodity
value of the gas involved. Thus, at least for the vast bulk of storage that still remains regulated by
Federal or state agencies, even if the commercial activity of the holders of storage capacity are left to
the market, there must be oversight that the appropriate system capacities are being maintained to
keep overall supply and demand in physical balance. Again, this would be a good subject for roundtable
discussion, since it involves finding ways to exercise certain regulatory oversight without imposing
pervasive price regulation on the commercial market for natural gas.
52
Ibid: 32.
Page 43
42
B. Other Mitigation Measures—Financial Tools
Financial or commercial tools to avoid the effect of price volatility can take an almost infinite
number of forms. As noted earlier, daily volatility may be avoided by something as simple as buying
natural gas by the month, at a price set during “bid week” leading into the month. Of course, having
done that, the purchaser may be foregoing the opportunity of price troughs during the month, in the
name of avoiding price spikes.
Longer-term stability may be achieved with long-term (more than a month, perhaps more than a
year) contracts with formula pricing. Again, however, the risk is that, taking a power generator as an
example, market volatility would make much lower prices than the contract level available during the
contract term, and competitors of the purchaser would win by taking advantage of those. For a seller,
there is the companion risk that prices would increase in the general market, especially if such an
increase were a response to cost increases—e.g., new environmental regulations affecting drilling, or a
significant increase in material or service costs. In other words, simply committing to long-term
contracts with price certainty is not an attractive option to either side of the transaction if the general
market still exhibits a great deal of price instability.
Various financial instruments—futures, options, hedges, collars, etc., may be used as insurance
policies against future price movement. By paying, in effect, a portion of the price difference between
expectations and actual behavior, a buyer or a seller may guard against unanticipated movement.
However, if the market’s expectation is that such movement could be large, the cost of the insurance
policy becomes prohibitive—the same way life insurance for an overweight, smoking, sky diver costs
more than for an average healthy person. Added to these factors is the growing probability of legislative
Page 44
43
limits on derivatives transactions, which could sharply limit the number of attractive insurance policies
available.53
C. Conclusion as to Storage and Other Mitigation Measures
When prices move within a reasonable range of uncertainty, there are many tools for achieving
a great deal of stability, the most effective simply being long-term contracts sufficient to support growth
in demand and an equal growth in supply. However, when price swings such as those seen in 2008 take
place, the system begins to break down and any amelioration is temporary.54
As for storage, it is very clear that some degree of policy oversight needs to exist, to protect the
role of storage as an element of infrastructure, just as transmission lines are elements of infrastructure.
The complication with storage is that the facilities themselves are not enough—for their infrastructure
role to be fulfilled, the injection-withdrawal cycle may need to be managed in ways contrary to the
short-term commercial forces that would ordinarily govern the natural gas commodity that is stored.
Thus, as much instruction as can be derived from the California experience should be used to discuss
policy formulations.
53
Platts, Gas Daily, April 23, 2010, Obama: Derivatives markets ‘operate in shadows’:1 and 11. 54
Oc. cit. Chesapeake Energy Earnings Call: 7.
Page 45
44
IV. Overall Conclusion
Throughout the historic periods examined and analyzed, despite a host of differences in some
circumstances, the AGF Study’s observation is fully borne out: The vitality and responsiveness of the
supply-demand balance is the most important factor determining whether price volatility in either
direction will occur. We have seen a large growth in demand (power generation) as excess supply left
over from earlier industry dysfunction allowed everything to work. Then we have seen a large surge in
natural gas development that was utterly unrecognized until two years ago, but that ultimately resulted
in another oversupply. But in the intervening period, we saw demand that had grown beyond the ability
of supply to respond and to protect against upsets such as hurricanes.
As an opening thesis for workshop discussions, it would seem that the missing element in the
past has been an ability of supply and demand markets to meet at a stable equilibrium point before
large price movement has to occur to bring them together. To what extent can a “just-in-time”
development of shale gas production be brought to maturity in synchronization with further growth in
gas-fired power generation? To what extent has the role of LNG changed from high-priced import to a
responsive force of global market discipline? Both of these topics are to be addressed in other expert
papers. The broader subject, how both public and private mechanisms might be developed to link
supply availability with demand growth in ways it has not been linked before, and how unanticipated
developments such as significant weather changes might be addressed to avoid damaging price
volatility, are excellent subjects for workshop discussion and further expert papers.
Page 46
45
V. Bibliography
American Clean Skies Foundation, “The Recognition of Natural Gas Abundance Continues to Grow”, a
publication portraying the North America Natural Gas Supply Assessment performed by Navigant
Consulting, Inc. July, 2008.
American Gas Foundation, “Natural Gas and Energy Price Volatility”, Study prepared for the Oak Ridge
National Laboratory – Energy and Environmental Analysis, INC., October 2003.
California Public Utilities Commission, “California Natural gas Infrastructure Outlook 2002 – 2006”,
November, 2001.
Chesapeake Energy, “Chesapeake Energy Q1 2010 Earnings Call Transcript”, May 5, 2010.
Colorado School of Mines, “Potential Gas Committee Reports Unprecedented Increase in Magnitude of
U.S. Natural Gas Resource Base”, Press release by Potential Gas Agency, June 18, 2009.
Conrad de Aenlle, “Is there Energy in Oil stocks?” The New York Times, April 24, 1993. Available online
at: http://www.nytimes.com/1993/04/24/your-money/24iht-mraa_2.html?pagewanted=print -
Department of Energy Organization Act in 1977, Pub .L. No 95-91, 91 Stat. 565, (1977).
Docket No. RM 83-71-000, Elimination of Variable Costs from Certain Natural Gas Pipeline Minimum
Commodity Bill Provisions, FERC Stat. & Reg. (CCH) 30,571 (1984).
Docket No. RP00-241, “Public Utilities Commission of the State of California v. El Paso Natural Gas
Company, El Paso Merchant Energy Gas, L.P., El Paso Merchant Energy Company”, FERC, 2002.
Docket No. RP00-241 and Docket No. RP00-338, FERC.
Docket No. RP00-338, El Paso Corp's request for modification to FERC official service list under, FERC
CP99-614 et al., Docket No. RP05-422-000, El Paso Natural Gas Company’s Pro-Forma Tariff Sheets,
Dec. 12, 2005.
Emergency Natural Gas Act of 1977, Pub. L. No. 95-2, 91 Stat. 4, (1977).
Energy Policy Act of 2005, Pub. L. No. 109-58, 100 Stat. 567.
Energy Practice, “NG Market Notes”, Navigant Consulting, Inc., Issue 52, April 2006.
EOG Resources, “EOG Resources Q1 2010 Earnings Call Transcript”, May 4, 2010:4 -5. Available online at:
http://seekingalpha.com/article/202833-eog-resources-q1-2010-earnings-call-transcript:
FERC, “Report on Natural Gas and Electricity Price Indices”, Dockets No. PL03-3-004 and No. AD03-7-
004, May 5, 2004.
Order No 436, Regulation of Natural Gas Pipelines After Partial Wellhead Decontrol FERC Stat. & Reg.
(CCH) 30,665 (1985), order on reh'g, Order 463-A FERC Stat. & Reg. (CCH) 30,675 (1985), order on
reh'g, Order 463-B FERC Stat. & Reg. (CCH) 30,688 (1986).
Order No. 636, Pipeline Services Obligations and Revisions to Regulations Governing Self-Implementing
Transportation; and Regulation of Natural Gas Pipelines After Partial Wellhead Decontrol, 57 Fed.
Reg. 13267 (April 16, 1992), 1992 FERC Statutes and Regulations (CCH) 30,939 (April 8, 1992); order
on reh'g, Order No. 636-A, 57 Fed. Reg. 36,128 (August 12, 1992), 1992 FERC Statutes and
Regulation (CCH) 30,950, order on reh'g, Order 636-B, 57 Fed. Reg. 57,911 (December 8, 1992), 61
FERC 61,272 (CCH) (November 27, 1992).
Interstate Oil and Gas Compact Commission, “Issues Briefing: Hydraulic Fracturing”, IOGCC,
http://www.iogcc.state.ok.us/hydraulic-fracturing.
Page 47
46
National Petroleum Council Committee on Natural Gas, “Balancing Natural Gas Policy: Fueling the
demands of a growing economy”, Study prepared for the U.S. Secretary of Energy by the National
Petroleum Council, September, 2003.
Natural Gas Policy Act of 1978, Pub. L. No. 95-621, 92 Stat. 3350 (1978).
Navigant Consulting, Inc, “North America Natural Gas Supply Assessment” Study prepared for American
Clean Skies Foundation, July 4, 2008.
Norris Thomas J., “Federal Regulatory Policy in Gas Has Evolved to Looser Controls” in Natural Gas
industry Analysis, ed. Robert E. Willet, 183, (Houston: Financial Communications Company, 2000).
Phillips Petroleum' Co. v. Wisconsin, 347 U.S. 672 (1954).
Pierce Richard, “Reconstituting the Natural Gas Industry from Wellhead to Burnertip”, Energy Law
Journal 9 no. 1 (1998).
Platts, “Gas Daily: Obama: Derivatives markets ‘operate in shadows’, April 23, 2010
Rich Wells, Vice-President Energy, The Dow Chemical Company, “Testimony on What’s Cooking with
Gas: the Role of Natural Gas in Energy Independence and Global Warming Solutions before the
Select Committee on Energy Independence and Global Warming”, July 30, 2008.
Roesser, Randy, “Natural Gas Price Volatility” – Joint Committee Workshop on Natural Gas Issues,
California Energy Commission.
Smead Richard, “Local Distribution Company Recovery of Gas Cost – Mechanics and Issues”, Navigant
Consulting, Inc, September 20, 2005.
Smead Richard, “Better Use of Gas Fired Generation Damps Volatility, Cuts Back CO2” Natural Gas and
Electricity 26 no. 10, May, 2010: 29-32, Wiley Periodicals Inc.
Staff Report, “Current State of and Issues Concerning Underground Natural Gas Storage”, Docket No.
AD04-11-000, FERC, 2004.
The Natural Gas Wellhead Decontrol Act of 1989, Pub. L. No. 101-60, 103 Stat. 157, (1989).
U.S. Energy Information Administration, Office of Oil and Gas, “An Analysis of Price Volatility in Natural
Gas Markets”, August-2007.
U.S. Energy Information Administration, “generation and gas-supply data for “.
Natural Gas Council, “Carbon Reduction Requires Natural Gas”, February 2008.
U.S. Energy Information Administration, “EIA Energy in Brief – What everyone should know about
energy: Is US natural gas production increasing?”, June 11, 2008.
U.S. Energy Information Administration, Underground Natural Gas Storage Capacity, EIA.
http://www.eia.doe.gov/dnav/ng/ng_stor_cap_dcu_nus_a.htm
U.S. Energy Information Administration, “Annual Energy Outlook 2010”. May 11, 2010: 72-73. Available
online at: http://www.eia.doe.gov/oiaf/aeo/index.html?featureclicked=1&.