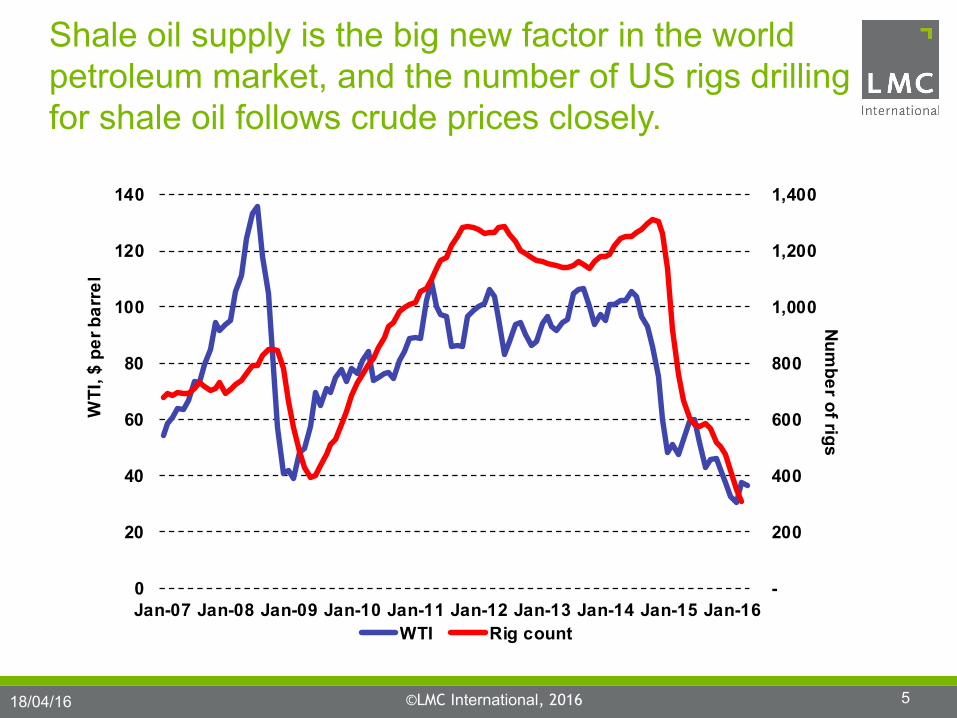
Since 2007, one must start one’s analysis of vegetable oil prices with a discussion of crude oil, and so I’ll do so.
Then one turns to palm oil, whose price is best understood in relation to crude oil. It is the only major oil that must be made as oil and cannot be stored as seeds. Mills have to empty their tanks every day, and so act as distress sellers, with the market balance visible in stock totals. CPO sales for fuel in competition with crude oil set the price floor.
Other oils’ prices are determined by their availabilities vs. palm oil. Thus, when sunflower oil is plentiful, it becomes competitive vs. CPO. At that point, price-sensitive markets like India buy the surplus supplies.
Today, I start with a review of the state of the petroleum market, explaining why crude supplies did not fall back in the way many predicted following months of low prices.
I will then turn to a discussion of the unusual behaviour of the CPO market. This has its roots in the arrival of the most severe El Niño since 1997, but also the introduction of Indonesia’s ingenious biodiesel mandate, which made producers pay for the subsidies in the (correct) expectation that, by taking CPO out of the market, they would lift prices by more than cost of the export levy to pay the subsidies.
I will end with some words about the other oils, which are going to be covered in detail by other speakers later.
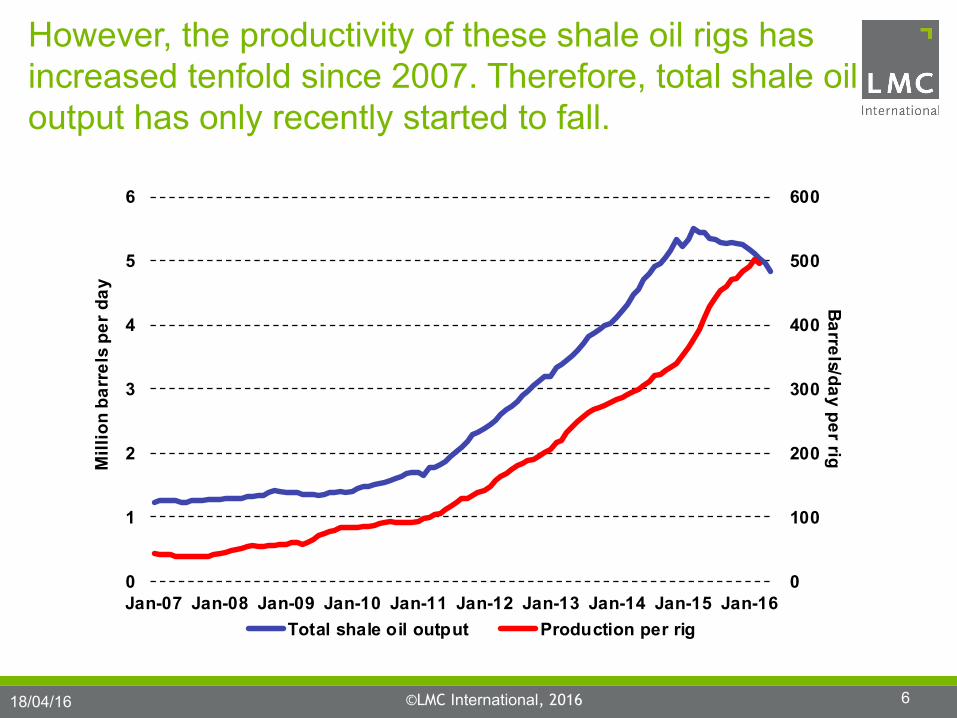
However, the productivity of these shale oil rigs has increased tenfold since 2007. Therefore, total shale oil output has only recently started to fall.
Shale oil has led US crude output growth, but its output is 380,000 bbl/day below its peak and other oil 170,000 bbl below its peak. Both peaks were 12 months ago.
Despite US cutbacks, world crude oil output in 2016 will remain ahead of demand, adding to surpluses in 2014 and 2015, with Iran ramping up its production.
The shale oil revolution is helping to keep world crude oil stocks at record high levels
Global stocks of crude oil will rise until late 2017.
We now know that shale oil technology has advanced rapidly. Also, bankrupt shale companies and high cost traditional fields are being kept afloat by banks, as long as they make a small cash margin.
OPEC producers, too, need cash too badly to cut back. On the contrary, many are raising output. This means that we cannot expect any sharp recovery in the Brent crude price during 2016. Once prices reach a point where shale oil producers can lock in positive margins, they are likely to do so after their recent shocks. (By the way, yesterday, 12 month WTI futures were $5/bbl above the 1st position.)
This reveals the EU price band for vegetable oils with Brent acting as the floor. Palm oil leads the other oils, touching Brent’s price when palm stocks are high.
Here you see the four occasions since 2008 when EU palm oil touched Brent prices. (Remember when this occurs, CPO is cheaper than crude oil in S.E. Asia.)
Plotting daily EU and Indonesian CPO premia over Brent, until end-August it looked as if in Indonesia it was becoming negative,…. but something changed.
CPO was competitive as a fuel in Indonesia in Sept 2012, 2013 and 2014. 2015 was different.
In 2015, it looked as though Indonesian CPO was about to become cheaper than crude oil at the end of August, when suddenly the local price moved up.
There were two reasons for this rapid about-turn.
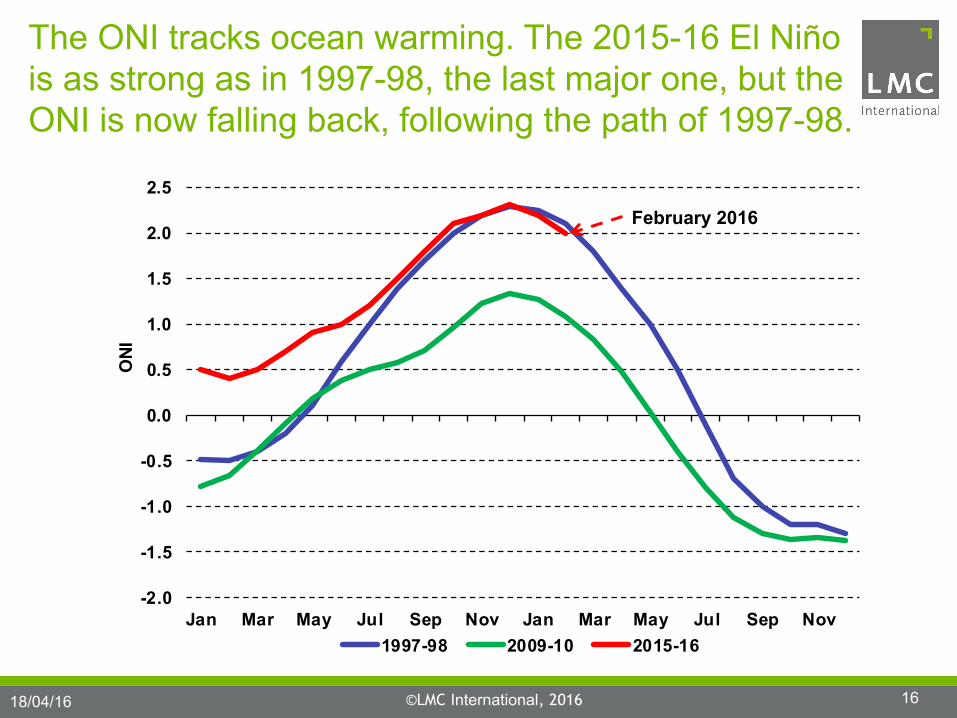
1. One, which took time to take effect, was the belief that a serious El Niño was affecting production.
2. The more immediate one was the first solid evidence that the CPO Fund in Indonesia was subsidising biodiesel. At the end of August, local biodiesel producers started to buy both stearin and CPO to meet orders from Pertamina.
The ONI tracks ocean warming. The 2015-16 El Niño is as strong as in 1997-98, the last major one, but the ONI is now falling back, following the path of 1997-98.
-2.0
-1.5
-1.0
-0.5
0.0
0.5
1.0
1.5
2.0
2.5
Jan Mar May Jul Sep Nov Jan Mar May Jul Sep Nov
ONI
1997-98 2009-10 2015-16
February 2016
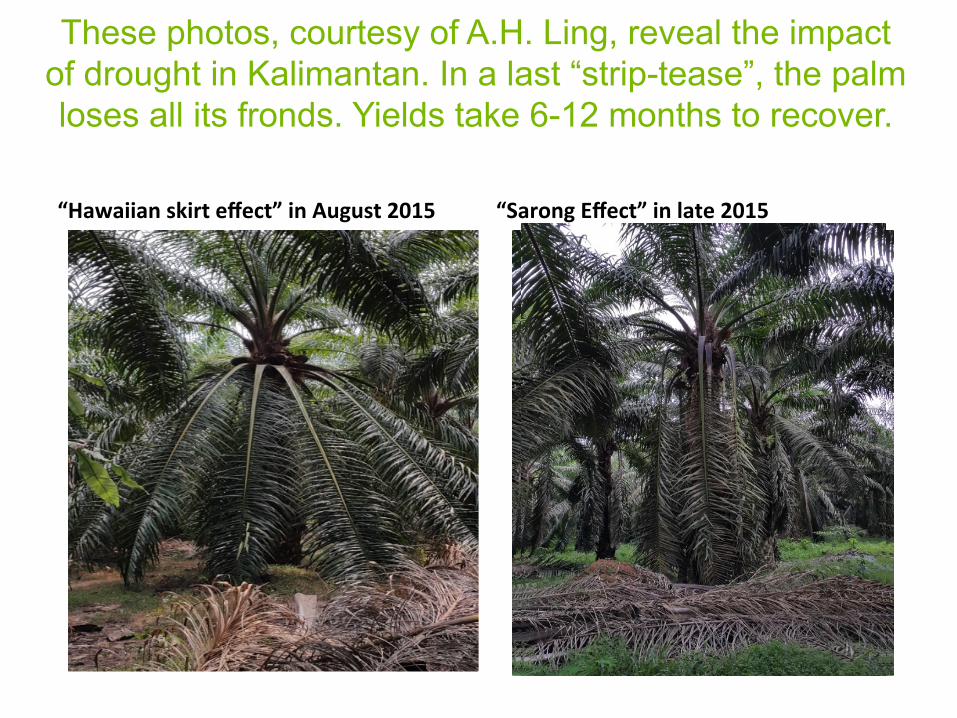
These photos, courtesy of A.H. Ling, reveal the impact of drought in Kalimantan. In a last “strip-tease”, the palm loses all its fronds. Yields take 6-12 months to recover.
This shows the massive male inflorescence cycle this February in Central, East and South Kalimantan, with over 6 months before the next bunches will appear.
Photo: courtesy of A.H. Ling, Ganling, Sandakan, Sabah, 2016
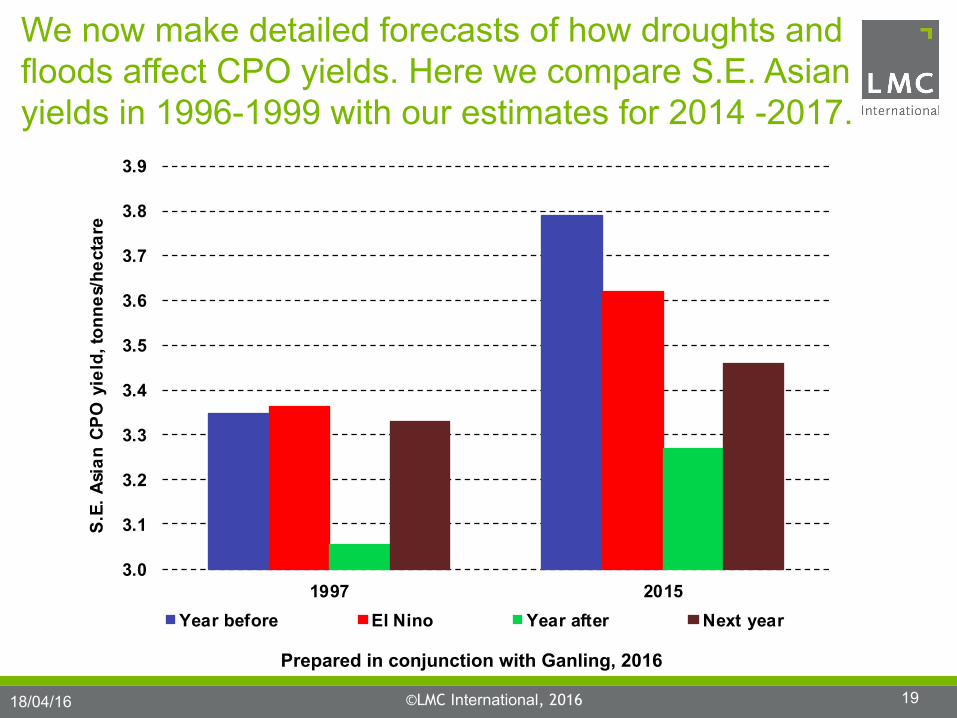
We now make detailed forecasts of how droughts and floods affect CPO yields. Here we compare S.E. Asian yields in 1996-1999 with our estimates for 2014 -2017.
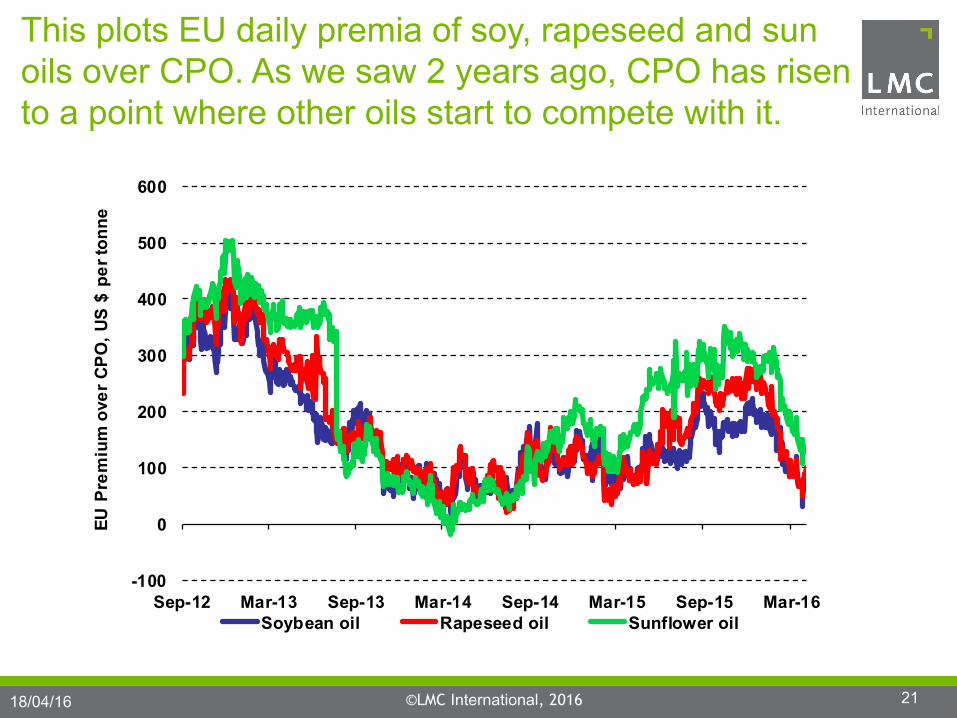
This plots EU daily premia of soy, rapeseed and sun oils over CPO. As we saw 2 years ago, CPO has risen to a point where other oils start to compete with it.
The role of the other oils in filling the shortfall in supply left by the drop in world palm oil output
Total 2016 CPO output is four million tonnes less than would be expected without El Niño; while Indonesia, with its new mandate, is using over a million tonnes more than last year.
Elsewhere, the market has reacted by cutting biodiesel use, switching some demand to other oils, and supply has been lifted by China running down its oils and oilseeds reserves.
The Indonesian Fund is, in fact, part of the response as the biodiesel tonnage it can subsidise falls as the CPO premium over diesel rises, as the Fund has fixed financial resources.
We are at an interesting time; CPO output is rising month on month, even if it is below levels this time last year. I think we are getting close to the price peak, unless crude prices jump
This presentation and its contents are to be held confidential by the client, and are not to be disclosed, in whole or in part, in any manner, to a third party without the prior written consent of LMC International.
While LMC has endeavoured to ensure the accuracy of the data, estimates and forecasts contained in this presentation, any decisions based on them (including those involving investment and planning) are at the client’s own risk.
LMC International can accept no liability regarding information analysis and forecasts contained in this presentation.