DRAFT1.0 Price Spikes in Wholesale Electricity Markets: An Update on Problems and Policies John Kwoka Northeastern University Prepared for Conference on Pressing Issues in World Energy Policy University of Florida Gainesville FL March 2012 Gratitude is expressed to Chengyan Gu for very helpful research assistance, and to Machiel Mulder and Sanem Sergici for suggestions and information.
Transcript
DRAFT1.0
Price Spikes in Wholesale Electricity Markets:An Update on Problems and Policies
John KwokaNortheastern University
Prepared forConference on Pressing Issues in World Energy Policy
University of FloridaGainesville FL
March 2012
Gratitude is expressed to Chengyan Gu for very helpful research assistance, and to MachielMulder and Sanem Sergici for suggestions and information.
1 “AER Publishes Report on Electricity Price Spikes,” Australian Energy Regulator, July2007. Also, “Price Spikes in the Nordic Electricity Market Will Be Analyzed by NordREG,”NordREG, 2010; “Suppressing the Electricity Price Spikes,” Energy Phillippines, August 2008. NY ISO and PJM data from their website.
1
1. Introduction
Deregulation of wholesale electricity markets in the U.S. and other countries has resulted
in some expected and beneficial outcomes, but also several outcomes that have been neither.
Prominent among the latter have been price spikes–periodic rapid price increases, often to levels
representing one or two orders of magnitude above typical levels, followed by abrupt price
collapses. In the New York ISO in 2001, for example, wholesale price varied in the narrow
range between $40 and $50 per mwh until August, when on three consecutive days it reached
$194, $917, and $180 per mwh. More recently PJM reported two episodes in 2006 when price
exceeded $700 per mwh, while in Australia there were more than 40 instances of prices in excess
of AUS$5000 (approx. US$4000) per mwh in June 2007 alone. Regulators in the Phillippines,
the Nordic countries, and elsewhere continue to report price spikes on a regular basis.1
Spikes have, of course, been the cause of much concern due to their disruptive
consequences and the difficulties in bringing about effective control. It is therefore of
considerable interest and importance that the frequency of price spikes in some markets appears
to have diminished. PJM has had no repetition of $700 prices and fewer instances of above-$400
prices over the past six years. Price spikes in the Netherlands in recent years also seem to occur
with lesser frequency. On the other hand, some countries continue to experience price spikes
with undiminished frequency.
This paper provides an update and analysis of these divergent experiences, with
2 A prominent alternative approach is represented by mean-reverting and jump-diffusionmodels from the stochastic process literature. See, for example, Deng (2000), and for a review,Higgs and Worthington (2005)
3 This section draws on Kwoka and Sabodash (2011).
2
particular attention to policy measures directed at controlling price spikes. We begin in next
section with a brief summary of the relevant theories of price spikes, focusing on the difference
between those that are demand-induced vs. those that are supply-induced. Based on this theory,
Section 3 then discusses a variety of methods that have been used or considered for identifying
and controlling competitively problematic price spikes, focusing on measures employed in the
U.S. Section 4 turns to experience with price spikes in different wholesale electricity markets,
examining the UK, the Netherlands, and Australia for divergent approaches. The final section
draws inferences from and offers recommendations based on these experiences.
2. The Theory of Price Spikes
Price spikes have been examined using diverse analytical frameworks. Two approaches
are outlined in this section, one based on micro theory and the other essentially an auction
market approach.2 We discuss these in turn.
2.1 Microtheoretic Approach
The standard micro theory of price spikes derives from a simple market model adapted to
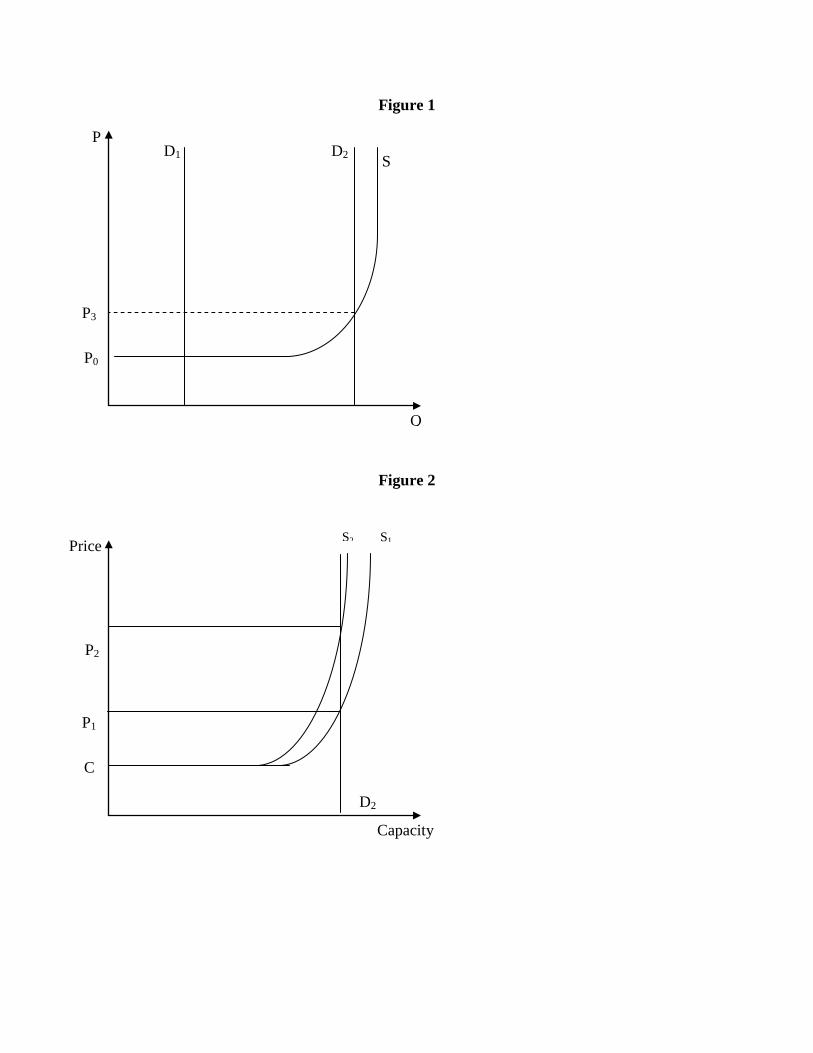
the distinctive features of wholesale electricity markets.3 The fundamentals are illustrated in
Figure 1. There S denotes a supply curve of electricity offers to the wholesale market and D is
the vertical demand curve. Supply is essentially horizontal at marginal fuel costs up to (or near)
capacity, at which point incremental supply is unattainable and S becomes vertical. Demand D
4 This observation has suggested the value of a regime-switching approach that utilizespreconditions for price spikes to determine periods of time when they are a threat. See, forexample, Mount, et al (2006).
3
is essentially vertical, both because final customer demands are very inelastic but more
specifically because the ISO typically establishes its requirements as a datum.
When demand intersects the offer curve in its horizontal segment (e.g., D1), market price
is at marginal cost and price spikes, at least in theory, are not a danger. But when demand
presses on capacity–as on hot summer days that exhaust available capacity--a different regime
applies.4 Thus at D2, price may be some multiple of marginal cost, reflecting scarcity rather than
explicit cost, and when demand recedes, price falls precipitously back to its original level.
An analogous phenomenon can occur if a generator that constitutes a significant portion
of overall supply suddenly goes offline. Such an event would be described by a leftward shift of
the offer curve, as, for example, the move from S1 to S2 in Figure 2. Once again, if this were to
occur at offpeak demand D1, price would not be affected since remaining capacity would be
more than adequate. If demand were already close to exhausting capacity e.g., at D2, the supply
shift due to the outage would again result in a spike in price.
One important observation about these scenarios is that, while price may spike, it is still
being determined by underlying demand and supply forces. The high price reflects scarcity, not
monopoly, cartel, or strategic behavior. The rents generated during periods of such high prices
in principle serve as a signal of the need for additional capacity. Theory predicts that sufficient
rents–a high enough price for enough periods–should trigger new capacity additions, although in
practice a number of factors are likely to impede that response.
A different scenario may apply if any single generator is large enough so that, by
4
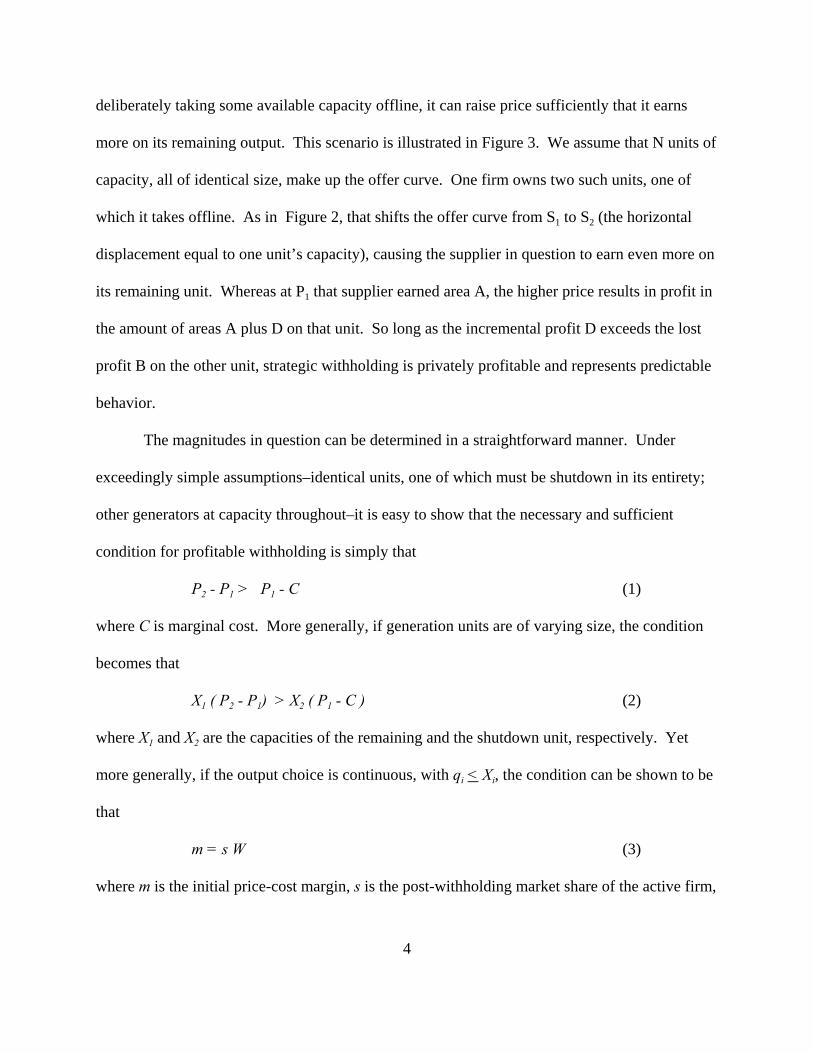
deliberately taking some available capacity offline, it can raise price sufficiently that it earns
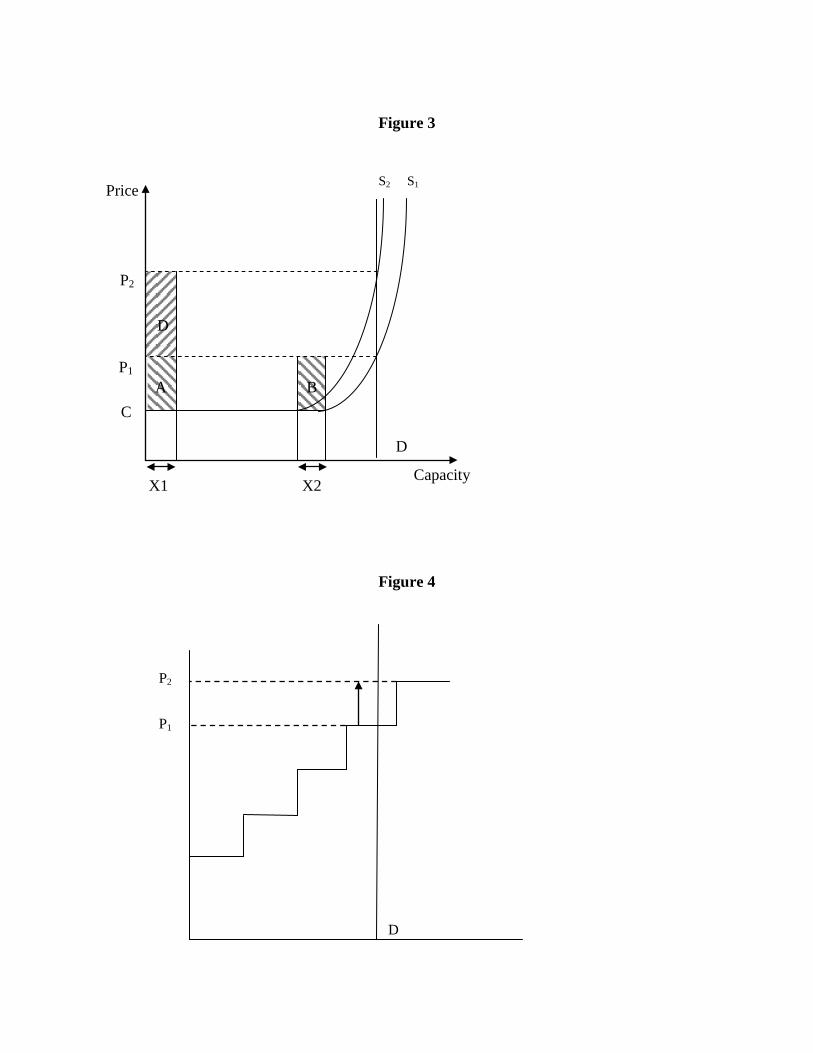
more on its remaining output. This scenario is illustrated in Figure 3. We assume that N units of
capacity, all of identical size, make up the offer curve. One firm owns two such units, one of
which it takes offline. As in Figure 2, that shifts the offer curve from S1 to S2 (the horizontal
displacement equal to one unit’s capacity), causing the supplier in question to earn even more on
its remaining unit. Whereas at P1 that supplier earned area A, the higher price results in profit in
the amount of areas A plus D on that unit. So long as the incremental profit D exceeds the lost
profit B on the other unit, strategic withholding is privately profitable and represents predictable
behavior.
The magnitudes in question can be determined in a straightforward manner. Under
exceedingly simple assumptions–identical units, one of which must be shutdown in its entirety;
other generators at capacity throughout–it is easy to show that the necessary and sufficient
condition for profitable withholding is simply that
P2 - P1 > P1 - C (1)
where C is marginal cost. More generally, if generation units are of varying size, the condition
becomes that
X1 ( P2 - P1) > X2 ( P1 - C ) (2)
where X1 and X2 are the capacities of the remaining and the shutdown unit, respectively. Yet
more generally, if the output choice is continuous, with qi < Xi, the condition can be shown to be
that
m = s W (3)
where m is the initial price-cost margin, s is the post-withholding market share of the active firm,
5
and W is the elasticity of price with respect to withheld output.
Simple numerical examples demonstrate that these conditions can be met under plausible
circumstances by a single generator with a relatively small market share (Kwoka and Sabodash,
op. cit.), underscoring the pervasive nature of this concern.
2.2 Auction Markets
While a microeconomic approach is straightforward and insightful, wholesale electricity
markets are in fact auction markets, with possibly different equilibrium properties. More
specifically, these markets are uniform-price procurement auctions where suppliers place offer
bids with the ISO, and the ISO accepts enough bids to meet expected (and exogenously
determined) demand. The offer price of the marginal accepted unit becomes the common price.
The bidding behavior of that marginal unit is therefore crucial to price determination, and that
behavior in turn depends on the information available to the bidder. Throughout, the bidder
must trade-off the probability of its being selected (higher for lower price) and the return it
expects (higher for higher price). We examine three cases.
First, suppose that the bidder has no information about other bidders’ costs, but knows
only the total number of bidders N. Bidder i can simply bid its own cost Ci but that yields zero
profit. Instead, it is readily shown that the bidder maximizes its expected return by bidding
Pi = Ci ( 1 + 1/N) (4)
that is, some amount above unit cost based on the number of other bidders. At the other extreme,
bidder i might have complete information about the costs of the other N bidders, in which case
bidder i can determine which other bidder j will be marginal in the market. The optimal bidding
strategy for all bidders now is simply to price just below the cost of the next higher-cost bidder,
5 See, inter alia, Ausubel and Cramton (2002).
6 The special features of multi-unit auctions were emphasized by von der Fehr andHarbord.
6
thus:
Pi = Cj - ε (5)
Finally, where the distribution of bidders’ costs is known, but which of them will be marginal is
not, uncertainty about the identity of the marginal bidder causes a further trade-off between
profit and probability: Now a bidder i maximizes its expected profit in an auction with N bidders
by bidding the following price:
Pi = Cj ( 1 - 1/N) (6)
where Cj is the cost of the next highest-cost bidder. This is below the next higher-cost bidder by
an amount reflecting the probability of being marginal.
Additional features of such markets can further complicate matters. A supplier’s
incentive to price more aggressively is stronger yet in the case of a bidder with multiple units to
offer.5 Such a bidder has more to gain on inframarginal units, and thus would strive yet harder to
have the marginal, price-determining (and price-elevating) unit. To increase that likelihood,
that bidder may raise price on more than one later unit. In the further case where the seller not
only has multiple units but also submits an offer schedule consisting of its choices of both prices
and the associated quantities, the bidder’s behavior is again different. As before, it would want
to be the marginal bidder, but now it wishes this to be case only for the smallest necessary
quantity-block.6 That would ensure the maximum inframarginal output on which excess profits
could be earned. Moreover, as von der Fehr and Harbord (1993) and Fabra et al (2006) show,
7
when more than one bidder might be marginal, no pure-strategy equilibrium exists for a wide
range of demand distributions.
3. Withholding and Price Spikes
The price spikes described above fall into two categories–those resulting from ordinary
supply-demand interactions, and those resulting from strategic withholding. While the former
may be disruptive, especially if frequent and large, they do not raise the same kind of policy
issues as do the latter. Strategic withholding represents the exercise of market power, that is,
deliberate output contraction so as to raise price and profit, but creating consumer harm and
deadweight loss. Unlike some other types of market power, strategic withholding does not
involve cartel behavior or tacit cooperation by other sellers, much less abusive conduct toward
rivals. Rather, it is simply a unilateral output reduction by single seller whose actions by
themselves, under the right circumstances, can raise price and profit. This section addresses two
closely related issues–first, identifying competitively problematic price spikes and the conditions
conducive to them, and second, developing various possible methods for controlling price
spikes.
3.1 Identification of Problematic Price Spikes
There have basically been two approaches to distinguishing competitively problematic
price spikes from ordinary price increases. These may be labeled ex ante structural and ex post
behavioral. We discuss each in turn.
3.1.1 Ex Ante Structural Measures
As is now well understood, conventional measures of market power do not capture the
7 See, for example, Wolfram (1998); Crawford, et al (2007); and Hortacsu and Puller(...). These studies estimate some mean level of price or markup, from which they infer marketpower. But to the extent that market power is episodic–alternating periods of little or none, withother periods representing spikes–the mean level of market power does not capture an importantfeature of the market. For a discussion of the limited usefulness of concentration measures inelectricity markets, see Borenstein, et al (1999).
8 This condition is not without some ambiguity if supply consists in part of must-runtechnology such as nuclear. Arguably, it is remaining–discretionary–supply against which asingle supplier’s capacity should be measured.
8
phenomenon or likelihood of price spikes. Measures such as the HHI or traditional
concentration ratios address the potential for coordinated behavior and have been used to assess
the strength of competition and resulting performance in electricity markets by many authors.7
The price spikes analyzed above, however, are not the result of coordination but rather represent
unilateral conduct by a single firm. A more relevant measure would therefore seem to be the
market share of the largest supplier to the market. When that supplier’s share is sufficiently
large, it is capable by itself of reducing aggregate supply to the point of creating a price spike.
From this latter observation comes the concept of a pivotal supplier, that is, a supplier
without which total market demand cannot be satisfied. A supplier i is determined to be pivotal
if the following condition is met:
Ki > Q - K-i (5)
where Ki and K-i are the firm’s capacity and all remaining capacity in the market, respectively,
and Q is total market demand.8 If this condition is satisfied, then all other producers cannot meet
market demand and firm i is pivotal–that is, it could unilaterally cause price to spike.
Identification of pivotal supply is now embedded in FERC and RTO orders and procedures for
detecting market power. Somewhat more generally, if there is concern that two or more
9 PJM and CAISO now employ a three-firm version of the pivotal supplier test. For amore general analysis, see Perekhodtsev et al (2002).
10 Again, there are important details in implementing this concept. Capacity includesimports. The firm’s capacity excludes amounts contractually obligated.
11 Mount et al (2006) have used a regime-switching approach to show that price spikesoccur more often when reserve margins are less than about 20 percent. While cruder than pivotalsupply or the RSI, low reserve margins capture a similar phenomenon.
9
suppliers might jointly coordinate withholding, then the pivotal supplier concept can be extended
to incorporate two or more suppliers that collectively are necessary to satisfy market demand.9
A related measure of the possibly pivotal nature of supply is the so-called residual supply
index, defined as follows for firm i:
RSIi = (K - Ki)/Q
where again Ki is the firm’s capacity and Q is total market demand, while K measures total
capacity in the market.10 RSI therefore measures the fraction of demand that must be met by the
firm in question. An RSI less than 1 signifies a supplier whose output might be necessary to
meet total demand. If that firm is the only supplier with RSI > 1, then it is pivotal. Thus, RSI
can be viewed as a more comprehensive, and continuous, version of the concept of pivotal
supply in a market.11
This discussion suggests that one ex ante structural response to the problem of strategic
withholding would be simply break up any generation firm that is pivotal. Break-up–that is, the
spinning off of sufficient assets to eliminate market power–is standard practice in antitrust cases
where mergers otherwise would create such market power. Here the process of capacity
accretion to the point of possessing pivotal power is fundamentally similar, and could be subject
to similar remedies.
10
3.1.2 Ex Post Behavioral Approaches
The alternative approach to identifying problematic price spikes is to investigate episodes
of price spikes after the fact and determine whether they were the result of deliberate reductions
in capacity under conditions that would precipitate large price increases. This approach has the
advantage of examining actual experience rather than relying on the imperfect predictive power
of structural measures. An obvious disadvantage is that by itself ex post analysis does not
prevent the occurrence of the spike. Moreover, establishing whether a price spike is due to
withholding proves to be a difficult matter even after the fact. Causation in this areas is often
ambiguous since the conditions for strategic withholding and those for simple price increases are
broadly the same, namely, shortness of supply relative to demand. Hence, the distinction
between the two must ultimately appeal to other characteristics.
An early and important effort at ex post determination arose in the wake of the California
electricity market meltdown of 2001. Joskow and Kahn (2002), among others, identified what
they termed an “output gap”–the difference between generators’ profitable production capacity
and that which they in fact utilized. Finding such a year-over-year gap, Joskow and Kahn
concluded this likely represented strategically withheld capacity, which was in turn responsible
for wholesale prices in California periodically reaching the cap of $10,000 per mwh.
A study of the New England wholesale electricity market during the same period of time
similarly found unusually large capacity outages among generators serving that region during
most of the time intervals in 1999 when prices exceeded $100 per mwh (Synapse, 2001). A
more statistically based investigation was conducted by Kwoka and Sabodash (2011). That
study explicitly tested whether generator offer curves to the New York ISO shifted leftward in
11
periods of strong demand, a phenomenon that would be inconsistent with competitive behavior.
Focusing on the summer months of 2001 eliminated explanations for capacity reductions, such
as outages for maintenance. Their test of test parameters showed that indeed the offer curve
shifted inward in hours when forecast demand and resulting prices were high, as would be
expected from strategic behavior.
3.2 Controlling Problematic Price Spikes
Neither ex ante structural measures nor ex post behavioral determinations suffice for the
control of price spikes, albeit for different reasons. Structural measures are decidedly imperfect
predictors, and ex post determinations are neither unambiguous nor, by themselves, deterrents.
Consequently, a range of alternative approaches have been tried in various jurisdictions and
countries. Here we review four approaches.
3.2.1 Direct Price Controls
Perhaps the most obvious approach is simply to cap wholesale electricity prices, and
indeed, several countries do in fact cap such prices. Often these caps are at extremely high
levels, e.g., $10,000 per mwh, presumably to ensure the constraint binds only for prices that are
certain to represent strategic behavior rather than ordinary supply-demand forces. But such
extraordinarily high price caps fail to prevent more numerous instances of smaller price
increases that are nonetheless profitable exercises of market power by generators. Another
concern that has been expressed with the simple capping of prices is the possibility that doing so
may truncate the distribution of price outcomes on the high side, thereby distorting price signals
and investment incentives in this market (Stoft, 2000).
This latter concern almost certainly exaggerates the problem, since price spikes due to
12 For discussion of the efficiency and price consequences of uniform vs. discriminatoryauctions, see Fabra et al (2006)
13 Kwoka (2008) discusses the entry and investment deterring effects of uncertainty inthese markets.
14 Put differently, a firm which faces no risk or penalty from raising price will surely doso. The same incentive is the foundation for the theory of price cycles developed by Maskin andTirole (1988): a firm in Bertrand equilibrium has nothing to lose by suddenly and unilaterallyincreasing price, though predictably that firm’s rivals will raise price to a level just below theleaders, thereby creating a cycle.
12
strategic withholding do not represent informative signals about the need for capacity changes.
Rather, they represent transient episodes of rent transfers from ISOs and their consumers to
producers and generators. And these rent transfers may be of enormous magnitude, given the
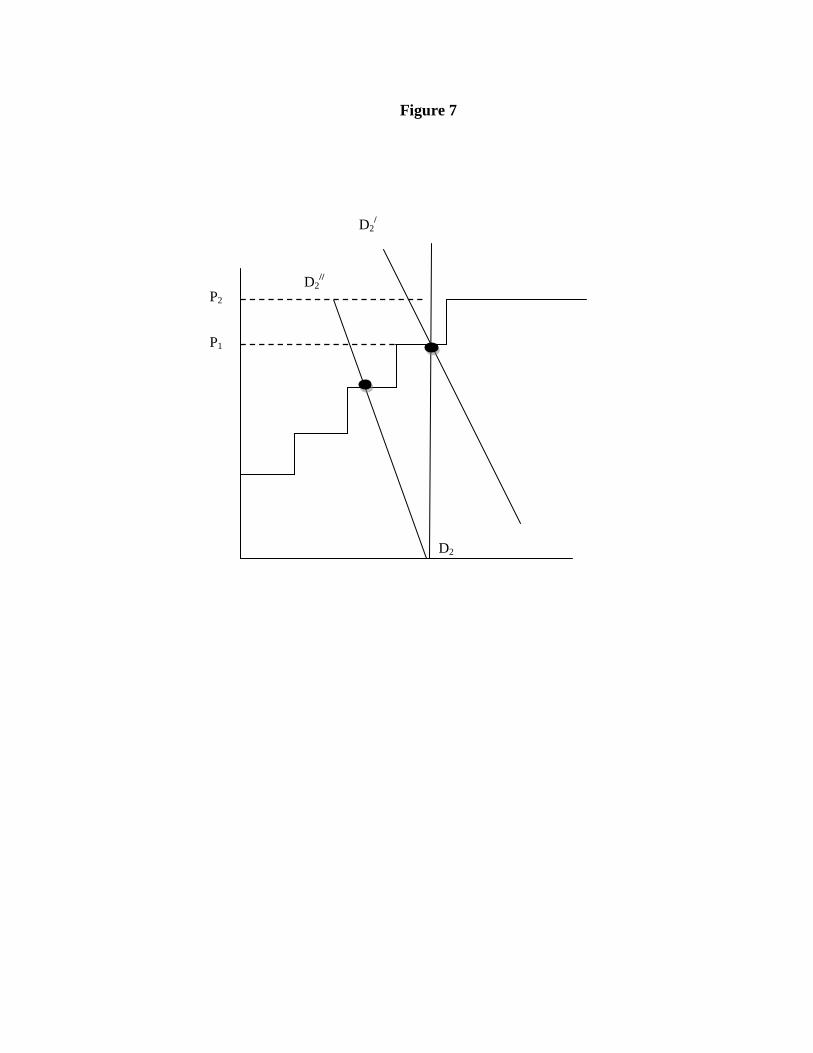
shape of the overall cost and offer curves in these markets. Figure 5 illustrates the rent
consequences of price spike behavior in a uniform price auction market, with the shaded area
representing the rents accruing to inframarginal supply.12 While ordinarily rent transfers might
stimulate entry in the same manner as ordinary profit, the infrequent and uncertain nature of
price spike episodes are deterrents to entry by new producers.13
3.2.2 Supply-Side Approaches
Another approach to the problem of strategic withholding focuses on the incentive of a
generator to take capacity offline. That incentive, of course, follows from the fact that under
tight-supply circumstances the generator knows that it will be called upon to produce essentially
regardless of price.14 Thus, it follows that the firm’s incentive to engage in this behavior can be
blunted to the degree that some uncertainty can be instilled as to whether it will in fact be called
upon. One method of creating such uncertainty is for the ISO to build or contract for available
back-up capacity in the amount necessary to render that supplier non-pivotal. Then, if that
15 For estimates of the cost of generating capacity, see Kwoka (2008) and morespecifically, for the costs of holding capacity in reserve, see Blumsack and Lave (2002). Clearly, improving transmission capacity serving a particular market would have similar effects.
13
supplier were to initiate withholding, this threat capacity could be brought online and the attempt
to trigger a price spike would be defeated.
Clearly, for such a threat to be credible, it would have to be available, that is, otherwise
unused or used only on an interruptible basis. If unused, it would manifestly be expensive,
equivalent to simply building a plant and leaving it idle.15 If available on an interruptible basis,
that would moderate the costs but possibly compromise the need for the capacity to be available.
It is perhaps for these reasons that this approach does not seem to have been pursued for any
electricity market.
3.2.3 Demand-Side Approaches
Since the magnitude of the market power possessed by a pivotal supplier derives from the
inelasticity of demand, another type of policy might seek to increase that elasticity. One small
measure would be to ensure that wholesale market demand at least reflected the modest degree
of elasticity of retail customers’ demand, rather than the zero-elasticity configuration of most
ISO auction markets. Beyond that, there have been a growing number of efforts to increase
demand responsiveness both for reasons of market power and also reflecting environmental and
conservation concerns.
FERC Order 719, issued in 2008, provides that retail customer aggregators must be
allowed to submit demand bids directly to the ISO, a process that results in day-ahead load that
is priced according to users rather than against a fixed forecast load. This initiative was directed
primarily at CAISO and MISO, the two RTOs that did not already have such provisions. It
16 Rassenti et al (2003) provides experimental evidence of the effectiveness of demand-side bidding in controlling price spikes.
14
would impart greater elasticity to the demand component of wholesale auction markets, increase
the probability that excessively high-priced capacity might not be dispatched, and thereby further
blunt the incentive for generators to withhold capacity.16
Beyond that, environmental objectives have spawned an array of “smart grid” and other
techniques by which customers can adjust usage to take greater advantage of availability of
electricity at certain times. These will have the corollary and beneficial effect of increasing
demand elasticity, especially at certain times. PJM, for example, reports that a combination of
emergency demand response and economic demand response–basically, administered load
reductions plus reductions due to pricing–is increasingly serving to reduce loads at peak intervals
below otherwise-predicted levels (PJM, 2011).
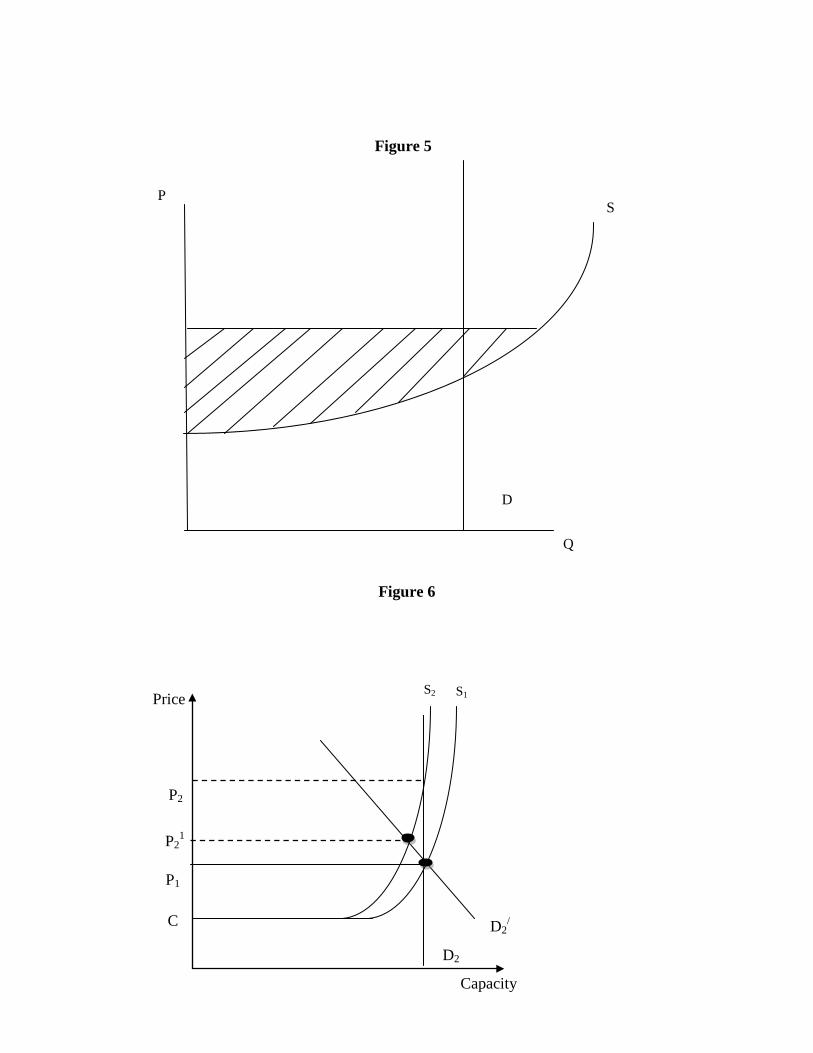
Demand-side measures can reduce pivotal market power and thereby the incidence and
magnitude of price spikes. Thus, in Figure 6 the price effect of strategic withholding of a unit of
capacity is less when demand is more elastic, as shown by the difference between D1 and D2. A
useful caution about this effect, however, should be noted in the case of the marginal (i.e.,
pivotal) supplier in the auction model. As shown in Figure 7, so long as demand response does
not affect which unit is pivotal, the effect may be quite limited.
3.2.4 Administrative Controls
The effort to ensure that all suppliers, and especially pivotal suppliers, declare profitable
capacity to the market has been addressed in some jurisdictions through administrative controls.
Such controls–sometimes called “conduct and impact” controls--were put in place ISOs and
17 For a summary of provisions in other RTOs, see Brattle Group (2007)
18 The third concern is so-called “uneconomic production,” essentially excess productiondesigned to causes a transmission constraint. We will not discuss this issue here.
15
RTOs in the U.S. in the wake of the California price experience of 2000-01, when strategic
withholding was widely suspected and ultimately confirmed. Some form of administrative
control, supplemented by market monitoring, is now common in all RTOs.
Under administrative controls, bids are compared to reference levels intended to replicate
competitive bids. Those bids that diverge from reference levels by more than a specified amount
and thereby affect market price may be replaced with the reference price. Complementing these
measures are measures designed to identify strategic withholding on an ex ante basis. Versions
of these are present in three RTOs–New York, New England, and the Midwest ISO.17 The
nature of these can be illustrated by closer examination of New York ISO’s tariff. That tariff
identifies the concern as “conduct that is significantly inconsistent with competitive conduct,”
explaining further that this is conduct that “would not be in the interest of the Market Party in the
absence of market power.” It enumerate three specific concerns, two of which are relevant
here:18
(1) Physical withholding of an Electric Facility, that is, not offering to sell or schedulethe output of...an Electric Facility capable of serving an ISO Administered Market. Suchwithholding may include, but not be limited to, (i) falsely declaring that an Electric Facility hasbeen forced out of service..., (ii) refusing to offer bids or schedules..., or marking (sic) anunjustifiable change to one or more operating parameters of a Generator that reduces its abilityto provide Energy or Ancillary Services..., or (iii) operating a Generator in real-time to producean output level that is less than the ISO’s dispatch instruction...
(2) Economic withholding..., that is, submitting bids for an Electric Facility that areunjustifiable high so that (I) the Electric Facility is not or will not be dispatched or scheduled, or(ii) the bids will set a market clearing price.
Physical withholding can be viewed as an extreme form of economic withholding, with
19 Wolak (2003) likens a generator’s claim that an outage is forced to an employee callingin sick and taking a sick day. The employer cannot readily determine the veracity of theworker’s claim. At the time of the California meltdown, stories circulated about ISO inspectorsshowing up at the gates of a withdrawn generator for this very purpose, and being turned away.
16
the offer price above the choke price for market demand, so that it effectively is not offered at
all.. These stated concerns are followed by a lengthy and detailed discourse on the criteria
defining such behavior. For physical withholding, these include the following:
•“withholding that exceeds the lower of 10 percent or 100 MW of a Generator’scapability, or the lower of 5 percent or 200 MW of a bidding entities total capability”
• operation “at an output level that is less than 90 percent of the ISO’s dispatch level forthe Generator”
The criteria for identifying economic withholding are divided into those applicable to an
unconstrained area and a constrained area. For the former, the criteria are as follows:
•Energy bids constituting “a 300 percent increase or an increase of $100 per Mwh,whichever is lower...”
•Start-up cost bids that increase by 200 percent
In the case of a constrained area–basically, New York City--more stringent criteria are
invoked. Among them are the following:
•Energy bids where, for intervals in which an interface...has a shadow price greater thanzero, the lower of the thresholds specified for areas that are not Constrained Areas or athreshold in accordance with the following formula:
The intent of such detailed rules is to determine whether a specific generator outage is
strategic or not. Non-strategic outages do occur, of course, as a result of planned maintenance or
for unexpected reasons out of the control of the generator itself.19 While the actual reason for
17
any particular outage is known with complete certainty only to the generator, the use of these
detailed administrative controls in RTOs has been linked to the apparent reduction in the
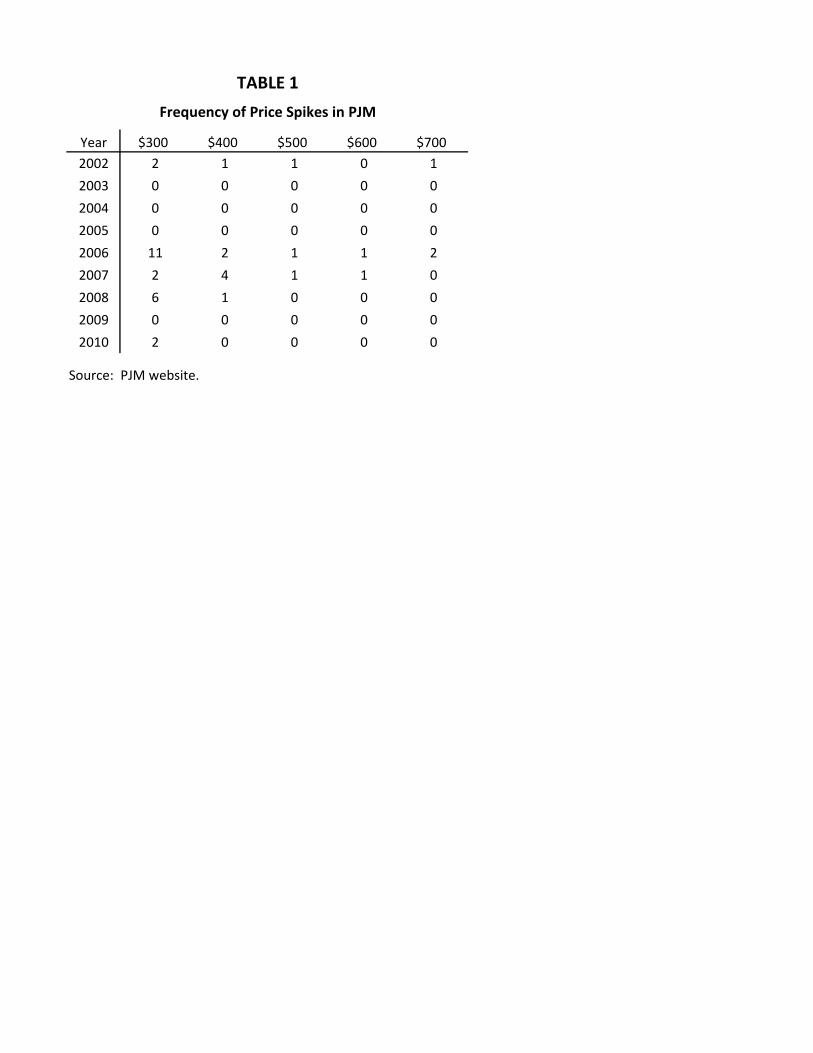
incidence of price spikes in U.S. electricity markets. Table 1, for example, reports the incidence
of excessive prices in PJM over the past decade. While the small sample makes inferences
problematic, it seems possible that at least over the past five years the frequency of price spikes
has diminished. If such is the case (as Bushnell et al, and others suggest), that would represent a
considerable achievement in preventing the exercise of market power and the disruptive pricing
episodes that had been common occurrences in the early years of these markets.
In the next section we shall compare this country’s experience with that of others that
have adopted different approaches, or none at all.
4. International Experience with Control of Price Spikes
Most wholesale electricity markets are subject to price spikes for the simple reason that
the preconditions for price spike episodes are periodically met and the incentives for generators
to engage in withholding are straightforward. The precondition that demand presses on capacity
is a circumstance that must occur on occasion in these markets unless there is persistent
redundant capacity–itself an inefficient condition. The incentives follow from the ordinary profit
opportunity from output reduction, made even more attractive by virtue of the fact that it does
not require collusion or merger.
Most countries undergoing electricity market reform have therefore had to contend with
price spikes, but in fact they have dealt with them in quite different ways. This section recounts
experiences in the UK, the Netherlands, and Australia. The U.S. example has largely been
20 See, for example, Newbery (1995)
21 Patrick and Wolak (2001).
22 Ofgem (2000).
18
covered through illustrations of policies and outcomes in the preceding section.
4.1 Price Spikes in the UK
As the first country to systematically deregulate its electricity market, the United
Kingdom was also the first to encounter the problem of market power. Much early attention was
focused on price elevation due to coordination by small numbers of generation companies,20
although some observers contended that withholding–either unilateral or joint by the two leading
companies–also posed a substantial concern.21 Recognizing these concerns, the British regulator
Ofgem sought to deconcentrate the generation sector during the 1990s, but with little effect on
wholesale prices.
After further consideration of the problem of market power in general and unilateral
withholding in particular, Ofgem in 2000 concluded as follows:22
Neither...can the potential abuse of substantial market power be adequately regulatedunder general competition legislation...nor financial servcies legislation. This is becauseof the particular physical and economic conditions associated with electricity wholesalemarkets and electricity networks.
Accordingly, as part of the New Electricity Trading Agreement, Ofgem sought to have all
“significant” generators sign a “market abuse licence condition” (MALC) that would subject
signatory firms to fines and penalties if they were found to engage in withholding for the purpose
of price elevation. Two generators refused to sign, and Ofgem’s proposed mandate was referred
to the Competition Commission. The Commission ultimately concluded that, due to the
difficulty of distinguishing ordinary unilateral behavior from abusive behavior, the mandate was
23 London Economics (2007).
19
not operational and should not be implemented.
Analyses of pricing and output decisions in subsequent years were not entirely
reassuring. A London Economics report found that over the period 2000-04 there were a
significant number of episodes when price exceeded 200 euros per mwh, and even some in
which price exceeded 450 euros. The Report went on to examine capacity and output decisions
by major generators, finding several whose output fell short of capacity a significant fraction of
the time, at least suggesting the possibility of strategic withholding.23
4.2 Price Spikes in the Netherlands
The Netherlands has been among the earliest and most thorough electricity reforming
countries in the EU. The state-owned transmission company TenneT is supplied by six domestic
generation companies as well as by imports from neighboring countries. Half-hourly prices are
determined in a day-ahead auction. Boogert and Dupont (2006) report, however, that over
15,000 reporting periods between 2004 and 2006, spot price exceeded 200 euros per mwh nearly
1 percent of the time. During this period price spikes seem to have been a persistent
phenomenon in the Netherlands.
Boddeus (2008) employs a direct but ex post method for indication of strategic
withholding by generators in the Netherlands. He computes each firm’s extent of unloaded but
profitable capacity, and relates that to the firm’s residual supply index and to its extent of
inexpensive inframarginal capacity. The latter reflects the magnitude of the generator’s
incentive to withhold capacity and thereby raise price and profit on its remaining capacity.
Boddeus’s empirical work finds that these two factors are strongly and significantly associated
20
with unloaded but profitable capacity, consistent with strategic withholding.
Mulder (2012), however, reports that price spikes in the Netherlands, which had often
ranged up to 1000 euros per mwh, have diminished dramatically in magnitude and frequency in
recent years Mulder, Fig. 1). Several factors appear to be responsible for this improved
performance, notably, growth of decentralized generation, capacity expansion by incumbent
generators, and increasing interconnection with neighboring countries. The effect of the latter is
illustrated by the much reduced differences between the wholesale price in the Netherlands and
those in Germany, Belgium/France, and Nordpool. In his statistical examination of the period
2006 through 2010, Mulder finds that the association between conventional structural measures
such as the residual supply index and the markup of price over cost declined markedly,
suggesting that these other factors had resulted in substantial decline in market power-based
price anomalies.
4.3 Price Spikes in Australia
The Australian electricity market was deregulated in 1998. Its National Electricity
Market is comprised of four regional markets–New South Wales, Queensland, South Australia,
and Victoria–together with a grid coordinated by the National Electricity Market Management
Company. Distances and transmission constraints result in these markets being largely separate.
Generators submit bids for half-hourly periods on a day-ahead basis, and receive the resulting
uniform auction price.
The NEM has attracted considerable attention since it has remained among the most free
of regulation since inception. The Australian Energy Regulator annually reports, in a matter-of-
fact way, occurrences of very high prices: The 2010 report, for example, states that price, which
24 See Higgs and Worthington for an expression of such concerns. Ullrich disputes theproposition that price volatility in Australian exceeds that elsewhere, although basic comparisonssuggest it is indeed higher.
25 AER, 2011, p. 30, n. 8.
21
averaged between AUS$30 and AUS$82 per mwh in the different regions, exceeded AUS$5000
in 95 half-hour trading intervals during the year. It further reports that most of these occurred in
two states and were the result of what is called “opportunistic pricing.” The latter is explained in
the following account (AER, 2011, p. 30):
AGL Electric owns the Torrens Island power station, which accounts for around 40percent of South Australia’s generation capacity. Transmission limits on importantelectricity from Victoria mean AGL Energy can, on days of high electricity demand, bid asignificant portion of its capacity at prices around the market cap and drive up the sportprice. It adopted this type of bidding strategy during many of South Australia’s 47extreme price events in 2009-10... There was also evidence AGL Energy engaged inopportunistic bidding in the market for frequency control ancillary services on two daysin April 2010, such that the cost of those services to South Australian consumersaveraged around $4 million per day, compared with the typical daily rate of less than$3000.
It is notable that similar behavior appears to have been characteristic of the Australian
electricity market since 1999. Thomas and Mitchell, for example, reported more than 70
“extreme returns price spikes,” defined as more than four standard deviations from the mean,
each year between 1998 and 2005. Although the AER and others have expressed concern over
this volatility, noting the uncertainty it creates for generators’ revenues and suppliers’ costs,24
there are only weak protections against such behavior. The principle constraint appears to be a
price cap that is applied only in cases where the unusually high price persists. At present, the
cap would be invoked “if the sum of half hourly bid prices over a rolling seven days exceeds a
cumulative threshold (currently $187,500 per mwh)”,25 which amounts to an average price of
about AUS$558 over this period. Moreover, even if invoked, price would be reduced according
22
to a procedure that would limit it to about AUS$300. On their face as well as from their effects,
It seems clear that this constraint does not tightly bind spot market prices in Australia..
5. Conclusions and Recommendations
A decade ago, price spikes were viewed with considerable concern in wholesale
electricity markets. They represented frequent and disruptive influences on nascent market
processes. They were often seen as exercises of single-firm market power that were not clearly
violations of competition statutes but also not clearly distinguishable in a regulatory context
from ordinary business behavior. This perspective often led to pessimistic assessments of the
prospects for controlling price spikes.
Experience suggests that these concerns may have been exaggerated. Evidence from
several countries and markets shows substantial reductions in price spikes, and some indications
of strategies that may have been responsible. Three in particular deserved mention. First,
regulatory actions to strengthen competition in wholesale electricity markets generally appear to
have had a noticeable deterrent effect on price spike behavior in particular. These measures
include broadening markets through interconnection and deepening markets by encouraging
entry of new generators. Second, demand response measures have had the salutary effect of
increasing demand elasticity and thereby diminishing incentives for withholding. While demand
response is also motivated by conservation and other objectives, it is well understood to be an
important aspect of improving performance in wholesale electricity markets. And third,
effective administrative controls over the very act of strategic withholding seem to have been
devised. Contrary to some early predictions, it appears possible to identify and restrain such
23
behavior without unduly interfering with ordinary and necessary capacity adjustments.
These experiences suggest that countries determined to control price spikes have a menu
of tested and seemingly effective approaches for doing so. Such case study evidence is only
suggestive, of course, so any firmer conclusion requires further research and testing.
Nonetheless, there seems to be grounds for optimism regarding control of one of the more
troublesome features of liberalized wholesale electricity markets.
Figure 1
Figure 2
P3
P0
S D2 D1
Q
P
Price
P1
C
S1
D2
Capacity
P2
S2
Figure 3
Price
P1
C
S1
D
Capacity
P2
S2
X2 X1
B A
D
Figure 4
D
P1
P2
Figure 6
P S
D
Q
Price
P1
C
S1
D2
Capacity
P2
P21
D2/
S2
Figure 5
D2
P1
P2 D2
//
D2/
Figure 7
Year $300 $400 $500 $600 $7002002 2 1 1 0 1
2003 0 0 0 0 0
2004 0 0 0 0 0
2005 0 0 0 0 0
2006 11 2 1 1 2
2007 2 4 1 1 0
2008 6 1 0 0 0
2009 0 0 0 0 0
2010 2 0 0 0 0
Source: PJM website.
Frequency of Price Spikes in PJM
TABLE 1
REFERENCES
Australian Energy Regulator. State of the Energy Market , Melbourne, 2010. Ausubel, Lawrence and, Peter Cramton. “Demand Reduction and Inefficiency in Multi-Unit Auctions.” University of Maryland working paper July, 2002.
Blumsack, Seth and Lester Lave. “Mitigating Market Power in Deregulated Electricity Markets.” Electricity Journal, 2002
Boddeus, Simon J. “Strategic Withholding on Wholesale Markets for Electricity: an application to the Dutch Market.” MA Thesis, University of Groningen, September, 2008.
Boogert, Alexander and Dominque Dupont. “When Supply Meets Demand: The Case of Hourly Spot Electricity Prices.” IEEE 23 (2), May 2008.
Borenstein, Severin, James Bushnell and Christopher R. Knittel. “Market Power in Electricity Markets: Beyond Concentration Measures.” Berkeley Energy Institute, Working paper PWP-O59r (1999).
Brattle Group. “Review of PJM’s Market Power Mitigation Practices in Comparison to Other Organized Electricity Markets.” Cambridge, September 14, 2007
Bushnell, James. "Looking for Trouble: Competition Policy in the U.S. Electricity Industry." Chapter 6 in Electricity Deregulation: Choices and Challenges. S. Puller and J. Griffen, Eds. University of Chicago Press. August, 2005.
Crawford, Gregory, Joseph Crespo and Helen Tauchen. “Bidding Asymmetries in Multi-Unit Auctions: Implications of Bid Function Equilibria in The British Spot Market for Electricity.” International Journal of Industrial Organization 25, 2007.
Fabera, Natalia, Nils-Henrik von der Fehr and David Harbord. “Designing Electricity Auctions.” RAND Journal of Economics, Spring 2006. Green, Richard. “Did English Generators Play Cournot? Capacity Withholding in the Electricity Pool.” MIT Center for Energy and Environmental Policy Research Working Paper. March 2004.
Higgs, Helen and Andrew C. Worthington. “Modeling Spot Prices in the Australian wholesale electricity market.” 2005
Joskow, Paul and Edward Kahn. “A Quantitative Analysis of Pricing Behavior in California’s Wholesale Electricity Market During Summer 2000.” Energy Journal, 2002. Kwoka, John. “Barriers to New Competition in Electricity Generation,” American Public Power Assn., 2008
Kwoka, John, and Vladlena Sabodash, “Price Spikes in Energy Markets: ‘Business by Usual Methods or Strategic Withholding?” Review of Industrial Organization, May 2011. London Economics. “Structure and Performance of Six European Wholesale Electricity Markets.” DG Competition, February 2007. Manskin, Eric and Jean Tirole. “A Theory of Dynamic Oligopoly, II: Price Competition, Kinked Demand Curves and Edgeworth Cycles.” Econometica 56 (3) May, 1988.
Mount, Timothy D., Yumei Ning and Xiaobin Cai. “Predicting Price Spikes in Electricity Markets Using a Regime-Switching Model with Time-Varying Parameters.” Energy Economics 28, 2006.
Mulder, Michael. “Market Power in the Electricity wholesale Market: Where do we Stand? An Analysis on the Dutch Market over 2006-2010.” Netherlands Competition Authority, Working paper (2012). Perekhodtsev, Dmitri, Lester Lave and Seth Blumsack. “The Model of Pivotal Oligopoly Applied to Electricity Markets.” Carnegie Mellon Electricity Industry Center (CEIC) Working Paper 02-06. September, 2002. PJM, “2011 Preliminary Emergency Load Management and Economic Demand Response Summary,” PJM, October 2011 Puller, Steven. “Pricing and Firm Conduct in California’s Deregulated Electricity Market.” The Review of Economics and Statistics 89 (1) February 2007. Rassenti, Stephen J. , Vernon L. Smith, Bart J. Wilson and . “
Controlling market power and price spikes in electricity networks: Demand-side bidding.” PNAS, 100 (5) March 4, 2003.
Stoft, Steven. “PJM’s Capacity Market in a Price-Spike World.” Berkeley Energy Institute, Working Paper PWP-077. May 2000. Synapse Energy Economics. “Generator Outage Increases: A Preliminary Analysis of Outage Trends in the New England Electricity Market.” Cambridge, January, 2001.
Truck, Stefan, Rafal Weron and Rodney Wolff. “What is an Electricity Price Spike and What is Not? A Review of Spike Identification Techniques.” Macquarie University, Working Paper 11-02, February 2011.
Von der Ferh, Nils-Hernich Morch and David Harbord. “Spot Market Competition in the UK Electricity Industry.” The Economic Journal, 103 May, 1993. Wolak, Frank, “Lessons from the California Electricity Crisis,” Berkeley Energy Institute, Working Paper, 2003.
Wolak, Frank and Robert Patrick. “The Impact of Market Rules and Market Structure on the Price Determnation Process in the England and Wales Electricity Market.” NBER Working Paper 8248. April 2001.
Wolfram, Catherine. “Strategic Bidding in a Multi-Unit auction: An empirical analysis of Bids to Supply Electricity in England and Wales.” RAND Journal of Economics 29 (4), Winter 1998.