Version 3.1 – 24 th May 2019 1 Catalogue Version 3.1 24 th May 2019 PRIME Key Performance Indicators for performance benchmarking Version 3.1, 24 th May 2019 PRIME – Platform of Railway Infrastructure Managers in Europe
Transcript
Version 3.1 – 24th May 2019 1
Catalogue
Version 3.1
24th May 2019
P R I M E Key Performance Indicators for performance benchmarking
Version 3.1, 24th May 2019
PRIME – Platform of Railway Infrastructure Managers in Europe
Appendix 2: Background information ............................................................................................ 37
Appendix 3: Causes for delays and cancelled services ................................................................. 46
Appendix 4: Charges for using the infrastructure and related services .......................................... 47
Appendix 5: Glossary of terms ...................................................................................................... 49
Version 3.1 – 24th May 2019 3
1. Introduction
This Catalogue contains a clear and concise documentation of the PRIME (Platform of Rail Infra-
structure Managers in Europe) key performance indicators (KPIs) and their definitions, set out in a
structured and prioritised way following the concept of the balanced scorecard.
The KPIs have been developed over a three year period, in a consultative manner with all of the
participant Infrastructure Managers and tested in 3 pilot exercises.
The KPIs set out in this version of the KPI Catalogue are those agreed at the most recent PRIME
KPI Sub Group meeting. These KPIs will be fixed for use in the initial Dashboard tool, but it is ex-
pected that they will be developed further and improved on a regular basis in the future.
2. Background
PRIME is a forum composed of rail infrastructure managers from EU Member States and EFTA
states, and the European Commission. The European Union Agency for Railways and industry as-
sociations participate as observers. PRIME fulfils the tasks of the European Network of Infrastructure
Managers as provided for in Article 7f of Directive 2012/34/EU1. Its objective is to cooperate with a
view to facilitating the provision of efficient and effective rail services within the Union, including
performance monitoring and best practice benchmarking. It also serves as an "early warning mech-
anism" for infrastructure managers to alert the European Commission on the main challenges and
advise the Commission on both operational and regulatory activities. The work of PRIME should
lead towards a better mutual understanding between Infrastructure Managers (IMs) and the Com-
mission, as well as better services to the customers of IMs and a better functioning European net-
work.
The added value for using common KPIs and performance benchmarking is:
• As a learning and improvement tool for railway IMs.
• KPIs provide a better understanding of the costs associated with each process and underlying
reasons.
• Cross-sectional benchmarking enables to compare performance with the aim to identify perfor-
mance gaps and learn.
• More informed management decisions can be taken in comparison to peers.
• Access to data can be used to support negotiations with public authorities and trade unions, and
it can also be used for engagement with regulators.
• Provides evidence to monitor whether national or EU policies are working or not.
• Is a communication tool vis-à-vis customers and business partners to indicate trends (if you
can’t measure results, you can’t tell success from failure!).
An additional important outcome of the PRIME KPI work is a good quality, comparable and easily
accessible, cross-sector, dataset.
1 Directive 2012/34/EU of the European Parliament and of the Council of 21 November 2012 establishing
a single European railway area, as amended by Directive (EU) 2016/2370.
Version 3.1 – 24th May 2019 4
Objectives
The ultimate objective of developing KPIs and benchmarking practices is to enhance the perfor-
mance and business development of IMs. The developed KPIs will support the IMs in:
• Providing a foundation for benchmarking.
• Supporting exchange of best practice.
• Increasing performance of IMs.
The KPIs that are suggested should be beneficial for both the IMs and the industry at large. Some
further guidelines for the work has been to:
• Focus on business development for the IMs.
• Keep it simple.
• Clear definitions.
• Avoid duplications of existing work and reuse.
3. PRIME KPI system
In establishing the KPI system for the PRIME IMs it was important to create a consistent and inte-
grated set of indicators which reflects all relevant aspects of an IM’s operations.
It was essential in developing the indicators to be absolutely clear about their purpose: in the case
of PRIME, the ultimate objective of the project to develop KPIs and benchmarking practices is to
enhance the performance and business development of each IM2. The PRIME KPI system will sup-
port this overall objective by addressing all aspects of an IM’s business, with a comprehensive but
balanced set of performance dimensions.
The choice of KPIs reflects the needs and key decisions to be made by each individual IM. Many of
the key decisions, for example around maintenance strategy or operational efficiencies, will be com-
mon to most if not all IMs. Therefore the KPI system, in reflecting all parts of an IM’s operations and
wider business, addresses the key decision making areas for an IM. The value of the KPI system is
in providing each IM with a structured set of indicators which allows each of them to understand its
business and its performance in relation to the other IMs.
Each of the IMs has its own priorities and the importance of different decisions will vary within the
group. All IMs also have their own set of management metrics and performance indicators, used to
manage their own business. The common set of indicators which has been developed by the PRIME
sub-group, whilst almost certainly overlapping considerably with each IM’s own set of management
metrics, provides a common set of indicators and definitions, which allows good, clear and robust
comparisons between IMs and enables benchmarking if desired.
Whilst different performance indicators have varying priority for the different IMs, there is a core of
indicators – Key Performance Indicators (KPIs) – which are of common interest and value to all IMs.
It is also beneficial to the process of benchmarking to define a common set of core indicators which
can be used consistently and on an ongoing basis for robust comparisons between the IMs. A wider
2 J. Pettersson, General Presentation RU Dialogue PRIME - KPIs and benchmarking, Vienna, June 2016
Version 3.1 – 24th May 2019 5
set of indicators can be used for their own purposes by individual IMs, as they require. To achieve
this, the PRIME performance indicator framework is tiered into a hierarchy which includes a relatively
small set of KPIs distributed into a primary ‘High Level Industry’ Dashboard and a secondary ‘Bench-
marking’ Dashboard, as well as a wider set of other Performance Indicators (PIs) and other support-
ing data. This is illustrated in Figure 1 below.
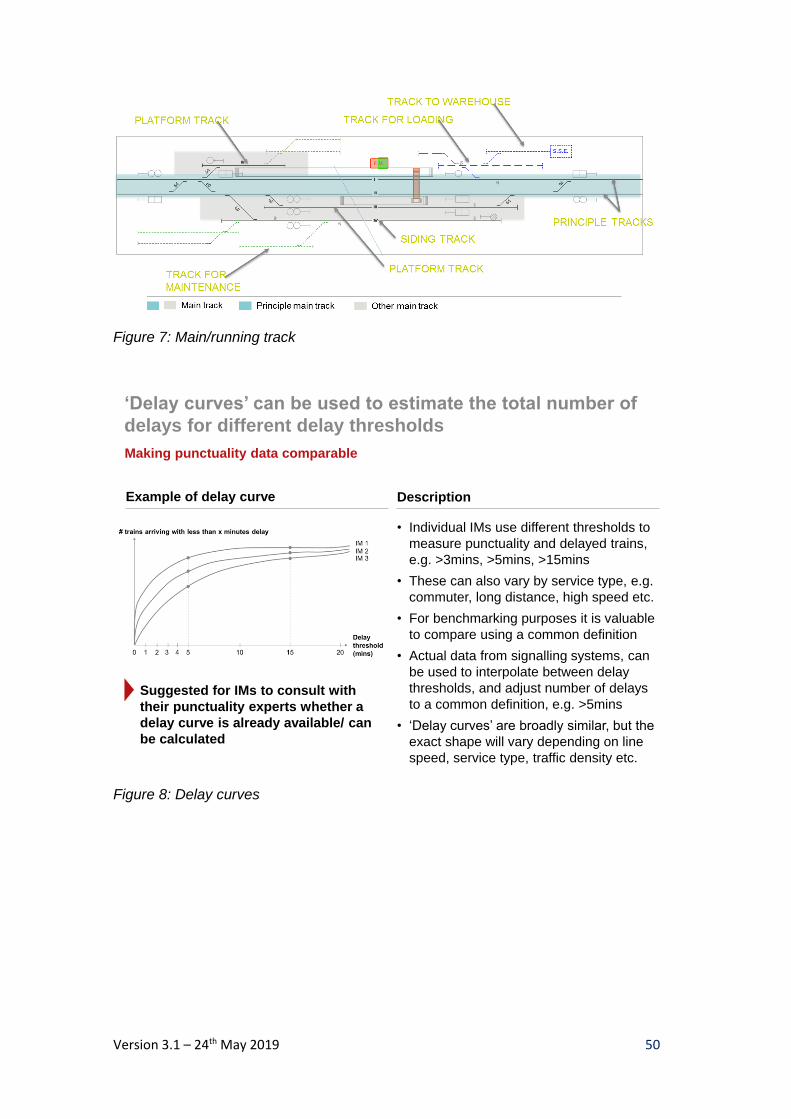
Figure 1. PRIME performance indicator hierarchy
Data collected by IMs will be used to support all four levels of the hierarchy, but it will be clustered
and presented in different ways. The ‘High Level Industry’ KPIs provide a small set of high level KPIs
for use by the High Level Industry team of each IM. A wider set of KPIs, covering all aspects of the
IM’s business, is available for use by the benchmarking teams in each IM. Both of these groupings
of KPIs are presented in the PRIME dashboard tool, which is available online and will be updated
on an annual basis. The full set of performance indicators, supporting indicators and data is available
for use by active participants in the PRIME benchmarking activities in the form of simple reports.
Dashboard structure
In order to be effective and useful to the management of the IMs, the indicators, in particular the
KPIs included in the two dashboards, are aligned as far as possible with the decision making pro-
cesses of the IMs. This requires that they are aligned not with the organisational structure of the IMs
but with the key strategic decisions that an IM is likely to have to make. The PRIME dashboards
have been developed with a common structure, for use as a benchmark tool between IMs, but it is
envisaged and hoped that individual IMs will develop linkages between the common PRIME dash-
boards and their own management KPIs and management scorecards.
Typically a management performance scorecard reflects the high level objectives of the organisation,
along the line of which success or failure is defined. Very often for a private sector organisation, this
aligns with long or short term shareholder value. For a railway infrastructure manager this definition
of ‘success’ has a much broader and more complex definition.
Version 3.1 – 24th May 2019 6
The KPI structure defined for the PRIME project is based on the well-known Balanced Scorecard,
developed by the American academics Robert Kaplan and David Norton, and published in the Har-
vard Business Review in 19923. This concept has been developed further over the years in different
sectors, and additional dimensions have been added and amended to reflect the needs and priorities
of different sectors and different organisations.
The PRIME KPI structure, which reflects the needs and priorities of a railway IM has five dimensions,
as illustrated in Figure 2 below. These five dimensions reflect the activities and outputs of a railway
IM, and the needs and demands of its stakeholders and customers.
Figure 2. PRIME Scorecard Dimensions
• Safety & Environment – the management and delivery of safety, security and environmental
behaviours and standards.
• Performance – the performance of the IM’s assets and network and resulting impact on opera-
tors and customers.
• Delivery – the effectiveness of the IM’s internal processes and management of the IM’s assets
and provision of a fit for purpose network, including the delivery of contractors and suppliers.
• Financial – the financial performance of the IM, including its cost effectiveness and revenues,
including track access charges.
• Growth – the level of use of the existing network, network improvement and expansion, integra-
tion with other transport modes and use of technology to improve delivery.
In addition to the five scorecard dimensions, a small number of indicators have been included to
provide context to the other dimensions. ‘Context’ provides an overview of the characteristics of each
IM and background on the size, relative significance and the market for railway services in each
country. This provides useful background to understand the structural differences between the rail-
ways, particularly when interpreting other KPIs.
The KPI structure is aligned specifically to these dimensions, as these are dimensions which reflect
management objectives and decision making, rather than reflecting specific functions or capabilities.
For example, the scorecard could have focused on dimensions such as customer, staff,
3 R.S. Kaplan and D.P. Norton, The Balanced Scorecard: Measures that Drive Performance, Harvard Business Review. 1992
Version 3.1 – 24th May 2019 7
stakeholders, however good management does not focus directly on these parties, but rather on
how it delivers to each of these parties. Management focus on its customers, reflects the customers’
needs and priorities, through safety and security, availability, punctuality and performance and
charges. Stakeholders needs are met through, for example, safety and environment, performance
and growth.
Within each of the scorecard dimensions there are a number of KPI categories which break the
dimensions down further into elements for which specific KPIs can be defined. These categories are
clearly aligned with those selected as most important to the members of the PRIME group. The 12
categories are illustrated, aligned to the five scorecard dimensions, in Figure 3 below.
Figure 3. PRIME KPI categories aligned to scorecard dimensions
It is essential to define clear, comprehensive, yet concise, objectives for each of the scorecard di-
mensions, which have then been used to define specific KPIs for each of the categories within each
scorecard dimension. These objectives and the KPIs for each category are set out and explained in
detail in the following section of the KPI Catalogue. Detailed definitions, further background data and
information, and other specific information is provided in the appendices to the Catalogue.
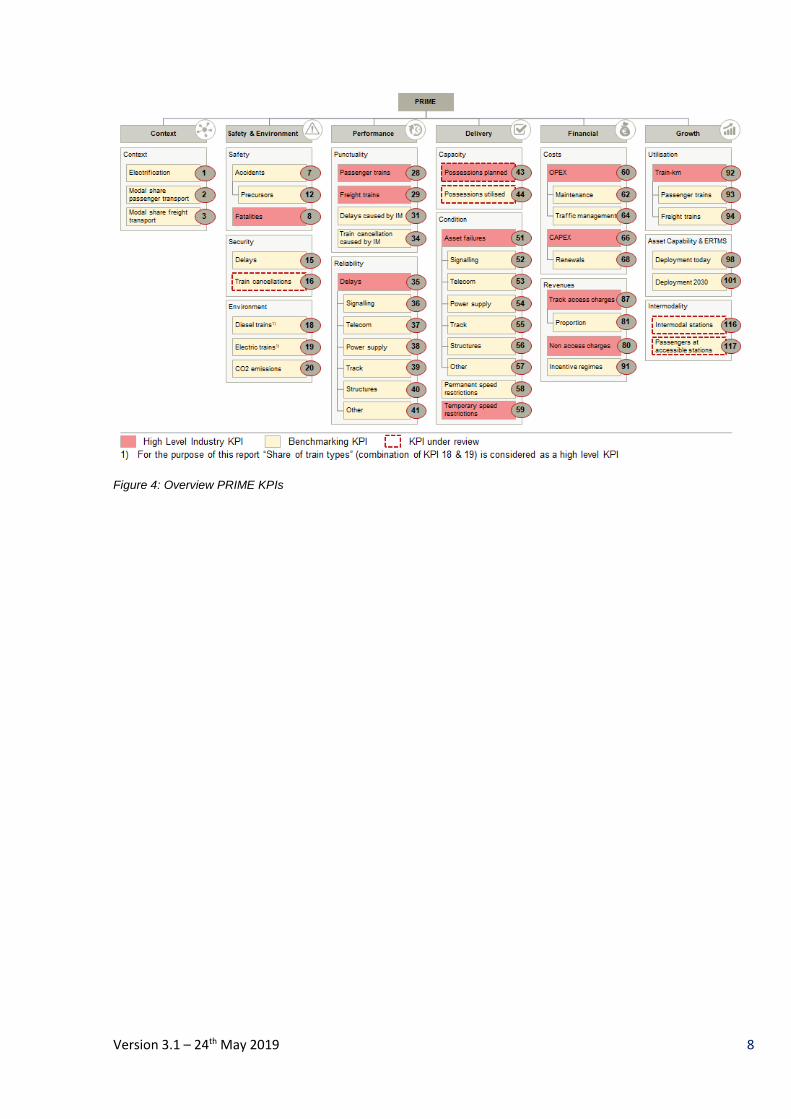
The High Level Industry KPIs and their respective scorecard dimensions and categories can be
found in Figure 4.
Version 3.1 – 24th May 2019 8
Figure 4: Overview PRIME KPIs
Version 3.1 – 24th May 2019 9
4. Performance Indicators
This section contains the complete set of PRIME performance indicators, clustered into the 12 KPI
categories and Context category and structured around the five scorecard dimensions, together with
the objectives for each dimension.
The KPIs set out in this Catalogue reflect two years work by the participants to develop a good,
robust and commonly accepted set of indicators and definitions. Some KPIs have already been col-
lected and used in pilot exercises, others have been defined but have yet to be tested. This version
of the Catalogue brings together all of these indicators, into the common structure and provides a
constant basis on which the initial comparator tool and dashboards can be be developed. Future
versions of the Catalogue will include improvements and changes to the performance indictators and
the definitions set out in this version, as a result of further review, testing and use of actual data from
the participant IMs.
The data for each of the performance indicators is being collected by the IMs on an annual basis.
Context
This category provides an overview of the characteristics and configuration of each IM. This enables
an understanding of the size and relative significance of the railway in each country and the market
for railway services, which provides valuable background information and relevant context when
reviewing and assessing other KPIs and additional performance indicators.
KPI ID KPI name KPI definition KPI unit KPI Level
1 Degree of electrification of total main track
Percentage of main track-km which are electrified % of main track-km KPI (Benchmarking)
2 National modal share of rail in passenger transport
Proportion of national rail passenger-km compared to total passenger-km of passenger cars, buses/coaches, aviation and railways (Source: European Commission, Statistical Pocket book)
% of passenger-km KPI (Benchmarking)
3 National modal share of rail in freight transport
Proportion of national rail tonne-km compared to total tonne-km of road, inland waterways and rail freight (Source: European Commission, Statistical Pocket book)
% of tonne-km KPI (Benchmarking)
4 Total number of passen-ger stations
Total number of passenger stations (no freight) within the entire railway infrastructure network, independent of ownership (Source "Passenger stations": European Commission, RMMS)
Number Additional perfor-mance indicator
5 Passenger station den-sity - line-km
Total number of passenger stations (no freight) within the entire railway infrastructure network, independent of ownership, related to the length of main lines. It gives an idea of the density of stations within the network (Source "Passenger stations": European Commission, RMMS)
Number per thou-sand main line–km
Additional perfor-mance indicator
6 Passenger station den-sity – residents
Total number of passenger stations (no freight) within the entire railway infrastructure network, independent of ownership, per million residents (Source "Residents": European Commission, Eurostat. Source "Passenger stations": European Commission, RMMS)
Number per million residents
Additional perfor-mance indicator
119 Total number of multi-modal rail freight termi-nals
Total number of all multimodal rail freight terminals (no passengers) within the entire railway infrastructure net-work, independent of ownership (Source: European Commission, RMMS)
Number Additional perfor-mance indicator
120 Multimodal freight termi-nal density - line-km
Total number of multimodal freight terminals within the entire railway infrastructure network, independent of ownership, related to the length of main lines. It gives an idea of the density of terminals within the network (Source "Multimodal freight terminals": European Com-mission, RMMS)
Number per thou-sand main line–km
Additional perfor-mance indicator
Version 3.1 – 24th May 2019 10
Safety, Security & Environment
This dimension demonstrates the level of safety and security provided by the railway, in particular
the IM, to its customers, staff and third parties. It also shows the environmental impact of the railway.
The objectives of the Safety & Environment dimension are to:
• Understand and improve the ability of an IM to manage and operate its network and users of its
network in such a way as to maximise safety and security (ALARP) for its customers, staff, its
partners – operators, contractors and suppliers – and the general public; and
• Demonstrate the ability of an IM to manage its network in such a way as to minimise short term
and long term environmental impacts by itself and its staff, its operators, suppliers and custom-
ers.
The Safety & Environment dimension contains three categories: Safety, Security and Environ-
ment.
Safety
Safety is the primary focus of the management of a railway IM and a prerequisite in any framework
of management indicators. It is the most important and essential element in the performance of an
IM, and affects customers, stakeholders, the reputation of the IM, the railway and society at large.
Safety should be considered with a holistic perspective, including as well as the fundamental task of
providing a stable, safe and secure network for the user and the IM’s staff, wider aspects of safety
such as suicide prevention and minimising trespass events.
KPI ID KPI name KPI definition KPI unit KPI Level
7 Significant accidents Relative number of significant accidents including sidings, excluding accidents in workshops, ware-houses and depots based on the following types of accidents (primary accidents): - Collision of train with rail vehicle - Collision of train with obstacle within the clearance gauge - Derailment of train - Level crossing accident, including accident involv-ing pedestrians at level crossing - Accident to persons involving rolling stock in mo-tion, with the exception of suicides and attempted suicides - Fire on rolling stock - Other accident The boundary is the point at which the railway vehi-cle leaving the workshop/warehouse/depot/sidings cannot pass without having an authorization to ac-cess the mainline or other similar line. This point is usually identified by a signal. For further guidance, please see ERA Implementa-tion Guidance on CSIs.
Number per million train-km
KPI (Benchmarking)
Version 3.1 – 24th May 2019 11
KPI ID KPI name KPI definition KPI unit KPI Level
8 Persons seriously injured and killed
Relative number of persons seriously injured (i.e. hospitalised for more than 24 hours, excluding any attempted suicide) and killed (i.e. killed immediately or dying within 30 days, excluding any suicide) by accidents based upon following categories - Passenger - Employee or contractor - Level crossing user - Trespasser - Other person at a platform - Other person not at a platform
Number per million train-km
KPI (High Level In-dustry)
9 Suicides and attempted sui-cides
Relative number of suicides and attempted suicides Number per million train-km
Additional perfor-mance indicator
10 Suicides Relative number of suicides Number per million train-km
Additional perfor-mance indicator
11 Attempted suicides Relative number of attempted suicides Number per million train-km
Additional perfor-mance indicator
12 IM related precursors to ac-cidents
Relative number of the following types of precur-sors: - broken rail - track buckle and track misalignment - wrong-side signalling failure
Number per million train-km
KPI (Benchmarking)
13 Overall workforce safety Relative number of IMs employees, contracted con-sultants and contractors seriously injured (i.e. hos-pitalised for more than 24 hours, excluding any at-tempted suicide) and killed (i.e. killed immediately or dying within 30 days, excluding any suicide) by accidents while at work at IMs premises. (IMs should prepare to present per million worked hours in the future)
Number per thou-sand main track-km
Additional perfor-mance indicator
14 Workforce safety on track or trackside
Relative of IMs employees, contracted consultants and contractors seriously injured (i.e. hospitalised for more than 24 hours, excluding any attempted suicide) and killed (i.e. killed immediately or dying within 30 days, excluding any suicide) by accidents while at work at trackside. (IMs should prepare to present per million worked hours in the future)
Number per thou-sand main track-km
Additional perfor-mance indicator
Security
The management of railway security includes activities for the protection of the railway, its users and
its staff through monitoring, prevention and preparation of responses to security incidents carried out
with malicious intent, which have the potential to harm customers and staff, damage railway assets,
or generally to impede and disrupt railway operations.
KPI ID KPI name KPI definition KPI unit KPI Level
15 Delays caused by security incidents
Number of delay minutes due to security incidents (intentional acts as terrorism, sabotage, cyber-at-tacks, vandalism, thefts, espionage, unauthorized persons and other acts of aggression or hooligan-ism) per train-km
Minutes per train-km
KPI (Benchmarking)
16 Train cancellations caused by security incidents
Percentage of trains cancelled caused by security incidents (intentional acts as terrorism, sabotage, cyber-attacks, vandalism, thefts, espionage, unau-thorized persons and other acts of aggression or hooliganism) per total trains scheduled to be oper-ated
% of scheduled trains
KPI (Benchmarking)
17 People killed or seriously injured due to security inci-dents
Number of people seriously injured (i.e. hospital-ised for more than 24 hours) and killed (i.e. killed immediately or dying within 30 days) due to security incidents (i.e. intentional acts as terrorism, sabo-tage, cyber-attacks, vandalism, thefts, espionage, unauthorized persons and other acts of aggression or hooliganism)
Number Additional perfor-mance indicator
Version 3.1 – 24th May 2019 12
Environment
Monitoring the environmental impact of the IM focuses on two aspects: the influence of the IM in
affecting and improving the environmental impact of the whole integrated railway (e.g. through elec-
trification) and the direct environmental impact of the IM’s own activities.
Railways are one of the most environmentally-friendly modes of passenger and freight transport,
and the KPIs recognise the opportunity for railways to effect modal shift from more polluting transport
modes. They also take account of the environment impact of an IM’s activities, including aspects
such as use of electric rolling stock, habitat alteration and fragmentation, emissions to air,
wastewater, noise, waste, diesel exhaust emissions, materials, recycling, etc.
KPI ID KPI name KPI definition KPI unit KPI Level
18 Share of diesel-powered trains
Train-kilometres of diesel-powered trains com-pared to total train-kilometres (both for passen-ger and freight trains)
% of train-km KPI (Benchmarking)
19 Share of electricity-powered trains
Train-kilometres of electricity-powered trains com-pared to total train-kilometres (both for passenger and freight trains)
% of train-km KPI (Benchmarking)
20 CO2 emission produced from maintenance rolling stock
Tonnes of carbon dioxide emission produced from the activity of maintenance rolling stock compared to main track-km
tCO2 per main track-km
KPI (Benchmarking)
21 Waste management linked to track and trackside
Amount of reused, recycled and recovered waste compared to total produced waste linked to track and trackside
% of tonnes Additional perfor-mance indicator
22 Environmental Incidents Number of rail related environmental incidents with major and significant impact or effect per main track-km
Number per main track-km
Additional perfor-mance indicator
23 Noise exposure at night Total number of citizens exposed to ≥ 50 dB at night
Number per main line-km
Additional perfor-mance indicator
24 Noise limits Number of not awarded requested train paths due to noise divided by total number of requested train paths
Number per total number of re-quested train paths
Additional perfor-mance indicator
25 Noise measurements - noise barriers
Length of noise barriers per line-km % of main line-km Additional perfor-mance indicator
26 Noise measurements - ab-sorbers
Length of track equipped with Rail absorbers per to-tal track-km
% of main track-km Additional perfor-mance indicator
Performance
The performance dimension describes the performance of the IMs’ assets and network and the re-
sulting impact on operators and customers. This dimension is used to analyse the performance of
the IM network in relation to other IMs.
The objectives of the Performance dimension are to:
• Understand the performance of the IM network in relation to other IMs;
• Improve the ability of the IM to enable trains to run on time; and,
• Identify opportunities to improve the management of assets to minimise the number of failures,
and the impact of those failures on the operating railway.
The Performance dimension contains two categories: Punctuality and Reliability.
Version 3.1 – 24th May 2019 13
Punctuality
Train punctuality is the primary measure of overall railway performance and a key measure of quality
of service, driven not only by the IM but also operators and customers. The requirements for punc-
etc. It is essential to understand both the overall performance of the system through punctuality, as
well as the IM’s impact on and responsibility for punctuality.
KPI ID KPI name KPI definition KPI unit KPI Level
27 Trains punctuality Percentage of actually operating (i.e. not cancelled) national and international passenger and freight trains (excluding work trains) which arrive at each strategic measuring point with a delay of less than or equal to 5:29 minutes (passengers) and 15:29 minutes (freight)
% of trains Additional perfor-mance indicator
28 Passenger trains punctuality Percentage of actually operating (i.e. not cancelled) national and international passenger trains (exclud-ing work trains) which arrive at each strategic measuring point with a delay of less than or equal to 5:29 minutes
% of trains KPI (High Level In-dustry)
29 Freight trains punctuality Percentage of actually operating (i.e. not cancelled) national and international freight trains (excluding work trains) which arrive at each strategic measur-ing point with a delay of less than or equal to 15:29 minutes
% of trains KPI (High Level In-dustry)
30 Delay minutes per train caused by the IM
Average delay minutes caused by incidents that are regarded as IMs responsibility per total number of national and international passenger and freight trains (excluding work trains) actually operating (i.e. not cancelled) out of those that were scheduled in the original working timetable, including those time-tabled at short notice; Delay minutes according to UIC leaflet 450-2, Appendix A - Table 1 (columns 1, 2 and 3) and corresponding explanation in appen-dices B.1, B.2 and B.3. Delay minutes will be meas-ured at all available measuring points. Of those measured delay minutes that exceed a threshold of 5:29 minutes for passenger services and 15:29 minutes for freight services the maximum number is counted. No delay minutes are counted if these thresholds are not exceeded at any measuring point
Minutes per train Additional perfor-mance indicator
31 Delay minutes per train-km caused by the IM
Delay minutes caused by incidents that are re-garded as IMs responsibility divided by total train-km operated (revenue service + shunting opera-tions to and from depots + IM’s work traffic); Delay minutes according to UIC leaflet 450-2, Appendix A - Table 1 (columns 1, 2 and 3) and corresponding explanation in appendices B.1, B.2 and B.3. Delay minutes will be measured at all available measuring points. Of those measured delay minutes that ex-ceed a threshold of 5:29 minutes for passenger ser-vices and 15:29 minutes for freight services the maximum number is counted. No delay minutes are counted if these thresholds are not exceeded at any measuring point
Minutes per train-km
KPI (Benchmarking)
Version 3.1 – 24th May 2019 14
KPI ID KPI name KPI definition KPI unit KPI Level
32 Delay minutes per train caused by weather
Average delay minutes caused by weather inci-dents which have led to disruptions in the railway infrastructure per total number of national and inter-national passenger and freight trains (excluding work trains) actually operating (i.e. not cancelled) out of those that were scheduled in the original working timetable, including those timetabled at short notice; Delay minutes will be measured at all available measuring points. Of those measured de-lay minutes that exceed a threshold of 5:29 minutes for passenger services and 15:29 minutes for freight services the maximum number is counted. No delay minutes are counted if these thresholds are not exceeded at any measuring point
Minutes per train Additional perfor-mance indicator
33 Delay minutes per train-km caused by weather
Delay minutes caused by weather incidents which have led to disruptions in the railway infrastructure divided by total train-km operated (revenue service + shunting operations to and from depots + IM’s work traffic); Delay minutes will be measured at all available measuring points. Of those measured de-lay minutes that exceed a threshold of 5:29 minutes for passenger services and 15:29 minutes for freight services the maximum number is counted. No delay minutes are counted if these thresholds are not exceeded at any measuring point
Minutes per train-km
Additional perfor-mance indicator
34 Percentage of train cancel-lations caused by the IM
Percentage of fully or partially cancelled national and international passenger trains that were caused by incidents that are regarded as IMs responsibility according to UIC leaflet 450-2, Appendix A - Table 1 (columns 1, 2 and 3) and corresponding explana-tion in appendices B.1, B.2 and B.3. Including all trains that are included in the last timetable issued the day before the service (or the timetable that is valid when the train service takes place) and includ-ing all types of cancelled trains such as full cancel-lation (cancelled at origin), part cancellation en route, part cancellation changed origin, part cancel-lation diverted
% of scheduled and cancelled passen-ger trains
KPI (Benchmarking)
Reliability
Reliability of the infrastructure demonstrates the impact of failures. As well as managing its assets
in such a way as to minimise the effect of failures on the railway, these indicators also measure the
effectiveness and timeliness of the IM in responding to these failures, and returning the network to
normal function.
KPI ID KPI name KPI definition KPI unit KPI Level
35 Average delay minutes per asset failure
Average delay minutes per asset failure caused by all asset failures on main track according to UIC leaflet 450-2, Appendix A - Table 1 (column 2) and corresponding explanation in Appendix B.2 - Infra-structure installations. An asset failure is counted one time and one time only if any train is affected by it. A train is affected if the asset failure causes the train to exceed a delay minutes threshold of 5:29 minutes for passenger services or 15:29 minutes for freight services at any available meas-uring point. Delay minutes will be measured at all available measuring points. Of those measured de-lay minutes the maximum number is counted. No delay minutes are counted if these thresholds are not exceeded at any measuring point. An asset fail-ure is not counted if these thresholds are not ex-ceeded for any train at any available measuring point (i.e. if no train is affected)
Minutes per failure KPI (High Level In-dustry)
Version 3.1 – 24th May 2019 15
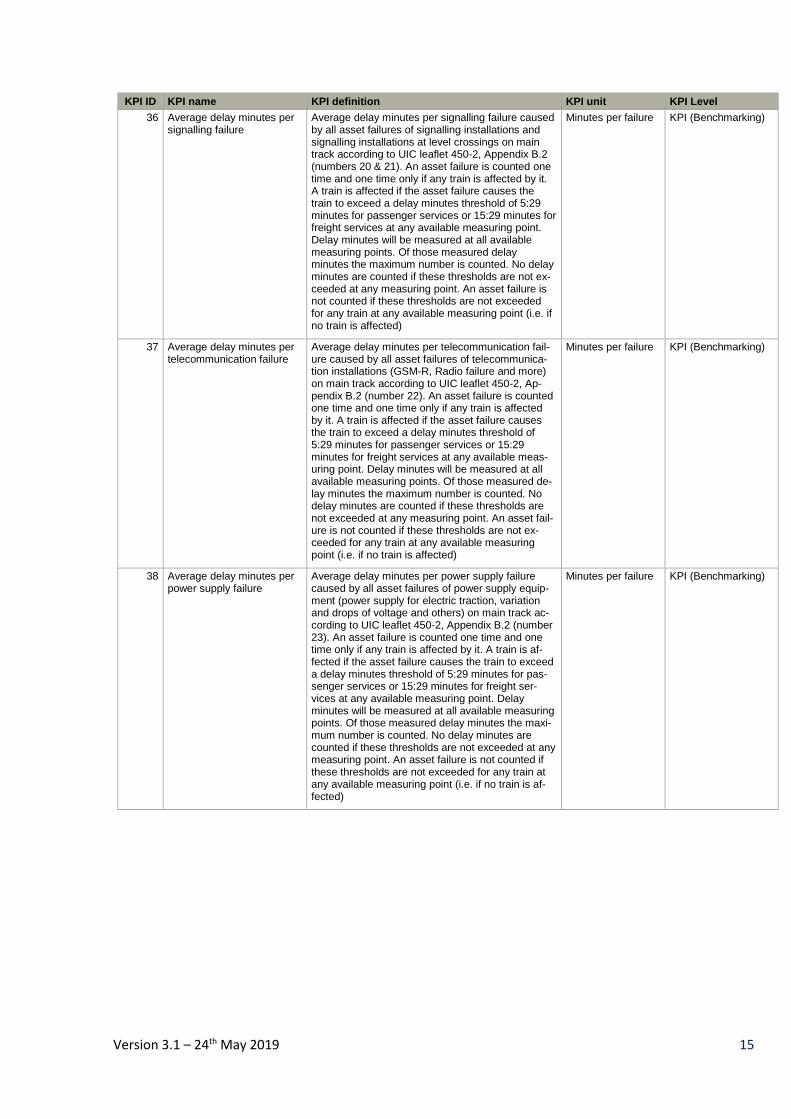
KPI ID KPI name KPI definition KPI unit KPI Level
36 Average delay minutes per signalling failure
Average delay minutes per signalling failure caused by all asset failures of signalling installations and signalling installations at level crossings on main track according to UIC leaflet 450-2, Appendix B.2 (numbers 20 & 21). An asset failure is counted one time and one time only if any train is affected by it. A train is affected if the asset failure causes the train to exceed a delay minutes threshold of 5:29 minutes for passenger services or 15:29 minutes for freight services at any available measuring point. Delay minutes will be measured at all available measuring points. Of those measured delay minutes the maximum number is counted. No delay minutes are counted if these thresholds are not ex-ceeded at any measuring point. An asset failure is not counted if these thresholds are not exceeded for any train at any available measuring point (i.e. if no train is affected)
Minutes per failure KPI (Benchmarking)
37 Average delay minutes per telecommunication failure
Average delay minutes per telecommunication fail-ure caused by all asset failures of telecommunica-tion installations (GSM-R, Radio failure and more) on main track according to UIC leaflet 450-2, Ap-pendix B.2 (number 22). An asset failure is counted one time and one time only if any train is affected by it. A train is affected if the asset failure causes the train to exceed a delay minutes threshold of 5:29 minutes for passenger services or 15:29 minutes for freight services at any available meas-uring point. Delay minutes will be measured at all available measuring points. Of those measured de-lay minutes the maximum number is counted. No delay minutes are counted if these thresholds are not exceeded at any measuring point. An asset fail-ure is not counted if these thresholds are not ex-ceeded for any train at any available measuring point (i.e. if no train is affected)
Minutes per failure KPI (Benchmarking)
38 Average delay minutes per power supply failure
Average delay minutes per power supply failure caused by all asset failures of power supply equip-ment (power supply for electric traction, variation and drops of voltage and others) on main track ac-cording to UIC leaflet 450-2, Appendix B.2 (number 23). An asset failure is counted one time and one time only if any train is affected by it. A train is af-fected if the asset failure causes the train to exceed a delay minutes threshold of 5:29 minutes for pas-senger services or 15:29 minutes for freight ser-vices at any available measuring point. Delay minutes will be measured at all available measuring points. Of those measured delay minutes the maxi-mum number is counted. No delay minutes are counted if these thresholds are not exceeded at any measuring point. An asset failure is not counted if these thresholds are not exceeded for any train at any available measuring point (i.e. if no train is af-fected)
Minutes per failure KPI (Benchmarking)
Version 3.1 – 24th May 2019 16
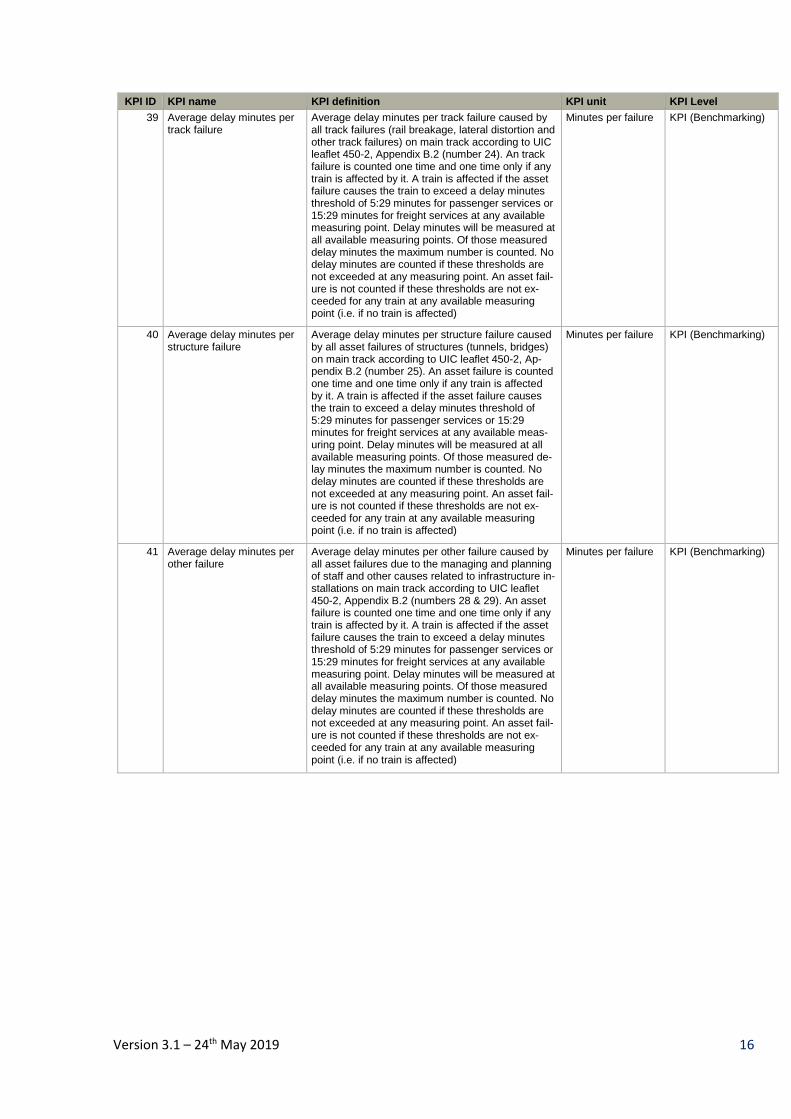
KPI ID KPI name KPI definition KPI unit KPI Level
39 Average delay minutes per track failure
Average delay minutes per track failure caused by all track failures (rail breakage, lateral distortion and other track failures) on main track according to UIC leaflet 450-2, Appendix B.2 (number 24). An track failure is counted one time and one time only if any train is affected by it. A train is affected if the asset failure causes the train to exceed a delay minutes threshold of 5:29 minutes for passenger services or 15:29 minutes for freight services at any available measuring point. Delay minutes will be measured at all available measuring points. Of those measured delay minutes the maximum number is counted. No delay minutes are counted if these thresholds are not exceeded at any measuring point. An asset fail-ure is not counted if these thresholds are not ex-ceeded for any train at any available measuring point (i.e. if no train is affected)
Minutes per failure KPI (Benchmarking)
40 Average delay minutes per structure failure
Average delay minutes per structure failure caused by all asset failures of structures (tunnels, bridges) on main track according to UIC leaflet 450-2, Ap-pendix B.2 (number 25). An asset failure is counted one time and one time only if any train is affected by it. A train is affected if the asset failure causes the train to exceed a delay minutes threshold of 5:29 minutes for passenger services or 15:29 minutes for freight services at any available meas-uring point. Delay minutes will be measured at all available measuring points. Of those measured de-lay minutes the maximum number is counted. No delay minutes are counted if these thresholds are not exceeded at any measuring point. An asset fail-ure is not counted if these thresholds are not ex-ceeded for any train at any available measuring point (i.e. if no train is affected)
Minutes per failure KPI (Benchmarking)
41 Average delay minutes per other failure
Average delay minutes per other failure caused by all asset failures due to the managing and planning of staff and other causes related to infrastructure in-stallations on main track according to UIC leaflet 450-2, Appendix B.2 (numbers 28 & 29). An asset failure is counted one time and one time only if any train is affected by it. A train is affected if the asset failure causes the train to exceed a delay minutes threshold of 5:29 minutes for passenger services or 15:29 minutes for freight services at any available measuring point. Delay minutes will be measured at all available measuring points. Of those measured delay minutes the maximum number is counted. No delay minutes are counted if these thresholds are not exceeded at any measuring point. An asset fail-ure is not counted if these thresholds are not ex-ceeded for any train at any available measuring point (i.e. if no train is affected)
Minutes per failure KPI (Benchmarking)
Version 3.1 – 24th May 2019 17
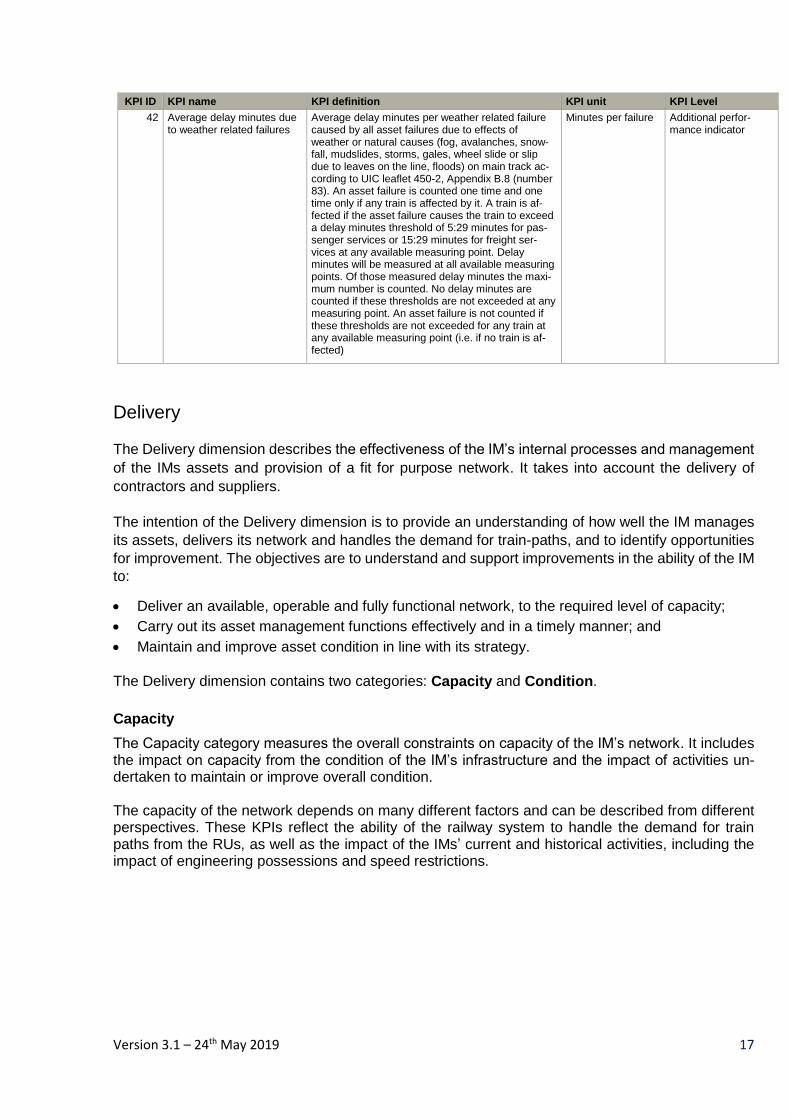
KPI ID KPI name KPI definition KPI unit KPI Level
42 Average delay minutes due to weather related failures
Average delay minutes per weather related failure caused by all asset failures due to effects of weather or natural causes (fog, avalanches, snow-fall, mudslides, storms, gales, wheel slide or slip due to leaves on the line, floods) on main track ac-cording to UIC leaflet 450-2, Appendix B.8 (number 83). An asset failure is counted one time and one time only if any train is affected by it. A train is af-fected if the asset failure causes the train to exceed a delay minutes threshold of 5:29 minutes for pas-senger services or 15:29 minutes for freight ser-vices at any available measuring point. Delay minutes will be measured at all available measuring points. Of those measured delay minutes the maxi-mum number is counted. No delay minutes are counted if these thresholds are not exceeded at any measuring point. An asset failure is not counted if these thresholds are not exceeded for any train at any available measuring point (i.e. if no train is af-fected)
Minutes per failure Additional perfor-mance indicator
Delivery
The Delivery dimension describes the effectiveness of the IM’s internal processes and management
of the IMs assets and provision of a fit for purpose network. It takes into account the delivery of
contractors and suppliers.
The intention of the Delivery dimension is to provide an understanding of how well the IM manages
its assets, delivers its network and handles the demand for train-paths, and to identify opportunities
for improvement. The objectives are to understand and support improvements in the ability of the IM
to:
• Deliver an available, operable and fully functional network, to the required level of capacity;
• Carry out its asset management functions effectively and in a timely manner; and
• Maintain and improve asset condition in line with its strategy.
The Delivery dimension contains two categories: Capacity and Condition.
Capacity
The Capacity category measures the overall constraints on capacity of the IM’s network. It includes the impact on capacity from the condition of the IM’s infrastructure and the impact of activities un-dertaken to maintain or improve overall condition. The capacity of the network depends on many different factors and can be described from different perspectives. These KPIs reflect the ability of the railway system to handle the demand for train paths from the RUs, as well as the impact of the IMs’ current and historical activities, including the impact of engineering possessions and speed restrictions.
Version 3.1 – 24th May 2019 18
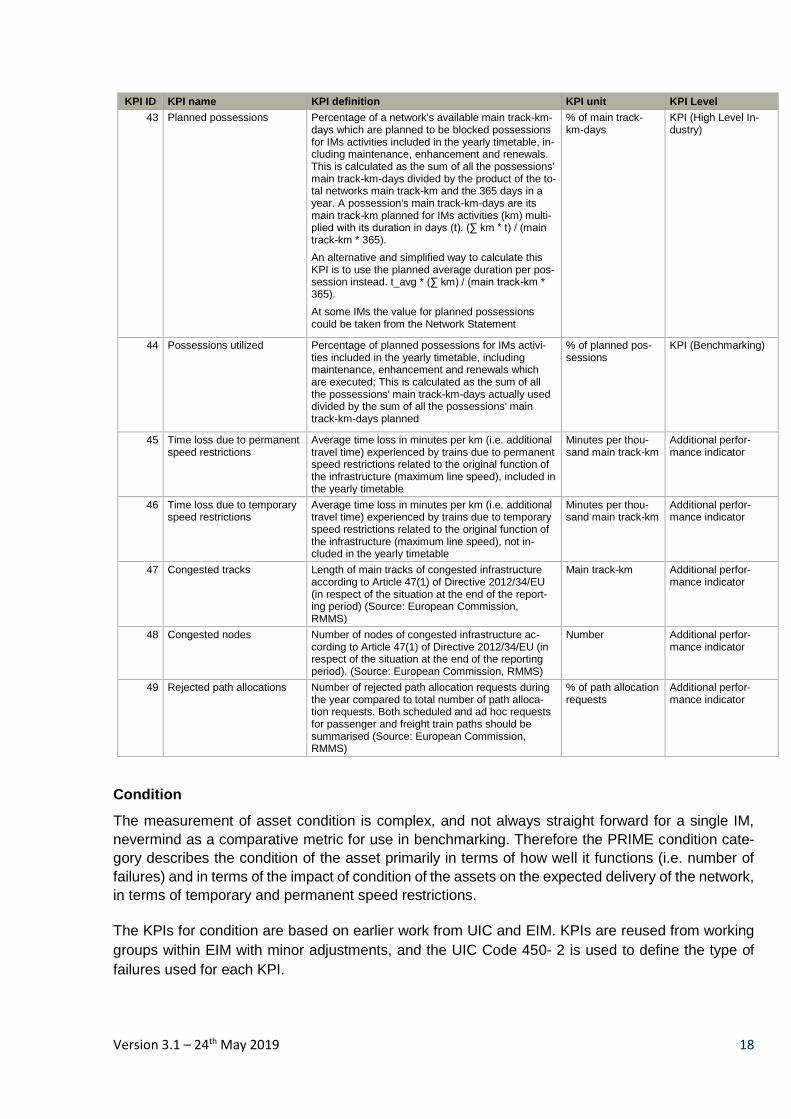
KPI ID KPI name KPI definition KPI unit KPI Level
43 Planned possessions Percentage of a network's available main track-km-days which are planned to be blocked possessions for IMs activities included in the yearly timetable, in-cluding maintenance, enhancement and renewals. This is calculated as the sum of all the possessions' main track-km-days divided by the product of the to-tal networks main track-km and the 365 days in a year. A possession's main track-km-days are its main track-km planned for IMs activities (km) multi-plied with its duration in days (t). (∑ km * t) / (main track-km * 365).
An alternative and simplified way to calculate this KPI is to use the planned average duration per pos-session instead. t_avg * (∑ km) / (main track-km * 365).
At some IMs the value for planned possessions could be taken from the Network Statement
% of main track-km-days
KPI (High Level In-dustry)
44 Possessions utilized Percentage of planned possessions for IMs activi-ties included in the yearly timetable, including maintenance, enhancement and renewals which are executed; This is calculated as the sum of all the possessions' main track-km-days actually used divided by the sum of all the possessions' main track-km-days planned
% of planned pos-sessions
KPI (Benchmarking)
45 Time loss due to permanent speed restrictions
Average time loss in minutes per km (i.e. additional travel time) experienced by trains due to permanent speed restrictions related to the original function of the infrastructure (maximum line speed), included in the yearly timetable
Minutes per thou-sand main track-km
Additional perfor-mance indicator
46 Time loss due to temporary speed restrictions
Average time loss in minutes per km (i.e. additional travel time) experienced by trains due to temporary speed restrictions related to the original function of the infrastructure (maximum line speed), not in-cluded in the yearly timetable
Minutes per thou-sand main track-km
Additional perfor-mance indicator
47 Congested tracks Length of main tracks of congested infrastructure according to Article 47(1) of Directive 2012/34/EU (in respect of the situation at the end of the report-ing period) (Source: European Commission, RMMS)
Main track-km Additional perfor-mance indicator
48 Congested nodes Number of nodes of congested infrastructure ac-cording to Article 47(1) of Directive 2012/34/EU (in respect of the situation at the end of the reporting period). (Source: European Commission, RMMS)
Number Additional perfor-mance indicator
49 Rejected path allocations Number of rejected path allocation requests during the year compared to total number of path alloca-tion requests. Both scheduled and ad hoc requests for passenger and freight train paths should be summarised (Source: European Commission, RMMS)
% of path allocation requests
Additional perfor-mance indicator
Condition
The measurement of asset condition is complex, and not always straight forward for a single IM,
nevermind as a comparative metric for use in benchmarking. Therefore the PRIME condition cate-
gory describes the condition of the asset primarily in terms of how well it functions (i.e. number of
failures) and in terms of the impact of condition of the assets on the expected delivery of the network,
in terms of temporary and permanent speed restrictions.
The KPIs for condition are based on earlier work from UIC and EIM. KPIs are reused from working
groups within EIM with minor adjustments, and the UIC Code 450- 2 is used to define the type of
failures used for each KPI.
Version 3.1 – 24th May 2019 19
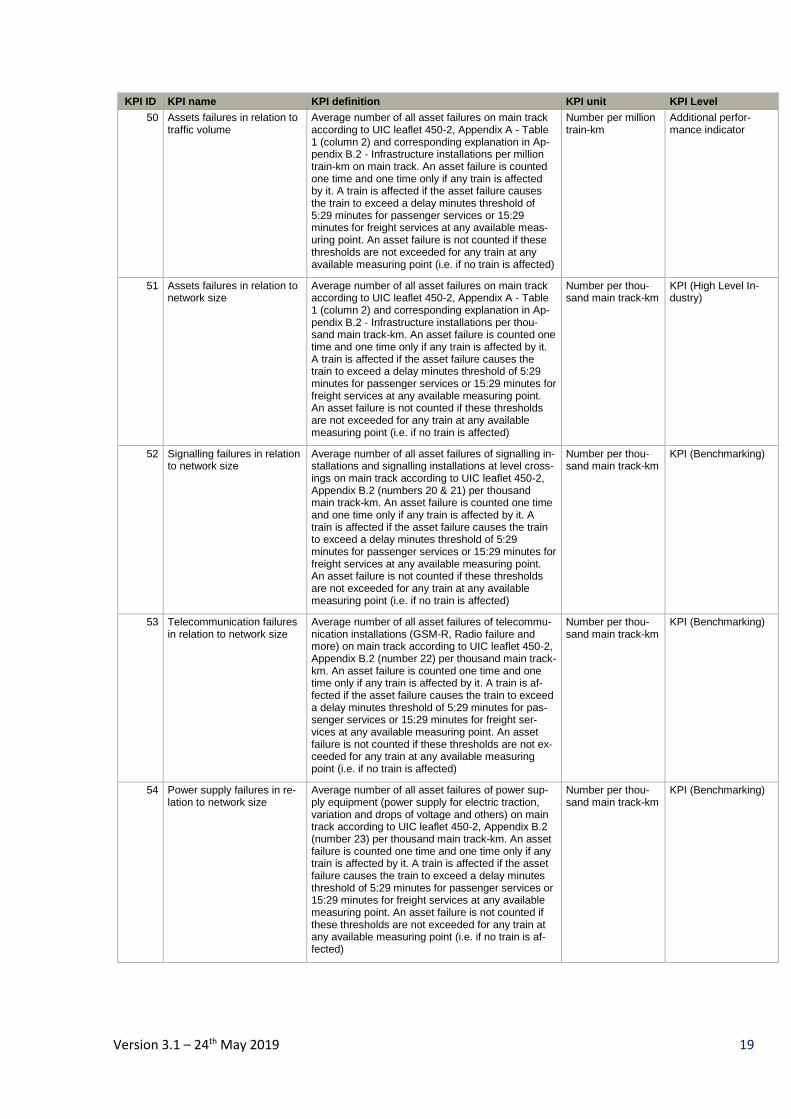
KPI ID KPI name KPI definition KPI unit KPI Level
50 Assets failures in relation to traffic volume
Average number of all asset failures on main track according to UIC leaflet 450-2, Appendix A - Table 1 (column 2) and corresponding explanation in Ap-pendix B.2 - Infrastructure installations per million train-km on main track. An asset failure is counted one time and one time only if any train is affected by it. A train is affected if the asset failure causes the train to exceed a delay minutes threshold of 5:29 minutes for passenger services or 15:29 minutes for freight services at any available meas-uring point. An asset failure is not counted if these thresholds are not exceeded for any train at any available measuring point (i.e. if no train is affected)
Number per million train-km
Additional perfor-mance indicator
51 Assets failures in relation to network size
Average number of all asset failures on main track according to UIC leaflet 450-2, Appendix A - Table 1 (column 2) and corresponding explanation in Ap-pendix B.2 - Infrastructure installations per thou-sand main track-km. An asset failure is counted one time and one time only if any train is affected by it. A train is affected if the asset failure causes the train to exceed a delay minutes threshold of 5:29 minutes for passenger services or 15:29 minutes for freight services at any available measuring point. An asset failure is not counted if these thresholds are not exceeded for any train at any available measuring point (i.e. if no train is affected)
Number per thou-sand main track-km
KPI (High Level In-dustry)
52 Signalling failures in relation to network size
Average number of all asset failures of signalling in-stallations and signalling installations at level cross-ings on main track according to UIC leaflet 450-2, Appendix B.2 (numbers 20 & 21) per thousand main track-km. An asset failure is counted one time and one time only if any train is affected by it. A train is affected if the asset failure causes the train to exceed a delay minutes threshold of 5:29 minutes for passenger services or 15:29 minutes for freight services at any available measuring point. An asset failure is not counted if these thresholds are not exceeded for any train at any available measuring point (i.e. if no train is affected)
Number per thou-sand main track-km
KPI (Benchmarking)
53 Telecommunication failures in relation to network size
Average number of all asset failures of telecommu-nication installations (GSM-R, Radio failure and more) on main track according to UIC leaflet 450-2, Appendix B.2 (number 22) per thousand main track-km. An asset failure is counted one time and one time only if any train is affected by it. A train is af-fected if the asset failure causes the train to exceed a delay minutes threshold of 5:29 minutes for pas-senger services or 15:29 minutes for freight ser-vices at any available measuring point. An asset failure is not counted if these thresholds are not ex-ceeded for any train at any available measuring point (i.e. if no train is affected)
Number per thou-sand main track-km
KPI (Benchmarking)
54 Power supply failures in re-lation to network size
Average number of all asset failures of power sup-ply equipment (power supply for electric traction, variation and drops of voltage and others) on main track according to UIC leaflet 450-2, Appendix B.2 (number 23) per thousand main track-km. An asset failure is counted one time and one time only if any train is affected by it. A train is affected if the asset failure causes the train to exceed a delay minutes threshold of 5:29 minutes for passenger services or 15:29 minutes for freight services at any available measuring point. An asset failure is not counted if these thresholds are not exceeded for any train at any available measuring point (i.e. if no train is af-fected)
Number per thou-sand main track-km
KPI (Benchmarking)
Version 3.1 – 24th May 2019 20
KPI ID KPI name KPI definition KPI unit KPI Level
55 Track failures in relation to network size
Average number of all track failures (rail breakage, lateral distortion and other track failures) on main track according to UIC leaflet 450-2, Appendix B.2 (number 24) per thousand main track-km. An asset failure is counted one time and one time only if any train is affected by it. A train is affected if the asset failure causes the train to exceed a delay minutes threshold of 5:29 minutes for passenger services or 15:29 minutes for freight services at any available measuring point. An asset failure is not counted if these thresholds are not exceeded for any train at any available measuring point (i.e. if no train is af-fected)
Number per thou-sand main track-km
KPI (Benchmarking)
56 Structure failures in relation to network size
Average number of all asset failures of structures (tunnels, bridges) on main track according to UIC leaflet 450-2, Appendix B.2 (number 25) per thou-sand main track-km. An asset failure is counted one time and one time only if any train is affected by it. A train is affected if the asset failure causes the train to exceed a delay minutes threshold of 5:29 minutes for passenger services or 15:29 minutes for freight services at any available measuring point. An asset failure is not counted if these thresholds are not exceeded for any train at any available measuring point (i.e. if no train is affected)
Number per thou-sand main track-km
KPI (Benchmarking)
57 Other infrastructure failures in relation to network size
Average number of all asset failures due to the managing and planning of staff and other causes related to infrastructure installations on main track according to UIC leaflet 450-2, Appendix B.2 (num-bers 28 & 29) per thousand main track-km. An as-set failure is counted one time and one time only if any train is affected by it. A train is affected if the asset failure causes the train to exceed a delay minutes threshold of 5:29 minutes for passenger services or 15:29 minutes for freight services at any available measuring point. An asset failure is not counted if these thresholds are not exceeded for any train at any available measuring point (i.e. if no train is affected)
Number per thou-sand main track-km
KPI (Benchmarking)
58 Tracks with permanent speed restrictions
Percentage of tracks with permanent speed re-striction due to deteriorating asset condition weighted by the time the restrictions are in place (included in the yearly timetable) related to total main track-km; restrictions are counted whenever criterion is met regardless of whether IM reports permanent speed restrictions as such or if they are included in the timetable
% of main track-km KPI (Benchmarking)
59 Tracks with temporary speed restrictions
Percentage of tracks with temporary speed re-striction due to deteriorating asset condition weighted by the time the restrictions are in place (not included in the yearly timetable) related to total main track-km
% of main track-km KPI (High Level In-dustry)
Financial
The Financial dimension covers all elements related to all expenditures and financial income of IMs,
including track access charges. It is intended to provide understanding of the structure and the level
of costs and revenues of an IM in relation to other IMs.
The objectives of the Financial dimension are to:
• Support delivery of a cost-effective railway, through identification and implementation of good
practices and processes;
• Identify and encourage opportunities to increase revenues from all sources;
Version 3.1 – 24th May 2019 21
• Understand the impact of charging and charges on IMs and the whole railway industry; and
• Support making the case for appropriate and effective investment in the railway.
The Financial dimension contains two categories: Costs and Revenues
Costs
The Costs category includes all the costs incurred by the IM, broken down into useful and compara-ble sub-categories. It includes all Operating, Capital and Investment costs. For purposes of compar-ison, costs will be adjusted where appropriate to reflect local costs using purchasing power parities (PPPs). The costs incurred by an IM will be dependent on a number of factors: some within and some outside the management responsibility of the IM. The background information collected by the PRIME project and set out in Appendix 2 are very useful in interpreting the financial data.
KPI ID KPI name KPI definition KPI unit KPI Level
60 OPEX – operational ex-penditures in relation to net-work size
Total IMs annual operational expenditures per main track-km
Euro per main track-km
KPI (High Level In-dustry)
61 OPEX – operational ex-penditure in relation to traffic volume
Total IMs annual operational expenditures per train-km
Euro per train-km Additional perfor-mance indicator
62 Maintenance expenditures in relation to network size
Total IMs annual maintenance expenditures per main track-km
Euro per main track-km
KPI (Benchmarking)
63 Maintenance expenditures in relation to traffic volume
Total IMs annual maintenance expenditures per train-km
Euro per train-km Additional perfor-mance indicator
64 Traffic management ex-penditures in relation to net-work size
Total IMs annual traffic management expenditures per main track-km
Euro per main track-km
KPI (Benchmarking)
65 Traffic management ex-penditures in relation to traf-fic volume
Total IMs annual traffic management expenditures per train-km
Euro per train-km Additional perfor-mance indicator
66 CAPEX – capital expendi-tures in relation to network size
Total IMs annual capital expenditures per main track-km
Euro per main track-km
KPI (High Level In-dustry)
67 CAPEX – capital expendi-tures in relation to traffic vol-ume
Total IMs annual capital expenditures per train-km Euro per train-km Additional perfor-mance indicator
68 Renewal expenditures in re-lation to network size
Total IMs annual renewal expenditures per main track-km
Euro per main track-km
KPI (Benchmarking)
69 Renewal expenditures in re-lation to traffic volume
Total IMs annual renewal expenditures per train-km Euro per train-km Additional perfor-mance indicator
70 Investment expenditures in relation to network size
Total IMs annual investment expenditures per main track-km
Euro per main track-km
Additional perfor-mance indicator
71 Investment expenditures in relation to traffic volume
Total IMs annual investment expenditures per train-km
Euro per train-km Additional perfor-mance indicator
72 Direct expenditures in rela-tion to traffic volume
Total IMs annual direct expenditures (expenditures that are directly incurred as a result of operating the train service) per train-km
Euro per train-km Additional perfor-mance indicator
73 Share of direct expenditures in total OPEX
Percentage of IMs direct operational expenditures in the meaning of Regulation (EU)2015/909 (ex-penditures that are directly incurred as a result of operating the train service) related to total OPEX
% of monetary value
Additional perfor-mance indicator
74 Share of direct expenditures in total CAPEX
Percentage of IMs direct capital expenditures in the meaning of Regulation (EU)2015/909 (expenditures that are directly incurred as a result of operating the train service) related to total CAPEX
% of monetary value
Additional perfor-mance indicator
75 Renewal expenditures fi-nanced with grants
Percentage of IMs renewal expenditures financed with grants related to total renewal expenditures
% of monetary value
Additional perfor-mance indicator
76 Enhancement expenditures financed with grants
Percentage of IMs enhancement expenditures fi-nanced with grants related to total enhancement ex-penditures
% of monetary value
Additional perfor-mance indicator
77 Investment expenditures fi-nanced with grants
Percentage of IMs investment expenditures fi-nanced with grants related to total investment ex-penditures
% of monetary value
Additional perfor-mance indicator
Version 3.1 – 24th May 2019 22
KPI ID KPI name KPI definition KPI unit KPI Level
78 Proportion of renewal ex-penditures in total renewal and maintenance expendi-tures
Percentage of IMs renewal expenditures related to total renewal and maintenance expenditures
% of monetary value
Additional perfor-mance indicator
79 Proportion of enhancement and investment expendi-tures in total expenditures
Percentage of IMs enhancement and investment expenditures related to total expenditures
% of monetary value
Additional perfor-mance indicator
Revenues
The Revenue category provides a summary of the total non-track access revenue ‘earned’ by an IM, excluding subsidies and property development. Furthermore, it measures and compares that ele-ment of an IM’s revenue that comes from charges from operators using its network and service facilities. To achieve meaningful comparability, the indicators for charging have been simplified and PRIME is using fundamental KPIs that all IMs find common and easy to collect.Together with the Costs KPIs, it provides an indication of to what extent an IM is capable of covering its costs, and to what extent it relies on subsidy.
KPI ID KPI name KPI definition KPI unit KPI Level
80 Total revenues from non-ac-cess charges in relation to network size
Total IMs annual revenues from non-access charges (e.g. commercial letting, advertising, tele-coms but excluding grants or subsidies) related to total main track-km
Euro per main track-km
KPI (High Level In-dustry)
81 Proportion of TAC in total revenue
Percentage of IMs annual TAC revenues (including freight, passenger and touristic trains) compared to total revenues
% of monetary value
KPI (Benchmarking)
82 TAC revenue in relation to traffic volume
Total IMs annual TAC revenues (including freight, passenger and touristic trains) per train-km
Euro per total train-km
Additional perfor-mance indicator
83 TAC revenue in relation to traffic volume - Freight
Total IMs annual freight TAC revenues per freight train-km
Euro per total freight train-km
Additional perfor-mance indicator
84 TAC revenue in relation to traffic volume - Passenger
Total IMs annual passenger TAC revenues (includ-ing touristic trains) per passenger train-km
Euro per passenger train-km
Additional perfor-mance indicator
85 TAC revenue in relation to traffic volume - Passenger conventional
Total IMs annual passenger conventional train TAC revenues (excluding touristic trains) compared to to-tal passenger conventional train-km
Euro per conven-tional passenger train-km
Additional perfor-mance indicator
86 TAC revenue in relation to traffic volume - Passenger high speed
Total IMs annual passenger high speed train TAC revenues (excluding touristic trains) compared to to-tal passenger high speed train-km
Euro per high speed passenger train-km
Additional perfor-mance indicator
87 TAC revenue in relation to network size
Total IMs annual TAC revenues (including freight, passenger and touristic trains) compared to total main track-km
Euro per main track-km
KPI (High Level In-dustry)
88 TAC revenue in relation to network size - Passenger conventional
Total IMs annual passenger conventional train TAC revenues (excluding touristic trains) compared to to-tal conventional main track-km
Euro per conven-tional main track-km
Additional perfor-mance indicator
89 TAC revenue in relation to network size - High speed
Total IMs annual passenger high speed train TAC revenues (excluding touristic trains) compared to to-tal high speed main track-km
Euro per high speed main track-km
Additional perfor-mance indicator
90 Proportion of revenues for station access
Total IMs annual revenues for station access (in-cluding passenger and touristic trains) compared to total revenue
% of monetary value
Additional perfor-mance indicator
91 Income from incentive re-gimes in relation to network size
Total IMs annual income from incentive/perfor-mance regimes with customers (if applicable, no public grants or state subsidies) per main track-km
Euro per main track-km
KPI (Benchmarking)
Further details are provided in Appendix 4.
Growth
The dimension Growth describes the level of use of the existing network, network expansion, inte-
gration with other transport modes and use of technology such as ERTMS to improve delivery.
Version 3.1 – 24th May 2019 23
The objectives of this dimension are to understand the opportunities to:
• Improve the use of the overall capacity of the railway network;
• Encourage modal shift to rail from road and air;
• Promote multi-modal transport integration;
• Understand and use new technology, such as ERTMS, effectively and efficiently to support the
objectives of the IM and the integrated railway.
Utilisation
Utilisation is an essential measure of the performance of an IM. One of the most important objectives
for an IM is to use its infrastructure as effectively as possible. This measure also distinguishes be-
tween passenger and freight traffic. Utilisation has a major impact on the ability of an IM to cover its
costs and the utilisation of the infrastructure will also affect the future performance (other KPIs) of
the infrastructure, e.g. overall condition.
KPI ID KPI name KPI definition KPI unit KPI Level
92 Degree of network utilisation – all trains
Average daily train-km on main track (passenger and freight revenue service only, no shunting, no work trains) related to main track-km
Daily train-km per main track-km
KPI (High Level In-dustry)
93 Degree of network utilisation – passenger trains
Average daily passenger train-km on main track (revenue service only, no shunting, no work trains) related to main track-km
Daily passenger train–km per main track-km
KPI (Benchmarking)
94 Degree of network utilisation – freight trains
Average daily freight train-km on main track (reve-nue service only, no shunting, no work trains) re-lated to main track-km
Daily freight train–km per main track-km
KPI (Benchmarking)
95 Degree of network utilisation – gross tonne-km
Average daily gross tonne-km on main track (pas-senger and freight revenue service only, no shunt-ing, no work trains) related to main track-km
Daily gross tonne-km per main track–km
Additional perfor-mance indicator
96 Degree of network utilisation - double track
Double track line: track-km with traffic volumes >= 200 trains per day (average)
track-km with traffic >= 200 trains a day per total double track-km
Additional perfor-mance indicator
97 Degree of network utilisation - single Track
Single track line: track-km with traffic volumes >= 70 trains per day (average)
track-km with traffic >= 70 trains a day per total single track-km
Additional perfor-mance indicator
Asset Capability & ERTMS
Asset capability describes the functionality of the IM’s railway network. It provides the overview of
the capability of the network and specifically the extent to which the network meets the TEN-T re-
quirements. The asset capability describes the IM’s part of the interoperability of the European rail-
way network, although it is recognised that achievement of interoperability requires capability and
functionality from the railway operators as well. Indicators relating to asset capability and ERTMS
are described further below.
ERTMS and the deployment of ERTMS is a complex but major topic for the rail sector. While de-
ployment of ERTMS is costly, it is also often not solely to the responsibility of IMs to choose to deploy
ERTMS on their networks. However, ERTMS is crucial for IMs in many ways and may influence
some of the core functions of IMs.The potential benefits of ERTMS deployment are significant, in-
cluding increased safety, capacity, availability, and interoperability. As the KPIs are developed,
PRIME is keen to understand the potential benefits and the business case for the deployment of
ERTMS, as well as supporting the objective of delivering an interoperable cross-border network.
Version 3.1 – 24th May 2019 24
KPI ID KPI name KPI definition KPI unit KPI Level
98 ERTMS track-side deploy-ment
Main tracks with ERTMS in operation in proportion to total main tracks (measured in track-km)
% of main track-km KPI (Benchmarking)
99 Train-km with ERTMS in op-eration
Train-km on main tracks run with ERTMS in opera-tion compared to total train-km on main tracks
% of train-km Additional perfor-mance indicator
100 Planned extent of ERTMS deployment by 2020
In 2020, the percentage of main track-km planned to have been deployed with ERTMS, i.e. main tracks equipped with both - ETCS (European train control system; any baseline or level) and GSM-R (Global System for Mobile Communications); and where ETCS and GSM-R are used in service
% of current main track-km
Additional perfor-mance indicator
101 Planned extent of ERTMS deployment by 2030
In 2030, the percentage of main track-km planned to have been deployed with ERTMS, i.e. main tracks equipped with both - ETCS (European train control system; any baseline or level) and GSM-R (Global System for Mobile Communications); and where ETCS and GSM-R are used in service
% of current main track-km
KPI (Benchmarking)
102 TEN-T core network-lines with ERTMS in operation
Percentage of TEN-T core network line main track-km with ERTMS in operation, i.e. main tracks equipped with both - ETCS (European train control system; any baseline or level) and GSM-R (Global System for Mobile Communications); and where ETCS and GSM-R are used in service (Source "TEN-T core network line main track-km": EC TENtec Database)
% of main track-km Additional perfor-mance indicator
103 Train-km with ERTMS in op-eration on TEN-T core net-work lines
Percentage of TEN-T core network line train-km with ERTMS in operation, i.e. main tracks equipped with both - ETCS (European train control system; any baseline or level) and GSM-R (Global System for Mobile Communications); and where ETCS and GSM-R are used in service
% of train-km Additional perfor-mance indicator
104 Planned extent of ERTMS deployment by 2020 on TEN-T core network lines
In 2020, the percentage of main track-km TEN-T core network lines planned to have been deployed with ERTMS, i.e. main tracks equipped with both - ETCS (European train control system; any baseline or level) and GSM-R (Global System for Mobile Communications); and where ETCS and GSM-R are used in service (Source "TEN-T core network line main track-km": EC TENtec Database)
% of current main track-km
Additional perfor-mance indicator
105 Planned extent of ERTMS deployment by 2030 on TEN-T core network lines
In 2030, the percentage of main track-km TEN-T core network lines planned to have been deployed with ERTMS, i.e. main tracks equipped with both - ETCS (European train control system; any baseline or level) and GSM-R (Global System for Mobile Communications); and where ETCS and GSM-R are used in service (Source "TEN-T core network line main track-km": EC TENtec Database)
% of current main track-km
Additional perfor-mance indicator
106 Axle load Proportion of the TEN-T core network permitting at least 22.5 t axle load (INF) (Source EC TENtec Da-tabase)
% of main track-km Additional perfor-mance indicator
107 Gauge Proportion of the TEN-T core network with nominal track gauge of 1435 mm (INF) (Source EC TENtec Database)
% of main track-km Additional perfor-mance indicator
108 Line Speed Proportion of the TEN-T core network permitting 110 km/h line speed (INF) (Source EC TENtec Da-tabase)
% of main track-km Additional perfor-mance indicator
109 Train length Proportion of the TEN-T core network permitting 740 m train length (INF) (Source EC TENtec Data-base)
% of main track-km Additional perfor-mance indicator
110 Electrification Proportion of the fully electrified TEN-T core net-work, supported with electrified sidings necessary for electric train operations (INF) (Source EC TENtec Database)
% of main track-km Additional perfor-mance indicator
Intermodality
A highly functional intermodality between different transport modes can bring traffic and business to
the rail network. Since trains rarely offer a door-to-door solution, and rather are a part of the mobility
Version 3.1 – 24th May 2019 25
chain, connections between modes become essential for the customers. Intermodality promotes ef-
ficiency for both freight and passenger traffic. Intermodality also increases the number of potential
customers for rail. For the purposes of PRIME, intermodality also includes a measure of those sta-
tions which have access for those who are mobility impaired.
KPI ID KPI name KPI definition KPI unit KPI Level
112 Electrified multimodal rail freight terminals
Percentage of multimodal rail freight terminals ac-cessible to electrified trains, i.e. a structure equipped for transhipment rail and other transport modes (Source European Commission, RMMS)
% of multimodal freight terminals
Additional perfor-mance indicator
113 Core maritime ports connec-tion
Percentage of core maritime ports linked to the TEN-T core network connected to the rail network
% of core maritime ports
Additional perfor-mance indicator
114 Core inland waterways con-nection
Percentage of core inland waterways linked to the TEN-T core network connected to the rail network
% of core inland waterways
Additional perfor-mance indicator
115 Core airports connection Percentage of core airports linked to the TEN-T core network connected to the rail network
% of core airports Additional perfor-mance indicator
116 Intermodal stations Percentage of public passenger railway stations with connections to public urban transport (metro, bus, tramways, light rail, ferries etc.…) within the entire railway infrastructure network, independent of ownership (Source "Passenger stations": European Commission, RMMS)
% of passenger stations
KPI (Benchmarking)
117 Passengers using accessi-ble stations
Percentage of passengers registered annually in all accessible stations within the entire railway infra-structure network, independent of ownership, re-lated to the total number of passengers. An acces-sible station is one on which a passenger can, from entering the station, reach the platform via level-ac-cess, without steps or equivalent.
% of passengers KPI (Benchmarking)
Version 3.1 – 24th May 2019 26
Appendix 1: Input Data items
Context
Input ID Data label Data definition Data unit
1 Total track-km A cumulative length of all tracks maintained by the infra-structure manager
km
2 Total multiple main track-km Total main track-km on lines which consist of multiple tracks
km
3 Total single main track-km Total main track-km on lines which consist of a single track
km
4 Total electrified main track-km Total main track-km which are electrified km
5 Total main track-km A track providing end-to-end line continuity designed for trains between stations or places indicated in tariffs as in-dependent points of departure or arrival for the conveyance of passengers or goods, maintained and operated by the infrastructure manager. Tracks at service facilities not used for running trains are excluded. The boundary of the service facility is the point at which the railway vehicle leaving the service facility cannot pass without having an authorization to access the mainline or other similar line. This point is usually identified by a sig-nal. Service facilities are passenger stations, their buildings and other facilities; freight terminals; marshalling yards and train formation facilities, including shunting facilities; storage sid-ings; maintenance facilities; other technical facilities, in-cluding cleaning and washing facilities; maritime and in-land port facilities which are linked to rail activities; relief facilities; refuelling facilities and supply of fuel in these fa-cilities.
km
6 Total passenger conventional main track-km
Total main track-km on lines which consist of a single track km
7 Total passenger high speed main track-km
Total passenger high speed main track-km km
8 Total track-km with traffic vol-umes >= 200 trains a day
Total track-km with traffic volumes >= 200 trains a day km
9 Total track-km with traffic vol-umes >= 70 trains a day
Total track-km with traffic volumes >= 70 trains a day km
10 Total main line-km Cumulative length of railway lines operated and used for running trains by the end of reporting year. Lines solely used for operating touristic trains and heritage trains are excluded as are railways constructed solely to serve mines, forests or other industrial or agricultural instal-lations and which are not open to public traffic. Metro, Tram and Light rail urban lines (with non-standard – narrow - gauge) should be excluded. Private lines closed to public traffic and functionally sepa-rated (i.e. stand-alone) networks should be excluded. Pri-vate lines used for own freight transport activities or for non-commercial passenger services and light rail lines occa-sionally used by heavy rail vehicles for connectivity or transit purposes are excluded.
km
Version 3.1 – 24th May 2019 27
Safety, Security & Environment
Safety
Input ID Data label Data definition Data unit
13 Number of significant accidents Number of significant accidents including sidings, exclud-ing accidents in workshops, warehouses and depots based on the following types of accidents (primary acci-dents): - Collision of train with rail vehicle - Collision of train with obstacle within the clearance gauge - Derailment of train - Level crossing accident, including accident involving pe-destrians at level crossing - Accident to persons involving rolling stock in motion, with the exception of suicides and attempted suicides - Fire on rolling stock - Other accident
The boundary is the point at which the railway vehicle
leaving the workshop/warehouse/depot/sidings cannot
pass without having an authorization to access the main-
line or other similar line. This point is usually identified by
a signal.
For further guidance, please see ERA Implementation
Guidance on CSIs.
number
14 Number of persons seriously injured and killed
Number of persons seriously injured (i.e. hospitalised for more than 24 hours, excluding any attempted suicide) and killed (i.e. killed immediately or dying within 30 days, ex-cluding any suicide) by accidents based upon following categories - Passenger - Employee or contractor - Level crossing user - Trespasser - Other person at a platform - Other person not at a platform
number
15 Number of suicides and at-tempted suicides
Number of suicides and attempted suicides. number
16 Number of suicides Number of suicides number
17 Number of attempted suicides Number of attempted suicides. number
18 Number of precursors to acci-dents
Number of the following types of precursors: - broken rail - track buckle and track misalignment - wrong-side signalling failure
number
19 Number of IMs employees killed and seriously injured while at work at IMs premises
Number of IMs employees, contracted consultants and contractors seriously injured (i.e. hospitalised for more than 24 hours, excluding any attempted suicide) and killed (i.e. killed immediately or dying within 30 days, excluding any suicide) by accidents while at work at IMs premises
number
20 Number of IMs employees killed and seriously injured while at work at trackside
Number of IMs employees, contracted consultants and contractors seriously injured (i.e. hospitalised for more than 24 hours, excluding any attempted suicide) and killed (i.e. killed immediately or dying within 30 days, excluding any suicide) by accidents while at work at trackside
number
Security
Input ID Data label Data definition Data unit
21 Delay minutes due to security incidents
Number of delay minutes due to security incidents (inten-tional acts as terrorism, sabotage, cyber-attacks, vandal-ism, thefts, espionage, unauthorized persons and other acts of aggression or hooliganism)
minute
Version 3.1 – 24th May 2019 28
Input ID Data label Data definition Data unit
22 Number of cancelled trains due to security incidents
Number of trains cancelled caused by security incidents (in-tentional acts as terrorism, sabotage, cyber-attacks, van-dalism, thefts, espionage, unauthorized persons and other acts of aggression or hooliganism)
number
23 Number of people killed or seri-ously injured due to security in-cidents
Number of people seriously injured (i.e. hospitalised for more than 24 hours) and killed (i.e. killed immediately or dying within 30 days) due to security incidents (i.e. inten-tional acts as terrorism, sabotage, cyber-attacks, vandal-ism, thefts, espionage, unauthorized persons and other acts of aggression or hooliganism)
number
Environment
Input ID Data label Data definition Data unit
24 CO2 emission produced from maintenance rolling stock
Tonnes of carbon dioxide emission produced from the ac-tivity of maintenance rolling stock
tCO
25 Amount of reused, recycled and recovered waste
Amount of reused, recycled and recovered waste linked to track and trackside
tonnes
26 Total produced waste Total produced waste linked to track and trackside tonnes
27 Number of rail related environ-mental incidents
Number of rail related environmental incidents with major and significant impact or effect
number
28 Number of citizens exposed to noise
Total number of citizens exposed to ≥ 50 dB at night number
29 Refusal of requested train paths due to noise
Number of not awarded requested train paths due to noise number
30 Total number of requested train paths
Total number of requested train paths number
31 Length of noise barriers Length of noise barriers in main line-km km
32 Length of track equipped with rail absorbers
Length of track equipped with Rail absorbers in main track-km
km
Performance
Punctuality
Input ID Data label Data definition Data unit
33 Number of all trains scheduled to be operated
Total number of national and international passenger and freight trains (excluding work trains) scheduled to be oper-ated, including those timetabled at short notice but exclud-ing replacement trains due to cancellations to avoid double counting
trains
34 Trains arrived at strategic measuring points with a delay of less than or equal to 5:29 minutes (passengers) or 15:29 minutes (freight) respectively
Total number of national and international passenger and freight trains (excluding work trains) which arrive at each measuring point with a delay of less than or equal to 5:29 minutes for passenger services and 15:29 minutes for freight services
trains
35 Number of scheduled trains that operated
Total number of national and international passenger and freight trains (excluding work trains) actually operated (i.e. were not cancelled) out of those that were scheduled in the original working timetable, including those timetabled at short notice
trains
36 Passenger trains arrived at strategic measuring points with a delay of less than or equal to 5:29 minutes
Total number of national and international passenger trains (excluding freight and work trains) which arrive at each strategic measuring point with a delay of less than or equal to 5:29 minutes
trains
37 Number of scheduled passen-ger trains that operated
Total number of national and international passenger trains (excluding freight and work trains) actually operated (i.e. were not cancelled) out of those that were scheduled in the original working timetable, including those timeta-bled at short notice
trains
Version 3.1 – 24th May 2019 29
Input ID Data label Data definition Data unit
38 Freight trains arrived at strate-gic measuring points with a de-lay of less than or equal to 15:29 minutes
Total number of national and international freight trains (excluding passenger and work trains) which arrive at each strategic measuring point with a delay of less than or equal to 15:29 minutes
trains
39 Number of scheduled freight trains that operated
Total number of national and international freight trains (excluding passenger and work trains) actually operated (i.e. were not cancelled) out of those that were scheduled in the original working timetable, including those timeta-bled at short notice
trains
40 Delay minutes - IM's responsi-bility
Delay minutes caused by incidents that are regarded as IMs responsibility according to UIC leaflet 450-2, Appen-dix A - Table 1 (columns 1, 2 and 3) and corresponding explanation in appendices B.1, B.2 and B.3. Delay minutes will be measured at all available measuring points. Of those measured delay minutes that exceed a threshold of 5:29 minutes for passenger services and 15:29 minutes for freight services the maximum number is counted. No delay minutes are counted if these thresholds are not exceeded at any measuring point
minute
41 Delay minutes - Weather Delay minutes caused by weather incidents which have led to disruptions in the railway infrastructure. Delay minutes will be measured at all available measuring points. Of those measured delay minutes that exceed a threshold of 5:29 minutes for passenger services and 15:29 minutes for freight services the maximum number is counted. No delay minutes are counted if these thresholds are not exceeded at any measuring point
minute
42 Cancellations of scheduled pas-senger trains - IM's responsibil-ity
Number of fully or partially cancelled national and interna-tional passenger trains that are included in the last time table issued the day before the service (or the time table that is valid when the train service takes place) caused by incidents that are regarded as IMs responsibility according to UIC leaflet 450-2, Appendix A - Table 1 (columns 1, 2 and 3) and corresponding explanation in appendices B.1, B.2 and B.3. Including all types of cancelled trains such as full cancellation (cancelled at origin), part cancellation en route, part cancellation changed origin, part cancellation diverted
trains
43 Cancellations of scheduled pas-senger trains - total
Total number of fully or partially cancelled national and in-ternational passenger trains that are included in the last time table issued the day before the service (or the time table that is valid when the train service takes place). In-cluding all types of cancelled trains such as full cancella-tion (cancelled at origin), part cancellation en route, part cancellation changed origin, part cancellation diverted
trains
Reliability
Input ID Data label Data definition Data unit
44 Total delay minutes - Asset fail-ures
Delay minutes caused by all asset failures on main track according to UIC leaflet 450-2, Appendix A - Table 1 (col-umn 2) and corresponding explanation in Appendix B.2 - Infrastructure installations. Delay minutes will be meas-ured at all available measuring points. Of those measured delay minutes that exceed a threshold of 5:29 minutes for passenger services and 15:29 minutes for freight services the maximum number is counted. No delay minutes are counted if these thresholds are not exceeded at any measuring point
minute
Version 3.1 – 24th May 2019 30
Input ID Data label Data definition Data unit
45 Total delay minutes - Signalling failures
Delay minutes caused by asset failures of signalling instal-lations and signalling installations at level crossings on main track according to UIC leaflet 450-2, Appendix B.2 (numbers 20 & 21). Delay minutes will be measured at all available measuring points. Of those measured delay minutes that exceed a threshold of 5:29 minutes for pas-senger services and 15:29 minutes for freight services the maximum number is counted. No delay minutes are counted if these thresholds are not exceeded at any measuring point
minute
46 Total delay minutes - Telecom-munication failures
Delay minutes caused by asset failures of telecommunica-tion installations (GSM-R, Radio failure and more) on main track according to UIC leaflet 450-2, Appendix B.2 (number 22). Delay minutes will be measured at all availa-ble measuring points. Of those measured delay minutes that exceed a threshold of 5:29 minutes for passenger services and 15:29 minutes for freight services the maxi-mum number is counted. No delay minutes are counted if these thresholds are not exceeded at any measuring point
minute
47 Total delay minutes - Power supply failures
Delay minutes caused by asset failures of power supply equipment (power supply for electric traction, variation and drops of voltage and others) on main track according to UIC leaflet 450-2, Appendix B.2 (number 23). Delay minutes will be measured at all available measuring points. Of those measured delay minutes that exceed a threshold of 5:29 minutes for passenger services and 15:29 minutes for freight services the maximum number is counted. No delay minutes are counted if these thresholds are not exceeded at any measuring point
minute
48 Total delay minutes - Track fail-ures
Delay minutes caused by track failures (rail breakage, lat-eral distortion and other track failures) on main track ac-cording to UIC leaflet 450-2, Appendix B.2 (number 24). Delay minutes will be measured at all available measuring points. Of those measured delay minutes that exceed a threshold of 5:29 minutes for passenger services and 15:29 minutes for freight services the maximum number is counted. No delay minutes are counted if these thresholds are not exceeded at any measuring point
minute
49 Total delay minutes - Other causes
Delay minutes caused by asset failures due to the manag-ing and planning of staff and other causes related to infra-structure installations on main track according to UIC leaf-let 450-2, Appendix B.2 (numbers 28 & 29). Delay minutes will be measured at all available measuring points. Of those measured delay minutes that exceed a threshold of 5:29 minutes for passenger services and 15:29 minutes for freight services the maximum number is counted. No delay minutes are counted if these thresholds are not ex-ceeded at any measuring point
minute
50 Total delay minutes - Structure failures
Delay minutes caused by asset failures of structures (tun-nels, bridges) on main track according to UIC leaflet 450-2, Appendix B.2 (number 25). Delay minutes will be meas-ured at all available measuring points. Of those measured delay minutes that exceed a threshold of 5:29 minutes for passenger services and 15:29 minutes for freight services the maximum number is counted. No delay minutes are counted if these thresholds are not exceeded at any measuring point
minute
51 Total delay minutes - Weather effects
Delay minutes caused by effects of weather or natural causes (fog, avalanches, snowfall, mudslides, storms, gales, wheel slide or slip due to leaves on the line, floods) on main track according to UIC leaflet 450-2, Appendix B.8 (number 83). Delay minutes will be measured at all available measuring points. Of those measured delay minutes that exceed a threshold of 5:29 minutes for pas-senger services and 15:29 minutes for freight services the maximum number is counted. No delay minutes are counted if these thresholds are not exceeded at any measuring point
minute
Version 3.1 – 24th May 2019 31
Delivery
Capacity
Input ID Data label Data definition Data unit
52 Annual total main track-km-days planned for IM’s activities
Annual total main track-km-days planned for IMs activities, including maintenance, enhancement and renewals on main tracks. Planned work in the yearly time table. This is calculated as the number of main track-km planned for IMs activities (km) multiplied with its duration in days (t); (∑ km * t); Example: 10 km*30 days + 20 km*50 days = 1300 km-days.
An alternative and simplified way to calculate this Input is to use the planned average duration per possession in-stead. t_avg * (∑ km) / (main track-km * 365).
km-days
53 Annual total main track-km-days used for IM’s activities
Annual total main track-km-days used for IMs activities, in-cluding maintenance, enhancement and renewals on main tracks. Executed work in the yearly time table. This is cal-culated as the number of main track-km planned for IMs activities (km) multiplied with its duration in days (t); (∑ km * t); Example: 10 km*30 days + 20 km*50 days = 1300 km-days .
An alternative and simplified way to calculate this Input is to use the planned average duration per possession in-stead. t_avg * (∑ km) / (main track-km * 365).
km-days
54 Total yearly time loss included in timetable
Annual total time loss in minute-km (i.e. sum of additional travel times multiplied by respective track lengths) experi-enced by trains due to permanent speed restrictions related to the original function of the infrastructure (maximum line speed), included in the yearly timetable. The method for calculating this is described in the glossary of the current PRIME KPI Catalogue
minute-km
55 Total yearly time loss not in-cluded in timetable
Annual total time loss in minute-km-days (i.e. sum of addi-tional travel times multiplied by respective track lengths multiplied by respective duration in days) experienced by trains due to temporary speed restrictions related to the original function of the infrastructure (maximum line speed), not included in the yearly timetable. The method for calcu-lating this is described in the glossary of the current PRIME KPI Catalogue
minute-km-days
Condition
Input ID Data label Data definition Data unit
60 Total number of asset failures Total number of all asset failures on main track according to UIC leaflet 450-2, Appendix A - Table 1 (column 2) and Appendix B.2 - Infrastructure installations. An asset failure is counted one time and one time only if any train is af-fected by it. A train is affected if the asset failure causes the train to exceed a delay minutes threshold of 5:29 minutes for passenger services or 15:29 minutes for freight services at any available measuring point. An asset failure is not counted if these thresholds are not exceeded for any train at any available measuring point (i.e. if no train is affected)
number
61 Total number of signalling fail-ures
Total number of asset failures of signalling installations and signalling installations at level crossings on main track according to UIC leaflet 450-2, Appendix B.2 (numbers 20 & 21). An asset failure is counted one time and one time only if any train is affected by it. A train is affected if the asset failure causes the train to exceed a delay minutes threshold of 5:29 minutes for passenger services or 15:29 minutes for freight services at any available measuring point. An asset failure is not counted if these thresholds are not exceeded for any train at any available measuring point (i.e. if no train is affected)
number
Version 3.1 – 24th May 2019 32
Input ID Data label Data definition Data unit
62 Total number of telecommuni-cation failures
Total number of asset failures of telecommunication instal-lations (GSM-R, Radio failure and more) on main track ac-cording to UIC leaflet 450-2, Appendix B.2 (number 22). An asset failure is counted one time and one time only if any train is affected by it. A train is affected if the asset failure causes the train to exceed a delay minutes thresh-old of 5:29 minutes for passenger services or 15:29 minutes for freight services at any available measuring point. An asset failure is not counted if these thresholds are not exceeded for any train at any available measuring point (i.e. if no train is affected)
number
63 Total number of power supply failures
Total number of asset failures of power supply equipment (power supply for electric traction, variation and drops of voltage and others) on main track according to UIC leaflet 450-2, Appendix B.2 (number 23). An asset failure is counted one time and one time only if any train is affected by it. A train is affected if the asset failure causes the train to exceed a delay minutes threshold of 5:29 minutes for passenger services or 15:29 minutes for freight services at any available measuring point. An asset failure is not counted if these thresholds are not exceeded for any train at any available measuring point (i.e. if no train is affected)
number
64 Total number of track failures Total number of track failures (rail breakage, lateral distor-tion and other track failures) on main track according to UIC leaflet 450-2, Appendix B.2 (number 24). A track fail-ure is counted one time and one time only if any train is affected by it. A train is affected if the asset failure causes the train to exceed a delay minutes threshold of 5:29 minutes for passenger services or 15:29 minutes for freight services at any available measuring point. An asset failure is not counted if these thresholds are not exceeded for any train at any available measuring point (i.e. if no train is affected)
number
65 Total number of other failures Total number of asset failures due to the managing and planning of staff and other causes related to infrastructure installations on main track according to UIC leaflet 450-2, Appendix B.2 (numbers 28 & 29). An asset failure is counted one time and one time only if any train is affected by it. A train is affected if the asset failure causes the train to exceed a delay minutes threshold of 5:29 minutes for passenger services or 15:29 minutes for freight services at any available measuring point. An asset failure is not counted if these thresholds are not exceeded for any train at any available measuring point (i.e. if no train is affected)
number
66 Total number of structure fail-ures
Total number of asset failures of structures (tunnels, bridges) on main track according to UIC leaflet 450-2, Ap-pendix B.2 (number 25). An asset failure is counted one time and one time only if any train is affected by it. A train is affected if the asset failure causes the train to exceed a delay minutes threshold of 5:29 minutes for passenger services or 15:29 minutes for freight services at any avail-able measuring point. An asset failure is not counted if these thresholds are not exceeded for any train at any available measuring point (i.e. if no train is affected)
number
67 Total number of weather re-lated failures
Total number of effects of weather or natural causes (fog, avalanches, snowfall, mudslides, storms, gales, wheel slide or slip due to leaves on the line, floods) on main track according to UIC leaflet 450-2, Appendix B.8 (num-ber 83). An effect of weather or natural causes is counted one time and one time only if any train is affected by it. A train is affected if the asset failure causes the train to ex-ceed a delay minutes threshold of 5:29 minutes for pas-senger services or 15:29 minutes for freight services at any available measuring point. An effect of weather or nat-ural causes is not counted if these thresholds are not ex-ceeded for any train at any available measuring point (i.e. if no train is affected)
number
Version 3.1 – 24th May 2019 33
Input ID Data label Data definition Data unit
68 Track-km with permanent speed restriction
Length (km) of tracks with permanent speed restriction due to deteriorating asset condition weighted by the time the restrictions are in place (included in the yearly timeta-ble); restrictions are counted whenever criterion is met re-gardless of whether IM reports permanent speed re-strictions as such and regardless of the status of their in-clusion in the time table
km
69 Track-km with temporary speed restriction
Length (km) of tracks with temporary speed restriction due to deteriorating asset condition weighted by the time the re-strictions are in place (not included in the yearly timetable)
km
Financial
Costs
Input ID Data label Data definition Data unit
70 Total OPEX Total IMs annual operational expenditures Local currency unit
71 Total maintenance expendi-tures
Total IMs annual maintenance expenditures Local currency unit
72 Total maintenance expendi-tures in stations
Total IMs annual maintenance expenditures in stations Local currency unit
73 Total traffic management ex-penditures
Total IMs annual traffic management expenditures Local currency unit
74 Total power consumption ex-penditures
Total IMs annual power consumption expenditures (all power consumption including traction energy)
Local currency unit
75 Total other operating expendi-tures
Total IMs annual other operating expenditures Local currency unit
76 Total financial expenditures Total IMs annual financial expenditures Local currency unit
77 Total other non operating ex-penditures
Total IMs annual other non operating expenditures Local currency unit
78 Total CAPEX Total IMs annual capital expenditures Local currency unit
79 Total renewal expenditures Total IMs annual renewal expenditures Local currency unit
80 Total renewal expenditures in stations
Total IMs annual renewal expenditures in stations Local currency unit
81 Total enhancements expendi-tures
Total IMs annual enhancement expenditures Local currency unit
82 Total enhancement expendi-tures in stations
Total IMs annual enhancement expenditures in stations Local currency unit
83 Total investment expenditures Total IMs annual investment expenditures Local currency unit
84 Total investment expenditures in stations
Total IMs annual investment expenditures in stations Local currency unit
85 Total other capital expenditures Total IMs annual other capital expenditures Local currency unit
86 Total non operating expendi-tures
Total IMs annual non operating expenditures (sum of total IMs annual other non operating expenditures and total IMs annual financial expenditures)
Local currency unit
87 Total direct expenditures Total IMs annual direct expenditures in the meaning of Regulation (EU)2015/909 (expenditures that are directly in-curred as a result of operating the train service)
Local currency unit
88 Total direct expenditures (OPEX)
Total IMs annual direct operational expenditures in the meaning of Regulation (EU)2015/909 (expenditures that are directly incurred as a result of operating the train ser-vice)
Local currency unit
89 Total direct expenditures (CAPEX)
Total IMs annual direct capital expenditures in the meaning of Regulation (EU)2015/909 (expenditures that are directly incurred as a result of operating the train service)
Local currency unit
90 Total renewal expenditures fi-nanced with grants
Total IMs annual renewal expenditures financed with grants Local currency unit
91 Total investment expenditures financed with grants
Total IMs annual investment expenditures financed with grants
Local currency unit
92 Total enhancement expendi-tures financed with grants
Total IMs annual enhancement expenditures financed with grants
Local currency unit
Version 3.1 – 24th May 2019 34
Input ID Data label Data definition Data unit
93 Sum of total renewal and maintenance expenditures
Total IMs annual renewal and maintenance expenditures (sum of total IMs annual renewal expenditures and total IMs annual maintenance expenditures)
Local currency unit
94 Sum of total enhancement and investment expenditures
Total IMs annual enhancement and investment expendi-tures (sum of total IMs annual enhancement expenditures and total IMs annual investment expenditures)
Local currency unit
95 Total expenditures Total IMs annual expenditures (sum of total IMs annual op-erational expenditures and total IMs annual non operating expenditures and total IMs annual capital expenditures)
Local currency unit
Revenues
Input ID Data label Data definition Data unit
96 Total revenues from non-ac-cess charges
Total IMs annual revenues from non-access charges (e.g. commercial letting, advertising, telecoms but excluding grants or subsidies)
Local currency unit
97 Total revenues Total IMs annual revenues (excluding grants or subsidies). Categories of access charges are: (1) Minimum Access Charge; (2) Other TAC charges; (3) Other Non-TAC charges (e.g. station access). Other revenues include e.g. commercial letting, advertising, telecoms.
Local currency unit
98 Total TAC revenues Total IMs annual TAC revenues (including freight, passen-ger and touristic trains)
Local currency unit
99 Total freight TAC revenues Total IMs annual freight TAC revenues Local currency unit
100 Total passenger TAC revenues Total IMs annual passenger TAC revenues (including tour-istic trains)
Local currency unit
101 Total passenger conventional train TAC revenues
Total IMs annual passenger high speed train TAC revenues (excluding touristic trains)
Local currency unit
103 Total revenues for station ac-cess
Total IMs annual revenues for station access (including passenger and touristic trains)
Local currency unit
104 Total income from incen-tive/performance regimes
Total IMs annual income from incentive/performance re-gimes with customers (if applicable, no public grants or state subsidies)
Local currency unit
Growth
Utilisation
Input ID Data label Data definition Data unit
105 Total train-km Total train-km operated (revenue service + shunting oper-ations to and from depots + IM’s work traffic)
km
106 Total freight train-km Total freight train-km operated (revenue service only, no shunting, no work trains)
km
107 Total passenger train-km Total passenger train-km operated (revenue service only, no shunting, no work trains)
km
108 Total passenger conventional train-km
Total passenger conventional train-km operated (revenue service only, no shunting, no work trains)
km
109 Total passenger high speed train-km
Total passenger high speed train-km operated (revenue service only, no shunting, no work trains)
km
110 Total diesel-powered train-km Total train-km operated by diesel-powered trains (revenue service + shunting operations to and from depots + IM’s work traffic)
km
111 Total electricity-powered train-km
Total train-km operated by electricity-powered trains (rev-enue service + shunting operations to and from depots + IM’s work traffic)
km
112 Total train-km on main track Total train-km on main track operated (passenger and freight revenue service only, no shunting, no work trains)
km
113 Total passenger train-km on main track
Total passenger train-km on main track operated (revenue service only, no shunting, no work trains)
km
Version 3.1 – 24th May 2019 35
Input ID Data label Data definition Data unit
114 Total freight train-km on main track
Total freight train-km on main track operated (revenue ser-vice only, no shunting, no work trains)
km
115 Total gross tonne-km on main track
Total gross tonne-km on main track operated (passenger and freight revenue service only, no shunting, no work trains)
km
Asset Capability & ERTMS
Input ID Data label Data definition Data unit
116 Total main track-km with ERTMS
Total main track-km with ERTMS in operation km
117 Total train-km on main tracks run with ERTMS
Total train-km on main tracks run with ERTMS in opera-tion, i.e. main tracks equipped with both - ETCS (Euro-pean train control system; any baseline or level) and GSM-R (Global System for Mobile Communications); and where ETCS and GSM-R are used in service
km
118 In 2020 sum of main track-km planned deployed with ERTMS
In 2020, the sum of main track-km planned to have been deployed with ERTMS, i.e. main tracks equipped with both - ETCS (European train control system; any baseline or level) and GSM-R (Global System for Mobile Communica-tions); and where ETCS and GSM-R are used in service
km
119 In 2030 sum of main track-km planned deployed with ERTMS
In 2030, the sum of main track-km planned to have been deployed with ERTMS, i.e. main tracks equipped with both - ETCS (European train control system; any baseline or level) and GSM-R (Global System for Mobile Communica-tions); and where ETCS and GSM-R are used in service
km
120 Total TEN-T core network line main track-km with ERTMS
Total TEN-T core network line main track-km with ERTMS in operation, i.e. main tracks equipped with both - ETCS (European train control system; any baseline or level) and GSM-R (Global System for Mobile Communications); and where ETCS and GSM-R are used in service
km
122 Total TEN-T core network line train-km with ERTMS
Total TEN-T core network line train-km with ERTMS in op-eration, i.e. main tracks equipped with both - ETCS (Euro-pean train control system; any baseline or level) and GSM-R (Global System for Mobile Communications); and where ETCS and GSM-R are used in service
km
123 Total train-km TEN-core net-work lines
Total train-km TEN-core network lines km
124 In 2020 total main track-km TEN-T core network lines planned deployed with ERTMS
In 2020, the sum of main track-km TEN-T core network lines planned to have been deployed with ERTMS, i.e. main tracks equipped with both - ETCS (European train control system; any baseline or level) and GSM-R (Global System for Mobile Communications); and where ETCS and GSM-R are used in service
km
125 In 2030 total main track-km TEN-T core network lines planned deployed with ERTMS
In 2030, the sum of main track-km TEN-T core network lines planned to have been deployed with ERTMS, i.e. main tracks equipped with both - ETCS (European train control system; any baseline or level) and GSM-R (Global System for Mobile Communications); and where ETCS and GSM-R are used in service
km
Intermodality
Input ID Data label Data definition Data unit
134 Number of core maritime ports connected to the rail network
Number of core maritime ports connected to the rail net-work. Core maritime ports linked to the TEN-T core net-work, according to Regulation (EU) No 1315/2013 on Union guidelines for the development of the trans-European transport network, in particular to the maps in ANNEX III
number
135 Total number of core maritime ports
Total number of maritime ports linked to the TEN-T core network, according to Regulation (EU) No 1315/2013 on Union guidelines for the development of the trans-Euro-pean transport network, in particular to the maps in ANNEX III
number
Version 3.1 – 24th May 2019 36
Input ID Data label Data definition Data unit
136 Number of core inland water-ways connected to the rail net-work
Number of core inland waterways connected to the rail net-work. Core inland waterways linked to the TEN-T core net-work, according to Regulation (EU) No 1315/2013 on Union guidelines for the development of the trans-European transport network, in particular to the maps in ANNEX III
number
137 Total number of core inland wa-terways
Total number of core inland waterways linked to the TEN-T core network, according to Regulation (EU) No 1315/2013 on Union guidelines for the development of the trans-Euro-pean transport network, in particular to the maps in ANNEX III
number
138 Number of core airports con-nected to the rail network
Number of core airports connected to the rail network. Core airports linked to the TEN-T core network, according to Regulation (EU) No 1315/2013 on Union guidelines for the development of the trans-European transport network, in particular to the maps in ANNEX III
number
139 Total number of core airports Total number of core airports linked to the TEN-T core net-work, according to Regulation (EU) No 1315/2013 on Union guidelines for the development of the trans-European transport network, in particular to the maps in ANNEX III
number
140 Number of public passenger railway stations with connec-tions to public urban transport
Number of public passenger railway stations with connec-tions to public urban transport (metro, bus, tramways, light rail, ferries etc.…) within the entire railway infrastructure network, independent of ownership
number
141 Total number of passengers registered in accessible stations per year
Total number of passengers registered annually in all ac-cessible stations within the entire railway infrastructure net-work, independent of ownership. An accessible station is one on which a passenger can, from entering the station, reach the platform via level-access, without steps or equiv-alent.
number
142 Total number of passengers Total number of passengers number
Version 3.1 – 24th May 2019 37
Appendix 2: Background information
Background information is consisting of various data within the areas charging, organisation, human
resources, asset information, railway market, country characteristics, policies and plans. Part of
background is also finance. In addition to the KPIs, background information serves as a tool to make
good analysis and making the right conclusions.
Unless otherwise stated, data should be provided as it stands on 31 December of the data year. However, if a major in-year change has occurred (e.g. opening of a significant section of new high speed line), the effect of this on, for example, network length, should be pro-rated. Data which are provided by the European Commission are national statistics.
Asset information
Input ID Data label Data definition Data unit
56 Length of main tracks of con-gested infrastructure
Length of main tracks of congested infrastructure according to Article 47(1) of Directive 2012/34/EU ( in respect of the situation at the end of the reporting period) (Source: Euro-pean Commission, RMMS)
km
57 Number of nodes of congested infrastructure
Number of nodes of congested infrastructure according to Article 47(1) of Directive 2012/34/EU (in respect of the sit-uation at the end of the reporting period) (Source: Euro-pean Commission, RMMS)
number
58 Number of rejected path alloca-tion requests during the year
Number of rejected path allocation requests during the year. Both scheduled and ad hoc requests for passenger and freight train paths should be summarised (Source: Eu-ropean Commission, RMMS)
number
59 Total number of path allocation requests
Total number of path allocation requests. Both scheduled and ad hoc requests for passenger and freight train paths should be summarised (Source: European Commission, RMMS)
number
121 Total main track-km TEN-core network lines
Total main track-km TEN-core network lines (Source EC TENtec Database)
km
126 Total main track-km TEN-core network lines permitting at least 22.5 t axle load
Total main track-km TEN-core network lines permitting at least 22.5 t axle load (Source EC TENtec Database)
km
127 Total main track-km TEN-core network lines with nominal track gauge of 1435 mm
Total main track-km TEN-core network lines with nominal track gauge of 1435 mm (Source EC TENtec Database)
km
128 Total main track-km TEN-core network lines permitting 110km/h line speed
Total main track-km TEN-core network lines permitting 110km/h line speed (Source EC TENtec Database)
km
129 Total main track-km TEN-core network lines permitting 740 m train length
Total main track-km TEN-core network lines permitting 740 m train length (Source EC TENtec Database)
km
130 Total main track-km fully electri-fied TEN-core network lines
Total main track-km fully electrified TEN-core network lines (Source EC TENtec Database)
km
131 Number of multimodal freight terminals - National
Number of multimodal freight terminals - National (Source: European Commission, RMMS)
number
133 Number of multimodal rail freight terminals accessible to electrified trains
Total number of multimodal rail freight terminals accessible to electrified trains, i.e. a structure equipped for tranship-ment rail and other transport modes (Source: European Commission, RMMS)
number
143 Total main line-km - National Total main line-km - National (Source: European Commis-sion, Statistical Pocket book)
km
Version 3.1 – 24th May 2019 38
Input ID Data label Data definition Data unit
144 Main line-km Cumulative length of railway lines operated and used for running trains by the end of reporting year. Lines solely used for operating touristic trains and heritage trains are excluded as are railways constructed solely to serve mines, forests or other industrial or agricultural instal-lations and which are not open to public traffic. Metro, Tram and Light rail urban lines (with non-standard – narrow - gauge) should be excluded. Private lines closed to public traffic and functionally sepa-rated (i.e. stand-alone) networks should be excluded. Pri-vate lines used for own freight transport activities or for non-commercial passenger services and light rail lines occa-sionally used by heavy rail vehicles for connectivity or transit purposes are excluded.
N/A
145 - High Speed High Speed main line-km km
146 - Conventional Conventional main line-km km
148 Main track-km A track providing end-to-end line continuity designed for trains between stations or places indicated in tariffs as in-dependent points of departure or arrival for the conveyance of passengers or goods, maintained and operated by the infrastructure manager. Tracks at service facilities not used for running trains are excluded. The boundary of the service facility is the point at which the railway vehicle leaving the service facility cannot pass without having an authorization to access the mainline or other similar line. This point is usually identified by a sig-nal. Service facilities are passenger stations, their buildings and other facilities; freight terminals; marshalling yards and train formation facilities, including shunting facilities; storage sid-ings; maintenance facilities; other technical facilities, in-cluding cleaning and washing facilities; maritime and in-land port facilities which are linked to rail activities; relief facilities; refuelling facilities and supply of fuel in these fa-cilities.
N/A
149 - Conventional (principle track) Conventional main track-km, principle track (All main/run-ning track except siding and platform tracks)
km
150 - Conventional (other main track)
Conventional main track-km, other main track (siding and platform tracks)
km
151 - Conventional (other track) Conventional track-km, other (All other tracks than main/running ones: tracks maintained, but not operated by the infrastructure manager; tracks at service facilities not used for running trains.)
km
153 Main lines in TEN-T core net-work - National
Percentage of main lines being part of TEN-T core net-work - National (%) (Source: European Commission, TENtec)
%
154 TEN corridors line-km – Na-tional
Total line-km which are part of a TEN corridor (Source: European Commission, TENtec)
km
155 Main track electrified Percentage of main track-km which is electrified (%) %
156 Bridges Main track-km on bridges (>=2m) km
157 Number of bridges Number of bridges (>=2m) in main track number
158 Tunnels Main track-km in tunnels km
159 Switches Switch quantities N/A
160 - Main track Switch quantity, main track number
161 - Other track Switch quantity, other track number
162 Level crossings Level crossing quantity in main track number
163 Is the IM classifying its stations according to UIC leaflet 180?
Is the IM classifying its stations according to UIC leaflet 180: Classification of Rail Passenger Stations? (Y/N)
Y/N
164 Passenger stations - National Number of passenger stations - National (Source: Euro-pean Commission, RMMS)
number
165 Stations per category Number of stations on lines owned by IMs per category (nr) N/A
166 - over 25,000 travellers per day Number of stations serving over 25,000 travellers per day number
167 - 10,000 - 25,000 travellers per day
Number of stations serving 10,000- 25,000 travellers per day
number
Version 3.1 – 24th May 2019 39
Input ID Data label Data definition Data unit
168 - 1,000 - 10,000 travellers per day
Number of stations serving 1,000 - 10,000 travellers per day
number
169 - 0 - 1,000 travellers per day Number of stations serving less than 1,000 travellers per day
number
Organisation, management & ownership
Input ID Data label Data definition Data unit
171 Is the IM state-owned? Is the IM state-owned? Y/N
172 Are IM and operators inte-grated?
Are IM and operators integrated? Y/N
173 Management of activities by IM Management of activities N/A
174 Maintenance Maintenance managed by IM? Y/N
175 Operations Operations managed by IM? Y/N
176 Renewals Renewals managed by IM? Y/N
177 Investments Investments managed by IM? Y/N
178 Stations Stations managed by IM? Y/N
179 Traffic information Traffic information managed by IM? Y/N
180 Ownership of activities by IM Ownership of activities N/A
181 Maintenance Activity 'Maintenance' owned by IM? Y/N
182 Operations Activity 'Operations' owned by IM? Y/N
183 Renewals Activity 'Renewals' owned by IM? Y/N
184 Investments Activity 'Investments' owned by IM? Y/N
185 Stations Activity 'Stations' owned by IM? Y/N
186 Traffic information Activity 'Traffic information' owned by IM? Y/N
187 Management of assets by IM Management of assets N/A
188 Lines, overall Lines managed by IM? Y/N
189 Passenger stations - Station ar-eas
Station areas managed by IM? Y/N
190 Passenger stations - Platforms Platforms managed by IM? Y/N
191 Passenger stations - Commer-cial areas
Commercial areas managed by IM? Y/N
192 Freight terminals Freight terminals managed by IM? Y/N
193 Marshalling yards Marshalling yards managed by IM? Y/N
234 Train-km - National Train-km - National (Source: European Commission, RMMS, UIC)
million km
235 Passengers carried - National Number of passengers carried - National (Source: Euro-pean Commission, Eurostat)
thousand
236 Passenger-km - National Passenger-km delivered - National (Source: European Commission, Statistical Pocket book)
billion km
237 Passenger-km on IM's lines Passenger-km delivered on IM's lines km
238 Freight tonnes carried - Na-tional
Number of freight tonnes carried - National (Source: Euro-pean Commission, Statistical Pocket book)
thousand tonnes
239 Freight tonne-km - National Freight tonne-km delivered - National (Source: European Commission, Statistical Pocket book)
billion km
240 Freight tonne-km on IM's lines Freight tonne-km delivered on IM's lines km
241 Do you conduct customer satis-faction surveys?
Do you conduct customer satisfaction surveys? N/A
242 - RUs Surveys for Railway undertakings? Y/N
243 - End-user customers Surveys for End-user customers? Y/N
244 - Passengers Surveys for Passengers? Y/N
245 - Freight Surveys for Freight? Y/N
Version 3.1 – 24th May 2019 41
Input ID Data label Data definition Data unit
246 Degree of satisfaction in cus-tomer satisfaction survey - Rail-way undertakings
Degree of satisfaction in surveys related to railway under-takings
N/A
247 Degree of satisfaction - Total transport
Degree of satisfaction in surveys related to railway under-takings - Total transport
%
248 Degree of satisfaction - Freight transport
Degree of satisfaction in surveys related to railway under-takings - Freight transport
%
249 Degree of satisfaction - Passen-ger transport
Degree of satisfaction in surveys related to railway under-takings - Passenger transport
%
250 Delta in degree of satisfaction - Total transport
Delta in degree of satisfaction compared to previous year in surveys related to railway undertakings - Total transport
%
251 Delta in degree of satisfaction - Freight transport
Delta in degree of satisfaction compared to previous year in surveys related to railway undertakings - Freight transport
%
252 Delta in degree of satisfaction - Passenger transport
Delta in degree of satisfaction compared to previous year in surveys related to railway undertakings - Passenger transport
%
253 Degree of satisfaction in cus-tomer satisfaction survey - End customers
Degree of satisfaction in customer satisfaction surveys re-lated to end customers
N/A
254 Degree of satisfaction - Total transport
Degree of satisfaction in surveys related to end customers - Total transport
%
255 Degree of satisfaction - Freight transport
Degree of satisfaction in surveys related to end customers - Freight transport
%
256 Degree of satisfaction - Passen-ger transport
Degree of satisfaction in surveys related to end customers - Passenger transport
%
257 Delta in degree of satisfaction - Total transport
Delta in degree of satisfaction compared to previous year in surveys related to end customers - Total transport
%
258 Delta in degree of satisfaction - Freight transport
Delta in degree of satisfaction compared to previous year in surveys related to end customers - Freight transport
%
259 Delta in degree of satisfaction - Passenger transport
Delta in degree of satisfaction compared to previous year in surveys related to end customers - Passenger transport
%
260 Main areas covered by the cus-tomer satisfaction survey - Rail-way undertakings
Overview of quality measurements included in survey re-lated to railway undertakings
N/A
261 Punctuality - Freight Punctuality (freight) included in survey? Y/N
262 Capacity - Freight Capacity (freight) included in survey? Y/N
263 Traffic management - Freight Traffic management (freight) included in survey? Y/N
264 Traffic information - Freight Traffic information (freight) included in survey? Y/N
265 Modal integration - Freight Modal integration (freight) included in survey? Y/N
266 Business relations - Freight Business relations (freight) included in survey? Y/N
267 Quality management - Freight Quality management (freight) included in survey? Y/N
268 Punctuality - Passenger Punctuality (passengers) included in survey? Y/N
269 Capacity - Passenger Capacity (passengers) included in survey? Y/N
270 Traffic management - Passen-ger
Traffic management (passengers) included in survey? Y/N
271 Traffic information - Passenger Traffic information (passengers) included in survey? Y/N
272 Modal integration - Passenger Modal integration (passengers) included in survey? Y/N
273 Station areas - Passenger Station areas (passengers) included in survey? Y/N
274 Business relations - Passenger Business relations (passengers) included in survey? Y/N
275 Quality management - Passen-ger
Quality management (passengers) included in survey? Y/N
276 Main areas covered by the cus-tomer satisfaction survey - End customer
Overview of quality measurements included in survey re-lated to end customers
N/A
277 Punctuality - Freight Punctuality (freight) included in survey? Y/N
278 Capacity - Freight Capacity (freight) included in survey? Y/N
279 Traffic management - Freight Traffic management (freight) included in survey? Y/N
280 Traffic information - Freight Traffic information (freight) included in survey? Y/N
281 Modal integration - Freight Modal integration (freight) included in survey? Y/N
282 Quality management - Freight Quality management (freight) included in survey? Y/N
283 Punctuality - Passenger Punctuality (passengers) included in survey? Y/N
Version 3.1 – 24th May 2019 42
Input ID Data label Data definition Data unit
284 Capacity - Passenger Capacity (passengers) included in survey? Y/N
285 Traffic management - Passen-ger
Traffic management (passengers) included in survey? Y/N
286 Traffic information - Passenger Traffic information (passengers) included in survey? Y/N
287 Modal integration - Passenger Modal integration (passengers) included in survey? Y/N
288 Station areas - Passenger Station areas (passengers) included in survey? Y/N
289 Quality management - Passen-ger
Quality management (passengers) included in survey? Y/N
The KPIs for customer satisfaction show which IMs are carrying out any surveys or other quality
analysis of the service provided, both related to end user customers and/or Railway Undertakings
(RUs). The purpose of the matrix in the background information is to give an overview of the contents
of the measurements included in the analysis for each IM. The idea is to first present the degree of
satisfaction from surveys from both RUs and end user customers for total satisfaction segmented
between freight and passenger transport. The next step will be to present time series data for satis-
faction surveys.
Country characteristics
Input ID Data label Data definition Data unit
290 Country area Country area (Source: European Commission, Eurostat) thousand km2
291 Population Number of persons living in the country area (Source: Eu-ropean Commission, Eurostat)
million persons
292 Nominal GDP GDP (nominal) (Source: European Commission, Eurostat) billion Euro
293 GDP per capita GDP per capita (Source: European Commission, Eurostat) Index, EU-28=100
294 Number of border countries Number of border countries (Source: European Commis-sion, Static)
number
295 Currency Currency (Source: European Commission, European Cen-tral Bank)
text
296 Average annual exchange rate Average annual exchange rate (Source: European Com-mission, European Central Bank)
Local currency unit/Euro
297 Purchasing power parity Purchasing power parity (Price level indices and real ex-penditures for ESA 2010 aggregates) (Source: European Commission, Eurostat PPP)
Index, EU-28=1
372 Population density Population density (Source: European Commission, Euro-stat)
Persons per km2
Policies and plans
Input ID Data label Data definition Data unit
298 Does IM have an asset man-agement system based on ISO55000 or PAS55?
Does the IM organisation have an Asset Management Sys-tem based on the requirements within ISO55000 or the PAS55 guidelines? (Y/N)
Y/N
299 Does IM apply a structured self-assessment matrix?
Does the IM apply a structured self-assessment matrix to identify main short-comings in the Asset Management Ca-pability? (Y/N)
Y/N
300 Or is the asset management ca-pability assessed externally?
Or is the Asset Management Capability assessed by an ex-ternal authority? (Y/N), (if yes assessment every xxx year.)
Y/N
301 If yes, how long are asset man-agement capability assessment intervals?
If the Asset Management Capability is assed by an external authority, how long are the assessment intervals in years?
years
302 Does IM have a plan for deploy-ment of ERTMs accepted by the government?
The IM has a plan for deployment of ERTMs accepted by the government. (Y/N)
Y/N
303 Is IM responsible for drafting ac-tion plan regarding noise?
Are you as an IM responsible for drafting action plan re-garding noise? (Y/N)
Y/N
304 Does IM produce saturation or congestion maps?
Do you produce saturation or congestion maps on the na-tional level? (Y/N)
Y/N
305 Were noise maps compiled? Were noise maps compiled along the railway network? (Y/N)
Y/N
Version 3.1 – 24th May 2019 43
Input ID Data label Data definition Data unit
306 Does IM conduct acoustic grinding?
Do you conduct acoustic grinding on the railway network? (Y/N)
Y/N
307 Does IM have programs to sup-port quieter trains?
Do you have programs to support quieter trains (retrofitting freight trains)? (Y/N)
Y/N
308 Does IM subsidize noise proof windows?
Do you subsidize noise proof windows? (Y/N) Y/N
309 Strategy infrastructure plans and contractual agreements
Strategy infrastructure plans and contractual agreements N/A
310 - Date of adoption/signature - Date of adoption/signature date
311 - Duration - Duration years
Charging
Input ID Data label Data definition Data unit
312 Minimum access package charges
Minimum access package charges used by IM N/A
313 Do you apply the direct cost principle in your charging sys-tem?
Do you apply the direct cost principle in your charging sys-tem? (Article 31(3))
Y/N
314 Direct cost principle - Tariff structure varies with activity?
Does the tariff structure vary with the activity? (Article 31(3))
Y/N
315 Direct cost principle - Tariff structure varies with something else?
Does the tariff structure vary with something else? (Article 31(3))
Y/N
316 Direct cost principle - If yes, with what else does the tariff struc-ture vary?
Only applies if tariff structure varies with something else (Article 31(3))
text
317 Direct cost principle - Level of charge depends on the type of rolling stock?
Does the level of charge depend on the type of rolling stock? (Article 31(3))
Y/N
318 Direct cost principle - Level of charge depends on tonnage?
Does the level of charge depend on the tonnage? (Article 31(3))
Y/N
319 Direct cost principle - Level of charge depends on something else?
Does the level of charge depend on something else? If yes, what? (Article 31(3))
Y/N
320 Direct cost principle - If yes, on what else does the level of charge depend?
Only applies if level of charge does depend on something else
text
321 Direct cost principle - Any com-ments?
If you have any comment about this section, write it here: (Article 31(3))
text
322 Does charging system include a scarcity charge?
Does your charging system include a scarcity charge? (Ar-ticle 31(4))
Y/N
323 Does charging system take ac-count of the cost of environmen-tal effects?
Does your charging system take account of the cost of en-vironmental effects? (Article 31(5))
Y/N
324 Environmental effects - Charg-ing system takes specifically ac-count of the cost of noise?
Does it take specifically account of the cost of noise? (Ar-ticle 31(5))
Y/N
325 Environmental effects - Charg-ing system takes specifically ac-count of the cost of CO2 emis-sions?
Does it take specifically account of the cost of the CO2 emission? (Article 31(5))
Y/N
326 Environmental effects - Charg-ing system takes account of something else?
Does it take account of something else? (Article 31(5)) Y/N
327 Environmental effects - If yes, what else does the charging system take into account?
Only applies if charging system takes something else into account
text
328 Do you apply mark-ups on the following segments?
Do you apply mark-ups on the following segments? (Article 32(1))
Y/N
329 Mark-ups - Segment Freight service?
- Freight service? (Article 32(1)) Y/N
330 Mark-ups - Segment Passenger service within the framework of a public service contract?
- Passenger service within the framework of a public ser-vice contract? (Article 32(1))
Y/N
Version 3.1 – 24th May 2019 44
Input ID Data label Data definition Data unit
331 Mark-ups - Segment Other Pas-senger service?
- Other passenger service? (Article 32(1)) Y/N
332 Mark-ups - Segment If yes, which other passenger services are mark-ups applied on?
Only applies if there are mark-ups for other passenger ser-vices
text
333 Mark-ups - Do you define sub-segments in each of the seg-ments listed above?
Do you define sub-segments in each of the segments listed above? (Article 32(1))
Y/N
334 Mark-ups - If yes, which sub-segments do you define in the segments listed above?
Only applies if sub-segments are defined text
335 Mark-ups - Any comments? If you have any comment about this section, write it here: (Article 32(1))
text
336 Does charging system include charges for specific investment projects?
Does your charging system include charges for specific in-vestment projects? (Article 32(3))
Y/N
337 Does charging system include a possession charge?
Does your charging system include a possession charge? (Article 31(9))
Y/N
338 Incentive regimes Incentive regimes used by IM N/A
339 Are time-limited discounts com-monly applied?
Is it common for you to apply time-limited discounts to en-courage the development of new rail services, or discounts encouraging the use of considerably underutilised lines? (Article 33)
Y/N
340 Have you implemented a per-formance scheme?
Have you implemented a performance scheme? (Article 35)
Y/N
341 Do you have a distinction in charges for ETCS trains?
Do you have a distinction in your charges for the trains equipped with ETCS? (Article 32.4)
Y/N
342 Does charging system include a reservation charge for unused capacity?
Does your charging system include a reservation charge for capacity that is allocated but not used? (Article 36)
Y/N
Revenues & Funding
Input ID Data label Data definition Data unit
343 Grants Grants N/A
344 Grants, Total Total Grants Local currency unit
345 Grants, P&L Total Grants, of which P&L Local currency unit
346 Grants, CAPEX Total Grants, of which CAPEX Local currency unit
347 Grants - Operation and mainte-nance, P&L
Total Operation and maintenance, of which P&L Local currency unit
348 Grants - Renewals and En-hancements, CAPEX
Total Renewals and Enhancements, of which CAPEX Local currency unit
349 Grants - Others, Total Total Others Local currency unit
350 Grants - Others, P&L Total Others, of which P&L Local currency unit
351 Grants - Others, CAPEX Total Others, of which CAPEX Local currency unit
352 Charges Charges N/A
353 Charges, P&L Total Charges, of which P&L Local currency unit
354 Charges - Minimum access package charges, P&L
Total Minimum access package charges, of which P&L Local currency unit
355 Charges - Incentive regimes, P&L
Total Incentive regimes, of which P&L Local currency unit
356 Charges - Charges for service facilities, P&L
Total Charges for service facilities, of which P&L Local currency unit
357 Property rental income, P&L Total property rental income, of which P&L Local currency unit
358 Electricity supply, P&L Electricity supply, of which P&L Local currency unit
359 Borrowing, CAPEX Borrowing, of which CAPEX Local currency unit
360 Other funding, P&L Other funding, of which P&L Local currency unit
361 Total IM's revenues and funding Total IM's revenues and funding N/A
362 Total IM's revenues and fund-ing, Total
Total IM's revenues and funding Local currency unit
363 Total IM's revenues and fund-ing, P&L
Total IM's revenues and funding, of which P&L Local currency unit
Version 3.1 – 24th May 2019 45
Input ID Data label Data definition Data unit
364 Total IM's revenues and fund-ing, CAPEX
Total IM's revenues and funding, of which CAPEX Local currency unit
365 Revenues and funding - Costs&Investment
Revenues and funding minus Costs&Investment N/A
366 Revenues and funding - Costs&Investment, Total
Revenues and funding minus Costs&Investment Local currency unit
367 Revenues and funding - Costs&Investment, P&L
Revenues and funding minus Costs&Investment, of which P&L
Local currency unit
368 Revenues and funding - Costs&Investment, CAPEX
Revenues and funding minus Costs&Investment, of which CAPEX
Local currency unit
369 Depreciation, P&L Depreciation, of which P&L Local currency unit
370 P&L Net result P&L Net result Local currency unit
Version 3.1 – 24th May 2019 46
Appendix 3: Causes for delays and cancelled services
Source: UIC CODE, 450 – 2, OR, 5th edition, June 2009 Causes within coloured boxes are considered as IM responsibilities.
Traffic Management
Asset
Processes
Infrastructure Manager Railway undertakings
Operational/
planning
manage-
ment
Infrastruc-
ture installa-
tions
Civil Engi-
neering
causes
Causes of
other IMs
Commer-
cial causes
Rolling stock Causes of
other RUs
External
causes
Secondary
causes
1- 2- 3- 4- 5- 6- 7- 8- 9-
-0 Time table compilation
Signalling in-stallations
Planned con-struction works
Delay caused by next IM
Exceeding the stop time
Roster planning re -rostering
Delay caused by next RU
Strike Dangerous in-cidents, acci-dents and hazards
-1 Formation of train by infra-structure man-ager
Signalling in-stallations at level crossings
Irregularities in execution of construction work
Delay caused by previous IM
Request of the RU
Formation of train by Railway Un-dertaking
Delay caused by previous RU
Administrative formalities
Track occupa-tion caused by the late-ness of the same train
principles and terminology, Corrected version 2014-03-15, IDT,
General terms 3.1.2)
ISO 55000:2014
Asset Management
System
An Asset Management System is used by an organisation to di-
rect, coordinate and control asset management activities. ”Set of
interrelating or interacting elements to establish asset manage-
ment policy, asset management objectives and processes to
achieve those objectives.
ISO 55000:2014
Version 3.1 – 24th May 2019 53
Name Description Source
Assets LICB defines the Railway Infrastructures as consisting of the fol-
lowing items, assuming they form part the permanent way, includ-
ing sidings, but excluding lines situated within railway repair work-
shops, depots or locomotive sheds and private branch lines or
sidings:
- Ground area
- Track and track bed etc.
- Engineering structures: Bridges culverts and other overpasses,
tunnels etc.
- Level crossings, including appliances to ensure safety of road
traffic;
- Superstructure, in particular: rails, grooved rails; sleepers, small
fittings for the permanent way, ballast, points, crossings.
- Access way for passengers and goods, including access by road;
- Safety, signalling and telecommunications installations on the
open track, in stations and in marshalling yards etc.
- Lightning installations for traffic and safety purposes
- Plant for transforming and carrying electric power for train haul-
age: substations, Supply cables between sub-stations and con-
tact wires, catenaries.
EC Directives, European Com-
mission 5th Framework Pro-
gramme Improve rail, Delivera-
ble D3, “Benchmarking exercise
in railway infrastructure man-
agement” as referred in the UIC
Lasting Infrastructure Cost
Benchmarking (LICB) project.
Attempted suicide An act to deliberately injure oneself resulting in serious injury. Glossary for Transport Statis-
tics, A.VI-21
Directive (EU) 2016/798 on rail-
way safety, Annex I, Appendix
3.2
Borrowing Receiving something of value in exchange for an obligation to
pay back something of usually greater value at a particular time in
the future
Bottleneck A physical, technical or functional barrier which leads to a system
break affecting the continuity of long-distance or cross-border
flows and which can be surmounted by creating new infrastruc-
ture or substantially upgrading existing infrastructure that could
bring significant improvements which will solve the bottleneck
constraints
Regulation (EU) No 1315/2013
(TEN-T), Article (3)(q)
Broken rail Any rail which is separated in two or more pieces, or any rail from
which a piece of metal becomes detached, causing a gap of more
than 50 mm in length and more than 10 mm in depth on the run-
ning surface.
Directive (EU) 2016/798 on rail-
way safety, Annex I, Appendix
4.1
Cancelled train If a planned service is not running (i.e. train cancelled in the oper-
ations phase). The codes described in UIC CODE, 450 – 2, OR,
5th edition, June 2009, Appendix A page 9 should be used to de-
scribe the cause of cancellation on the whole or just a part of the
route.
Cancelled trains can be split into four types. These are:
•full cancellation (cancelled at origin)
•part cancellation en route
•part cancellation changed origin
•part cancellation diverted (any train that diverts and does not
stop at all of its scheduled locations will be classed as a part can-
cellation even if it reaches its end destination).
UIC CODE, 450 – 2, OR, 5th
edition, June 2009, 6 – Can-
celled services, combined with
adopting the types of cancella-
tions described by Network
Rail.
Cancelled train causes See delay causes in Appendix 3 UIC CODE, 450 – 2, OR, 5th
edition, June 2009, 5 – Causes
for delays and cancelled ser-
vices.
Capacity (infrastruc-
ture)
Capacity means the potential to schedule train paths requested
for an element of infrastructure for a certain period;
2012/34/EU (SERA), Article 3
(24)
Version 3.1 – 24th May 2019 54
Name Description Source
CAPEX, Capital ex-
penditures
Capital expenditure are funds used by a company to acquire or
upgrade physical assets such as property, industrial buildings or
equipment. An expense is considered to be a capital expenditure
when the asset is a newly purchased capital asset or an invest-
ment that improves the useful life of an existing capital asset.
Hence, it comprises investments in new infrastructure as well as
renewals and enhancements.
PRIME KPI subgroup
Charges for service fa-
cilities
Revenues generated by providing access to service facilities.
Services facilities include:
(a) passenger stations, their buildings and other facilities, includ-
ing travel information display and suitable location for ticketing
services;
(b) freight terminals;
(c) marshalling yards and train formation facilities, including
shunting facilities;
(d) storage sidings;
(e) maintenance facilities, with the exception of heavy mainte-
nance facilities dedicated to high-speed trains or to other types of
rolling stock requiring specific facilities;
(f) other technical facilities, including cleaning and washing facili-
ties;
(g) maritime and inland port facilities which are linked to rail activ-
ities;
(h) relief facilities;
(i) refuelling facilities and supply of fuel in these facilities, charges
for which shall be shown on the invoices separately
Directive 2012/32/EU, Annex II
Collision of train with
obstacle within the
clearance gauge
A collision between a part of a train and objects fixed or tempo-
rarily present on or near the track (except at level crossings if lost
by a crossing vehicle or user), including collision with overhead
contact lines.
Directive (EU) 2016/798 on rail-
way safety, Annex I, Appendix
1.6
Collision of train with
rail vehicle
A front to front, front to end or a side collision between a part of a
train and a part of another train or rail vehicle, or with shunting
rolling stock.
Directive (EU) 2016/798 on rail-
way safety, Annex I, Appendix
1.5
Congested infrastruc-
ture
Infrastructure element, on which after coordination of the re-quested train paths and consultation with applicants, it is not pos-sible to satisfy requests for infrastructure capacity adequately. According to Article 47 (1) of Directive 2012/34/EU the infrastruc-ture manager shall immediately declare the section of infrastruc-ture on which this has occurred to be congested. This shall also be done for infrastructure which can be expected to suffer from insufficient capacity in the near future. Where infrastructure has been declared to be congested, the in-
frastructure manager shall carry out a capacity analysis and it has
to be described in the network statement.
Article 47 of Directive
2012/34/EU (SERA)
Conventional train Train, composed of vehicles designed to operate at speeds below
250 km/h.
Decision No. 1692/96/EC (TEN-
T), Art.10(1)
Conventional track Track being a part of the conventional rail network.
The conventional rail network shall comprise lines for the conven-
tional transport by rail of passengers and freight, including the rail
segments of the trans-European combined transport network re-
ferred to in Article 14, access links to sea and inland ports of
common interest and those freight terminals which are open to all
operators.
Track (line) whole or part of line, approved for Vmax < 250 km/h.
Decision No 1692/96/EC (TEN-
T), Art.10(1)
Cyber-attacks Malicious acts targeting computer information systems, IT infra-
structures, computer networks, and/or personal computer devices
of railway infrastructure managers, railway undertaking or other
railway companies with the intention to steal, alter, or destroy a
specified target in the susceptible system.
Delay The time difference between the time the train was scheduled to
arrive in accordance with the published timetable and the time of
its actual arrival.
Adapted from ERA, Glossary of
railway terminology
Version 3.1 – 24th May 2019 55
Name Description Source
Delay minutes Delay minutes will be measured at all available measuring points.
Of those measured delay minutes that exceed a threshold of 5:29
minutes for passenger services and 15:29 minutes for freight ser-
vices the maximum number is counted. No delay minutes are
counted if these thresholds are not exceeded at any measuring
point
Deployment The deployment of a mechanical device, electrical system, com-
puter program, etc., is its assembly or transformation from a
packaged form to an operational working state. Deployment im-
plies moving a product from a temporary or development state to
a permanent or desired state.
Depreciation Depreciation is an accounting method of allocating the cost of a
tangible or intangible asset over its useful life. It allows a com-
pany to write-off the value of an asset over time, but it is consid-
ered a non-cash transaction.
Derailment of train Any case in which at least one wheel of a train leaves the rails. Glossary for Transport Statis-
tics, A.VI-14
Directive (EU) 2016/798 on rail-
way safety, Annex I, Appendix
1.7
Direct Cost in the
meaning of Regulation
(EU)2015/909
Direct cost in this context means “the cost that is directly incurred
as a result of operating the train service” and which is used for
setting charges for the minimum access package and for access
to infrastructure connecting service facilities. The modalities for
the calculation of the cost that is directly incurred as a result of
operating the train are set out in Commission Implementing Reg-
ulation (EU) 2015/909 and can in principle be established on the
basis of:
(a) a network-wide approach as the difference between, on the
one hand, the costs for providing the services of the minimum ac-
cess package and for the access to the infrastructure connecting
service facilities and, on the other hand, the non-eligible costs re-
ferred to in Article 4 of this regulation, or
(b) econometric or engineering cost modelling.
PRIME KPI subgroup on the
basis of Implementing Regula-
tion (EU) 2015/909
Electricity supply in-
come
Revenue generated by charging railway undertakings for the use
of electricity for traction.
PRIME KPI subgroup on the
basis of the Commission Regu-
lation (EU) No 1301/2014 (TSI
Energy), Annex 2.1.1
Employee or contractor Any person whose employment is in connection with a railway
and is at work at the time of the accident, including the staff of
contractors, self-employed contractors, the crew of the train and
persons handling rolling stock and infrastructure installations.
Directive (EU) 2016/798 on rail-
way safety, Annex I, Appendix
1.13
Version 3.1 – 24th May 2019 56
Name Description Source
Expenditure on en-
hancements of existing
infrastructure
Enhancements (or 'upgrades’) means capital expenditure on a
major modification work of the existing infrastructure which im-
proves its overall performance. Enhancements can be triggered
by changed functional requirements (and not triggered by life-
time) or "forced" investments when acting on regulations.
The purpose of enhancements is to change the functional re-
quirements such as electrification of a non-electrified line, build-
ing a second track parallel to a single tracked line, increase of
line speed or capacity. Enhancements include planning (incl.
portfolio prioritization, i.e. which enhancements projects are real-
ized when and where), tendering dismantling (disposal of old
equipment), construction, testing and commissioning (when track
is opened to full-speed operation). Enhancements are generally
looked on at the level of annual spending from a cash-flow per-
spective, i.e. no depreciation or other imputed costs are taken
into account. It includes its proportion of overhead (such as finan-
cials, controlling, IT, human resources, purchasing, legal and
planning), labour (operative, personnel), material, (used/con-
chinery, tools, equipment including transport and logistics) and
contrac-tors (entrepreneurial production).
PRIME KPI subgroup on the
basis of UIC studies (CENOS
and OMC)
Trespasser Any person present on railway premises where such presence is
forbidden, with the exception of a level crossing user
Directive (EU) 2016/798 on rail-
way safety, Annex I, Appendix
1.15
Vandalism Acts of deliberate destruction of, or damage to railway infrastruc-
ture or rolling stock including defacement by graffiti, without the
intention of disrupting railway operations or causing bodily harm.
Working capital Current assets minus current liabilities.
2. Accounting: Net liquid assets computed by deducting current
liabilities from current assets. The amount of available working
capital is a measure of a firm's ability to meet its short-term obli-
gations. Sources of working capital are (1) net income, (2) long-
term loans, (3) sale of capital assets, and (4) injection of funds by
stockholders.
Is the amount of current assets minus the amount of current liabil-
ities as of specific date. These amounts are obtained from your
company's balance sheet. For example, if your company's bal-
ance sheet reports current assets of $450,000 and current liabili-
ties of $320,000 then your company's working capital is
$130,000.
Working timetable The data defining all planned train and rolling-stock movements which will take place on the relevant infrastruc-ture during the pe-riod for which it is in force
Directive 2012/34/EU (SERA),
Article .3(28)
Wrong side signalling
failure
Any technical failure of a signalling system (either to infrastruc-
ture or to rolling stock), resulting in signalling information less re-