16
Primer on Climate Change Science NatioNal associatioN of cleaN air ageNcies iStockphoto iStockphoto iStockphoto Peter Rejcek/The Antarctic Sun iStockphoto iStockphoto iStockphoto JULY 2011

Primer on ClimateChange Science
N a t i o N a l a s s o c i a t i o N o f c l e a N a i r a g e N c i e s
iSto
ckph
oto
iSto
ckph
oto
iSto
ckph
oto
Pete
r Rej
cek/
The
Ant
arct
ic S
uniS
tock
phot
oiS
tock
phot
oiS
tock
phot
o
J U LY 2 0 1 1
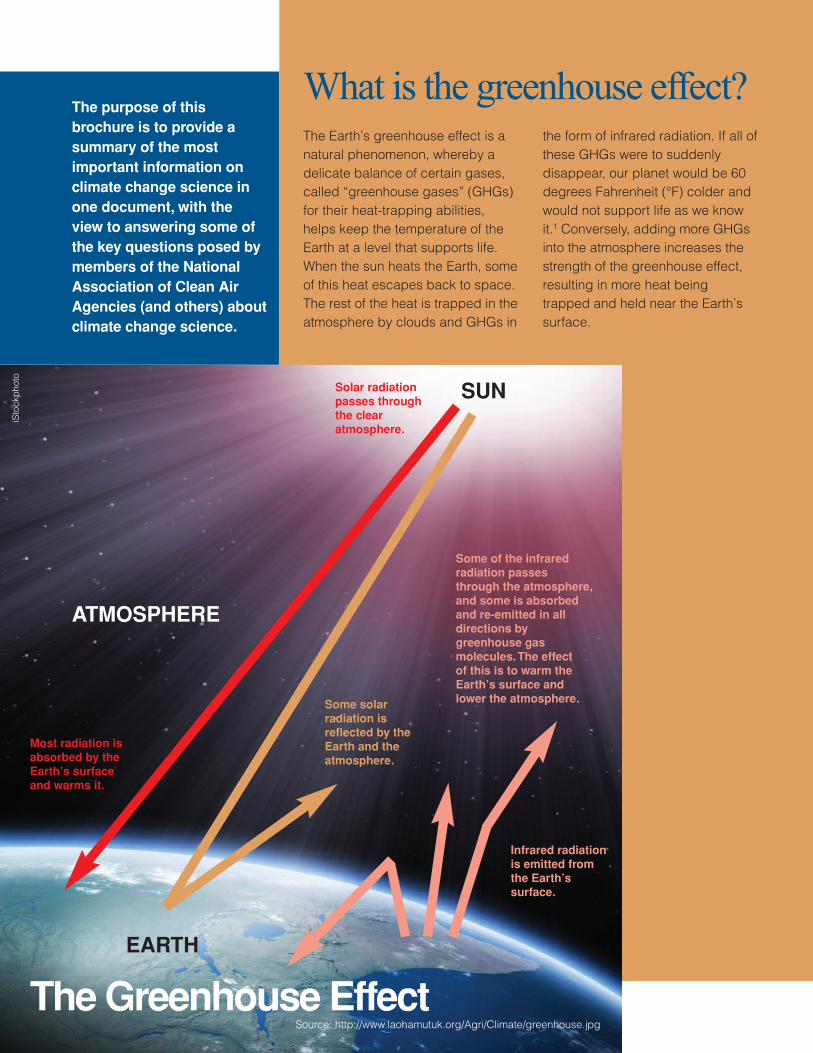
The Earth’s greenhouse effect is anatural phenomenon, whereby adelicate balance of certain gases,called “greenhouse gases” (GHGs)for their heat-trapping abilities,helps keep the temperature of theEarth at a level that supports life.When the sun heats the Earth, someof this heat escapes back to space.The rest of the heat is trapped in theatmosphere by clouds and GHGs in
the form of infrared radiation. If all ofthese GHGs were to suddenlydisappear, our planet would be 60degrees Fahrenheit (°F) colder andwould not support life as we knowit.1 Conversely, adding more GHGsinto the atmosphere increases thestrength of the greenhouse effect,resulting in more heat beingtrapped and held near the Earth’ssurface.
What is the greenhouse effect?
SUN
ATMOSPHERE
EARTH
Some solarradiation isreflected by theEarth and theatmosphere.
Solar radiationpasses throughthe clearatmosphere.
Most radiation isabsorbed by theEarth’s surfaceand warms it.
Infrared radiationis emitted fromthe Earth’ssurface.
Some of the infraredradiation passesthrough the atmosphere,and some is absorbedand re-emitted in alldirections bygreenhouse gasmolecules. The effect of this is to warm theEarth’s surface andlower the atmosphere.
The Greenhouse EffectSource: http://www.laohamutuk.org/Agri/Climate/greenhouse.jpg
The purpose of thisbrochure is to provide asummary of the mostimportant information onclimate change science inone document, with theview to answering some ofthe key questions posed bymembers of the NationalAssociation of Clean AirAgencies (and others) aboutclimate change science.
iSto
ckph
oto

Page 3
Global warming is the warming ofthe Earth’s atmosphere due toincreased concentrations of GHGs.The addition of these GHGs in theatmosphere amplifies the Earth’sexisting greenhouse effect.
The global climate system is adynamic system, with changesdriven by a number of factorsincluding ocean and air circulation,atmospheric and ocean chemistryand solar radiation, for example.Changes in the radiative balanceof the Earth are referred to asclimate forcings. “Forcings” arephysical factors external to theclimate system that force a netincrease (positive forcing) or netdecrease (negative forcing) of heatin the climate system as a whole.Thus, positive forcings (such as anincreased amount of GHGs) leadto global warming, while negative
ones (such as large volcaniceruptions that produce particlesthat reflect the sun’s heat back intospace) lead to global cooling. Thistype of change is distinct frominternal climate variability, in whichheat is transported by winds orocean currents with no net changein the total heat within the system.2
While the terms “global warming”and “climate change” are oftenused interchangeably, “climatechange” (or “climate disruption”) isa more accurate descriptionbecause it conveys the multitudeof impacts – such as increaseddrought, increased number ofextreme precipitation events, risingsea level and ocean acidification –beyond higher temperaturescaused by the increased amountof GHGs.3
What is globalwarming?
is climatechange thesame phenomenonas globalwarming?
iSto
ckph
oto
Page 4
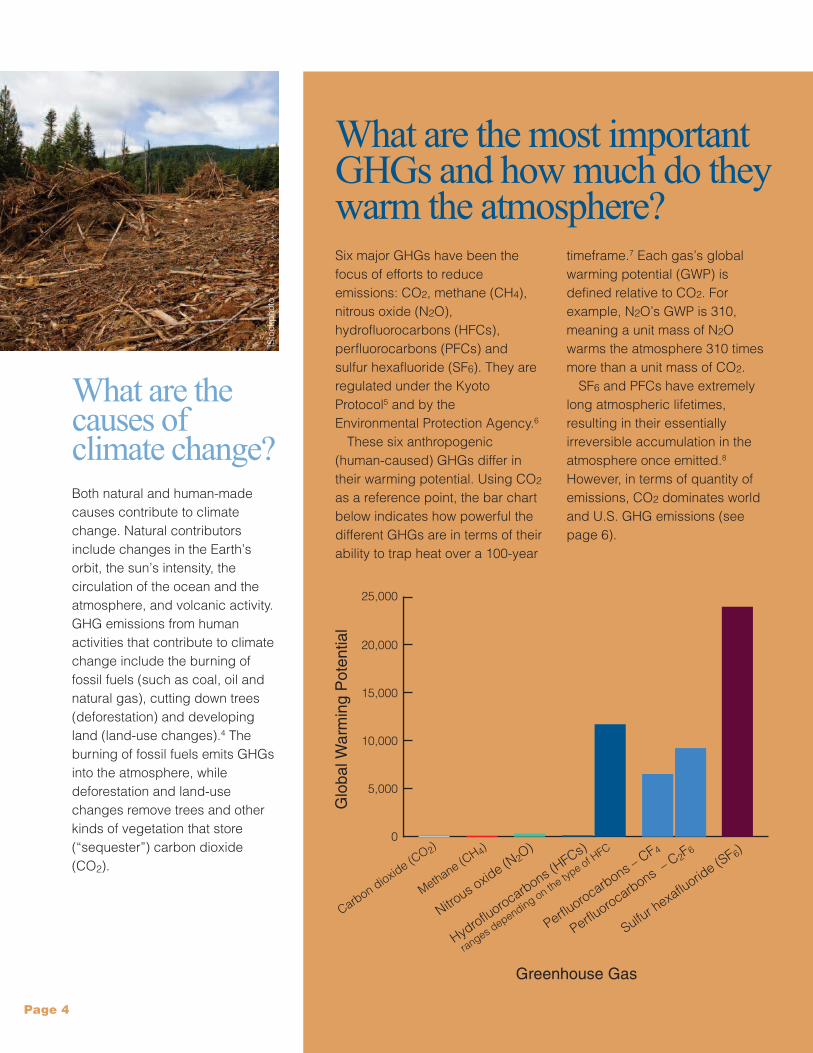
What are the most importantgHgs and how much do theywarm the atmosphere? Six major GHGs have been thefocus of efforts to reduceemissions: CO2, methane (CH4),nitrous oxide (N2O),hydrofluorocarbons (HFCs),perfluorocarbons (PFCs) andsulfur hexafluoride (SF6). They areregulated under the KyotoProtocol5 and by theEnvironmental Protection Agency.6
These six anthropogenic(human-caused) GHGs differ intheir warming potential. Using CO2
as a reference point, the bar chartbelow indicates how powerful thedifferent GHGs are in terms of theirability to trap heat over a 100-year
timeframe.7 Each gas’s globalwarming potential (GWP) isdefined relative to CO2. Forexample, N2O’s GWP is 310,meaning a unit mass of N2Owarms the atmosphere 310 timesmore than a unit mass of CO2.
SF6 and PFCs have extremelylong atmospheric lifetimes,resulting in their essentiallyirreversible accumulation in theatmosphere once emitted.8
However, in terms of quantity ofemissions, CO2 dominates worldand U.S. GHG emissions (seepage 6).
Global Warming Potential
Greenhouse Gas
Carbon dioxide (C
O2)
25,000
20,000
15,000
10,000
5,000
0
Sulfur hexafluorid
e (SF6)
Methane (CH4)
Nitrous o
xide (N
2O)
Hydrofluorocarbons (
HFCs)
ranges depending on th
e type of H
FC
Perfluorocarbons –
CF4
Perfluorocarbons –
C2F6
What are thecauses ofclimate change?Both natural and human-madecauses contribute to climatechange. Natural contributorsinclude changes in the Earth’sorbit, the sun’s intensity, thecirculation of the ocean and theatmosphere, and volcanic activity.GHG emissions from humanactivities that contribute to climatechange include the burning offossil fuels (such as coal, oil andnatural gas), cutting down trees(deforestation) and developingland (land-use changes).4 Theburning of fossil fuels emits GHGsinto the atmosphere, whiledeforestation and land-usechanges remove trees and otherkinds of vegetation that store(“sequester”) carbon dioxide(CO2).
iSto
ckph
oto
Page 5
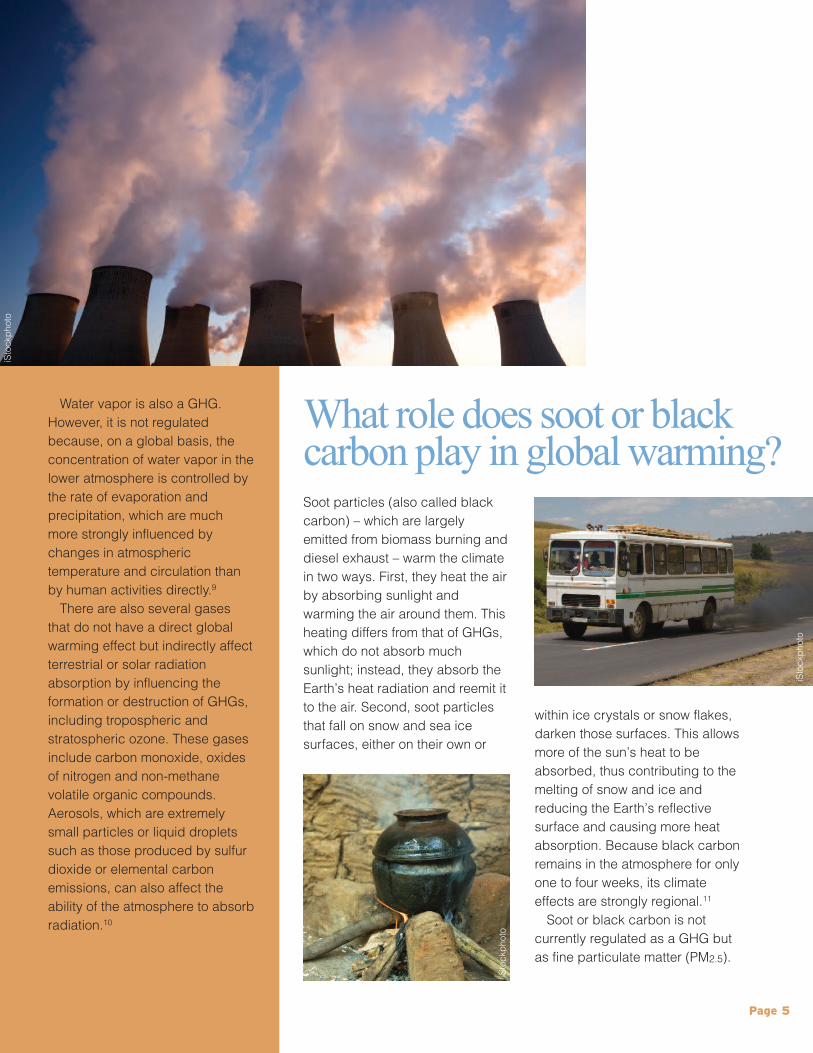
Soot particles (also called blackcarbon) – which are largelyemitted from biomass burning anddiesel exhaust – warm the climatein two ways. First, they heat the airby absorbing sunlight andwarming the air around them. Thisheating differs from that of GHGs,which do not absorb muchsunlight; instead, they absorb theEarth’s heat radiation and reemit itto the air. Second, soot particlesthat fall on snow and sea icesurfaces, either on their own or
within ice crystals or snow flakes,darken those surfaces. This allowsmore of the sun’s heat to beabsorbed, thus contributing to themelting of snow and ice andreducing the Earth’s reflectivesurface and causing more heatabsorption. Because black carbonremains in the atmosphere for onlyone to four weeks, its climateeffects are strongly regional.11
Soot or black carbon is notcurrently regulated as a GHG butas fine particulate matter (PM2.5).
What role does soot or blackcarbon play in global warming?
Water vapor is also a GHG.However, it is not regulatedbecause, on a global basis, theconcentration of water vapor in thelower atmosphere is controlled bythe rate of evaporation andprecipitation, which are muchmore strongly influenced bychanges in atmospherictemperature and circulation thanby human activities directly.9
There are also several gasesthat do not have a direct globalwarming effect but indirectly affectterrestrial or solar radiationabsorption by influencing theformation or destruction of GHGs,including tropospheric andstratospheric ozone. These gasesinclude carbon monoxide, oxidesof nitrogen and non-methanevolatile organic compounds.Aerosols, which are extremelysmall particles or liquid dropletssuch as those produced by sulfurdioxide or elemental carbonemissions, can also affect theability of the atmosphere to absorbradiation.10
iSto
ckph
oto
iSto
ckph
oto
iSto
ckph
oto

As shown in the pie chart below,85.1% of U.S. GHG emissions areCO2 emissions. The vast majority ofCO2 emissions – 94% – are fromfossil fuel combustion. The secondpie chart illustrates the majorsources of CO2 emitted throughfossil fuel combustion in millionmetric tons of CO2 equivalent (MMTCO2e).
The remaining GHGs make up
14.9% of the U.S. GHG emissionsinventory. Sources of theseemissions include entericfermentation (CH4), landfills (CH4),agricultural soil management (N2O),substitution of ozone-depletingsubstances in refrigeration (HFCs),semi-conducture manufacturing(PFCs), aluminum production(PFCs) and electrical transmissionand distribution (SF6).12
What are the largest sources ofhuman-caused gHg emissionsin the U.s.?
0.2%0.1%
85.1%
2363.5
Sources of Fossil Fuel Combustion CO2 Emissionsin 2008 (MMT CO2e)
Composition by Gases of U.S. GHG Inventory in 2008
1772.4
1785.3
� CO2
� CH4
� N2O� HFCs� PFCs� SF6
� Electricity Generation� Transportation� Other
1.8%4.6%
8.2%
Page 6
iSto
ckph
oto
iSto
ckph
oto

Page 7
How do gHgs differ fromconventional air pollutants? How are they similar?
emissions ultimately contribute tototal atmospheric concentrations.Thus, while reducing emissionsof conventional air pollutantsdecreases their concentrations inthe atmosphere in a relativelyshort time, atmosphericconcentrations of the majorGHGs can only be graduallyreduced over years anddecades.
• Exert their climate changeeffects over a very long time.15
However, there are also similarities:
• Many of the same activities thatemit conventional air pollutantsalso emit GHGs – the burning offossil fuels to produce electricity,heat or drive engines and theburning of biomass, forexample.16
• Most of the largest emitters ofGHGs are also large emitters ofconventional air pollutants.17
• Some conventional air pollutantsare also GHGs – for example,soot/black carbon andtropospheric ozone.18
• Both GHGs and conventional airpollutants affect public healthand welfare, albeit throughdifferent mechanisms.19
GHGs differ from conventional airpollutants in several importantways. The major GHGs have muchlonger atmospheric lives, whileconventional air pollutants typicallyremain airborne for only days orweeks.13 Because the major GHGshave longer lives, they:
• Become well-mixed in theatmosphere and theirconcentration tends to be evenlydistributed around the world.(However, some recent researchhas found that there can be CO2
“hot spots.”)14
• Build up in the atmosphere sothat past, present and future
iSto
ckph
oto
iSto
ckph
oto
iSto
ckph
oto

Page 8
Global Temperature(Meteorological stations)
1880 1900 1920 1940 1960 1980 2000
Temperature Anomaly (°C)
Annual Mean5-year Running Mean
.8
.6
.4
.2
.0
-.2
-.4
-.6
Source: http://data.giss.nasa.gov/gistemp/graphs/. The white bars show uncertainty estimates.
Giff
ord
Won
g (g
iffor
d.w
ong@
dart
mou
th.e
du)

Page 9
Measurements show thataveraged over the globe, theEarth’s surface has warmed byabout 0.8 degrees Centigrade (ºC)(1.44°F) (with an uncertainty ofabout ±0.2ºC) since 1850. Thiswarming has not been gradual;
instead, it has been largelyconcentrated in two periods – fromaround 1910 to around 1940 andfrom around 1975 to around2000.20 Since 2000, this warmingtrend has continued – the decade2000-2009 was, globally, around0.15ºC warmer than the decade1990-1999.21
Global-average CO2
concentrations have increased
from levels of around 280 partsper million (ppm) in the mid-19th
century (prior to the IndustrialRevolution) to 394.35 ppm in May2011.22 The atmosphericconcentration of CO2 exceeds byfar the natural range over the last650,000 years (180 to 300 ppm)as determined from ice coresextracted from Antarctic andGreenland ice sheets.23
How much has the planet warmed? How much have gHg concentrations increased?
While water vapor is a strong GHGand is an important contributor tothe natural greenhouse effect, itreadily evaporates into andcondenses out of the atmosphere.The amount of water in the air isprimarily a function of temperature,with warmer air holding morewater than colder air. Water vaporstays in the atmosphere anaverage of just a few days.24 Forthese reasons, it could not be thesole cause of global temperatureincreases. However, since globaltemperatures are rising andwarmer air holds more water,research from the NationalAeronautics and SpaceAdministration suggests that thisincrease in humidity amplifies thewarming from CO2 due to positivefeedback loops.25
How do we know that watervapor is not driving globalwarming?
Shut
ters
tock
Imag
es
Ken
dric
k Ta
ylor
(ken
dric
k.ta
ylor
@dr
i.edu
)
Page 10
The size and sustained nature ofthe observed global-averagesurface warming on decadal andlonger timescales greatly exceedsthe internal climate variabilitysimulated by the complex climatemodels. Unless this variability hasbeen grossly underestimated, theobserved climate change mustresult from natural and/or human-induced climate forcing.26
When natural factors alone areconsidered, computer models donot reproduce the climate warmingwe have observed. Only whenhuman-made GHGs are includeddo they accurately recreate whathas happened in the real world.27
There are four particularexamples that show a human
“fingerprint” on the warming thathas been recorded.28
• Twentieth-century warming.During the twentieth century, thewarming of the planet was notgradual but occurred in twodistinct phases. There was alarge warming between 1910 and1940, moderate cooling between1940 and 1975 and a largewarming from the 1975 to thepresent. Scientists at the NationalCenter for Atmospheric Researchexplored the extent to whichnatural and man-made forcingscontributed to this pattern ofwarming, then cooling, thenwarming. The results of this studyidentify the enhanced GHG effect
as the dominant cause of globalwarming over the past threedecades. If not for the temporarycooling between 1940 and 1975from volcanic and man-madeaerosol emissions, the Earthmight be even warmer than it istoday.29
• Ocean heat content. Scientistsat the National Oceanic andAtmospheric Administration(NOAA) in 2005 reported that theocean as a whole has beenwarming over the past fivedecades. Simultaneous warmingof all the world’s oceans couldonly occur through externalforcing, as there is no othersource of this much energy withinthe climate system. Further studyfound that the warming hasoccurred from the surfacedownward, meaning that the heatin the oceans must be comingfrom the atmosphere. Modelingof internal variability alone orinternal variability combined withsolar and volcanic forcings didnot produce temperature profilesthat matched this fingerprint.However, the combined influenceof human-induced forcings,natural forcings and internalvariability reproduced the patternof heat penetration for eachocean. Human-caused GHGsstrongly dominated the overallforcing.30
What evidence do we have that global warming isanthropogenic (man-made) rather than from naturalcauses?
iSto
ckph
oto

• Vertical structure of theatmosphere. The height of thetropopause, which represents thetransition between the Earth’slower atmosphere (troposphere)and upper atmosphere(stratosphere), has increased.Scientists in 2003 examined whatfactors (forcings) caused thisincrease in height – was it thetroposphere getting hotter or thestratosphere getting cooler, orboth? When they used a modelthat included natural and human-induced forcings, thetropopause’s height expanded tothe same extent as what hasbeen measured. Human-causedGHGs, which warm thetroposphere, and stratosphericozone depletion (by man-madechemicals), which cools thestratosphere, dominated theforcing. Human-caused GHGscaused about 40% of the rise,whereas ozone depletion causedabout 60%. Overall, the effect ofsolar forcing, which contributedslightly (less than 10%) to the rise
of the tropopause, was canceledby a small negative forcing(decrease in tropopause height)from volcanoes. Thus, human-induced forcings from GHGs andozone-depleting chemicalsprovide the best explanation forthe observed increase in theelevation of the tropopause overthe past few decades.31
• The ratio of radioactive-freecarbon and carbon-14 (14C)32 inthe atmosphere. Fossil fuels donot contain 14C because all of theradiocarbon initially present in thefossils has decayed away.Scientists can use 14Cmeasurements to determine theage of CO2 collected in airsamples and from this methodcan calculate what proportion ofthe CO2 in the sample comesfrom fossil fuels. Since theIndustrial Revolution, theconcentration of 14C hasdecreased steadily in theatmosphere, which means thatthe atmospheric increase in CO2
is dominated by fossil fuelemissions.33
Furthermore, theIntergovernmental Panel on ClimateChange (IPCC) has identified foursets of evidence supporting theconclusion that changes in manyphysical and biological systems arelinked to human-caused warming.34
For example, of the more than29,000 observational data seriesfrom 75 studies that showsignificant change in manyphysical and biological systems,more than 89% are consistent withthe direction of change expectedas a response to warming. Inaddition, the geographical regionsof significant warming across theglobe align closely to the locationsof significant observed changesconsistent with warming. Thisalignment is very unlikely to be duesolely to natural variability oftemperatures or natural variabilityof the systems, according to theIPCC. See Figure SPM.1, on page12, taken from the IPCC report.
Shut
ters
tock
Imag
es
iSto
ckph
oto

FIGURE SPM.1. Locations of significant changes in data series of physical systems (snow, ice and frozen ground;hydrology; and coastal processes) and biological systems (terrestrial, marine, and freshwater biological systems), areshown together with surface air temperature changes over the period 1970-2004. White areas do not contain sufficientobservational climate data to estimate a temperature trend. The 2 x 2 boxes show the total number of data series withsignificant changes (top row) and the percentage of those consistent with warming (bottom row). Locations of large-areamarine changes are not shown on the map. [Working Group II Fourth Assessment F1.8, F1.9; Working Group I FourthAssessment F3.9b].35
Changes in physical and biological systemsand surface temperature 1970-2004
NAM LA EUR AFR AS ANZ PR* TER MFW** GLO
355 455
94% 92%
53 5
98%100%
106 8
96%100%
120 24
91%100%
764
94% 90%
5 2
100%100%
6 0
100% —
1 85
100% 99%
765
94% 90%
119 1111
94% 89%
28,115
Observed data series
Physical systems (snow, ice and frozen ground; hydrology; costal processes
Biological systems (terrestrial, marine, and freshwater)
Temperature change °C 1970-2004
-1.0 -0.2 0.2 1.0 2.0 3.5
* Polar regions include also observed changes in marine and freshwater biological systems.** Marine and freshwater includes observed changes at sites and large areas in oceans, small islands and continents.Locations of large-area marine changes are not shown on the map.
*** Circles in Europe represent 1 to 7,500 data series.
Physical
Number ofsignificantobserved changes
Percentage ofsignificantchangesconsistentwith warming
Biological
Number ofsignificantobserved changes
Percentageof significantchangesconsistentwith warming
Europe***
1-30
31-100
101-800
801-1,200
1,201-7,500
28,586 28,671
Page 12

Page 13
In addition, other possiblecauses of warming have beenevaluated and discarded:36
• While the climate system variesnaturally, a rigorous statisticalevaluation of climate trends, inaddition to analyses usingsophisticated computer models,indicates that the observedwarming, especially the warmingsince the 1970s, cannot be solelyattributed to natural variation.
• Satellite measurementsunequivocally show that solaroutput has not increased over thepast 30 years, so an increase insolar energy cannot beresponsible for warming sincethe 1970s.
• Direct measurements show thatcosmic rays have neither
increased nor decreased duringthe past 30 years. (Somescientists have hypothesized thatcosmic rays could influencecloud formation (and thusclimate).) Moreover, scientistshave not found a plausiblemechanism that would explainhow cosmic rays would influenceclimate.
Finally, the basic physics bywhich GHGs, including CO2, warmthe Earth has been understood for
more than a century, and directmeasurements show clearly thatCO2 concentrations in theatmosphere have increasedsignificantly in response toemissions from fuel combustionand other human activities.Therefore, even absent any directevidence that warming hasoccurred, one would expect theEarth’s climate to change over timein response to continued emissionsof CO2 and other GHGs.
What is the scientific consensus on climate change?The overwhelming scientificconsensus is that there is clearevidence that climate change isaffecting the Earth and willcontinue to affect the planet unlesswe reduce GHG emissions:
• The IPCC, formed in 1988, is agroup commissioned by theWorld MeteorologicalOrganization and the UNEnvironment Program to reporton the latest scientific
knowledge on climate change.Thousands of scientistsparticipate in the IPCC processand their work is reviewed by the194 governments that aremembers of the IPCC (whichinclude the U.S.). In 2007, theIPCC published its latest reviewof global warming science,called the Fourth AssessmentReport. In that review, the IPCCconcluded that “[w]arming of theclimate system is unequivocal”37
and that “[m]ost of the observedincrease in global averagetemperatures since the mid-20th
century is very likely [(more than90% likely)]38 due to theobserved increase inanthropogenic [human-caused]greenhouse gasconcentrations.”39
iSto
ckph
oto
NA
SA
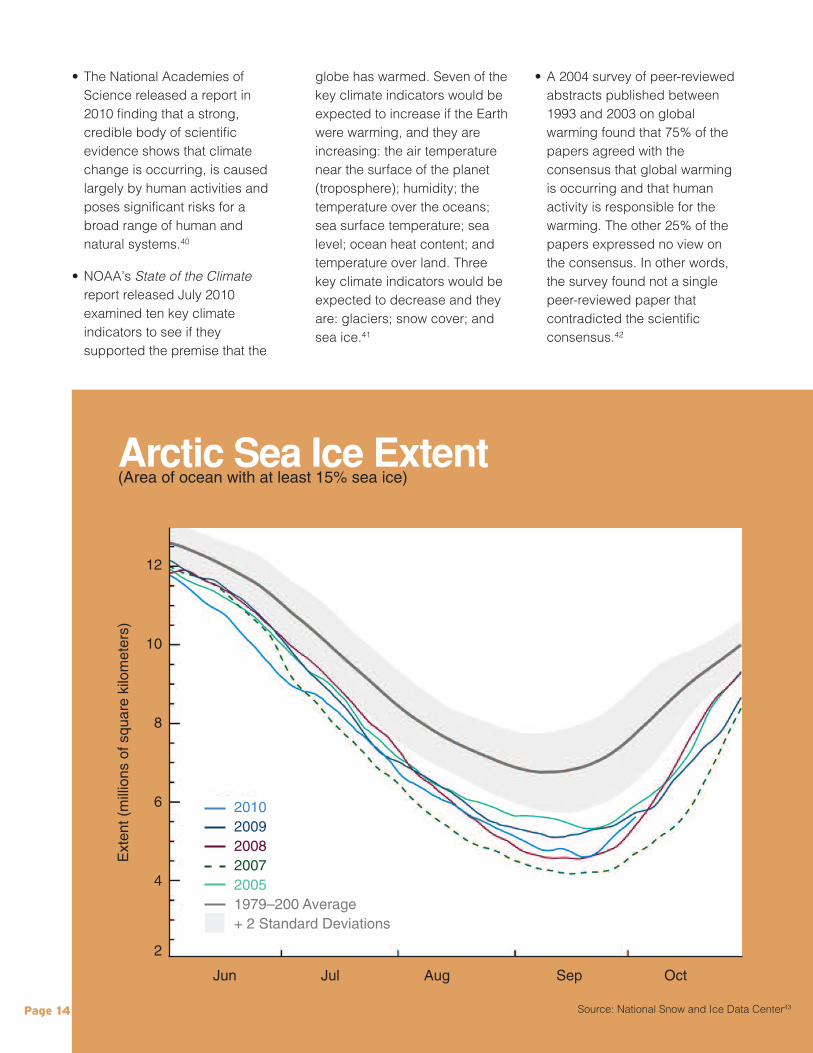
Arctic Sea Ice Extent(Area of ocean with at least 15% sea ice)
Jun Jul Aug Sep Oct
Extent (millions of square kilometers)
12
10
8
6
4
2
201020092008200720051979–200 Average+ 2 Standard Deviations
Page 14
• The National Academies ofScience released a report in2010 finding that a strong,credible body of scientificevidence shows that climatechange is occurring, is causedlargely by human activities andposes significant risks for abroad range of human andnatural systems.40
• NOAA’s State of the Climatereport released July 2010examined ten key climateindicators to see if theysupported the premise that the
globe has warmed. Seven of thekey climate indicators would beexpected to increase if the Earthwere warming, and they areincreasing: the air temperaturenear the surface of the planet(troposphere); humidity; thetemperature over the oceans;sea surface temperature; sealevel; ocean heat content; andtemperature over land. Threekey climate indicators would beexpected to decrease and theyare: glaciers; snow cover; andsea ice.41
• A 2004 survey of peer-reviewedabstracts published between1993 and 2003 on globalwarming found that 75% of thepapers agreed with theconsensus that global warmingis occurring and that humanactivity is responsible for thewarming. The other 25% of thepapers expressed no view onthe consensus. In other words,the survey found not a singlepeer-reviewed paper thatcontradicted the scientificconsensus.42
Source: National Snow and Ice Data Center43

Page 15
endnotes1 For further information, see EPA’s web site on global warming,http://epa.gov/climatechange/basicinfo.html, and the Pew Center on Global Climate Change’s fact sheets on global warming,http://www.pewclimate.org/science-impacts/factsheets.2 Pew Center on Global Climate Change, “The Causes of Climate Change,”Science Brief 1 (August 2008) at 2, available at http://www.pewclimate.org/docUploads/global-warming-science-brief-august08.pdf. See also National Research Council of the National Academies of Science, “Advancing the Science of Climate Change,” (2010), p. 189, available athttp://dels.nas.edu/Report/Advancing-Science-Climate-Change/12782.3 For further information, see EPA’s web site on global warming,http://epa.gov/climatechange/basicinfo.html.4 EPA, “Frequently Asked Questions About Global Warming and ClimateChange: Back to Basics,” available athttp://www.epa.gov/climatechange/downloads/Climate_Basics.pdf.5 The text of the Kyoto Protocol is available athttp://unfccc.int/resource/docs/convkp/kpeng.pdf.6 EPA Endangerment and Cause or Contribute Findings for GHGs Under Section 202(a) of the Clean Air Act, http://www.epa.gov/climatechange/endan-germent.html.7 Department of State, US Climate Action Report 2010, Chapter 3 – GHG Inven-tory, available at http://www.state.gov/documents/organization/140009.pdf andEPA web site on high GWP GHGs, http://www.epa.gov/highgwp/scientific.html.8 Department of State, US Climate Action Report 2010, Chapter 3 – GHG Inventory, p. 31, available at http://www.state.gov/documents/organization/140009.pdf.9 National Research Council of the National Academies of Science, “Advancingthe Science of Climate Change,” (2010), p. 194, available athttp://dels.nas.edu/Report/Advancing-Science-Climate-Change/1278210 Department of State, US Climate Action Report 2010, Chapter 3 – GHG Inventory, p. 23, available at http://www.state.gov/documents/organization/140009.pdf.11 The Pew Center on Global Climate Change, “What is Black Carbon?” (April2010), available at http://www.pewclimate.org/global-warming-basics/blackcar-bon-factsheet. See also National Research Council of the National Academiesof Science, “Advancing the Science of Climate Change,” (2010), pp. 196-197,available at http://dels.nas.edu/Report/Advancing-Science-Climate-Change/12782.12 EPA, US GHG Inventory, available at: http://epa.gov/climatechange/emissions/downloads10/US-GHG-Inventory-2010_ExecutiveSummary.pdf.13 EPA’s Advance Notice of Proposed Rulemaking on Regulating GreenhouseGases Under the Clean Air Act, 73 Federal Register (July 30, 2008), pp.44400-44401.14 Study on the Enhancement of Local Air Pollution by Urban Carbon DioxideDomes (Mark Jacobson, Stanford University), available athttp://www.stanford.edu/group/efmh/jacobson/Articles/V/urbanCO2domes.html.15 73 Federal Register, pp. 44400-44401.16 Id., p. 44407.17 Id.18 Id, pp. 44424-44425.19 EPA Endangerment and Cause or Contribute Findings for GHGs Under Section202(a) of the Clean Air Act, available at http://www.epa.gov/climatechange/endangerment.html.20 The Royal Society, “Climate Change: A Summary of the Science,” (Sept.2010), p.5, available at http://royalsociety.org/climate-change-summary-of-science/. See also National Research Council of the National Academies ofScience, “Advancing the Science of Climate Change,” (2010), pp. 30-32, avail-able at http://dels.nas.edu/Report/Advancing-Science-Climate-Change/12782.21 The Royal Society, “Climate Change: A Summary of the Science,” (Sept.2010), p.5, available at http://royalsociety.org/climate-change-summary-of-science/.22 The Royal Society, “Climate Change: A Summary of the Science,” (Sept.2010), p.6, available at http://royalsociety.org/climate-change-summary-of-science/, and http://co2now.org/ (which posts the most recent monthly CO2concentrations measured at the Mauna Loa Observatory in Hawaii).23 Intergovernmental Panel on Climate Change (IPCC), Summary for Policy-makers, in Climate Change 2007: The Physical Science Basis. Contribution ofWorking Group I to the Fourth Assessment Report of the IntergovernmentalPanel on Climate Change, p. 2, available at http://www.ipcc.ch/pdf/assessment-report/ar4/wg1/ar4-wg1-spm.pdf. See also National ResearchCouncil of the National Academies of Science, “Advancing the Science of Climate Change,” (2010), pp. 187-188, available at http://dels.nas.edu/Report/Advancing-Science-Climate-Change/12782.
24 National Research Council of the National Academies of Science, “Advanc-ing the Science of Climate Change,” (2010), pp. 36-37 and 195, available athttp://dels.nas.edu/Report/Advancing-Science-Climate-Change/12782. Seealso Environmental Defense Fund, “Carbon Dioxide, Water Vapor and GlobalWarming,” (Nov. 8, 2006), available at http://www.edf.org/documents/5596_GlobalWarmingWaterVapor_onepager.pdf, and National Aeronautics andSpace Administration (NASA), “Carbon Dioxide Controls Temperature,” available at http://www.nasa.gov/topics/earth/features/co2-temperature.html.25 Kathryn Hansen, “Water Vapor Confirmed as Major Player in Climate Change,”available at http://www.nasa.gov/topics/earth/features/vapor_warming.html.26 The Royal Society, “Climate Change: A Summary of the Science,” (Sept.2010), p.9, available at http://royalsociety.org/climate-change-summary-of-science/. See also National Research Council of the National Academies ofScience, “Advancing the Science of Climate Change,” (2010), p. 28, availableat http://dels.nas.edu/Report/Advancing-Science-Climate-Change/1278227 The Royal Society, “Climate Change: A Summary of the Science,” (Sept.2010), p.9, available at http://royalsociety.org/climate-change-summary-of-science/. See also National Research Council of the National Academies ofScience, “Advancing the Science of Climate Change,” (2010), p. 38, availableat http://dels.nas.edu/Report/Advancing-Science-Climate-Change/12782.28 Adapted in part from the Pew Center on Global Climate Change, “TheCauses of Climate Change,” Science Brief 1 (August 2008), available athttp://www.pewclimate.org/docUploads/global-warming-science-brief-au-gust08.pdf.29 IPCC, Climate Change 2001: The Scientific Basis. Contribution of WorkingGroup I to the Third Assessment Report of the Intergovernmental Panel on Climate Change, Chapter 12. Available at http://www.grida.no/publications/other/ipcc_tar/?src=/climate/ipcc_tar/wg1/index.htm.30 Barnett et al., “Penetration of human-induced warming into the world'soceans,” (2005), Science 309:284-287.31 Santer, B.D. et al., “Contributions of anthropogenic and natural forcing to recent tropopause height changes,” (2003), Science 301:479-483; and Santer,B. D., et al., “Identification of anthropogenic climate change using a secondgeneration reanalysis,” (2004), Journal of Geophysical Research-Atmospheres109:D21104, doi:10.1029/2004JD005075.32 Carbon-14 or 14C is also known as radiocarbon, because it is the only carbon isotope that is radioactive.33 Lauren Shoemaker, “Fingerprints of Emissions and Carbon Cycle: Stable andRadioactive Isotopes of Carbon Dioxide,” (August 2010), available athttp://www.esrl.noaa.gov/gmd/outreach/isotopes/c14tracer.html.34 IPCC, Climate Change 2007: Working Group II: Impacts, Adaptation and Vulnerability, posted at http://www.ipcc.ch/publications_and_data/ar4/wg2/en/contents.html.35 IPCC, Climate Change 2007: Impacts, Adaptation and Vulnerability. WorkingGroup II Contribution to the Fourth Assessment Report of the IntergovernmentalPanel on Climate Change, Figure SPM.1 Cambridge University Press, posted athttp://www.ipcc.ch/publications_and_data/ar4/wg2/en/spmsspm-b.html.36 National Research Council of the National Academies of Science, “Advancing the Science of Climate Change,” (2010), p. 38, available athttp://dels.nas.edu/Report/Advancing-Science-Climate-Change/12782.37 IPCC, Fourth Assessment Report: Climate Change 2007 – Synthesis Report,Summary for Policymakers, Chapter 1 (Observed changes in climate and theireffects), available athttp://www.ipcc.ch/publications_and_data/ar4/syr/en/spms1.html.38 The IPCC described what terms such as “very likely,” “likely,” “not likely” andothers meant in the Introduction to the Synthesis Report. “Very likely” meansgreater than a 90% probability of occurrence. IPCC, Fourth Assessment Report: Climate Change 2007 – Synthesis Report, Introduction, available athttp://www.ipcc.ch/publications_and_data/ar4/syr/en/mainssyr-introduction.html.39 IPCC Fourth Assessment Report: Climate Change 2007 – Synthesis Report,Summary for Policymakers, Chapter 2 (Causes of Change), available athttp://www.ipcc.ch/publications_and_data/ar4/syr/en/spms2.html.40 National Research Council of the National Academies of Science, “Advancing the Science of Climate Change,” (2010), available athttp://dels.nas.edu/Report/Advancing-Science-Climate-Change/12782.41 D.S. Arndt, M.O. Baringer and M.R. Johnston, eds., “State of the Climate in2009,” available at http://www.ncdc.noaa.gov/bams-state-of-the-climate/2009.php.42 Naomi Oreskes, “Undeniable Global Warming,” The Washington Post(Dec. 26, 2004), p.B7.43 National Snow and Ice Data Center, available athttp://nsidc.org/data/seaice_index/.
NACAA444 N. Capitol St. NWSuite 307Washington, DC [email protected]
ACKNOWLEDGEMENTS
We would like to thank all the NACAAmembers who reviewed an earlier draft ofthis brochure and provided helpfulcomments. We extend special appreciationto Stu Clark (Air Quality Program Manager,Washington Department of Ecology) andLarry Greene (Air Pollution Control Officer,Sacramento Metropolitan Air QualityManagement District), co-chairs ofNACAA’s Global Warming Committee, for their comments and guidance.
Report researched and written by AmyRoyden-Bloom, NACAA Senior StaffAssociate.
Report design by Barbara Raab Sgouros.
The National Association of Clean Air Agencies (NACAA) is
an association of air pollution control agencies in 51 states
and territories and over 165 major metropolitan areas across
the United States.
State and local air pollution control officials formed NACAA
(formerly, STAPPA/ALAPCO) over 30 years ago to improve
their effectiveness as managers of air quality programs. The
associations serve to encourage the exchange of information
among air pollution control officials, to enhance
communication and cooperation among federal, state, and
local regulatory agencies, and to promote good management
of our air resources.
iSto
ckph
oto


