Prince William County 2003 Stormwater Infrastructure Management SEA Report Page B-185 STORMWATER INFRASTRUCTURE MANAGEMENT SECTION LOCATOR OVERVIEW SPENDING AND STAFFING: Combined Program Spending Spending by Jurisdiction Stormwater Management Fee Program Development Fee Program Expenditures Fee Supported Authorized Employees OUTPUTS: Change in Management Fee Program Outputs Management Fee Program Outputs Change in Development Fee Program Outputs Development Fee Program Outputs RESULTS: Water Quality Permit Compliance Plans Reviewed within Time Standard Flood Plain and Drainage Assistance within Time Standard BACKGROUND Mission: Stormwater Infrastructure Management is a branch under the Environmental Services Division of Public Works. The mission of Stormwater Infrastructure Management is to protect the environment and minimize damage from flooding. Key activities of the division include Air and Water Quality, Inspections and Reviews, Environmental Education, the Prince William Soil and Water Conservation District, and Drainage Inspections and Maintenance. The Stormwater Infrastructure Management Division is composed of two programs: the Stormwater Management Fee Program and the Development Fee Program. Funding for the Stormwater Management Fee Program comes from the Stormwater Management Fee under which property owners are assessed an annual fee based on the property’s impervious area, which relates to stormwater flow. Funding for the Development Fee Program comes from plan review and inspection fees. Resources: FY 2004 Adopted Budget: $6,269,004 FY 2004 Authorized Staffing: 56.09 Major Projected FY 2004 Outputs: Storm Water Management & Best Mgmt Practice Systems Inspected 600 Miles of Drainage Systems Inspected 355 Storm Water Ponds Maintained 70 Drainage Assistance Requests received 550 Site Development Inspections 16,500 Erosion Control Inspections 8,800 Site Development Plans Reviewed 1,000 Individual Lot Grading Plans Reviewed 3,500 FY 2004 Targets for Key Results Goals: Site Development Plans Reviewed within 22 Calendar Days 90% Lot Grading Plans Reviewed within 10 Business Days 97% Flood Plain Determinations Completed within 3 Business Days 100% Drainage Assistance Requests Responded to within 5 Business Days 95% FY 2004 Adopted Budget By Activity $1,243,036 $3,075,781 $1,573,047 $131,369 $246,771 Air & Water Quality Inspections & Reviews Drainage Inspections & M aintenance Environmental Education Soil & Water ConservationDistrict
Transcript
Prince William County 2003 Stormwater Infrastructure Management SEA Report
Page B-185
STORMWATERINFRASTRUCTURE
MANAGEMENT
SECTION LOCATOR
OVERVIEW
SPENDING AND STAFFING:Combined Program SpendingSpending by JurisdictionStormwater Management Fee ProgramDevelopment Fee ProgramExpenditures Fee SupportedAuthorized Employees
OUTPUTS:Change in Management Fee Program OutputsManagement Fee Program OutputsChange in Development Fee Program OutputsDevelopment Fee Program Outputs
RESULTS:Water Quality Permit CompliancePlans Reviewed within Time StandardFlood Plain and Drainage Assistance within Time Standard
BACKGROUND
Mission:Stormwater Infrastructure Management is a branch under the Environmental ServicesDivision of Public Works. The mission of Stormwater Infrastructure Management is toprotect the environment and minimize damage from flooding. Key activities of the divisioninclude Air and Water Quality, Inspections and Reviews, Environmental Education, thePrince William Soil and Water Conservation District, and Drainage Inspections andMaintenance. The Stormwater Infrastructure Management Division is composed of twoprograms: the Stormwater Management Fee Program and the Development Fee Program.Funding for the Stormwater Management Fee Program comes from the StormwaterManagement Fee under which property owners are assessed an annual fee based on theproperty’s impervious area, which relates to stormwater flow. Funding for theDevelopment Fee Program comes from plan review and inspection fees.
Major Projected FY 2004 Outputs:Storm Water Management & Best Mgmt Practice Systems Inspected 600Miles of Drainage Systems Inspected 355Storm Water Ponds Maintained 70Drainage Assistance Requests received 550Site Development Inspections 16,500Erosion Control Inspections 8,800Site Development Plans Reviewed 1,000Individual Lot Grading Plans Reviewed 3,500
FY 2004 Targets for Key Results Goals:Site Development Plans Reviewed within 22 Calendar Days 90%Lot Grading Plans Reviewed within 10 Business Days 97%Flood Plain Determinations Completed within 3 Business Days 100%Drainage Assistance Requests Responded to within 5 Business Days 95%
FY 2004 Adopted Budget By Activity
$1,243,036
$3,075,781
$1,573,047
$131,369
$246,771
Air & Water Quality
Inspections & Reviews
Drainage Inspections & Maintenance
Environmental Education
Soil & Water ConservationDistrict
Prince William County 2003 Stormwater Infrastructure Management SEA Report
Page B-186
STORMWATERINFRASTRUCTURE
MANAGEMENT
SECTION LOCATOR
OVERVIEW
SPENDING AND STAFFING:Combined Program SpendingSpending by JurisdictionStormwater Management Fee ProgramDevelopment Fee ProgramExpenditures Fee SupportedAuthorized Employees
OUTPUTS:Change in Management Fee Program OutputsManagement Fee Program OutputsChange in Development Fee Program OutputsDevelopment Fee Program Outputs
RESULTS:Water Quality Permit CompliancePlans Reviewed within Time StandardFlood Plain and Drainage Assistance within Time Standard
SUMMARY OF SERVICE EFFORTS AND ACCOMPLISHMENTSFISCAL YEARS 1998 TO 2003
Following is a listing of some notable program results for the Stormwater InfrastructureManagement service area. A page reference to a more detailed discussion of eachsummarized item is also provided below.
Use of SEA Data:Variances in SEA data between jurisdictions should be used as a basis for looking intoand considering differences in the mix of services offered and operating methodsbetween jurisdictions. The information may also be used to at least partially explain whycertain services cost Prince William residents more or less than what citizens in otherjurisdictions spend. Because additional factors beyond those identified in this reportmay impact spending and operating results, the data should not be used to make a finaldetermination that one jurisdiction is operating more efficiently than another.
Spending Efficiency Results Overall spending grew by
14% from FY 1998 to FY 2003. This increase was driven by Development Fee Program spending which grew by 56%. (pages 188 and 192)
In FY 2003 Prince William spent more on Stormwater Infrastructure Management services than Chesterfield and about the same amount as Fairfax. The difference in spending may be attributable to differences in key workload factors. (page 190)
The Stormwater Management Fee Program and Development Fee Program are fully fee supported. Development Fee program revenues have substantially exceeded spending in each year since FY 1998. Stormwater Management Fee Program revenues are projected to be adequate until FY 2007 when analysis shows a Stormwater Management Fee increase will be required. (pages 194-195)
Between FY 1998 and FY 2003 all Stormwater Management Fee Program key outputs grew faster than spending. (page 198)
Between FY 1998 and FY 2003 most Development Fee Program outputs grew faster than spending. While spending grew by 56%, single family inspections were up 254%, erosion control inspections were up 151%, site inspections were up 77%, and site plans reviewed were up 25%. (page 200)
Prince William County fully met Virginia Pollutant Discharge Elimination Program requirements. (page 203)
In FY 2003, 97% of site development and 94% of lot grading plans were reviewed within internal time standards. (page 205)
Prince William achieved a higher rate of plans reviewed within internal time standards than the comparison jurisdictions. (page 206)
In FY 2003, 100% of flood plain determinations were completed and 99% of drainage assistance requests were responded to within internal time standards. (page 207)
Prince William County 2003 Stormwater Infrastructure Management SEA Report
Page B-187
STORMWATERINFRASTRUCTURE
MANAGEMENT
SECTION LOCATOR
OVERVIEW
SPENDING AND STAFFING:Combined Program SpendingSpending by JurisdictionStormwater Management Fee ProgramDevelopment Fee ProgramExpenditures Fee SupportedAuthorized Employees
OUTPUTS:Change in Management Fee Program OutputsManagement Fee Program OutputsChange in Development Fee Program OutputsDevelopment Fee Program Outputs
RESULTS:Water Quality Permit CompliancePlans Reviewed within Time StandardFlood Plain and Drainage Assistance within Time Standard
Future Stormwater Infrastructure Management SEA Information Improvements:Measurement of program performance in government is an evolving process. In somecases quantifiable performance data may not be available because of the cost to developthe data or because methods of measurement have not yet been developed. In theStormwater Infrastructure Management service area performance data has not yet beendeveloped and therefore is not included in this report regarding two key goals areas,water quality and the quality of plan reviews. Water quality performance data is difficultto develop because of the numerous streams in the County, the many different pollutantsthat must be measured, and the need to take measures over an extended period of time.Stormwater Infrastructure Management is working to develop such measures and hopesto make those measures available in the future. As an intermediate outcome measure thedegree to which Prince William County is in compliance with the Federal Clean WaterAct’s National Pollutant Discharge Elimination System permit program requirements asreviewed by the Virginia Department of Environmental Quality is monitored and isreported in the Results section of this report. In regards to plan review, the timeliness ofplan review is included in the Results section of this report and management plans todevelop a quantifiable measure of the quality of plan review to include in future reports.
Communities Surveyed:Surveys were sent to three jurisdictions: Chesterfield, Fairfax, and Henrico Counties.Chesterfield County and Henrico County are the closest to Prince William in populationsize of any Virginia jurisdictions. These two Counties are within the Richmond, VAmetropolitan area. Fairfax County adjoins, Prince William County and is located withinthe Washington, DC metropolitan area. Survey responses were received fromChesterfield and Fairfax County. Henrico was unable to respond to the survey this year.
Detailed SEA Information:More detailed trend and comparative information is contained in the following pagesalong with contextual information. The following pages present specific StormwaterInfrastructure Management spending and staffing indicators followed by outputs and thenresults.
Prince William County 2003 Stormwater Infrastructure Management SEA Report
Page B-188
STORMWATERINFRASTRUCTURE
MANAGEMENT
SECTION LOCATOR
OVERVIEW
SPENDING AND STAFFING:Combined Program SpendingSpending by JurisdictionStormwater Management Fee ProgramDevelopment Fee ProgramExpenditures Fee SupportedAuthorized Employees
OUTPUTS:Change in Management Fee Program OutputsManagement Fee Program OutputsChange in Development Fee Program OutputsDevelopment Fee Program Outputs
RESULTS:Water Quality Permit CompliancePlans Reviewed within Time StandardFlood Plain and Drainage Assistance within Time Standard
Combined Stormwater Management Fee and Development Fee Program Directand Indirect Expenditures (Adjusted For Inflation)
Purpose: To provide an indicator of the relative level of spending on StormwaterInfrastructure Management services. Stormwater Infrastructure Managementoperations funded through both the stormwater management fee and throughdevelopment fees are included. This is not an efficiency measure since it does notconsider the output generated for the level of spending. Indirect expenditures aredetermined annually through a study conducted by an outside consultant. In the studythe consultant allocates the cost of certain services such as County Attorney servicesand Finance Department services to the various County agencies that received thoseservices during the year. Expenditures are adjusted for inflation to maintaincomparability between years. Fiscal Year 2004, the current budget year, is used as thebase year for inflation adjustments.
Trend:♦ Stormwater Infrastructure Management direct expenditures grew 14 percent from
1998 to 2003.♦ While Stormwater Infrastructure Management indirect expenditures varied across
years, 2003 indirect expenditures declined 9 percent from 1998.
Fiscal Year 2004 Adopted Budget:♦ FY 2004 budgeted expenditures are up 21.7% compared to the FY 2003 adopted
Prince William County 2003 Stormwater Infrastructure Management SEA Report
Page B-189
STORMWATERINFRASTRUCTURE
MANAGEMENT
SECTION LOCATOR
OVERVIEW
SPENDING AND STAFFING:Combined Program SpendingSpending by JurisdictionStormwater Management Fee ProgramDevelopment Fee ProgramExpenditures Fee SupportedAuthorized Employees
OUTPUTS:Change in Management Fee Program OutputsManagement Fee Program OutputsChange in Development Fee Program OutputsDevelopment Fee Program Outputs
RESULTS:Water Quality Permit CompliancePlans Reviewed within Time StandardFlood Plain and Drainage Assistance within Time Standard
Comments:♦ The FY 2004 budget increase funds 6 new positions, Stormwater Development Fee
Reserve contribution to the Phase III Building, an indirect cost allocation increase, adrainage inspection van, and additional drainage maintenance project funding. Theseprogram enhancements are described in more detail on pages 382 and 383 of theFY 2004 Adopted Fiscal Plan.
♦ A transfer from the General Fund in 1999 and 2000 made possible an increase in the“transfer to capital projects” expenditure budgets.
Prince William County 2003 Stormwater Infrastructure Management SEA Report
Page B-190
STORMWATERINFRASTRUCTURE
MANAGEMENT
SECTION LOCATOR
OVERVIEW
SPENDING AND STAFFING:Combined Program SpendingSpending by JurisdictionStormwater Management Fee ProgramDevelopment Fee ProgramExpenditures Fee SupportedAuthorized Employees
OUTPUTS:Change in Management Fee Program OutputsManagement Fee Program OutputsChange in Development Fee Program OutputsDevelopment Fee Program Outputs
RESULTS:Water Quality Permit CompliancePlans Reviewed within Time StandardFlood Plain and Drainage Assistance within Time Standard
Direct Expenditures By Jurisdiction (Adjusted For Inflation)
Purpose: To provide information on the relative size of operations at the comparisonjurisdictions. This is not an efficiency measure since it does not consider the outputgenerated for the level of spending. Fiscal Year 2004, the current budget year, is usedas the base year for inflation adjustments.
Compared to Other Jurisdictions:♦ Prince William spent less on stormwater infrastructure management services in 2002
and about the same amount in 2003 as Fairfax. Prince William spent more thanChesterfield County on stormwater infrastructure management services in both2002 and 2003.
Comments:♦ Stormwater infrastructure management spending is impacted by the pace of
development. Prince William reported a greater level of activity for key stormwater outputs than Chesterfield. Compared to Fairfax, Prince William reportedmore plans reviewed but fewer miles of drainage system and storm water pondsinventoried. Henrico was unable to respond to our survey this year.
Direct Stormwater Infrastructure Management Expenditures By Jurisidiction
$2,704,187$2,731,830
$5,351,119
$4,729,123
$4,694,850$4,282,143
$0
$1,000,000
$2,000,000
$3,000,000
$4,000,000
$5,000,000
$6,000,000
2002 2003
Fairfax
Prince William
Chesterfield
Fiscal Year 2003Miles of Drainage Stormwater
Systems Ponds Site Development Lot GradingInventoried Inventoried Plans Reviewed Lots Reviewed
Henrico Not Available Not Available Not Available Not AvailableChesterfield 246 90 213 Not AvailableFairfax 835 1,078 439 2,257Prince William 389 427 824 5,769
Prince William County 2003 Stormwater Infrastructure Management SEA Report
Page B-191
STORMWATERINFRASTRUCTURE
MANAGEMENT
SECTION LOCATOR
OVERVIEW
SPENDING AND STAFFING:Combined Program SpendingSpending by JurisdictionStormwater Management Fee ProgramDevelopment Fee ProgramExpenditures Fee SupportedAuthorized Employees
OUTPUTS:Change in Management Fee Program OutputsManagement Fee Program OutputsChange in Development Fee Program OutputsDevelopment Fee Program Outputs
RESULTS:Water Quality Permit CompliancePlans Reviewed within Time StandardFlood Plain and Drainage Assistance within Time Standard
Stormwater Management Fee Program Direct and Indirect Expenditures(Adjusted For Inflation)
Purpose: To provide information on the relative level of Stormwater Management FeeProgram direct and indirect expenditures from 1998 to 2003. The stormwatermanagement fee is paid by residential and nonresidential owners of developed propertybased on the amount of impervious area (rooftop, paved areas, etc.) on their property.Revenue from the stormwater management fee is dedicated solely to the operation andconstruction of watershed management projects. Indirect expenditures are determinedannually through a study conducted by an outside consultant. In the study the consultantallocates the cost of certain services such as County Attorney services and FinanceDepartment services to the various County agencies that received those services duringthe year. Expenditures are adjusted for inflation to maintain comparability between years.Fiscal Year 2004, the current budget year, is used as the base year for inflationadjustments.
Trend:♦ Stormwater Management Fee Program direct expenditures declined 7 percent from
1998 to 2003. Direct expenditures were at their highest level of the six year period in1998 and 2000.
♦ Stormwater Management Fee Program indirect expenditures decreased 55 percentfrom 1998 to 2003.
Percent Change1998 1999 2000 2001 2002 2003 1998 to 2003
Stormwater Management Fee Program Direct and Indirect Expenditures Adjusted for Inflation - 1998 to 2003
$2,765,993$2,354,942
$2,896,158$2,532,061 $2,478,587 $2,574,655
$360,870$353,680
$317,130$279,641 $163,149$363,435
$0
$500,000
$1,000,000
$1,500,000
$2,000,000
$2,500,000
$3,000,000
$3,500,000
1998 1999 2000 2001 2002 2003
Indirect Expenditures
Direct Expenditures
Prince William County 2003 Stormwater Infrastructure Management SEA Report
Page B-192
STORMWATERINFRASTRUCTURE
MANAGEMENT
SECTION LOCATOR
OVERVIEW
SPENDING AND STAFFING:Combined Program SpendingSpending by JurisdictionStormwater Management Fee ProgramDevelopment Fee ProgramExpenditures Fee SupportedAuthorized Employees
OUTPUTS:Change in Management Fee Program OutputsManagement Fee Program OutputsChange in Development Fee Program OutputsDevelopment Fee Program Outputs
RESULTS:Water Quality Permit CompliancePlans Reviewed within Time StandardFlood Plain and Drainage Assistance within Time Standard
Development Fee Program Direct and Indirect Expenditures(Adjusted For Inflation)
Purpose: To provide information on the relative level of Development Fee Programdirect and indirect expenditures from 1998 to 2003. Development Fee Program fundingcomes from plan review and inspection fees. Development Fee funding is used to meetexpenses of site plan and lot plan review, site development inspections, and erosioncontrol inspections. Indirect expenditures are determined annually through a studyconducted by an outside consultant. In the study the consultant allocates the cost ofcertain services such as County Attorney services and Finance Department services tothe various County agencies that received those services during the year. Expendituresare adjusted for inflation to maintain comparability between years. Fiscal Year 2004, thecurrent budget year, is used as the base year for inflation adjustments.
Trend:♦ Total Development Fee Program expenditures rose by 59 percent from 1998 to
2003.♦ Development Fee Program direct expenditures grew steadily with an overall
increase of 56 percent between 1998 and 2003.♦ Development Fee indirect expenditures grew by 80% between 1998 and 2003 with
the most significant increase occurring in 2000.♦ A transfer from the General Fund in 1999 and 2000 made possible an increase in
the “transfer to capital projects” expenditure budgets.
Comments:♦ Expenditures increased in response to increased development and also significant
funding beginning in 2003 to mitigate developer deficiencies when the County couldnot take action against the non-performing developer.
Percent Change1998 1999 2000 2001 2002 2003 1998 to 2003
Prince William County 2003 Stormwater Infrastructure Management SEA Report
Page B-193
STORMWATERINFRASTRUCTURE
MANAGEMENT
SECTION LOCATOR
OVERVIEW
SPENDING AND STAFFING:Combined Program SpendingSpending by JurisdictionStormwater Management Fee ProgramDevelopment Fee ProgramExpenditures Fee SupportedAuthorized Employees
OUTPUTS:Change in Management Fee Program OutputsManagement Fee Program OutputsChange in Development Fee Program OutputsDevelopment Fee Program Outputs
RESULTS:Water Quality Permit CompliancePlans Reviewed within Time StandardFlood Plain and Drainage Assistance within Time Standard
Percent of Total Expenditures Fee and Grant Supported
Purpose: This measure provides an indicator of the degree to which StormwaterInfrastructure Management services are supported by stormwater management fee,development fee, and grant revenue as opposed to general tax support. The measure iscomputed by dividing total fee and grant revenue by total Stormwater InfrastructureManagement expenditures. Total expenditures include both direct and indirectexpenditures.
Trend:♦ The percent of Stormwater Infrastructure Management expenditures fee and grant
supported was above 100 percent in each year. The percent fee and grant supportedrose quickly from 111 percent in 1998 to 152 percent in 2002 before declining to142 percent in 2003.
Comments:♦ Anticipated use of revenues in excess of expenditures is discussed on page 195.♦ The Stormwater Management Fee was increased by 15 percent in 2002 to meet
State & Federal regulatory requirements required by the Virginia Department ofEnvironmental Quality (DEQ) as part of permit modification.
Figures are Adjusted For Inflation1998 1999 2000 2001 2002 2003
Total Stormwater Fee & Grant Support $5,193,612 $4,922,900 $6,594,585 $6,415,855 $7,353,641 $7,341,354Total Stormwater Expenditures $4,668,383 $4,450,009 $5,195,581 $4,903,398 $4,827,360 $5,188,110Percent of Expenditures Fee Supported 111% 111% 127% 131% 152% 142%
Percent of Total Stormwater Infrastructure Management Expenditures Fee & Grant Supported
111% 111%
127%131%
142%152%
0%
40%
80%
120%
160%
1998 1999 2000 2001 2002 2003
Prince William County 2003 Stormwater Infrastructure Management SEA Report
Page B-194
STORMWATERINFRASTRUCTURE
MANAGEMENT
SECTION LOCATOR
OVERVIEW
SPENDING AND STAFFING:Combined Program SpendingSpending by JurisdictionStormwater Management Fee ProgramDevelopment Fee ProgramExpenditures Fee SupportedAuthorized Employees
OUTPUTS:Change in Management Fee Program OutputsManagement Fee Program OutputsChange in Development Fee Program OutputsDevelopment Fee Program Outputs
RESULTS:Water Quality Permit CompliancePlans Reviewed within Time StandardFlood Plain and Drainage Assistance within Time Standard
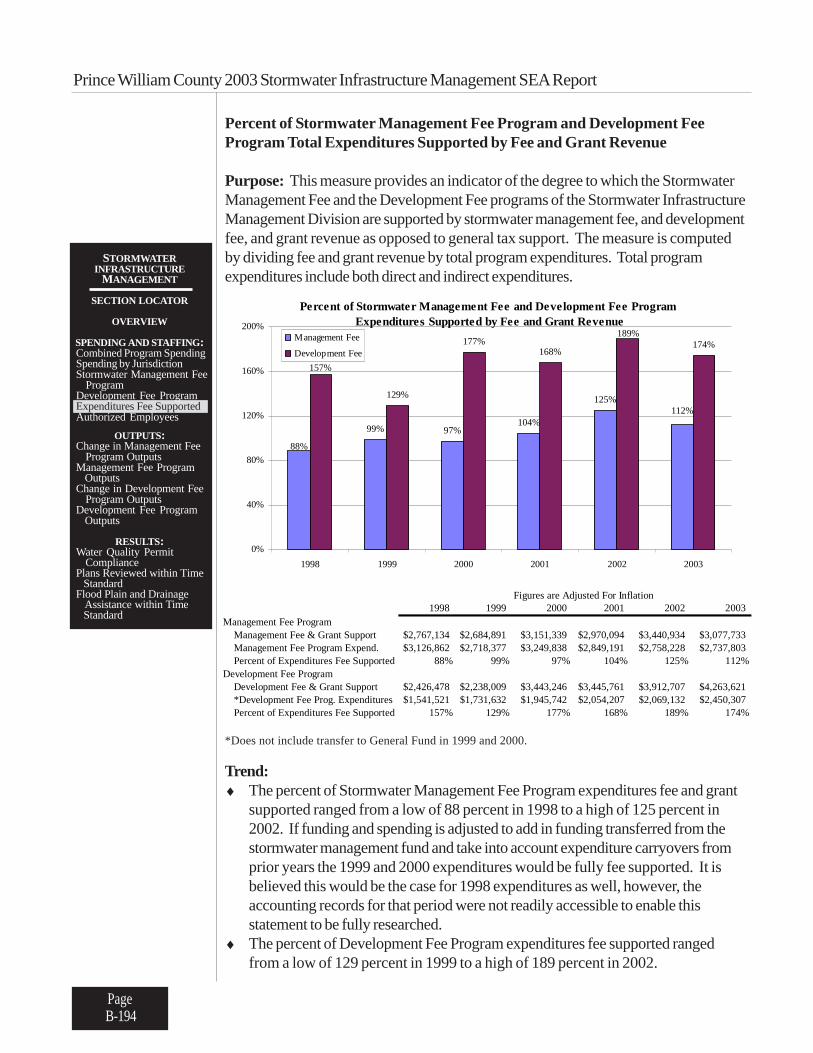
Percent of Stormwater Management Fee Program and Development FeeProgram Total Expenditures Supported by Fee and Grant Revenue
Purpose: This measure provides an indicator of the degree to which the StormwaterManagement Fee and the Development Fee programs of the Stormwater InfrastructureManagement Division are supported by stormwater management fee, and developmentfee, and grant revenue as opposed to general tax support. The measure is computedby dividing fee and grant revenue by total program expenditures. Total programexpenditures include both direct and indirect expenditures.
*Does not include transfer to General Fund in 1999 and 2000.
Trend:♦ The percent of Stormwater Management Fee Program expenditures fee and grant
supported ranged from a low of 88 percent in 1998 to a high of 125 percent in2002. If funding and spending is adjusted to add in funding transferred from thestormwater management fund and take into account expenditure carryovers fromprior years the 1999 and 2000 expenditures would be fully fee supported. It isbelieved this would be the case for 1998 expenditures as well, however, theaccounting records for that period were not readily accessible to enable thisstatement to be fully researched.
♦ The percent of Development Fee Program expenditures fee supported rangedfrom a low of 129 percent in 1999 to a high of 189 percent in 2002.
Percent of Stormwater Management Fee and Development Fee Program Expenditures Supported by Fee and Grant Revenue
99% 97%104%
125%129%
177%168%
174%
112%
88%
189%
157%
0%
40%
80%
120%
160%
200%
1998 1999 2000 2001 2002 2003
Management Fee
Development Fee
Figures are Adjusted For Inflation1998 1999 2000 2001 2002 2003
Management Fee Program Management Fee & Grant Support $2,767,134 $2,684,891 $3,151,339 $2,970,094 $3,440,934 $3,077,733 Management Fee Program Expend. $3,126,862 $2,718,377 $3,249,838 $2,849,191 $2,758,228 $2,737,803 Percent of Expenditures Fee Supported 88% 99% 97% 104% 125% 112%Development Fee Program Development Fee & Grant Support $2,426,478 $2,238,009 $3,443,246 $3,445,761 $3,912,707 $4,263,621 *Development Fee Prog. Expenditures $1,541,521 $1,731,632 $1,945,742 $2,054,207 $2,069,132 $2,450,307 Percent of Expenditures Fee Supported 157% 129% 177% 168% 189% 174%
Prince William County 2003 Stormwater Infrastructure Management SEA Report
Page B-195
STORMWATERINFRASTRUCTURE
MANAGEMENT
SECTION LOCATOR
OVERVIEW
SPENDING AND STAFFING:Combined Program SpendingSpending by JurisdictionStormwater Management Fee ProgramDevelopment Fee ProgramExpenditures Fee SupportedAuthorized Employees
OUTPUTS:Change in Management Fee Program OutputsManagement Fee Program OutputsChange in Development Fee Program OutputsDevelopment Fee Program Outputs
RESULTS:Water Quality Permit CompliancePlans Reviewed within Time StandardFlood Plain and Drainage Assistance within Time Standard
Comments:♦ In early 1994, the Board of County Supervisors, on recommendation of staff,
adopted the stormwater management fee concept. This complies with the permitrequirement that the locality must ensure that adequate funding is available to coverthe cost of implementing the stormwater management program.
♦ The Board authorized a stormwater management fee increase as part of the FY 2002budget adoption. The fee increase represented a 15 percent increase to the previouslyestablished fee amount. The fee was increased to a level where expenditures wouldcontinue to outpace revenues in order to draw down the fund balance. The goal wasto utilize the existing fund balance prior to requesting a fee increase. As part of the feeincrease analysis, the Board was informed that another fee increase will be required inFY 2007.
♦ Excess development fee revenue will be used: 1) to mitigate developer failures toperform, 2) to support an upgrade to the LIS System, and 3) as a revenue stabilizationfund.
♦ A substantial increase in the number of plans reviewed resulted in an increase inrevenue from 1998 to 2003.
♦ In 2003 some development fees were reduced, resulting in a reduction in the percentthat Development Fee revenues exceeded expenditures.
Prince William County 2003 Stormwater Infrastructure Management SEA Report
Page B-196
STORMWATERINFRASTRUCTURE
MANAGEMENT
SECTION LOCATOR
OVERVIEW
SPENDING AND STAFFING:Combined Program SpendingSpending by JurisdictionStormwater Management Fee ProgramDevelopment Fee ProgramExpenditures Fee SupportedAuthorized Employees
OUTPUTS:Change in Management Fee Program OutputsManagement Fee Program OutputsChange in Development Fee Program OutputsDevelopment Fee Program Outputs
RESULTS:Water Quality Permit CompliancePlans Reviewed within Time StandardFlood Plain and Drainage Assistance within Time Standard
Authorized Employees
Purpose: This measure provides an indicator of the relative level of StormwaterInfrastructure Management authorized employees. It also provides a breakdown ofauthorized employees between Stormwater Management Fee and StormwaterDevelopment Fee supported positions. All permanent employees are included.Permanent part time employees are reported as full time equivalents. Temporary andcontractual employees are not counted.
Trend:♦ Total Stormwater Management Infrastructure Division authorized positions grew by
25 percent from 1998 to 2003. Stormwater Management Fee Program authorizedpositions grew by 7 percent while Development Fee Program authorized positionsgrew by 46 percent.
Comments:♦ A substantial increase in development activity was experienced during this period.
Authorized Employees - 1998 to 2003
20.79
24.78 25.58
23.5124.31
21.7420.39
21.89 21.2019.83
17.48
23.18
0
5
10
15
20
25
30
1998 1999 2000 2001 2002 2003
Management Fee Program
Development Fee Program
Percent Change1998 1999 2000 2001 2002 2003 1998 to 2003
Prince William County 2003 Stormwater Infrastructure Management SEA Report
Page B-197
STORMWATERINFRASTRUCTURE
MANAGEMENT
SECTION LOCATOR
OVERVIEW
SPENDING AND STAFFING:Combined Program SpendingSpending by JurisdictionStormwater Management Fee ProgramDevelopment Fee ProgramExpenditures Fee SupportedAuthorized Employees
OUTPUTS:Change in Management Fee Program OutputsManagement Fee Program OutputsChange in Development Fee Program OutputsDevelopment Fee Program Outputs
RESULTS:Water Quality Permit CompliancePlans Reviewed within Time StandardFlood Plain and Drainage Assistance within Time Standard
Authorized Positions By Jurisdiction
Purpose: To provide information on the relative size of operations at the comparisonjurisdictions.
Compared to Other Jurisdictions:♦ Prince William had fewer Stormwater Management Infrastructure authorized
employees than Fairfax and about the same as Chesterfield.
Comments:♦ Stormwater Infrastructure Management Surveys were sent to Chesterfield, Fairfax,
and Henrico County. Henrico was unable to respond to the survey.♦ Stormwater infrastructure management staffing is impacted by the pace of
development. Prince William reported a greater level of activity for key storm wateroutputs than Chesterfield. Compared to Fairfax, Prince William reported more plansreviewed but fewer miles of drainage system and storm water ponds inventoried.
Stormwater Infrastructure Management Authorized Positions By Jurisdiction
89.50
75.50
48.00 49.00
49.0949.09
0
20
40
60
80
100
2002 2003
Fairfax
Prince WilliamChesterfield
Fiscal Year 2003Miles of Drainage Stormwater
Systems Ponds Site Development Lot GradingInventoried Inventoried Plans Reviewed Lots Reviewed
Henrico Not Available Not Available Not Available Not AvailableChesterfield 246 90 213 Not AvailableFairfax 835 1,078 439 2,257Prince William 389 427 824 5,769
Prince William County 2003 Stormwater Infrastructure Management SEA Report
Page B-198
STORMWATERINFRASTRUCTURE
MANAGEMENT
SECTION LOCATOR
OVERVIEW
SPENDING AND STAFFING:Combined Program SpendingSpending by JurisdictionStormwater Management Fee ProgramDevelopment Fee ProgramExpenditures Fee SupportedAuthorized Employees
OUTPUTS:Change in Management Fee Program OutputsManagement Fee Program OutputsChange in Development Fee Program OutputsDevelopment Fee Program Outputs
RESULTS:Water Quality Permit CompliancePlans Reviewed within Time StandardFlood Plain and Drainage Assistance within Time Standard
Percent Change in Key Stormwater Management Fee Outputs VersusChange in Direct Spending
Purpose: To compare the percentage change in key Stormwater Management Feeoutputs between 1998 and 2003 with the percent change in Stormwater ManagementFee direct expenditures. Indirect expenditures are not included. The measure iscomputed by dividing the 1998 value into the change from 1998 to 2003.
Trend:♦ All Stormwater Management Fee outputs increased substantially faster than
spending between 1998 and 2003.
Comments:♦ From year to year there can be substantial variability in each of these key outputs.
The following page provides the five year trend for each key StormwaterManagement Fee output.
♦ The number of storm water ponds inventoried and the number of drainage systemmiles inventoried is a cumulative number which grows with development.Stormwater procedures require inspection of all ponds twice a year and inspectionof drainage systems on an as needed basis. When inspections are conducted theymay result in additional work in the form of pond or drainage system maintenance.
Storm Water Drainage System Drainage Assistance DirectPonds Inventoried Miles Inventoried Requests Received Spending
2003 Value 427 389 603 $2,574,6551998 Value 77 182 512 $2,765,993Change 350 207 91 ($191,338)
Percent Change 455% 114% 18% -7%
Percentage Change in Key Stormwater Management Fee Program Outputs Versus Change in Direct Spending - 1998 to 2003
114%
455%
-7%
18%
-20%
30%
80%
130%
180%
230%
280%
330%
380%
430%
480%
Ponds Inventoried Drainage System MilesInventoried
Drainage Asst Requests Spending
Prince William County 2003 Stormwater Infrastructure Management SEA Report
Page B-199
STORMWATERINFRASTRUCTURE
MANAGEMENT
SECTION LOCATOR
OVERVIEW
SPENDING AND STAFFING:Combined Program SpendingSpending by JurisdictionStormwater Management Fee ProgramDevelopment Fee ProgramExpenditures Fee SupportedAuthorized Employees
OUTPUTS:Change in Management Fee Program OutputsManagement Fee Program OutputsChange in Development Fee Program OutputsDevelopment Fee Program Outputs
RESULTS:Water Quality Permit CompliancePlans Reviewed within Time StandardFlood Plain and Drainage Assistance within Time Standard
Number of Stormwater Ponds and Miles of Drainage Systems Inventoried andDrainage Assistance Requests
Purpose: To provide information on changes in the number of stormwater ponds andmiles of drainage systems inventoried and drainage assistance requests received by yearfrom 1998 to 2003.
Trend:♦ The number of storm water ponds inventoried and drainage system miles inventoried
grew rapidly and steadily between 1998 and 2003.♦ After remaining relatively stable from 1998 to 2000 the number of drainage assistance
requests received increased substantially in 2001and then again in 2003.
Comments:♦ The substantial FY 2001 and FY 2003 increase in the number of drainage assistance
requests received resulted from an increase in rainfall events and an increase insub-division development within the County.
512477 490
640
446
603
0
100
200
300
400
500
600
700
1998 1999 2000 2001 2002 2003
Number of Drainage Assistance Requests Received
Number of Storm Water Ponds Inventoried and Drainage System Miles Inventoried
77
117
236
340
427
182
217
245260
317
389
208
0
50
100
150
200
250
300
350
400
450
1998 1999 2000 2001 2002 2003
Stormwater Ponds
Miles of Drainage
Prince William County 2003 Stormwater Infrastructure Management SEA Report
Page B-200
STORMWATERINFRASTRUCTURE
MANAGEMENT
SECTION LOCATOR
OVERVIEW
SPENDING AND STAFFING:Combined Program SpendingSpending by JurisdictionStormwater Management Fee ProgramDevelopment Fee ProgramExpenditures Fee SupportedAuthorized Employees
OUTPUTS:Change in Management Fee Program OutputsManagement Fee Program OutputsChange in Development Fee Program OutputsDevelopment Fee Program Outputs
RESULTS:Water Quality Permit CompliancePlans Reviewed within Time StandardFlood Plain and Drainage Assistance within Time Standard
Percent Change in Development Fee Program Outputs Versus Change inDirect Spending
Purpose: To compare the percentage change in key Development Fee Programoutputs between 1998 and 2003 with the percent change in Development Fee Programdirect expenditures. Indirect expenditures are not included. The measure is computedby dividing the 1998 value into the change from 1998 to 2003.
Trend:♦ From FY 1998 to FY 2003, most output measures except site plans reviewed
increased at a much faster rate than program spending.♦ From year to year there can be substantial variability in each of these key outputs.
The following two pages display the five year trend for each key ouput.
Percentage Change in Key Development Fee Program Outputs Versus Change in Spending - 1998 to 2003
77%
151%
254%
56%
25%
0%
50%
100%
150%
200%
250%
300%
Site PlansReviewed
Lot Grading LotsReviewed
Site Inspections Erosion ControlInspections
Single FamilyInspections
Spending
Not Available
Site Plans Lot Grading Site Erosion Control Single Family DirectReviewed Lots Reviewed Inspections Inspections Unit Inspections Spending
2003 Value 824 5,769 12,650 13,352 7,956 $2,120,1951998 Value 658 Not Available 7,157 5,325 2,247 $1,357,693Change 166 Not Available 5,493 8,027 5,709 762,503
Percent Change 25% Not Available 77% 151% 254% 56%
Prince William County 2003 Stormwater Infrastructure Management SEA Report
Page B-201
STORMWATERINFRASTRUCTURE
MANAGEMENT
SECTION LOCATOR
OVERVIEW
SPENDING AND STAFFING:Combined Program SpendingSpending by JurisdictionStormwater Management Fee ProgramDevelopment Fee ProgramExpenditures Fee SupportedAuthorized Employees
OUTPUTS:Change in Management Fee Program OutputsManagement Fee Program OutputsChange in Development Fee Program OutputsDevelopment Fee Program Outputs
RESULTS:Water Quality Permit CompliancePlans Reviewed within Time StandardFlood Plain and Drainage Assistance within Time Standard
Number of Site Development and Individual Lot Grading Plans Reviewed
Purpose: To provide information on changes in the number of site development and lotgrading plans reviewed. Lot grading plans may contain multiple lots. Each lot on a plan iscounted as a lot grading plan reviewed. Stormwater Infrastructure Management reviewssite and lot grading plans to ensure development standards set forth in the Design andConstruction Manual (DCSM) are met and that we maintain and preserve water quality.
Trend:♦ During the period from 1998 to 2003, the number of site development plans reviewed
ranged from a high of 824 in 2003 to a low of 631 in 2000. The number of sitedevelopment plans reviewed in 2003 was 25 percent greater than in 1998.
♦ The number of individual lot grading plans reviewed rose from 2,780 in 2000 to 5,796in 2003, an overall increase of 108 percent. The number of individual lot gradingplans reviewed prior to 2000 was not available.
Comments:♦ The increase in individual lot grading plans experienced in 2003 is largely attributable
to submission of plans for large planned communities with many lots.
Site Development and Individual Lot Grading Plans Reviewed
658 719 631 795 755 824
2,780 2,781
3,697
5,769
0
1,000
2,000
3,000
4,000
5,000
6,000
7,000
1998 1999 2000 2001 2002 2003
Site Development
Lot Grading
Prince William County 2003 Stormwater Infrastructure Management SEA Report
Page B-202
STORMWATERINFRASTRUCTURE
MANAGEMENT
SECTION LOCATOR
OVERVIEW
SPENDING AND STAFFING:Combined Program SpendingSpending by JurisdictionStormwater Management Fee ProgramDevelopment Fee ProgramExpenditures Fee SupportedAuthorized Employees
OUTPUTS:Change in Management Fee Program OutputsManagement Fee Program OutputsChange in Development Fee Program OutputsDevelopment Fee Program Outputs
RESULTS:Water Quality Permit CompliancePlans Reviewed within Time StandardFlood Plain and Drainage Assistance within Time Standard
Number of Inspections by Inspection Type
Purpose: To provide information on changes in the number of site, erosion control, andsingle family unit inspections. Stormwater Infrastructure Management inspects sites toensure conformance with County standards and regulations relating to stormwatermanagement, erosion and sediment control, best management practices, and thepreservation of resource protection areas.
Trend:♦ The number of site inspections rose rapidly from 1998 to 2002 before declining in
2003. Overall, the number of site inspections increased 77 percent from 1998 to2003.
♦ The number of erosion control inspections increased from 5,325 in 1998 to 13,352in 2003, a 151 percent increase. The most dramatic increase occurred from 2002to 2003 with a 67 percent increase in the number of erosion control inspectionwithin one year.
♦ The number of single family unit inspections increased 254 percent from 1998 to2003.
Comments:♦ The decline in the number of site plan inspections completed in 2003 is due to one
of seven inspectors being out during a large part of this period.♦ Erosion control inspections take on a higher priority during periods of heavy rainfall
as occurred in 2003.
Number of Inspections By Inspection Type
8,4169,426
15,252
5,325
13,352
2,2473,269
4,976
7,157
9,790
12,650
8,077
5,474
7,311
7,991
3,835
7,9568,160
0
2,000
4,000
6,000
8,000
10,000
12,000
14,000
16,000
18,000
1998 1999 2000 2001 2002 2003
Site
Erosion Control
Single Family
Prince William County 2003 Stormwater Infrastructure Management SEA Report
Page B-203
STORMWATERINFRASTRUCTURE
MANAGEMENT
SECTION LOCATOR
OVERVIEW
SPENDING AND STAFFING:Combined Program SpendingSpending by JurisdictionStormwater Management Fee ProgramDevelopment Fee ProgramExpenditures Fee SupportedAuthorized Employees
OUTPUTS:Change in Management Fee Program OutputsManagement Fee Program OutputsChange in Development Fee Program OutputsDevelopment Fee Program Outputs
RESULTS:Water Quality Permit CompliancePlans Reviewed within Time StandardFlood Plain and Drainage Assistance within Time Standard
Water Quality Permit Compliance
Purpose: To provide an indicator of Prince William County’s efforts to maintain waterquality and comply with the Federal Clean Water Act. The State Department of Environ-mental Quality (DEQ) annually reviews Prince William’s compliance with the requirementsof the Federal Clean Water Act’s National Pollutant Discharge Elimination System permitprogram for storm water discharges. This measure reports whether or not Prince Williamwas in compliance with the VPDES requirements. This indicator provides information onwhether the County is implementing required programs to protect water quality but doesnot provide metrics on changes in actual water quality, such information is currently notavailable but plans have been made to develop such data in the future.
Trend:♦ Prince William County fully met the Virginia Pollutant Discharge Elimination System
Program requirements in each year from 1998 through 2003.
Comments:♦ Prince William County is subject to the Federal Clean Water Act’s National Pollutant
Discharge Elimination System (NPDES) permit program for its storm waterdischarges. This program is administered by DEQ under EPA oversight as VirginiaPollutant Discharge Elimination System (VPDES). Under this permit, Prince WilliamCounty is required to implement a comprehensive storm water management (SWM)program to control the quality of its storm water discharges in accordance with theVPDES permit. In addition, the County is required to dedicate adequate funding toimplement the program.
Compliance with Virginia Pollutant Discharge Elimination System Permit Program Requirements
100% 100% 100% 100% 100% 100%
0%
20%
40%
60%
80%
100%
1998 1999 2000 2001 2002 2003
Prince William County 2003 Stormwater Infrastructure Management SEA Report
Page B-204
STORMWATERINFRASTRUCTURE
MANAGEMENT
SECTION LOCATOR
OVERVIEW
SPENDING AND STAFFING:Combined Program SpendingSpending by JurisdictionStormwater Management Fee ProgramDevelopment Fee ProgramExpenditures Fee SupportedAuthorized Employees
OUTPUTS:Change in Management Fee Program OutputsManagement Fee Program OutputsChange in Development Fee Program OutputsDevelopment Fee Program Outputs
RESULTS:Water Quality Permit CompliancePlans Reviewed within Time StandardFlood Plain and Drainage Assistance within Time Standard
Comments (continued):♦ VPDES consolidates various County programs, such as, development plan review,
erosion and sediment control, drainage, and BMP maintenance, Chesapeake BayPreservation Area regulation, control of illicit discharge and improper disposal,septic pump-out, management program for pesticides, herbicides and fertilizers,control of inflow and infiltration from sanitary sewers, etc. In addition, VPDESpermit requires a mandatory chemical monitoring program to monitor the streamwater quality and outreach activities to educate people on pollution preventionactivities.
♦ Prince William County will be subject to EPA’s Total Maximum Daily Load (TMDL)regulations. TMDL regulations impose numeric restrictions on the discharge oftarget pollutants to streams designated as impaired based on DEQ’s monitoringdata. It is likely that TMDL regulation will be consolidated into the County’sVPDES permits as a condition in the near future.
♦ The Bacterial Source Tracking (BST) study is currently underway with VirginiaPolytechnic Institute and State University which monitors a large number of Countystreams for fecal coliform bacteria. Beginning in July 2003, eighteen (18) streamlocations in four watersheds throughout the County have been sampled on a monthlybasis to determine bacterial impairment in the stream and to trace the source ofcontamination. This data is being developed and therefore is not yet available.
Prince William County 2003 Stormwater Infrastructure Management SEA Report
Page B-205
Percent of Site and Lot Plans Reviewed within Internal Time Standard
Purpose: To provide information on the timeliness of site and lot plan reviews. Thismeasure is computed by dividing the total number of plans reviewed into the numberreviewed within an internally established target plan review time. Prince William Countyhas established 22 calendar days for initial site development plans and 10 business daysfor lot grading plans as the internal plan review time standard.
Trend:♦ The percent of site development plans reviewed within the internal standard
(22 calendar days) varied between a low of 84 percent in 2000 and a high of 97percent in 1998. In 2003, 94 percent of site development plans were reviewedwithin the 22 standard.
♦ The percent of lot grading plans reviewed within the internal standard(10 business days) rose from 91 percent in 2002 to 97 percent in 2003. Data foryears prior to 2002 is not available.
Comments:♦ The process of reviewing lot plans involves the actual plan review time by
Stormwater Infrastructure Management staff but also involves returning plans tobuilders for needed corrections. The automated system captures the total elapsedtime (both Stormwater plan review time and time the plans are being reworked bythe builder). As a result, for 2001 the information system is unable to report thepercent of lot plans reviewed by Stormwater within 10 business days. 2000 datawas not available. 1998 and 1999 data is reported as not available since a manualprocess was used that may have had errors.
Percent of Site Development and Lot Grading Plans Reviewed Within Internal Standard
94%92%91%84%
90%97% 97%
91%
0%
20%
40%
60%
80%
100%
1998 1999 2000 2001 2002 2003
Site
Lot
STORMWATERINFRASTRUCTURE
MANAGEMENT
SECTION LOCATOR
OVERVIEW
SPENDING AND STAFFING:Combined Program SpendingSpending by JurisdictionStormwater Management Fee ProgramDevelopment Fee ProgramExpenditures Fee SupportedAuthorized Employees
OUTPUTS:Change in Management Fee Program OutputsManagement Fee Program OutputsChange in Development Fee Program OutputsDevelopment Fee Program Outputs
RESULTS:Water Quality Permit CompliancePlans Reviewed within Time StandardFlood Plain and Drainage Assistance within Time Standard
Prince William County 2003 Stormwater Infrastructure Management SEA Report
Page B-206
STORMWATERINFRASTRUCTURE
MANAGEMENT
SECTION LOCATOR
OVERVIEW
SPENDING AND STAFFING:Combined Program SpendingSpending by JurisdictionStormwater Management Fee ProgramDevelopment Fee ProgramExpenditures Fee SupportedAuthorized Employees
OUTPUTS:Change in Management Fee Program OutputsManagement Fee Program OutputsChange in Development Fee Program OutputsDevelopment Fee Program Outputs
RESULTS:Water Quality Permit CompliancePlans Reviewed within Time StandardFlood Plain and Drainage Assistance within Time Standard
Percent of Site Development and Lot Grading Plans Reviewedwithin Internal Time Standards
Purpose: To provide information on the timeliness of site and lot plan reviews. Thismeasure is computed by dividing the total number of plans reviewed into the numberreviewed within an internally established target plan review time. Each jurisdictionestablishes their own target time to review plans within (internal standard). Theestablished targets are provided by reporting jurisdiction in the table below.
Comparison:♦ Prince William reviewed a greater percent of site development plans and lot grading
plans than Fairfax and a greater percent of site development plans than Chesterfieldwithin internally established target plan review time standards. Data on the percentof lot grading plans reviewed within time standards was not available for Chesterfield.
Comments:♦ Data regarding the percent of site development plans and lot grading plans reviewed
within internal time standards was not available for Henrico County.♦ The following table provides both the FY 2002 and FY 2003 percent of site plans
and lot grading plans reviewed within each jurisdiction’s internal standard:
FY 2003 Percent of Site and Lot Grading Plans Reviewed Within Each Jurisdiction's Internal Standard
62%
94%
22%
88%
97%
0% 20% 40% 60% 80% 100%
Fairfax
Chesterfield
Prince William
Lot
Site
Prince William Fairfax Henrico Chesterfield Site Development Plans 22 calendar days 60 calendar days 10 business days 45 calendar days Lot Grading Plans 10 business days 14 calendar days 10 business days 48 hours
Plan Review Time Standards By Jurisdiction
Percent of Plans Reviewed Within Jurisdiction's StandardPrince William Fairfax Chesterfield
Site Development Plans2003 94% 62% 88%2002 92% 64% 98%Lot Grading Plans2003 97% 22% Not Available2002 91% 36% Not Available
Prince William County 2003 Stormwater Infrastructure Management SEA Report
Page B-207
STORMWATERINFRASTRUCTURE
MANAGEMENT
SECTION LOCATOR
OVERVIEW
SPENDING AND STAFFING:Combined Program SpendingSpending by JurisdictionStormwater Management Fee ProgramDevelopment Fee ProgramExpenditures Fee SupportedAuthorized Employees
OUTPUTS:Change in Management Fee Program OutputsManagement Fee Program OutputsChange in Development Fee Program OutputsDevelopment Fee Program Outputs
RESULTS:Water Quality Permit CompliancePlans Reviewed within Time StandardFlood Plain and Drainage Assistance within Time Standard
Percent of Flood Plain Determinations and Drainage Assistance Requestswithin Internal Time Standard
Purpose: To provide information on the timeliness of processing flood plaindeterminations and drainage assistance requests. This measure is computed by dividingthe total number processed into the number processed within an internally establishedtarget time. Prince William County has established 3 business days as the target for floodplain determinations and 5 business days from receipt of request to first response as thetarget for handling drainage assistance requests.
Trend:♦ 100 percent of flood plain determinations were completed within the internal time
standard in each year from 1998 through 2003.♦ The percent of drainage assistance requests responded to within the internal time
standard increased from 94 percent in 1998 to 99 percent in 2003.
Percent of Flood Plain Determinations and Drainage Assistance Requests Within Internal Standard
100%100%100%100%100%100%
92%98%
92%95%94%99%
0%
20%
40%
60%
80%
100%
1998 1999 2000 2001 2002 2003
Flood Plain
Drainage
Prince William County 2003 Stormwater Infrastructure Management SEA Report