24
Private equity roundup India

Private equity roundup India

03Foreword
04Economic overview
06Fund-raising
08Transactions and exits
12Trends in the Indian PE sector: H1 2013
14Tax and regulatory updates
16Outlook
Contents
Q2 2013 1
For additional information about PE investment in India and other emerging economies, visit ey.com/privateequity.
For real-time analysis of recent developments in the PE space across developed and emerging markets and for information about
EY-sponsored events, follow us on Twitter — @EYPrivateEquity
Over the last several years, the emerging markets have evolved into a critical pillar of global investors’ strategies. With growth rates declining across most of the developed world, private equity (PE) fi rms have turned to emerging markets as an engine of growth. Just fi ve years ago, the emerging markets represented approximately 12% of total PE fund-raising. Now, they account for more than 20%.
EY’s Roundup series delves deep into the drivers of fund-raising, investment activity and exits across a range of developing economies, including Latin America, China, India and Africa. Our quarterly, semiannual and annual reports deliver fresh insight into the forces shaping activity, including macroeconomic trends, regulatory developments and capital markets activity.
About

2 Private equity roundup — India
Private equity roundup: India quarterly provides insight and analysis on private equity trends as they apply to this important emerging market.
Q2 2013 3
Q2 2013 witnessed a pickup in investment activity with a signifi cant increase in big deal volumes. Total investment amounted to US$4.4b across 116 deals, including one mega-billion-dollar deal and a few other US$100m-plus transactions. The top 10 deals contributed to 71% of the overall investment value in the quarter. However, excluding these large transactions, overall PE activity remained moderate as funds continued to work on portfolio management and exit preparation. Investment activity continued to be spread across sectors, with retail and consumer and technology receiving the largest number of investments, though most of the volume being early stage in nature.
In terms of new commitments, fund-raising remains challenging for India-focused funds. A weak Indian macroeconomic environment, insuffi cient exits, regulatory concerns, and the sharp depreciation of the Indian rupee and its continuing volatility are some of the key challenges that fund managers face. On the positive side, though, the quarter did see more than half a billion dollars raised in new commitments during Q2 2013. The experience of successful fund-raisings signifi es the importance of a good exit and returns track record, team experience, and a differentiated and clear investment strategy.
Big deals break the continuing monotony of an otherwise challenged environment
There were 37 exits during Q2 2013, including 4 PE-backed IPOs. Despite being the highest quarterly exit volume recorded in the last few quarters, it is still not signifi cant enough to make any defi nitive impact on the huge exit backlog. There were two very successful and relatively large PE-backed IPOs during the quarter, Justdial and Repco Home Finance, both of which have performed reasonably well post-listing. This provides hope to a number of aspiring listing candidates and their investors.
On the regulatory front, while there were no major announcements, the clarifi cations around some of the matters in the Union Budget 2013–14 — such as Tax Residency Certifi cate, withholding tax on interest income of foreign institutional investors (FIIs) and qualifi ed fi nancial investors (QFIs), the foreign direct investment (FDI) policy and announcements made by the Securities and Exchange Board (SEBI) — all indicate that the Government is cognizant of the issues faced by overseas investors and intends to address them positively.
Foreword

4 Private equity roundup — India
Economic overview1
Key economic indicators
Figure 1. GDP growth rate — YoY change (%)
Source: CMIE online database
Figure 2. Index of Industrial Production (IIP) — YoY change (%)
4
5
6
0
2
4
6
8
Q1 12 Q2 12 Q3 12 Q4 12 Q2 13Q1 13
YoY
GDP
grow
th %
YoY
% fo
r com
pone
nts
of G
DP
GDP growth %Industry (%)
Agriculture (%)Services (%)
5.07
5.355.19
4.71 4.78
4.35
Source: CMIE online database
YoY
% ch
ange
of I
IP
Jan-
12
Apr
-12
Jul-1
2
Oct
-12
Jan-
13
Apr
-13
June
-13-4
-2
0
2
4
6
8
10
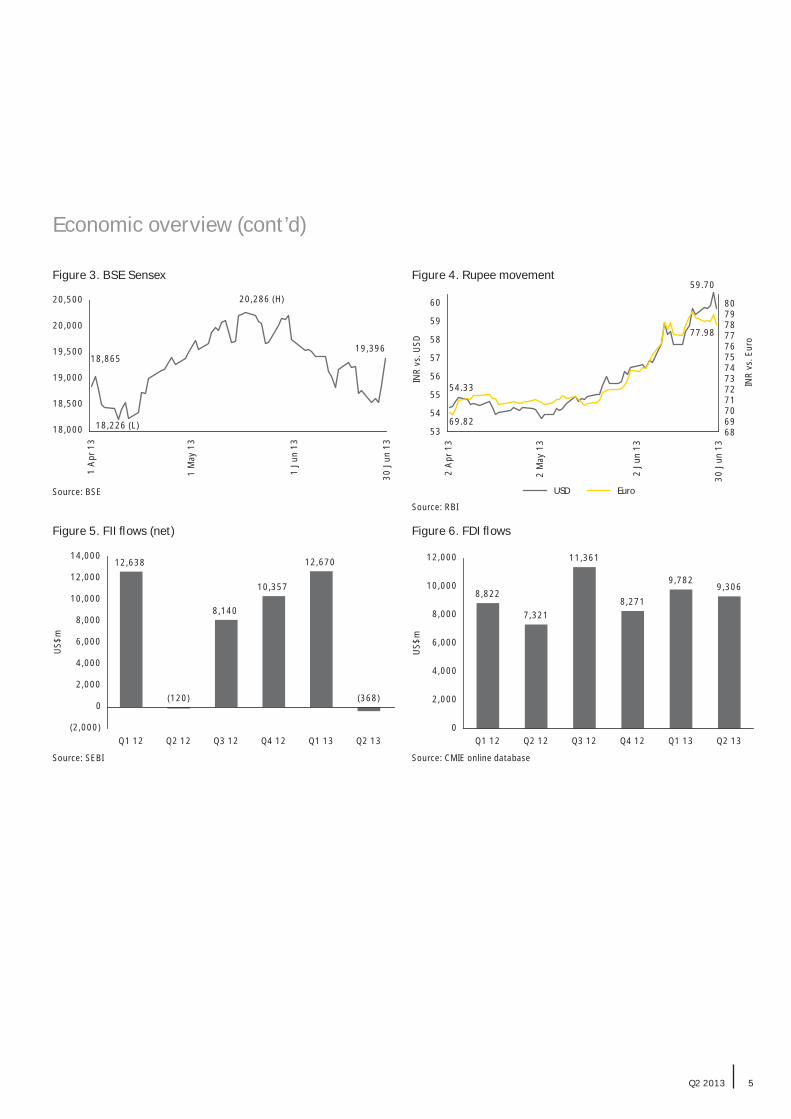
India’s economic growth rate — once competing with China at over 8% — has been severely affected by macroeconomic issues and policy inaction. Most of the key economic indicators showed an adverse movement in Q2 2013, and high current account and fi scal defi cits have resulted in signifi cant movement in the Indian rupee. But there have been some bright spots. The strong onset of monsoon rains has raised expectations of robust growth in agricultural output and consequently rural demand; foreign
direct investment (FDI) infl ows are still holding up, and, despite net FII outfl ows, the BSE Sensex ended higher than at the last quarter-end. The Indian rupee depreciated 10% against the US dollar during the quarter. While this benefi ts export-oriented businesses, especially the Indian IT sector, it is creating more challenges for the already beleaguered Indian PE industry, which is desperately looking for better exit performance.
Q2 2013 5
Economic overview (cont’d)
Figure 4. Rupee movementFigure 3. BSE Sensex
Source: BSE
18,865
18,226 (L)
20,286 (H)
19,396
18,000
18,500
19,000
19,500
20,000
20,500
1 A
pr 1
3
1 M
ay 1
3
1 Ju
n 13
30 J
un 1
3
Source: RBI
54.33
69.82
77.98
68697071727374757677787980
53
54
55
56
57
58
59
60
2 A
pr 1
3
2 M
ay 1
3
2 Ju
n 13
30 J
un 1
3
INR
vs. E
uro
INR
vs. U
SD
USD Euro
59.70
Figure 5. FII fl ows (net)
Source: SEBI
(2,000)
0
2,000
4,000
6,000
8,000
10,000
12,000
14,00012,638
(120)
8,140
10,357
12,670
(368)
Q1 12 Q2 12 Q3 12 Q4 12 Q1 13 Q2 13
US$
m
Figure 6. FDI fl ows
Source: CMIE online database
8,822
7,321
11,361
8,271
9,7829,306
0
2,000
4,000
6,000
8,000
10,000
12,000
Q1 12 Q2 12 Q3 12 Q4 12 Q1 13 Q2 13
US$
m
6 Private equity roundup — India
Fund-raising2
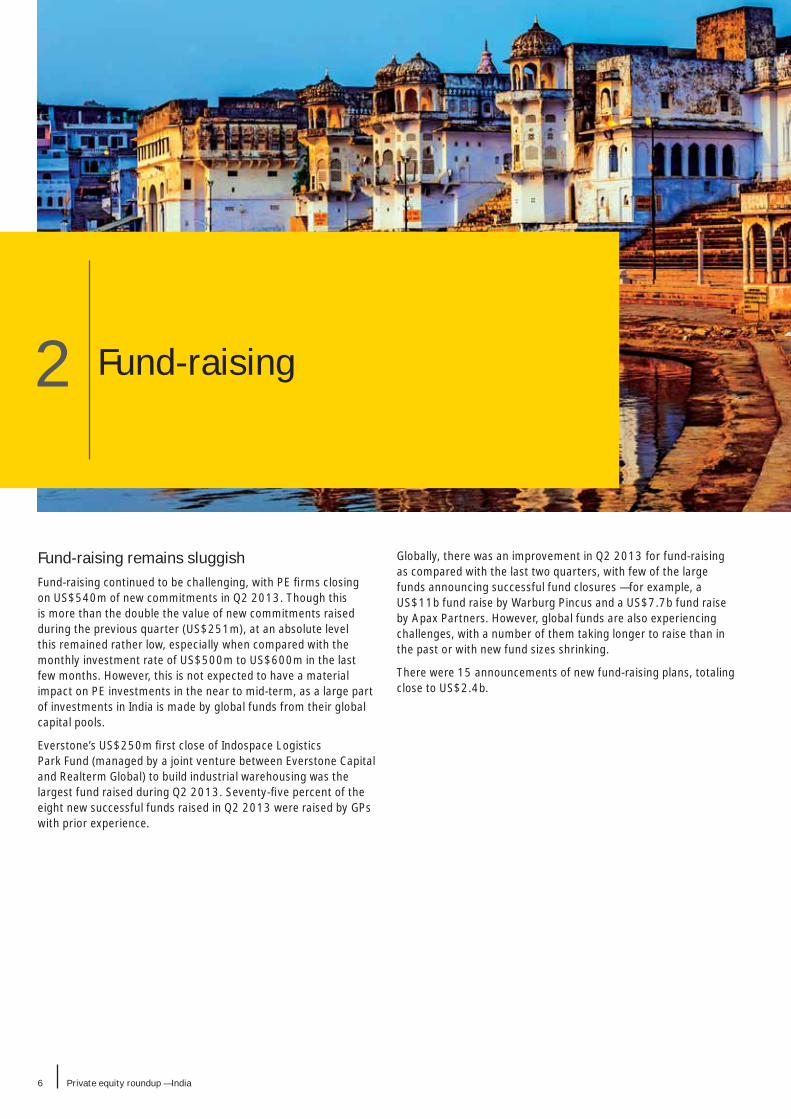
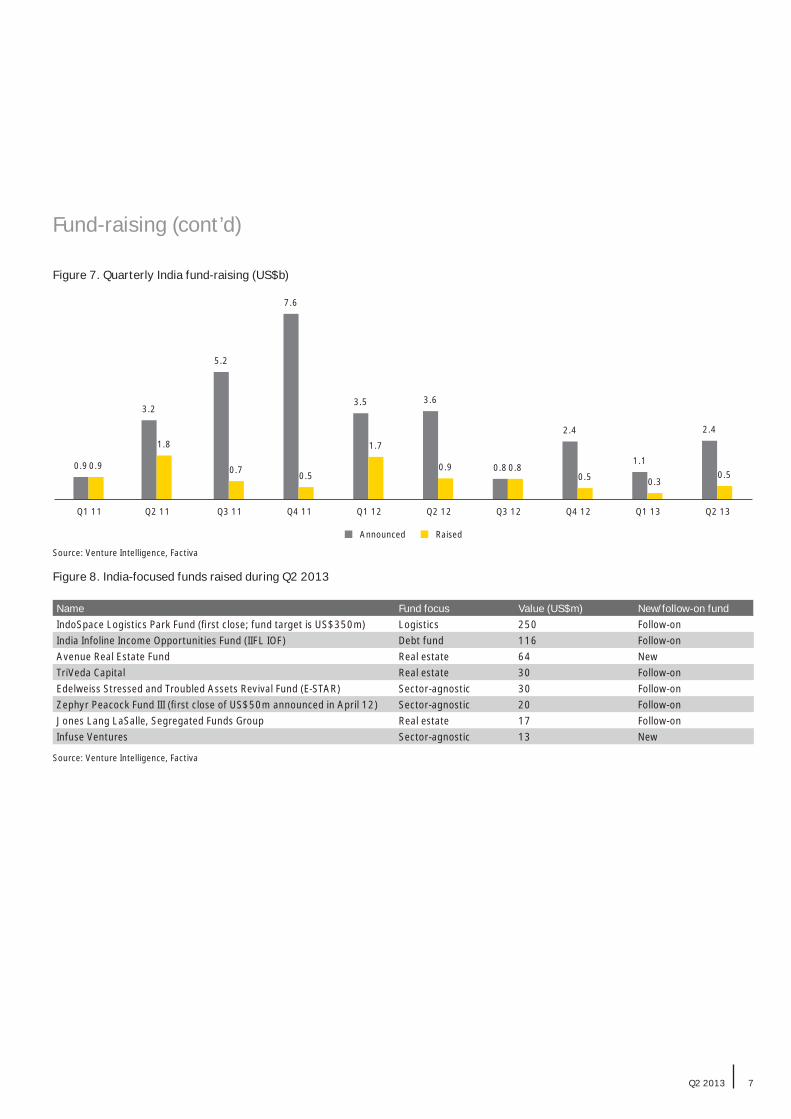
Fund-raising remains sluggishFund-raising continued to be challenging, with PE fi rms closing on US$540m of new commitments in Q2 2013. Though this is more than the double the value of new commitments raised during the previous quarter (US$251m), at an absolute level this remained rather low, especially when compared with the monthly investment rate of US$500m to US$600m in the last few months. However, this is not expected to have a material impact on PE investments in the near to mid-term, as a large part of investments in India is made by global funds from their global capital pools.
Everstone’s US$250m fi rst close of Indospace Logistics Park Fund (managed by a joint venture between Everstone Capital and Realterm Global) to build industrial warehousing was the largest fund raised during Q2 2013. Seventy-fi ve percent of the eight new successful funds raised in Q2 2013 were raised by GPs with prior experience.
Globally, there was an improvement in Q2 2013 for fund-raising as compared with the last two quarters, with few of the large funds announcing successful fund closures — for example, a US$11b fund raise by Warburg Pincus and a US$7.7b fund raise by Apax Partners. However, global funds are also experiencing challenges, with a number of them taking longer to raise than in the past or with new fund sizes shrinking.
There were 15 announcements of new fund-raising plans, totaling close to US$2.4b.
Q2 2013 7
Fund-raising (cont’d)
Figure 8. India-focused funds raised during Q2 2013
Name Fund focus Value (US$m) New/follow-on fundIndoSpace Logistics Park Fund (fi rst close; fund target is US$350m) Logistics 250 Follow-onIndia Infoline Income Opportunities Fund (IIFL IOF) Debt fund 116 Follow-onAvenue Real Estate Fund Real estate 64 NewTriVeda Capital Real estate 30 Follow-onEdelweiss Stressed and Troubled Assets Revival Fund (E-STAR) Sector-agnostic 30 Follow-onZephyr Peacock Fund III (fi rst close of US$50m announced in April 12) Sector-agnostic 20 Follow-onJones Lang LaSalle, Segregated Funds Group Real estate 17 Follow-onInfuse Ventures Sector-agnostic 13 New
Figure 7. Quarterly India fund-raising (US$b)
Source: Venture Intelligence, Factiva
Source: Venture Intelligence, Factiva
0.9
3.2
5.2
7.6
3.5 3.6
0.8
2.4
1.1
2.4
0.9
1.8
0.7 0.5
1.7
0.9 0.80.5 0.3
0.5
Q1 11 Q2 11 Q3 11 Q4 11 Q1 12 Q2 12 Q3 12 Q4 12 Q1 13 Q2 13
Announced Raised
8 Private equity roundup — India
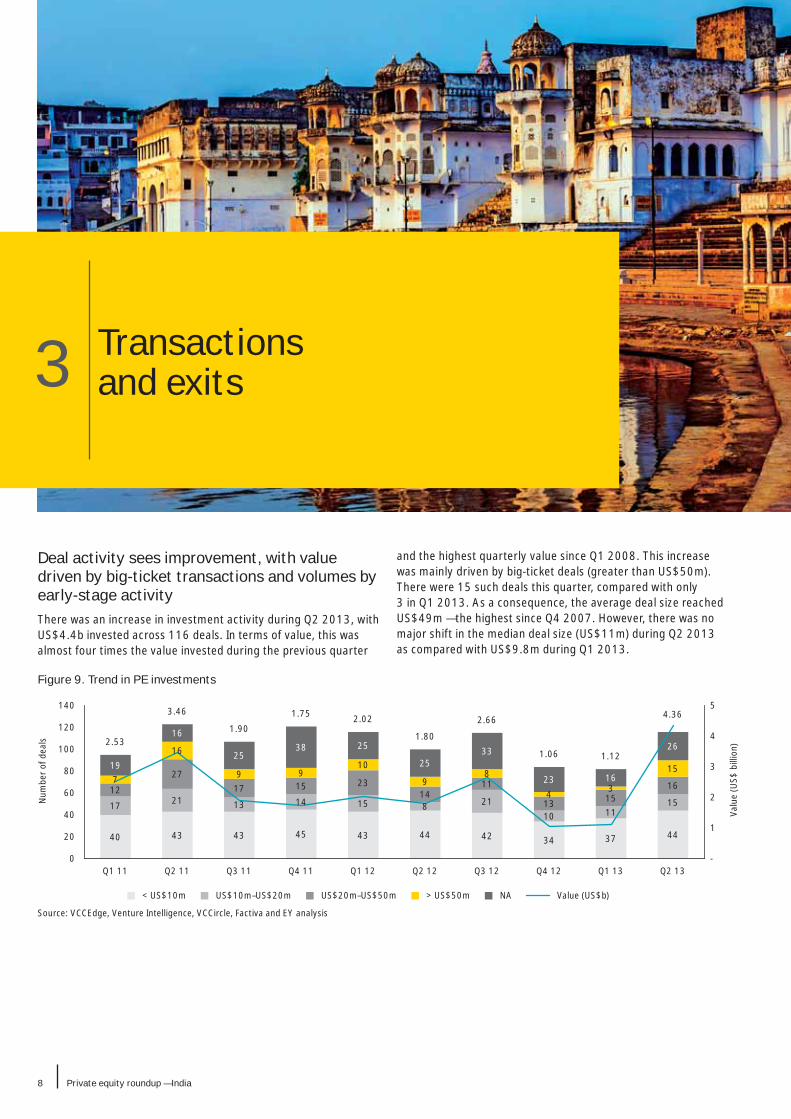
Transactions and exits3
Deal activity sees improvement, with value driven by big-ticket transactions and volumes by early-stage activityThere was an increase in investment activity during Q2 2013, with US$4.4b invested across 116 deals. In terms of value, this was almost four times the value invested during the previous quarter
and the highest quarterly value since Q1 2008. This increase was mainly driven by big-ticket deals (greater than US$50m). There were 15 such deals this quarter, compared with only 3 in Q1 2013. As a consequence, the average deal size reached US$49m — the highest since Q4 2007. However, there was no major shift in the median deal size (US$11m) during Q2 2013 as compared with US$9.8m during Q1 2013.
Figure 9. Trend in PE investments
Source: VCCEdge, Venture Intelligence, VCCircle, Factiva and EY analysis
40 43 43 45 43 44 42 34 37 44
17 21 13 14 15 8 2110 11
1512
2717 15 23
1411
13 15167
16
9 910
98
4 3
1519
16
2538 25
2533
23 16
262.53
3.46
1.90
1.75 2.02
1.80
2.66
1.06 1.12
4.36
-
1
2
3
4
5
0
20
40
60
80
100
120
140
Q1 11 Q2 11 Q3 11 Q4 11 Q1 12 Q2 12 Q3 12 Q4 12 Q1 13 Q2 13
Valu
e (U
S$ b
illio
n)
Num
ber o
f dea
ls
< US$10m US$10m–US$20m US$20m–US$50m > US$50m NA Value (US$b)
Q2 2013 9
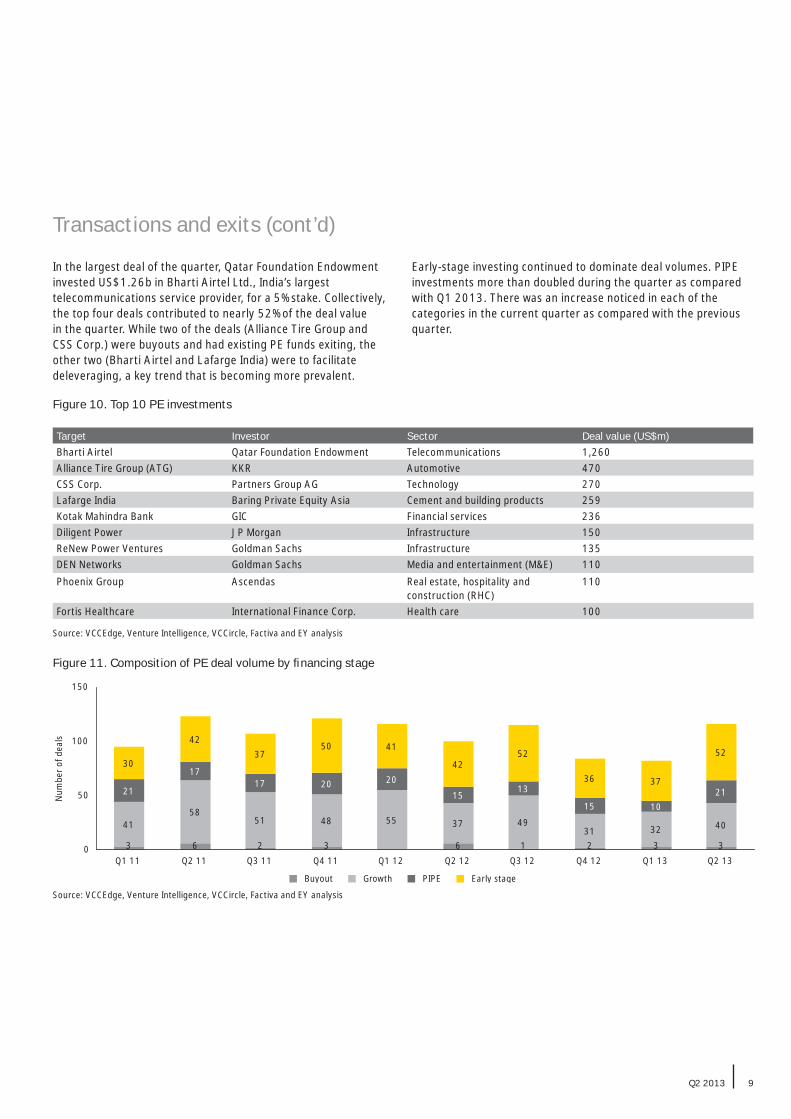
Figure 10. Top 10 PE investments
Target Investor Sector Deal value (US$m)Bharti Airtel Qatar Foundation Endowment Telecommunications 1,260Alliance Tire Group (ATG) KKR Automotive 470CSS Corp. Partners Group AG Technology 270Lafarge India Baring Private Equity Asia Cement and building products 259Kotak Mahindra Bank GIC Financial services 236Diligent Power JP Morgan Infrastructure 150ReNew Power Ventures Goldman Sachs Infrastructure 135DEN Networks Goldman Sachs Media and entertainment (M&E) 110Phoenix Group Ascendas Real estate, hospitality and
construction (RHC)110
Fortis Healthcare International Finance Corp. Health care 100
Source: VCCEdge, Venture Intelligence, VCCircle, Factiva and EY analysis
Transactions and exits (cont’d)
In the largest deal of the quarter, Qatar Foundation Endowment invested US$1.26b in Bharti Airtel Ltd., India’s largest telecommunications service provider, for a 5% stake. Collectively, the top four deals contributed to nearly 52% of the deal value in the quarter. While two of the deals (Alliance Tire Group and CSS Corp.) were buyouts and had existing PE funds exiting, the other two (Bharti Airtel and Lafarge India) were to facilitate deleveraging, a key trend that is becoming more prevalent.
Early-stage investing continued to dominate deal volumes. PIPE investments more than doubled during the quarter as compared with Q1 2013. There was an increase noticed in each of the categories in the current quarter as compared with the previous quarter.
Figure 11. Composition of PE deal volume by fi nancing stage
Source: VCCEdge, Venture Intelligence, VCCircle, Factiva and EY analysis
3 6 2 3 6 1 2 3 3
4158
51 48 55 37 4931 32 40
21
1717 20 20
1513
15 1021
30
4237
50 41
4252
36 37
52
0
50
100
150
Q1 11 Q2 11 Q3 11 Q4 11 Q1 12 Q2 12 Q3 12 Q4 12 Q1 13 Q2 13
Num
ber o
f dea
ls
Buyout Growth PIPE Early stage
10 Private equity roundup — India
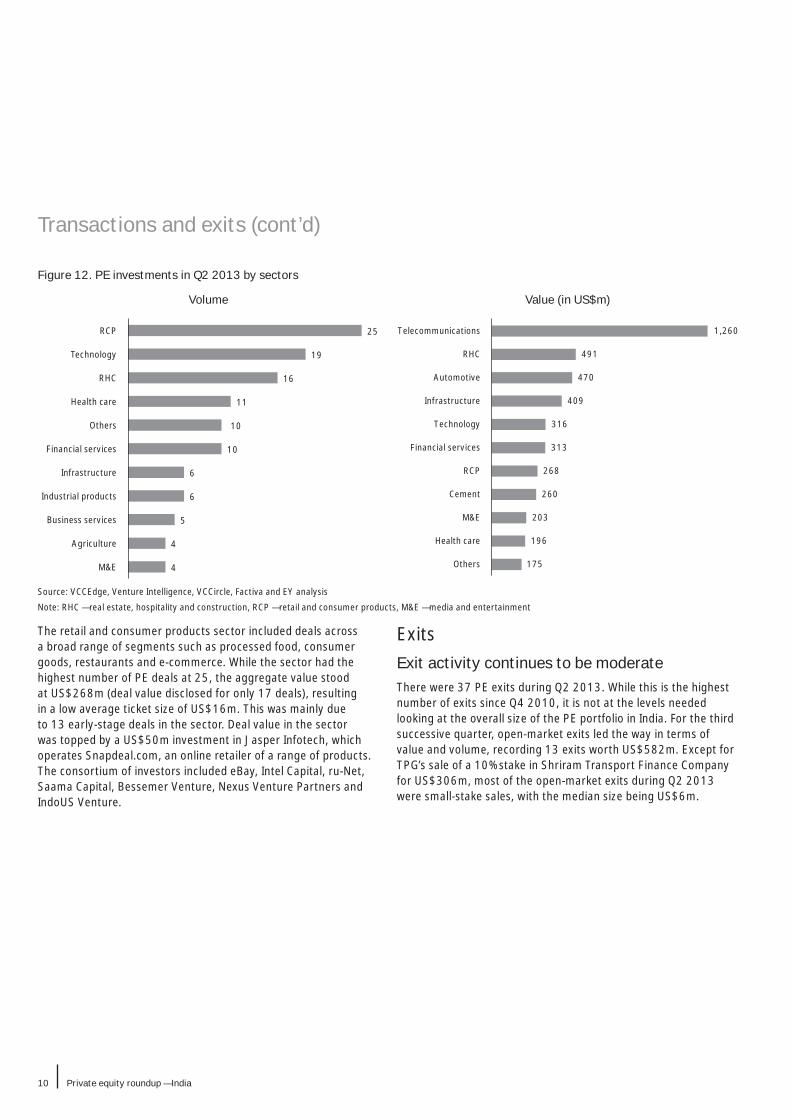
Figure 12. PE investments in Q2 2013 by sectors
Volume Value (in US$m)
Source: VCCEdge, Venture Intelligence, VCCircle, Factiva and EY analysis
Note: RHC — real estate, hospitality and construction, RCP — retail and consumer products, M&E — media and entertainment
The retail and consumer products sector included deals across a broad range of segments such as processed food, consumer goods, restaurants and e-commerce. While the sector had the highest number of PE deals at 25, the aggregate value stood at US$268m (deal value disclosed for only 17 deals), resulting in a low average ticket size of US$16m. This was mainly due to 13 early-stage deals in the sector. Deal value in the sector was topped by a US$50m investment in Jasper Infotech, which operates Snapdeal.com, an online retailer of a range of products. The consortium of investors included eBay, Intel Capital, ru-Net, Saama Capital, Bessemer Venture, Nexus Venture Partners and IndoUS Venture.
4
4
5
6
6
10
10
11
16
19
25
M&E
Agriculture
Business services
Industrial products
Infrastructure
Financial services
Others
Health care
RHC
Technology
RCP
175
196
203
260
268
313
316
409
470
491
1,260
Others
Health care
M&E
Cement
RCP
Financial services
Technology
Infrastructure
Automotive
RHC
Telecommunications
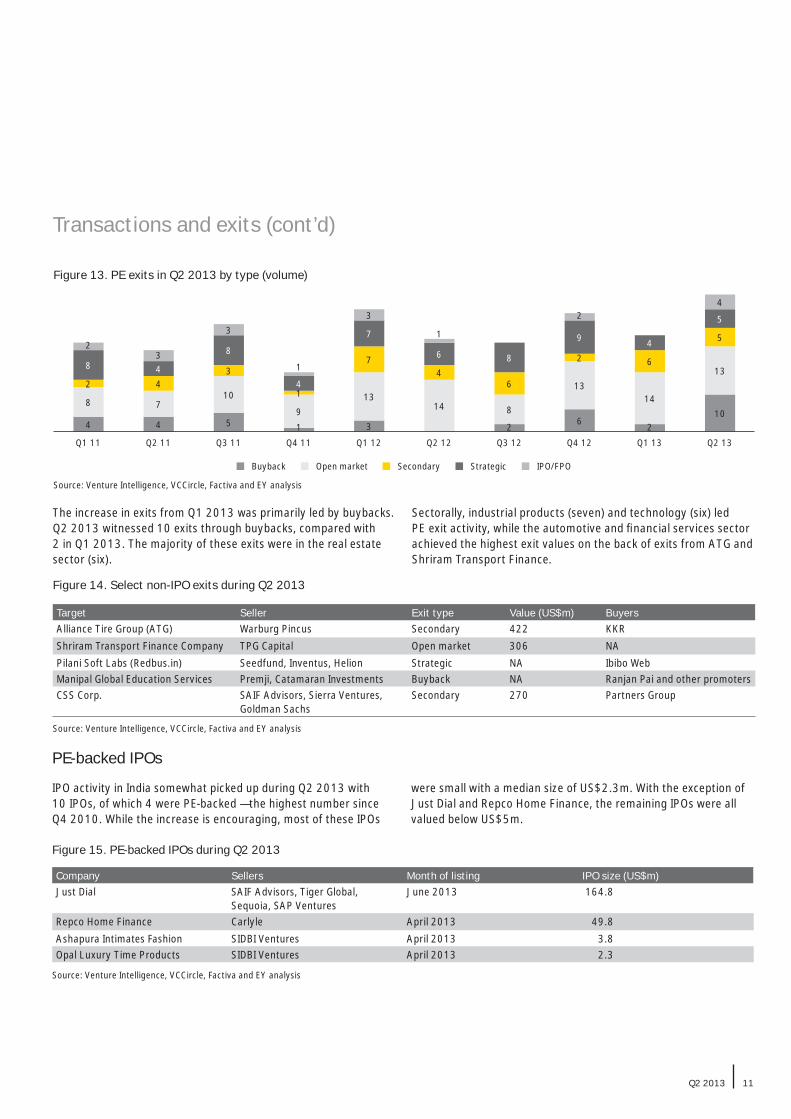
ExitsExit activity continues to be moderateThere were 37 PE exits during Q2 2013. While this is the highest number of exits since Q4 2010, it is not at the levels needed looking at the overall size of the PE portfolio in India. For the third successive quarter, open-market exits led the way in terms of value and volume, recording 13 exits worth US$582m. Except for TPG’s sale of a 10% stake in Shriram Transport Finance Company for US$306m, most of the open-market exits during Q2 2013 were small-stake sales, with the median size being US$6m.
Transactions and exits (cont’d)
Q2 2013 11
Figure 13. PE exits in Q2 2013 by type (volume)
Source: Venture Intelligence, VCCircle, Factiva and EY analysis
4 4 5 1 3 26
210
8 710
913
14 8
1314
132 4
3
1
74
6
2 6
5
8 4
8
4
7
6 8
9 4
5
23
3
1
3
1
24
Q1 11 Q2 11 Q3 11 Q4 11 Q1 12 Q2 12 Q3 12 Q4 12 Q1 13 Q2 13
Buyback Open market Secondary Strategic IPO/FPO
Transactions and exits (cont’d)
Figure 14. Select non-IPO exits during Q2 2013
Source: Venture Intelligence, VCCircle, Factiva and EY analysis
Target Seller Exit type Value (US$m) BuyersAlliance Tire Group (ATG) Warburg Pincus Secondary 422 KKRShriram Transport Finance Company TPG Capital Open market 306 NAPilani Soft Labs (Redbus.in) Seedfund, Inventus, Helion Strategic NA Ibibo WebManipal Global Education Services Premji, Catamaran Investments Buyback NA Ranjan Pai and other promotersCSS Corp. SAIF Advisors, Sierra Ventures,
Goldman SachsSecondary 270 Partners Group
The increase in exits from Q1 2013 was primarily led by buybacks. Q2 2013 witnessed 10 exits through buybacks, compared with 2 in Q1 2013. The majority of these exits were in the real estate sector (six).
Sectorally, industrial products (seven) and technology (six) led PE exit activity, while the automotive and fi nancial services sector achieved the highest exit values on the back of exits from ATG and Shriram Transport Finance.
Figure 15. PE-backed IPOs during Q2 2013
Source: Venture Intelligence, VCCircle, Factiva and EY analysis
Company Sellers Month of listing IPO size (US$m)Just Dial SAIF Advisors, Tiger Global,
Sequoia, SAP VenturesJune 2013 164.8
Repco Home Finance Carlyle April 2013 49.8Ashapura Intimates Fashion SIDBI Ventures April 2013 3.8Opal Luxury Time Products SIDBI Ventures April 2013 2.3
PE-backed IPOs
IPO activity in India somewhat picked up during Q2 2013 with 10 IPOs, of which 4 were PE-backed — the highest number since Q4 2010. While the increase is encouraging, most of these IPOs
were small with a median size of US$2.3m. With the exception of Just Dial and Repco Home Finance, the remaining IPOs were all valued below US$5m.

12 Private equity roundup — India
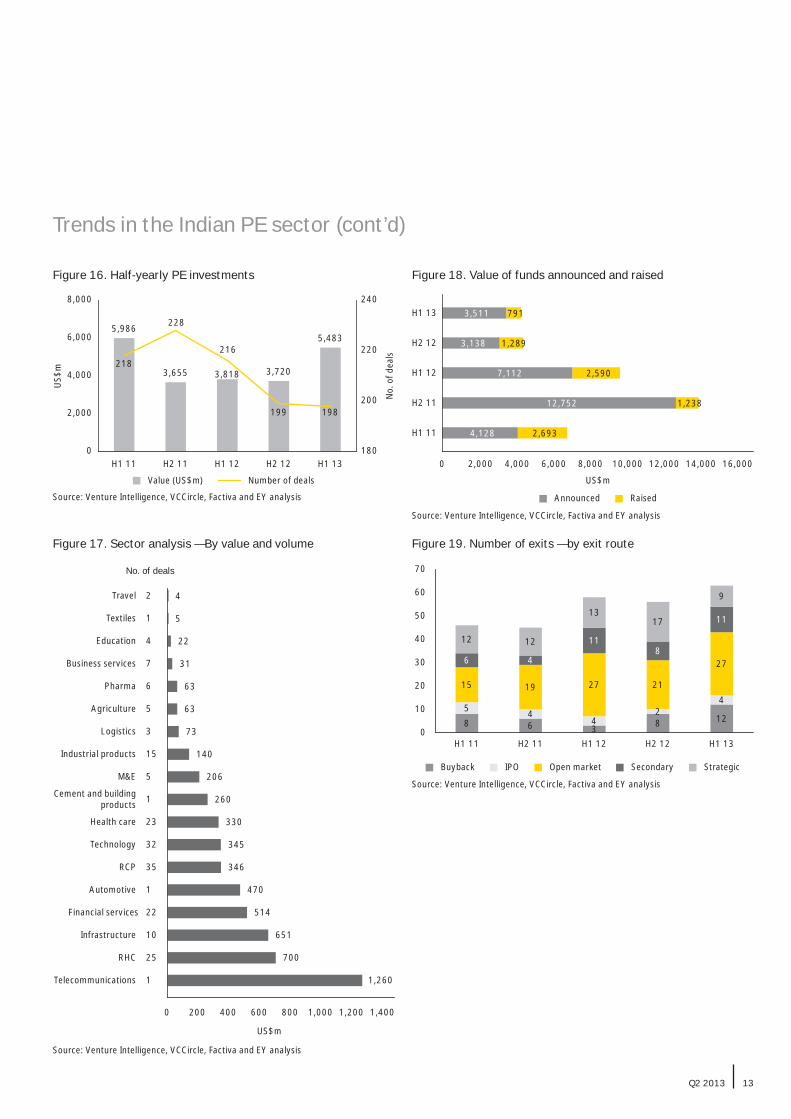
During H1 2013, PE investments totaled US$5.4b across 198 deals, compared with 216 deals worth US$3.8b in H1 2012. While deal volume declined marginally by 9% compared with H1 2012, the overall investment value improved by 43%. Excluding the US$1.2b investment in Bharti Airtel, the investment value during H1 2013 shows an increase of only 10% compared with H1 2012.
While the number of big deals (above US$50m) during H1 2013 (18) was similar to H1 2012 (19), the total value of these is signifi cantly higher in 2013 (H1 2013 — US$3.7b; H1 2012 — US$1.9b). This was driven by few very large deals in 2013:
• Bharti Airtel — Qatar Endowment — US$1.2b
• Alliance Tire Group — KKR — US$470m
• CSS — Partners Group and other investors — US$270m
• Lafarge India — Barings Asia — US$260m
There was only one deal of more than US$200m in H1 2012.
The big-deal market has been a pleasant surprise, but the activity within the mid-market space (US$20m–US$50m) declined by nearly 20%, both in terms of value and volume. This decrease illustrates how the economic slowdown is impacting businesses.
Currently, deals are either driven by PE exits or by deleveraging, or as a response to the working capital needs of the business rather than to fund growth.
Fund-raising has become increasingly challenging for India-focused fund managers, and this is clearly evident from the decline in new commitments over the last two years, with H1 2013 recording the lowest level of new commitments. A stagnating macroeconomic environment in India and the exit overhang are the two main issues fund managers have had to face while soliciting fresh commitments from their investors.
Exit activity improved in H1 2013 but still remains much lower than the levels needed to unwind the investment backlog. The rupee depreciation is also adding to exit woes. H1 2013 recorded 197 investments but only 63 exits. The situation has been similar in the past, leading to a signifi cant buildup of companies needing to exit in the portfolio. Also, listed investments have had more success exiting when compared with their unlisted peers. This has led to continuing investment activity in PIPEs.
Trends in the Indian PE sector: H1 20134
Q2 2013 13
Figure 16. Half-yearly PE investments Figure 18. Value of funds announced and raised
Source: Venture Intelligence, VCCircle, Factiva and EY analysis
Source: Venture Intelligence, VCCircle, Factiva and EY analysis
5,986
3,655 3,818 3,720
5,483
218
228
216
199 198
180
200
220
240
0
2,000
4,000
6,000
8,000
H1 11 H2 11 H1 12 H2 12 H1 13
No.
of d
eals
US$
m
Value (US$m) Number of deals
Source: Venture Intelligence, VCCircle, Factiva and EY analysis
Figure 17. Sector analysis — By value and volume
1,260
700
651
514
470
346
345
330
260
206
140
73
63
63
31
22
5
4
0 200 400 600 800 1,000 1,200 1,400
Telecommunications
RHC
Infrastructure
Financial services
Automotive
RCP
Technology
Health care
Cement and buildingproducts
M&E
Industrial products
Logistics
Agriculture
Pharma
Business services
Education
Textiles
Travel
No. of deals
1
25
10
22
1
35
32
23
1
5
15
3
5
6
7
4
1
2
US$m
0 2,000 4,000 6,000 8,000 10,000 12,000 14,000 16,000
4,128 2,693 H1 11
12,752 1,238 H2 11
7,112 2,590 H1 12
3,138 1,289 H2 12
3,511 791 H1 13
US$m
Announced Raised
Figure 19. Number of exits — by exit route
Source: Venture Intelligence, VCCircle, Factiva and EY analysis
0
10
20
30
40
50
60
70
85
15
6
12
H1 11
64
19
4
12
H2 1134
27
11
13
H1 12
82
21
8
17
H2 12
12
4
27
11
9
H1 13
Buyback IPO Open market Secondary Strategic
Trends in the Indian PE sector (cont’d)

14 Private equity roundup — India
Enactment of Finance Act 2013 (FA 2013) Finance Bill 2013 was assented by the President of India and became Finance Act 2013 on 10 May 2013. There were certain amendments to the original bill as presented by the Finance Minister in the Parliament earlier this year. The key changes introduced are as follows:
• Changes in TRC provisions to avail treaty benefi ts
The original bill had proposed to provide that the TRC issued by the Government of any country/territory to a nonresident shall be necessary but not suffi cient for claiming any relief under a double taxation avoidance agreement (DTAA). However, the amended bill deleted this condition.
Further, under the Income-tax Act, 1961, a nonresident taxpayer is not entitled to benefi ts under a DTAA unless a certifi cate containing prescribed particulars, confi rming his residency outside India or in a specifi ed territory, is obtained by him from the government of that country. This requirement of obtaining the TRC with prescribed particulars has been removed by the FA 2013. Further, a new provision has been inserted that provides that the nonresident taxpayer claiming treaty benefi ts shall be required to provide other documents and information as may be prescribed. These documents and information are yet to be prescribed.
• Benefi cial tax withholding provisions for FIIs and QFIs
A new provision has been inserted that provides for a benefi cial withholding tax rate of 5% for the period 1 June 2013 to 31 May 2015 for interest income earned by FIIs and QFIs from investments in rupee-denominated Indian corporate bonds and government securities, as against the normal withholding
tax rate of 20% in case of FIIs and 40% in case of QFIs. Further, the benefi cial withholding rate on rupee-denominated Indian corporate bonds is available, provided that the rate of interest with respect to the bond does not exceed the rate as may be notifi ed by the Central Government. The rate of interest for this purpose is yet to be notifi ed by the Government of India.
Consolidated foreign direct investment (FDI) policy The Department of Industrial Policy and Promotion (DIPP) issued the consolidated FDI policy, effective from 5 April 2013. This FDI policy subsumes and supersedes all press notes/press releases/clarifi cations/circulars issued by DIPP, which were in force as on 4 April 2013 and refl ects the FDI policy as on 5 April 2013. For the key changes, refer to our regulatory alert on consolidated FDI policy.
Please note that on 1 August 2013, the Government has revised the investment ceilings for various sectors.
D/o IPP F. No. 5(1)/2013-FC.I, dated 5 April 2013
Rationalization of investment routes and monitoring of foreign portfolio investmentsWith a view to rationalize different routes for foreign portfolio investments, SEBI, in its meeting on 6 October 2012, had formed the Committee on Rationalization of Investment Routes and Monitoring of Foreign Portfolio Investments (Committee) under the chairmanship of Shri K. M. Chandrasekhar. The Committee presented its recommendations on 12 June 2013, which was accepted by SEBI in its meeting on 25 June 2013.
Tax and regulatory updates5
Q2 2013 15
Key recommendations made by the Committee include:
• Merger of existing class of portfolio investors, including FIIs and QFIs, into a single investor class of foreign portfolio investors (FPIs)
• Simplifi cation of the registration procedures for FPIs
• Classifi cation of foreign investments as foreign direct investment and foreign portfolio investment, among other things
SEBI would implement recommendations about itself and refer other recommendations to the Government for implementation.
SEBI PR No. 56/2013, dated 12 June 2013, and Press Release No. 60/2013, dated 25 June 2013
Defi nition of ‘group company’ for consolidated FDI policy DIPP has issued a Press Note No. 2 (2013) providing the defi nition of group company, which would be a part of Consolidated FDI Policy Circular 2013, effective from 5 April 2013.
The term group company has been defi ned to mean two or more enterprises that directly or indirectly, are in a position to (i) exercise 26% or more of voting rights in the other enterprise or (ii) appoint more than 50% of members of board of directors in the other enterprise.
The defi nition of group company has brought in much- needed clarity to the consolidated FDI policy for sectors such as defense and cash and carry wholesale trading.
D/o IPP File No. 5/3/2005-FC.I, dated 3 June 2013
Format for seeking clarifi cations on the FDI policy issuesIn order to simplify the procedure for seeking clarifi cations on the provisions of FDI policy, DIPP has issued a notice providing a format for seeking such clarifi cations. It has also been stated that DIPP will process only requests that provide complete details in the specifi ed format.
This new procedure limits the ability to seek clarifi cations on a no-name basis. However, the new procedure for obtaining clarifi cation from the DIPP may lead to reducing the overall lead time in obtaining such clarifi cations.
DIPP notice, dated 10 May 2013 (available at www.dipp.nic.in)
Enlargement of credit enhancement under external commercial borrowings (ECB) policyUnder the existing guidelines, credit enhancements by eligible nonresidents for domestic debt raised were permitted only to Indian companies engaged exclusively in the development of infrastructure and by infrastructure fi nance companies as classifi ed by the Reserve Bank of India.
Under a new circular this has been extended beyond the infrastructure sector, thus increasing the ability of all companies to raise debt.
Under the ECB policy, eligible nonresidents are defi ned to mean multilateral/regional fi nancial institutions, Government-owned fi nancial institutions, direct equity holders having minimum holding of 25% of paid-up capital, and indirect foreign equity holders holding at least 51% of the paid-up capital.
A.P. (DIR Series) Circular No. 120, dated 26 June 2013
Regulations for issuance and listing of non-convertible redeemable preference shares — notifi edSEBI vide board meeting dated 8 March 2013 had approved the SEBI (Issue and Listing of Non-Convertible Redeemable Preference Shares) Regulations 2013 (NCRPS Regulations) providing a comprehensive regulatory framework for issuance and listing of non-convertible redeemable preference shares.
Pursuant to the above, SEBI has notifi ed the NCRPS Regulations on 12 June 2013 permitting public issue of preference shares and listing of privately placed preference shares issued by any public company, public sector undertaking or statutory corporation, as well as issuance and listing of perpetual non-cumulative preference shares and innovative perpetual debt instruments by banks, subject to the conditions therein.
The notifi cation of these regulations has opened up new fund-raising avenues for Indian companies. However, clarity in terms of investments in these instruments by FPIs is awaited.
SEBI PR No. 27/2013, dated 8 March 2013, and SEBI Notifi cation dated 12 June 2013
Clarifi cations on multi-brand retail tradingDIPP has issued a note on 6 June 2013 clarifying various issues related to conditions stipulated for FDI in multi-brand retail trading (MBRT) in India. The note addresses various queries relating to local sourcing requirements, investment in back-end and front-end infrastructure, policy on e-commerce, investment in green-fi eld and brown-fi eld entities, and powers of the state to impose additional conditions, among others raised by various prospective investors.
Please note that on 1 August 2013, the cabinet has cleared further relaxation in the MBRT FDI policy and SBRT (single-brand retail trading) FDI policy.
Tax and regulatory updates (cont’d)

16 Private equity roundup — India
OutlookAs the Indian economy continues to grow at its slowest pace in the last decade or so and with subdued economic indicators across all key sectors, the need for growth capital is rather muted. This has had an adverse impact on PE activity, particularly in the mid-market space, and the trend is likely to continue in the medium term.

Q2 2013 17
In the absence of growth-induced capital requirements, PE investment activity is being driven by capital needs due to high leverage and elongated working capital cycles of businesses as well as PE exits. Such deals tend to be more complex and require more precision. However, these conditions are encouraging a realistic approach to valuations, which should bode well for the investing community.
The focus of the Indian PE industry, in the short to medium term, is fi rmly on exits, particularly for the 2005 to 2008 vintage funds. The signifi cant depreciation in the rupee has also added to concern. A disciplined approach and early preparation can signifi cantly enhance the likelihood of a successful exit. The fi rst half of the year has seen some successful exits, which have renewed the faith in the India story.
The current economic climate and the sustained criticism from various quarters has led the Indian Government to take a number of positive steps to attract greater foreign investment and rebuild investor sentiment. There seems to be clear consensus among the key constituents of the Government around the importance of foreign investment to kick-start the growth engine. Despite slow-paced action, the intent remains positive, which in the long term should support the development of the PE industry in India.
18 Private equity roundup — India
About EY
EYEY is a global leader in assurance, tax, transaction and advisory services. Worldwide, our 167,000 people are united by our shared values and an unwavering commitment to quality. We make a difference by helping our people, our clients and our wider communities achieve their potential.
In IndiaEY India has offi ces in Ahmedabad, Bangalore, Chennai, Gurgaon, Hyderabad, Kolkata, Kochi, Mumbai, New Delhi, NOIDA and Pune. Its workforce of more than 9,900* people work toward the organization’s vision of being a trusted business advisor that contributes to the success of its clients by creating confi dence and value. We help our clients achieve their potential through our leading approach, which incorporates various service dynamics, including:
• An industry-aligned delivery model that harnesses our broad range. Practices focused on specifi c industries draw on knowledge, skills and our experiences of that industry in India and around the world. This helps us customize our approach to the unique needs of each client.
• Our services are broadly classifi ed as four service lines: Assurance, Tax, Transactions and Advisory. Each service line is further streamlined into niche competencies and focused groups, which enable us to strengthen our outreach and offer a compelling portfolio of broad and well-defi ned services.
• Each team is built as a multidimensional group of professionals from diverse backgrounds, with a range of perspectives. They understand and address our clients’ concerns from a variety of standpoints, while using highly evolved tools and approaches to offer inputs in a structured and compelling manner.
• Values and ethics unite us, ensuring cohesive work toward the shared goal of making a difference. A special energy that we bring to each assignment defi nes the way we work and is our key characteristic.
Today, we are recognized as leaders in the professional services industry, and the accolades we receive encourage us to continue striving for excellence.
• “Most Attractive Employer” award in the consulting sector by Randstad
• India’s tier-one tax fi rm for the eleventh consecutive year — Euromoney ITR, World Tax Guide 2013
• Ranked #1 Financial Advisor in India for 11 consecutive years for most number of deals from 2002–12 — Bloomberg
• The most reputed Tax Firm in India, consecutively for four years — TNS Global Tax Monitor Survey 2012
• International Accounting/Due Diligence fi rm of the year, 2012 — M&A Advisory
• Most Active Transaction Advisor Award, PE and M&A for three consecutive years (2009–11) — Venture Intelligence
• Financial Advisor of the Year Award, for two consecutive years (2011–12) — Asian Venture Capital Journal, India Awards
• Financial Advisor of the Year M&A Award — India, 2011, 2009 and 2008 — Financial Times and Mergermarket
• Investment Bank of the Year — Private Equity, 2011 — VCCircle Awards
• Overall winner — consultancy rankings, in survey of risk and compliance professionals — OpRisk & Compliance magazine
• Risk and business advisory relationship with 160 of the BSE300 companies
• “Excellence in Training” award in the Employer Branding Awards for three years (2007—08, 2009–10, 2010–11)
• “Continuous Innovation in HR strategy at work” award in the Employer Branding Awards 2011
* The numbers include personnel from other member fi rms of EY Global based in India.
Q2 2013 19
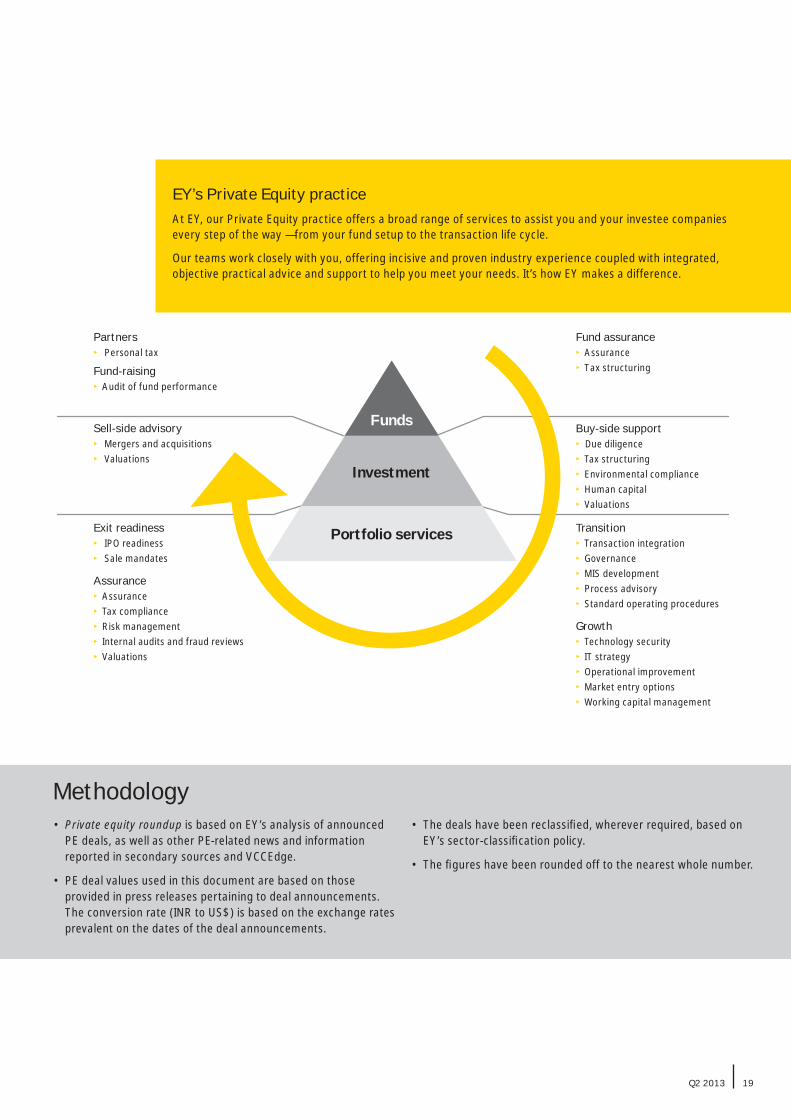
EY’s Private Equity practiceAt EY, our Private Equity practice offers a broad range of services to assist you and your investee companies every step of the way — from your fund setup to the transaction life cycle.
Our teams work closely with you, offering incisive and proven industry experience coupled with integrated, objective practical advice and support to help you meet your needs. It’s how EY makes a difference.
Sell-side advisory Mergers and acquisitions Valuations
Buy-side support Due diligence Tax structuring Environmental compliance Human capital Valuations
Exit readiness IPO readiness Sale mandates
Assurance Assurance Tax compliance Risk management Internal audits and fraud reviews Valuations
Transition Transaction integration Governance MIS development Process advisory Standard operating procedures
Growth Technology security IT strategy Operational improvement Market entry options Working capital management
Fund assurance Assurance Tax structuring
Partners Personal tax
Fund-raising Audit of fund performance
Funds
Portfolio services
Investment
• Private equity roundup is based on EY’s analysis of announced PE deals, as well as other PE-related news and information reported in secondary sources and VCCEdge.
• PE deal values used in this document are based on those provided in press releases pertaining to deal announcements. The conversion rate (INR to US$) is based on the exchange rates prevalent on the dates of the deal announcements.
• The deals have been reclassifi ed, wherever required, based on EY’s sector-classifi cation policy.
• The fi gures have been rounded off to the nearest whole number.
Methodology

20 Private equity roundup — India
Rajiv MemaniCountry Managing Partner Email: [email protected]
Sunil Chandiramani Advisory ServicesEmail: [email protected]
Sudhir Kapadia Tax and Regulatory Advisory ServicesEmail: [email protected]
Arpinder SinghFraud Investigation & Dispute ServicesEmail: [email protected]
Jeff BunderGlobal Private Equity LeaderEmail: [email protected]
Mike RogersGlobal Deputy Private Equity LeaderEmail: [email protected]
If you would like to discuss any of the insights in this report or opportunities in India, please contact your EY advisor or any of the contacts below.
Contacts
Q2 2013 21
Amit KhandelwalTransaction Advisory Services and Transaction SupportEmail: [email protected]
Keyur ShahPE Tax LeaderEmail: [email protected]
Amitabh JhinganCommercial Due DiligenceEmail: [email protected]
Sachin DateEMEIA & UK PE LeaderEmail: [email protected]
Mayank Rastogi Email: [email protected]
For any private equity-related inquiries please contact:
About EY EY is a global leader in assurance, tax, transaction and advisory services. The insights and quality services we deliver help build trust and confidence in the capital markets and in economies the world over. We develop outstanding leaders who team to deliver on our promises to all of our stakeholders. In so doing, we play a critical role in building a better working world for our people, for our clients and for our communities.
EY refers to the global organization, and may refer to one or more, of the member firms of Ernst & Young Global Limited, each of which is a separate legal entity. Ernst & Young Global Limited, a UK company limited by guarantee, does not provide services to clients. For more information about our organization, please visit ey.com.
How EY’s Global Private Equity Center can help your business Value creation goes beyond the private equity investment cycle to portfolio company and fund advice. EY’s Global Private Equity Center offers a tailored approach to the unique needs of private equity funds, their transaction processes, investment stewardship and portfolio companies’ performance. We focus on the market, sector and regulatory issues. If you lead a private equity business, we can help you meet your evolving requirements and those of your portfolio companies from acquisition to exit through a highly integrated global resource of 167,000 professionals across audit, tax, transactions and advisory services. Working together, we can help you meet your goals and compete more effectively.
© 2013 EYGM Limited. All Rights Reserved.
EYG no. FR0101CSG/GSC2013/1128412ED None
In line with EY’s commitment to minimize its impact on the environment, this document has been printed on paper with a high recycled content.
This material has been prepared for general informational purposes only and is not intended to be relied upon as accounting, tax, or other professional advice. Please refer to your advisors for specific advice.
ey.com/privateequity
EY | Assurance | Tax | Transactions | Advisory


