1 Statistics education Early 21st Century New Zealand Pip Arnold Team Solutions The University of Auckland Bevan Werry Presentation Problem • What are the big ideas in Statistics Education in the early 21st Century… – According to Pip Arnold Bevan Werry Presentation November 2008 Problem • Statistical investigation cycle • Has at its heart a starting point based on a problem. • Four or five phases. – Wild & Pfannkuch, 1999 – Graham, 2006 – Franklin & Garfield, 2006 Problem • My theory is that there is question posing and question asking. • Question posing results in a question being formally structured, • Whereas question asking is a continual spontaneous interrogative process. Posing questions • Question posing arises as a result of having a problem that needs to be addressed using a statistical investigation. • Investigative question – The question being asked of the data • Survey question – The question asked to get the data
Transcript
1
Statistics educationEarly 21st Century
New Zealand
Pip ArnoldTeam Solutions
The University of AucklandBevan Werry Presentation
Problem
• What are the big ideas inStatistics Education in theearly 21st Century…
– According to Pip Arnold Bevan Werry Presentation November 2008
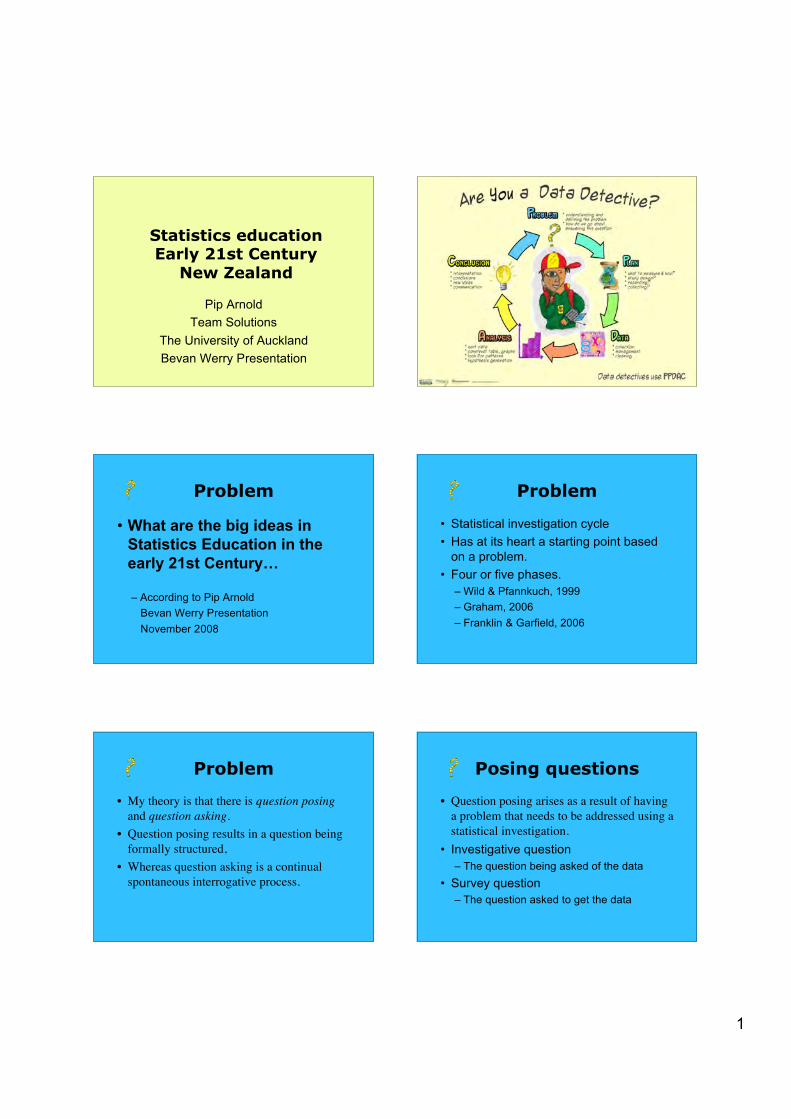
Problem
• Statistical investigation cycle• Has at its heart a starting point based
• My theory is that there is question posingand question asking.
• Question posing results in a question beingformally structured,
• Whereas question asking is a continualspontaneous interrogative process.
Posing questions
• Question posing arises as a result of havinga problem that needs to be addressed using astatistical investigation.
• Investigative question– The question being asked of the data
• Survey question– The question asked to get the data
2
Asking questions
• The interrogative questions – questionsthat are asked as checks within thecycle (the problem, the plan, the data(given data sets), the analysis, theconclusion);
• The analysis questions that are askedabout the statistics, graphs and tablesto develop a description of and aninference about what is noticed (theanalysis).
PROBLEM
Motivating situation/question/idea.
Could be either a survey or experiment situation.
POSE investigative question.
Interrogate investigative questi o n .
PLAN
Develop measurement instruments and data collection procedures.
POSE survey questions.
Interrogate plan.
(Wild & Pfannkuch, 1999, p. 228)
Update investigative question as appropriate and as necessary based on planni n g .
IDEAS
BroadQUESTIONS
PreciseQUESTIONS
STATISTICALKnowlege
CONTEXTKnowlege
PreciseQUESTIONS
PLANfor data
collection
DATA
Collect data.
Revisit the investigative question updating if necessary (maybe pose new investigative questions
that have become apparent after collecting the data ) .
ANALYSIS
Calculate statistics, draw graphs, create tables as appropriate.
ASK analysis questions about the statistics, graphs and tables and describe what is noticed.
Revisit the investigative question updating if necessary (maybe pose new investigative questions
that have become apparent after analysing the data).
CONCLUSION Write the conclusion answering the investigative question(s). Use supporting evidence from the
analysis. Make inferences about the population.
Interrogate the conclusion.
POSE further investigative questions as a result of conclusion .
DATA/PLAN
Data set given.
Explore the data given, how it was collected, who it was collected from etc. Find out the survey
questions if used. Identify the variables of interest, identify the population of interest.
Interrogate the data .
PROBLEM
Motivating situation/question/idea.
POSE investigative question.
Interrogate investigative questi o n .
ANALYSIS
Calculate statistics, draw graphs, build tables as appropriate.
ASK analysis questions about the statistics, graphs and tables and describe what is noticed.
Revisit the investigative question updating if necessary (maybe pose new investigative questions
that have become apparent after analysing the data).
CONCLUSION Write the conclusion answering the investigative question(s). Use supporting evidence from the
analysis. Make inferences about the population.
Interrogate the conclusion.
POSE further investigative questions as a result of conclusion .
Types ofInvestigative Questions• Summary
– A description of the data, usually a single data set• Comparison
– Comparing two (or more) sets of data across acommon variable
• Relationship– Interrelationship between two paired variables
Pfannkuch & Horring, 2005; Graham, 2006
Problem
• What is the population?– Yr 11, NZ, 2007, C@S database
• Average/typical/range do these allmean the same?
• a, the, nothing (a boy, the boys, boys)– Sample/population– Individual/aggregate
• What is typical?
3
Problem
• What is the population?– Yr 11, NZ, 2007, C@S database
• (1)I wonder… what the typical height ofa year 11 girls is from the 2007 NZC@S database.
Problem
• Average/typical/range do these all mean thesame?
• (1)I wonder… what the typical height of ayear 11 girls is from the 2007 NZ C@Sdatabase.
• (3)I wonder on average how many languagesa year 11 can speak from the 2007 NZ C@Sdatabase.
Problem
• a, the, nothing (a boy, the boys, boys)– Sample/population– Individual/aggregate
• (4)I wonder if the typical height of a year 11girl is higher than a year 11 boy from the2007 NZ C@S database.
• I wonder if the boys are taller than the girls.• (5)I wonder if on average year 11 girls speak
more languages than year 11 boys from the2007 NZ C@S database.
Problem
• What is typical?• (13) What is the height of the typical NZyear 11 student.
Problem
• Discuss the questions in pairs.• What do you notice?
What makes a good
question?• can be answered with the data
– Sample size, variable(s) available
• population of interest is clear– a, the, nothing
• sample v target population• Indvidual v aggregate
• variable(s) of interest is/are clear• intent is clear
– summary, comparison, relationship– What is typical? is clear
• one that we are interested in the answer
4
Plan
• Planning where the data is collected.– Happens once the problem is set.
• Planning where the data is given.– Happens as part of the problem setting
process.– Exploring the planning that was done.– Understanding the situation.
PROBLEM
Motivating situation/question/idea.
Could be either a survey or experiment situation.
POSE investigative question.
Interrogate investigative questi o n .
PLAN
Develop measurement instruments and data collection procedures.
POSE survey questions.
Interrogate plan.
(Wild & Pfannkuch, 1999, p. 228)
Update investigative question as appropriate and as necessary based on planni n g .
IDEAS
BroadQUESTIONS
PreciseQUESTIONS
STATISTICALKnowlege
CONTEXTKnowlege
PreciseQUESTIONS
PLANfor data
collection
Reaction times
• Problem: Do my reaction times tend tobe faster than my partners?
• Plan:– How to measure reaction time?
– Decide to use sleeping sheep.– Go to web page.
5
Reaction times
• How many measures will they take?• Will they allow a practice run?• How will they deal with penalty shots?• How do we know everyone has done
the same trialing?• Will we collect individual results or
averages?
DATA/PLAN
Data set given.
Explore the data given, how it was collected, who it was collected from etc. Find out the survey
questions if used. Identify the variables of interest, identify the population of interest.
Interrogate the data .
PROBLEM
Motivating situation/question/idea.
POSE investigative question.
Interrogate investigative questi o n .
ANALYSIS
Calculate statistics, draw graphs, build tables as appropriate.
ASK analysis questions about the statistics, graphs and tables and describe what is noticed.
Revisit the investigative question updating if necessary (maybe pose new investigative questions
that have become apparent after analysing the data).
CONCLUSION Write the conclusion answering the investigative question(s). Use supporting evidence from the
analysis. Make inferences about the population.
Interrogate the conclusion.
POSE further investigative questions as a result of conclusion .
Being typical
• Students are given data to work with.• Use data cards.• Give each group a different sample.• What do we know about the data on the
cards?• Taken from Census at School
database, Questions about You.
Being typical
• Take a few data cards each.• Discuss in pairs/groups what you think
the variables might be.
Being typical gender
neckcircumferencewrist
circumference
year level age
Being typical
• Are you: male/female• What is your wrist circumference in cm?• What is your neck circumference in cm?• Year level was by default - based on
teacher entry.• How old are you?
6
Being typical
• Take one card and describe the personon it to your neighbour.
• Now write the description down!
Being typical
• This student is a boy. He is in Year 9and is 14 years of age. His wristcircumference is 15cm and his neckcircumference is 30cm.
• Draw a data card to show this student’sdata.
Being typical
• Students need to understand that eachcard is a person.
• They need to become familiar with thecontext.
• They need to know what the questionswere that were asked to get the data.
• Need to model.• Need to give structure.• Need to remember context.• Need to do in class.• Need to describe not just answer
question.
Analysis
• Inference• Informal comparative reasoning -
Pfannkuch et al 2008• Informal statistical inference - Wild
Conclusion
• Some starting points for conclusions.– Answer the question.– Provide supporting evidence from your
analysis.– Generalise to the population of interest.
Conclusion
• What are the big ideas inStatistics Education in theearly 21st Century…
Conclusion
• Problem is critical.– Variables of interest– Population of interest– Intention– Able to be answered by the data– Answer is of interest to someone
• Don’t hurry this part. Take time toestablish the context - link to planningfor given data sets.
Conclusion
• Planning is an often over looked aspectof the cycle.
• With given data sets it is important toprovide background information abouthow the data was collected; what werethe survey questions, who wassurveyed.
• Context - students need to be familiarwith the context.
9
Conclusion
• Use real multivariate data sets.• Give groups different samples from the
same population. Compare and contrastoutcomes.
Conclusion
• Analysis is about describing the data.• I notice …• What is it that the data tells you?• Look at the shape, spread, middle
group, anything unusual.• Remember to relate to the context.• Make inferential statements when you
can.
Conclusion
• Answer the problem.• Give supporting evidence.• Generalise to the population.