BiogasForum Seminar, Nov 29, 2005 DTU Jing Liu Jing Liu Dept. of Biotechnology, Center for Chemistry and Chemical Engine Dept. of Biotechnology, Center for Chemistry and Chemical Engine ering, Lund University, Sweden ering, Lund University, Sweden BiogasForum Öresund seminar ”Process control in biogas reactors”, Copenhagen, Nov. 29, 2005 Process control for intensifying biogas production Process control for intensifying biogas production in anaerobic fermentation in anaerobic fermentation
Transcript
BiogasForum Seminar, Nov 29, 2005 DTU
Jing LiuJing LiuDept. of Biotechnology, Center for Chemistry and Chemical EngineDept. of Biotechnology, Center for Chemistry and Chemical Engineering, Lund University, Swedenering, Lund University, Sweden
BiogasForum Öresund seminar ”Process control in biogas reactors”, Copenhagen, Nov. 29, 2005
Process control for intensifying biogas production Process control for intensifying biogas production
in anaerobic fermentationin anaerobic fermentation
BiogasForum Seminar, Nov 29, 2005 DTU
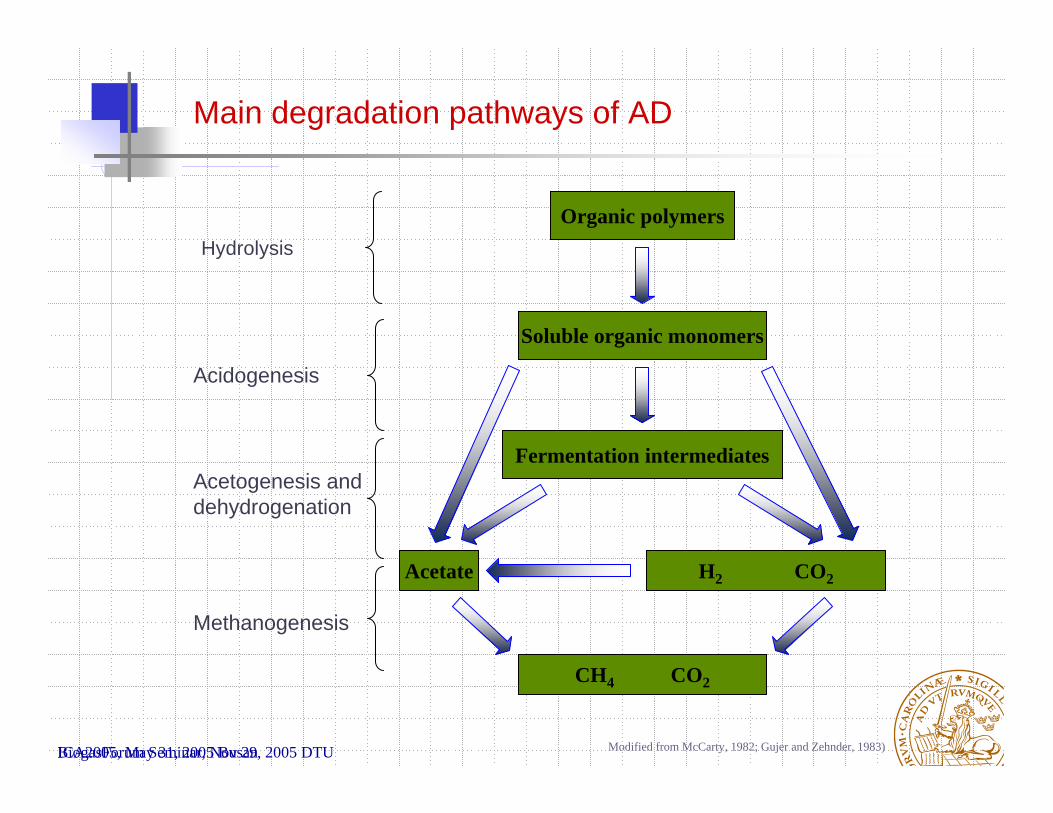
Main degradation pathways of AD
Organic polymers
Soluble organic monomers
Acetate H2 CO2
Fermentation intermediates
CH4 CO2
Modified from McCarty, 1982; Gujer and Zehnder, 1983)
Hydrolysis
Acidogenesis
Acetogenesis and dehydrogenation
Methanogenesis
ICA2005, May 31, 2005 Busan
BiogasForum Seminar, Nov 29, 2005 DTU
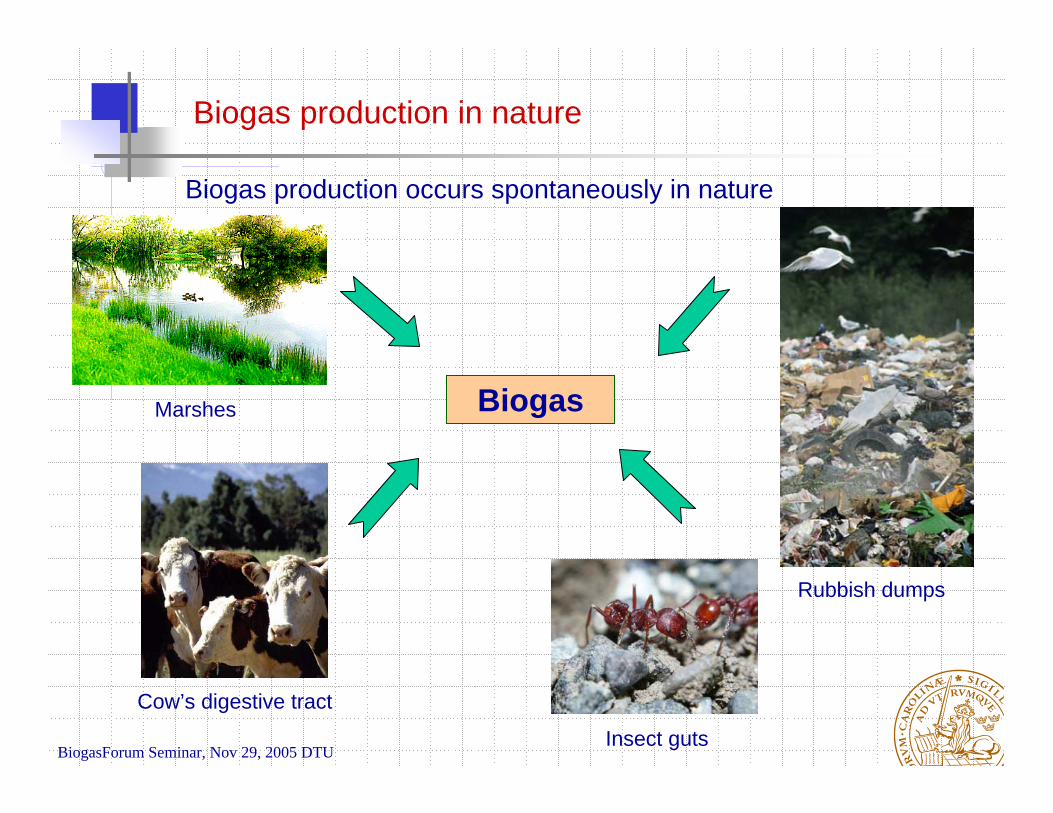
Biogas production in nature
Biogas production occurs spontaneously in nature
Marshes
Rubbish dumps
Cow’s digestive tract
Insect guts
Biogas
BiogasForum Seminar, Nov 29, 2005 DTU
Biogas production in engineered devices
Industrial AD bioreactor Landfill
Energy crops
Wastewater
Solid waste
Biogas
Treated wastewater
Compost
1 m3 of Biogas (70% CH4 + 30% CO2)= 0.66 liter diesel fuel= 0.75 liter petrol = 0.25 m3 propane= 0.20 m3 butane= 0.85 kg coal
BiogasForum Seminar, Nov 29, 2005 DTU
Closed-tank reactor w ith heating and
m ixing
Waste stabilization using AD
China began using biogas for heat, light
and cooking
Rapid and w orldw ide developm ent of
sim ple AD
Energy crisis (1973, 1979) m ade biogas
as an energy source
Millions of sm all digesters w ere constructed in
China, India.
Non-erergy benefits of AD w ere
recognized - sludge and odor reduction,
Fram -based & centralized
digesters w ere develped in Europe
Decom position of organic toxic and
hazardous com pound
Pioneer w ork of ICA for high rate AD
1920 1973 1985 1996
Biogas w as occasional used for
heat
Pioneer w ork by Busw ell in
m icrobiology
Sanitation concerns
Fueling street lam ps in UK Lim ited research in
AD
Sm all-scale energy and sanitation system s w ere
prom oted in Asia
Energy + w aste handling + pathogen
reduction
Municipal solid w aste handling
ICA+D in AD
AD + FC
Being a part of
integrated recovery
system for sustainable
devel.
History of AD as a process for practical use
BiogasForum Seminar, Nov 29, 2005 DTU
Characteristic of AD
Low energy yield from acetogenic step
Methane production
Low cellular yield
A multi-step process
Sustainable development
Pathogen control
Sludge reduction
Nutrients recycle
Waste handling
Renewable energy
Advantages
Risk of system overload
Sensitive to environmental changes
Unstable process
Large reactor volume
Long retention time
Disadvantages
ICA2005, May 31, 2005 Busan
BiogasForum Seminar, Nov 29, 2005 DTU
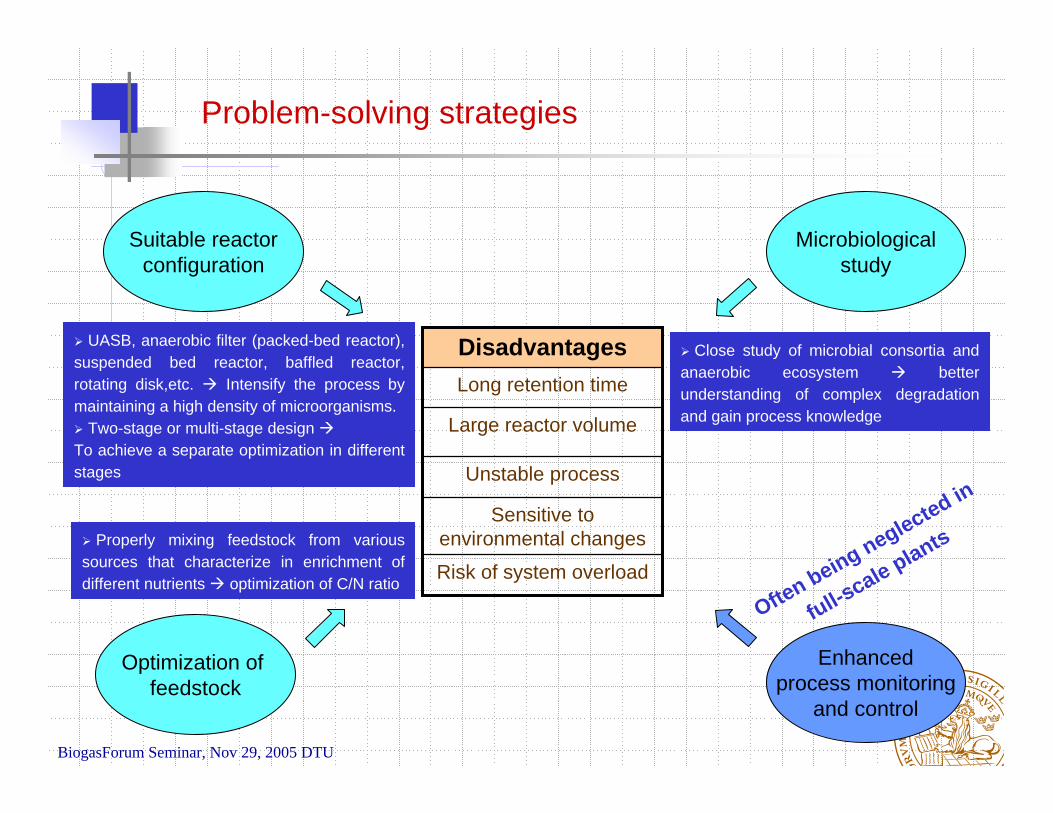
Problem-solving strategies
Risk of system overload
Sensitive to environmental changes
Unstable process
Large reactor volume
Long retention time
Disadvantages
Microbiologicalstudy
Suitable reactorconfiguration
Optimization of feedstock
UASB, anaerobic filter (packed-bed reactor), suspended bed reactor, baffled reactor, rotating disk,etc. Intensify the process by maintaining a high density of microorganisms.
Two-stage or multi-stage design To achieve a separate optimization in different stages
Close study of microbial consortia and anaerobic ecosystem better understanding of complex degradation and gain process knowledge
Properly mixing feedstock from various sources that characterize in enrichment of different nutrients optimization of C/N ratio
Enhancedprocess monitoring
and control
Often being neglected in
full-scale plants
BiogasForum Seminar, Nov 29, 2005 DTU
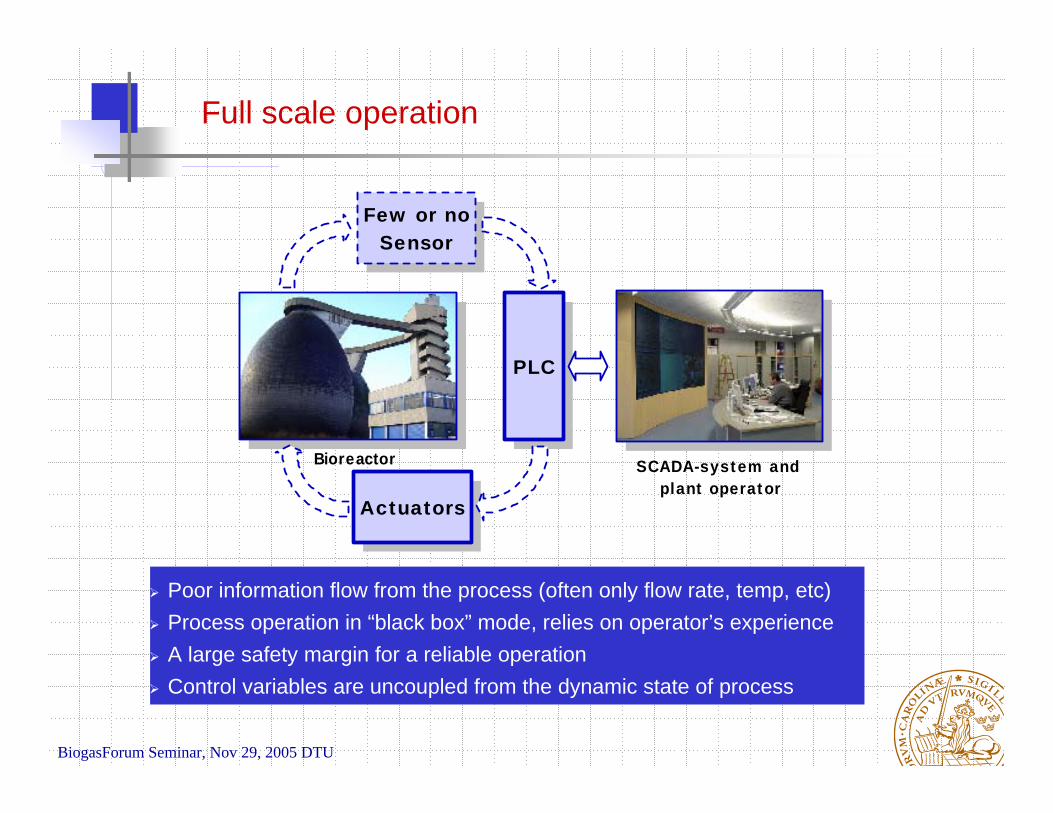
Full scale operation
SCADA-system and plant operator
Few or no Sensor
Actuators
PLC
Bioreactor
Poor information flow from the process (often only flow rate, temp, etc)Process operation in “black box” mode, relies on operator’s experienceA large safety margin for a reliable operationControl variables are uncoupled from the dynamic state of process
BiogasForum Seminar, Nov 29, 2005 DTUICA2005, May 31, 2005 Busan
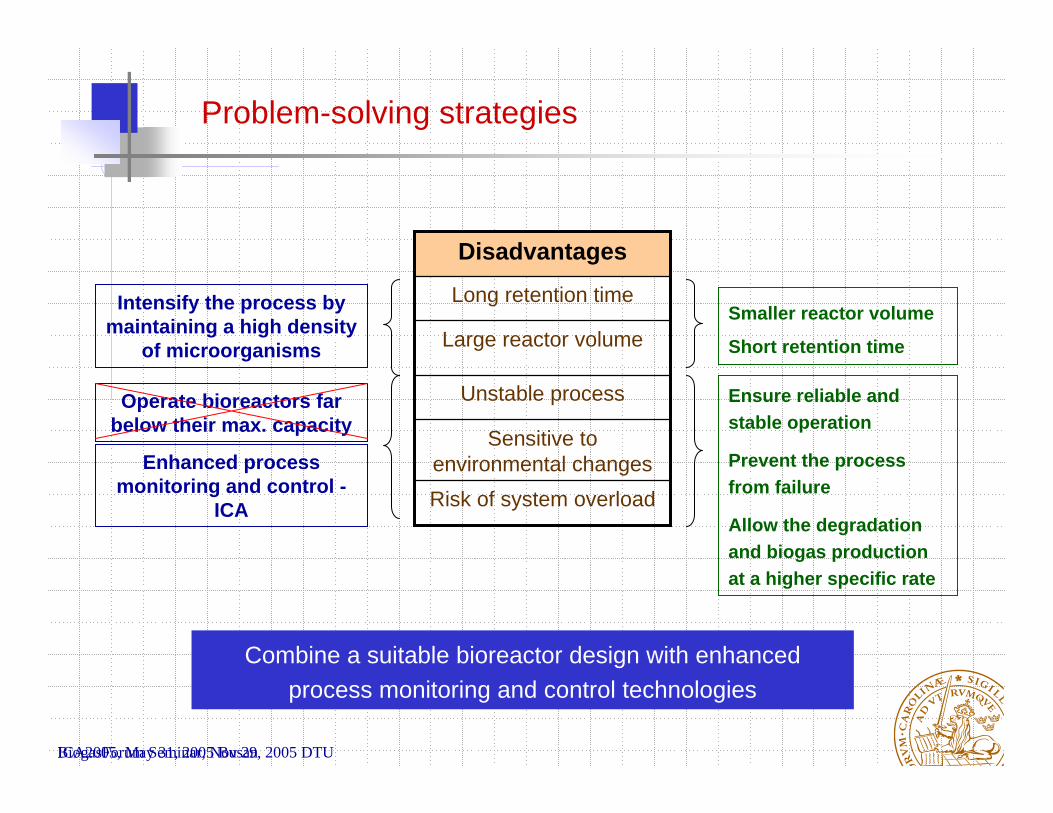
Problem-solving strategies
Risk of system overload
Sensitive to environmental changes
Unstable process
Large reactor volume
Long retention time
Disadvantages
Intensify the process by maintaining a high density
of microorganisms
Smaller reactor volume
Short retention time
Enhanced process monitoring and control -
ICA
Ensure reliable and stable operation
Prevent the process from failure
Allow the degradation and biogas production at a higher specific rate
Combine a suitable bioreactor design with enhanced process monitoring and control technologies
Operate bioreactors far below their max. capacity
BiogasForum Seminar, Nov 29, 2005 DTU
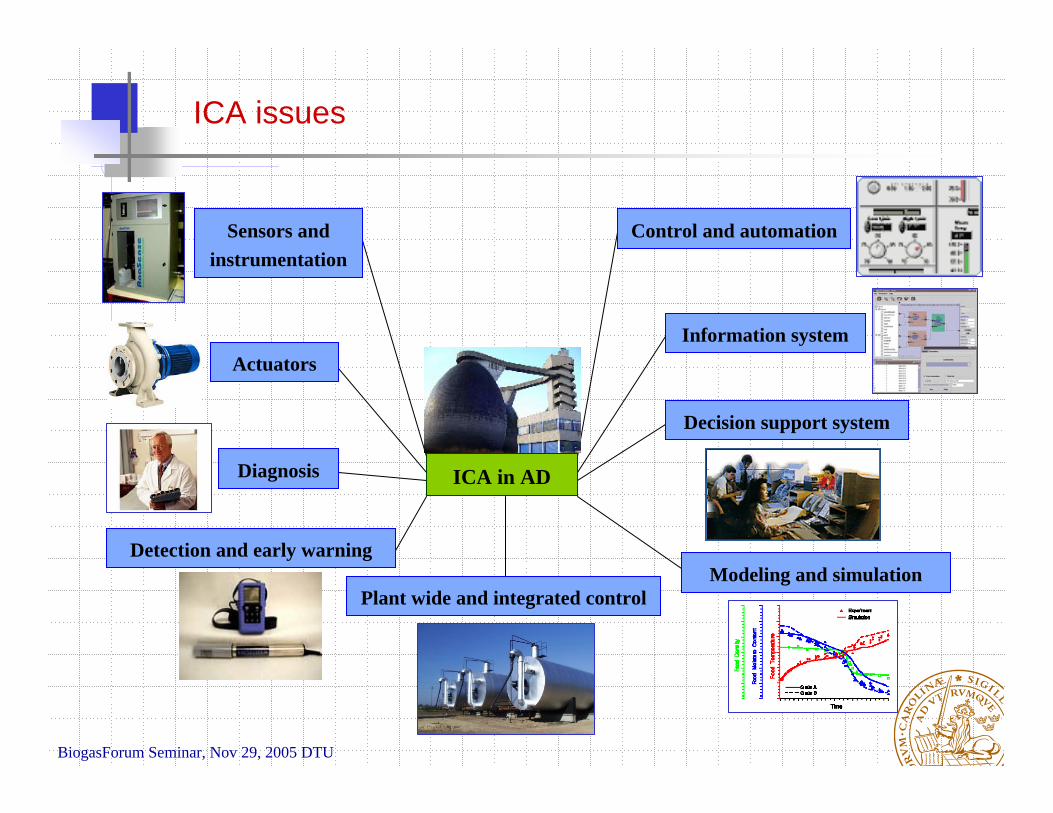
Actuators
Plant wide and integrated control
Diagnosis
Sensors and instrumentation
Control and automation
Information system
Modeling and simulation
Decision support system
Detection and early warning
ICA in AD
ICA issues
BiogasForum Seminar, Nov 29, 2005 DTU
Component block diagram of the control system
BioprocessSlave controller∑
pH sensor
+
-
e1
feeding rate
Reference of gas flow rate M aster
controller
O utput∑
Gas flow meter
e2+
-
reference pH
Rule-based system
D value
A cascade control structure and a rule-based system with extremum-seeking feature
Cascade contorl + extremum-seeking
BiogasForum Seminar, Nov 29, 2005 DTU
Rule-based system with extremum-seeking feature
3.4
3.6
3.8
4
4.2
4.4
4.6
4.8
0 1 2 3 4 5 6 7Time (hour)
Gas
flow
rate
(lga
s ·lre
acto
r-1·d
ay-1
)
GasFlow (setp o int )
GasFlow (mo nito red )
to add a small increment in the feed rate over a short period of time, then to closely monitor and analyze the process response
to test the upper limit of the process treatment capacity and maximize the reactor performance
to add a small increment in the feed rate over a short period of time, then to closely monitor and analyze the process response
to test the upper limit of the process treatment capacity and maximize the reactor performance
BiogasForum Seminar, Nov 29, 2005 DTU
Develop a fast reacting control system based on existing simple sensors
Schedule control tasks according to different time scales
Protect process from overload
Reject disturbances
Up-flow anaerobic fixed bed reactor
Feeding tank
DAQ hardware
Gas flow meter & infrared sensor for methane
pH meter
Feeding pumpRecirculation pump
Effluent outlet
Gas outlet
Data
Computer
Gas-liquid separation unit
P P
Anaerobic bioreactor can be operated close to the maximum capacity, still having enough
safety margins for reliable operation
AD reactor can be operated close to its maximum capacity
BiogasForum Seminar, Nov 29, 2005 DTU
15
20
25
30
35
40
45
50
55
60
65
70
75
0 10 20 30 40 50 60 70 80 90 100 110
Gas
com
posit
ion
(%)
6.4
6.5
6.6
6.7
6.8
6.9
7.0
7.1
7.2
7.3
7.4
pH
CH4 ( infra red se nsor)CH4 (GC)
CO2 ( infra red se nsor)CO2 (GC)
pH se t point
pH monit ore d
0
5
10
15
20
25
30
0 10 20 30 40 50 60 70 80 90 100 110
T ime (h)
Org
anic
load
/deg
rade
d(g
CO
D·l re
acto
r-1·d
-1)
0
10
20
30
40
50
60
70
80
90
100
COD
rem
oval
rate
(%)
Organic degraded
Organic load
COD remova l ra t e
0.20
0.25
0.30
0.35
0.40
0.45
0.50
0.55
0.60
0.65
0.70
0 10 20 30 40 50 60 70 80 90 100 110
T ime (h)
Gas
yie
ld (l
gas·g
CO
D rem
oved
-1)
Ga s yie ld
CH4 yie ld
0
1
2
3
4
5
6
7
8
9
10
11
12
0 10 20 30 40 50 60 70 80 90 100 110
Gas
flow
rate
(lga
s·lre
acto
r-1·d
-1)
0
2
4
6
8
10
12
14
16
18
20
22
24
Org
anic
deg
rade
d (g
CO
D·l rea
ctor
-1·d
-1)
Ga s f low se t point
Orga nic de gra de d
Gas f low monit ored
Only 4 days were needed to increase the OLR from 0 to 27 g COD·lreactor-1·d-1.
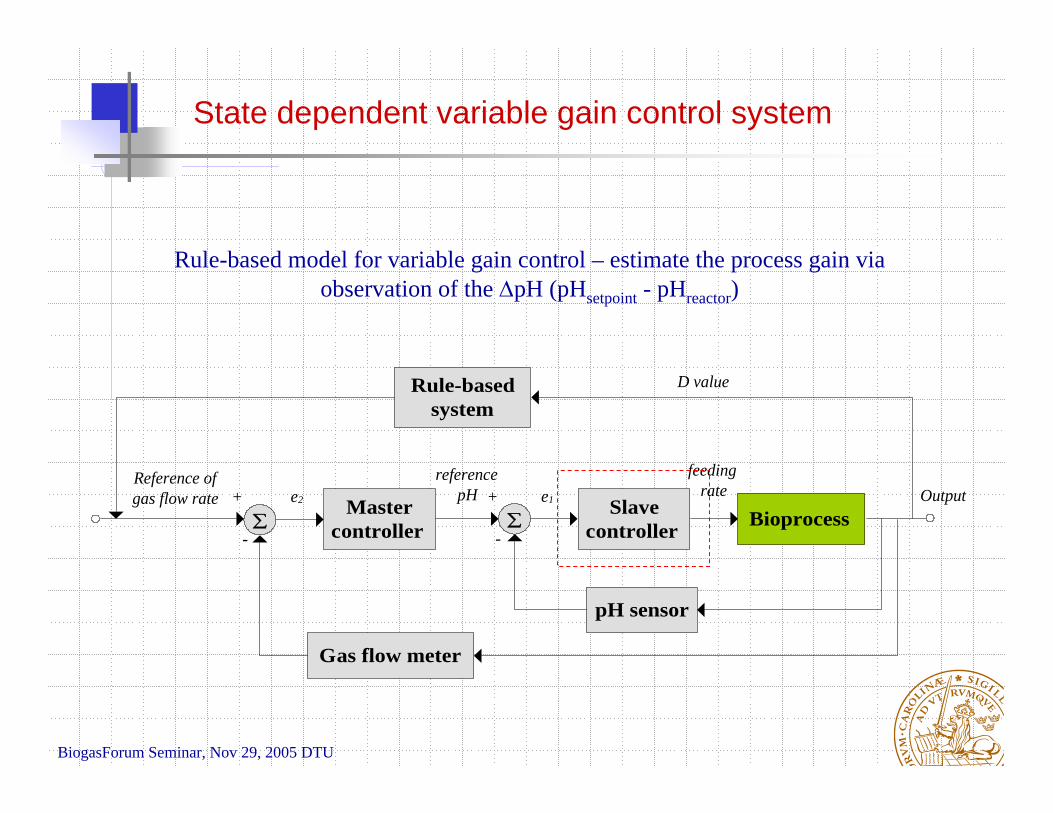
Rule-based model for variable gain control – estimate the process gain via observation of the ΔpH (pHsetpoint - pHreactor)
BioprocessSlave controller∑
pH sensor
+
-
e1
feeding rate
Reference of gas flow rate Master
controller
Output∑
Gas flow meter
e2+
-
reference pH
Rule-based system
D value
State dependent variable gain control system
BiogasForum Seminar, Nov 29, 2005 DTU
S2
S6S3
S4
S5S7
S11
29
14
7
3
6
12
5
8
13
4
1011
171820
22
19
2116
S8
23
24 25
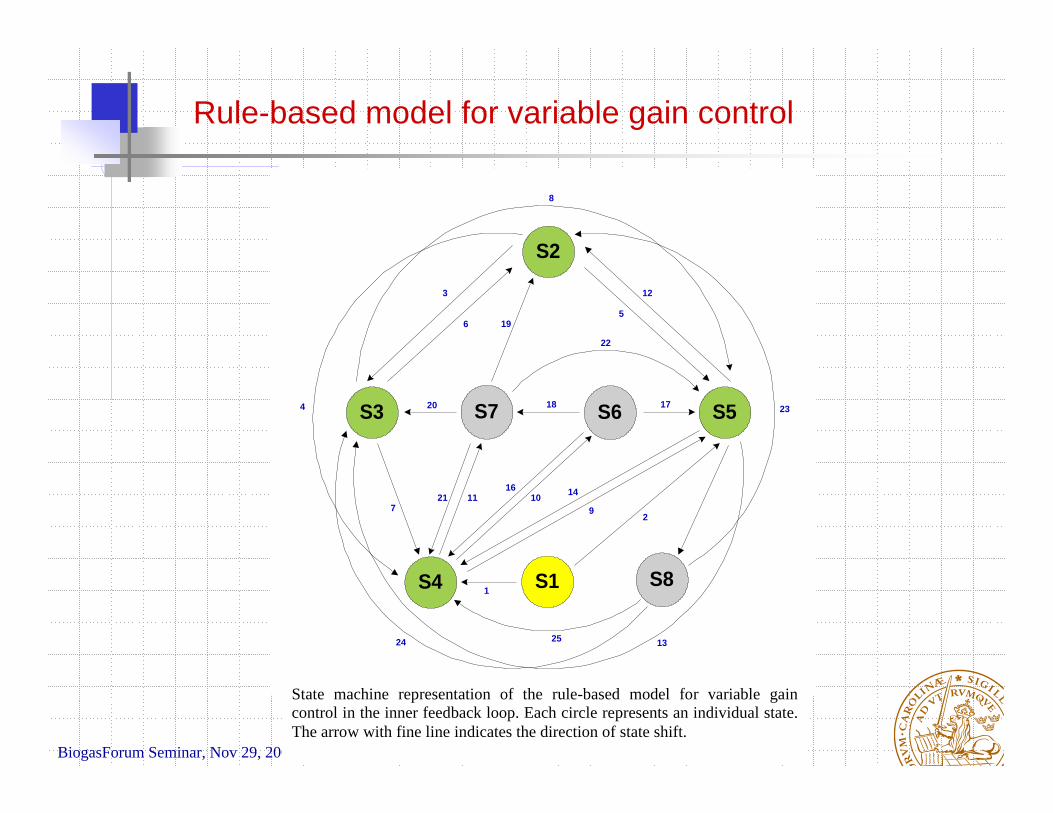
State machine representation of the rule-based model for variable gaincontrol in the inner feedback loop. Each circle represents an individual state.The arrow with fine line indicates the direction of state shift.