36
Presented by Michael N DiFilippo, Consultant July 08, 2008 Produced Water for Cooling – A Case Study San Juan Generating Station Advanced Cooling Technologies EPRI Workshop
| Date post: | 14-Apr-2018 |
| Category: |
Documents |
| Upload: | dinhkhuong |
| View: | 218 times |
| Download: | 2 times |

Presented byMichael N DiFilippo, Consultant
July 08, 2008
Produced Water for Cooling – A Case StudySan Juan Generating Station
Advanced Cooling TechnologiesEPRI Workshop

Produced Water for Cooling – A Case StudySan Juan Generating Station

San Juan generating Station’s Water Issues…..San Juan Generating Station (SJGS) consumes 22,000 acre-feet of water per year (467,600 BPD or 13,640 gpm) from the San Juan River.SJGS is a base-loaded plant and needs a reliable source(s) of water to operate.Researchers at the University of Arizona predict an extended drought for the region – possibly lasting 40 to 50 years.SJGS is a long-term energy production site and will be there 25 years or more.PNM has negotiated short-term and long-term water contracts to ensure supply, however if a severe a drought develops water contracts are irrelevant.If SJGS uses less water through conservation and obtains alternative supplies (e.g. produced water), more water will be available for other beneficial uses.

One drought scenario…..
SJGS has to reduce power by 10% for an entire year.SJGS has a long-term take-or-pay fuel contract, i.e. PNM must pay for fuel whether it uses it or not.SJGS will have to purchase power from other generators (most likely gas-fired combined cycle plants).The financial impact for this scenario could be in excess of $45million per year.PNM has looked at scenarios where water reductions approach 30%.
The basis for this project was to provide supplemental water to avoid or minimize the financial impact of such a scenario.....

Produced Water

For every barrel of oil, 8 to 10 barrels of water are brought to the surface.....

0 gpm
0-700 gpm
700-7,000 gpm
7,000-70,000 gpm
70,000-420,000 gpm
0 AF/yr
0-1,120 AF/yr
1,120-11,200 AF/yr
11,200-112,000 AF/yr
112,000-672,000 AF/yr
mgd
mgd
mgd
mgd
mgd
Onshore Produced Water Generation

DOE – US-Russia Energy Working Group, April 2003


Project Setting

San Juan Geologic Basin
UtahArizona
ColoradoNew Mexico
San Juan Basin
FruitlandPetroleumSystem
Farmington
New Mexico
Albuquerque
Santa Fe
Farmington
San Juan Basin
SJGS

Fruitland PetroleumSystem Boundary
13W 7W 6W 5W 4W12W 11W 10W 9W 8W 3W14W15W16W
32N
31N
30N
29N
27N
28N
ColoradoNew Mexico
Base Map of Study Area (~2,200 sq miles)20 miles 510 0
64
550
550
64
N
San Juan River
San Juan Rive
r
Animas
Rive
r
Navajo Reservoir
San Juan C
ounty
Rio A
rriba County
Farmington
Kirtland
Bloomfield
AztecSan Juan Generating Station
Township Grid

13W 7W 6W 5W 4W12W 11W 10W 9W 8W 3W14W15W16W
32N
31N
30N
29N
27N
28N
ColoradoNew Mexico
64 64
550
550
Farmington
Kirtland
Bloomfield
Aztec
SJGS
Produced Water Project –Extent of ProductionNew Mexico Oil Conservation Division, 2002
20 miles 510 0
Each circle represents a production well or well cluster
Fruitland Petroleum System
Total Produced Water = 61,775 BPD
N
San Juan River
San Juan Rive
r
Animas
Rive
r
Navajo Reservoir
San Juan C
ounty
Rio A
rriba County
In the Four Corners area almost all of the produced water is trucked to disposal.....

McGrath SWD (Salt Water Disposal) Facility
McGrath is a large SWD near Farmington, New Mexico. Produced water generated at the wellhead is transported by tanker trucks to SWDs. At the SWD, oil is separated from the produced water. The water is then filtered and injected into a non-producing formation at depths that sometimes reach 5,000 feet. In some locations, injection pressures exceed 1,500 psi. There are 53 SWDs in the San Juan Basin.

Fairway
13W 7W 6W 5W 4W12W 11W 10W 9W 8W 3W
32N
31N
30N
29N
27N
28N
ColoradoNew Mexico
Township Grid
San Juan RiverSan Ju
an River
Animas
Rive
r
Navajo Reservoir
San Juan C
ounty
Rio A
rriba County N
Produced Water Generation – High-Volume AreasNew Mexico Oil Conservation Division, 2003
20 miles 510 0
Produced WaterCollection Center
Farmington
Kirtl andBloomfield
Aztec
San Juan Generating Station
64
550
64
CO2 Gas LineHart Canyon LineExtension (new)Produced WaterPipeline (new)
High Volume Area
SWD Injection Well
Tri-CityClose-in
High-Volume Production AreasFairwayClose-inTri-CityTotal
20,680 BPD12,520 BPD
2,760 BPD39,560 BPD
39,560 BPD = 1,154 gpm

Likely Recoverable WaterPNM - Produced Water Project - SJGS
1,000
1,500
2,000
2,500
3,000
2005 2010 2015 2020 2025 2030
Project Year
Like
ly R
ecov
erab
le W
ater
, AF/
yr
Likely Recovery Range
Water Recovery CasesTotal Resource90% – Case 580% – Case 470% – Case 3
Scenario 36% Declination
Life-of-project recoverable water.....

Project Implementation
Cost sharing with the oil & gas producers reduced overall costs.....
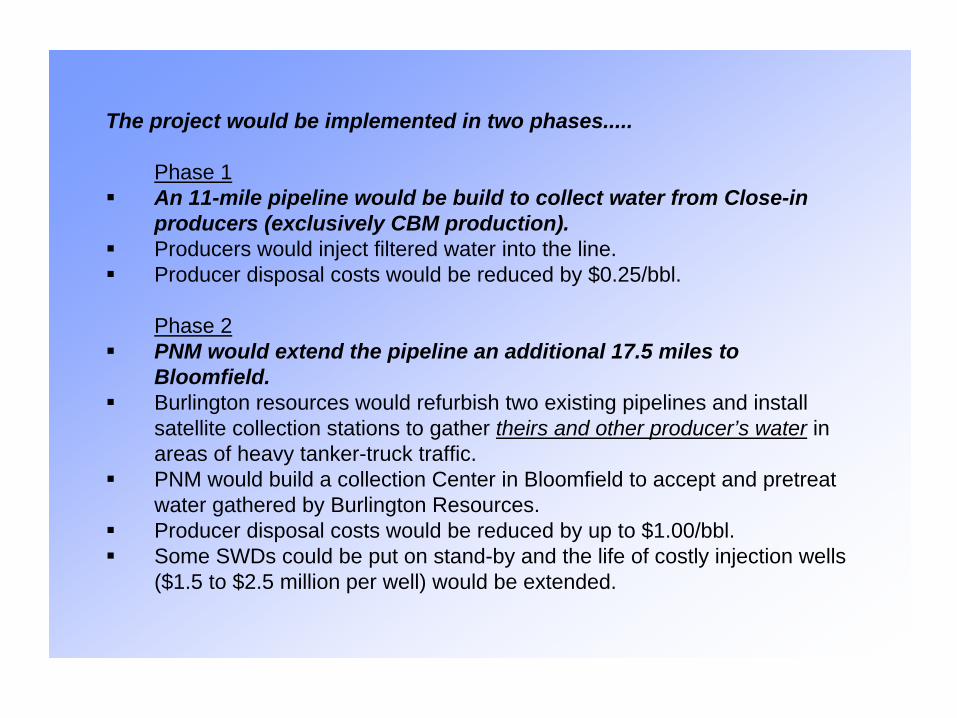
The project would be implemented in two phases.....
Phase 1An 11-mile pipeline would be build to collect water from Close-in producers (exclusively CBM production).Producers would inject filtered water into the line.Producer disposal costs would be reduced by $0.25/bbl.
Phase 2PNM would extend the pipeline an additional 17.5 miles to Bloomfield.Burlington resources would refurbish two existing pipelines and install satellite collection stations to gather theirs and other producer’s water in areas of heavy tanker-truck traffic.PNM would build a collection Center in Bloomfield to accept and pretreat water gathered by Burlington Resources.Producer disposal costs would be reduced by up to $1.00/bbl.Some SWDs could be put on stand-by and the life of costly injection wells ($1.5 to $2.5 million per well) would be extended.
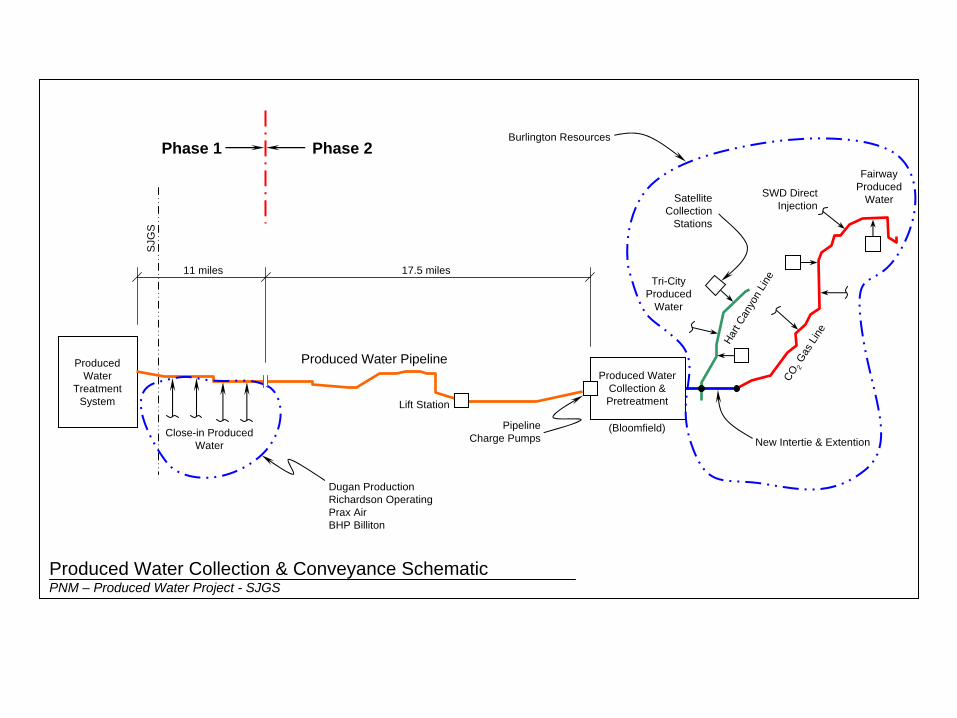
Produced Water Collection & Conveyance SchematicPNM – Produced Water Project - SJGS
Lift Station
PipelineCharge Pumps
Produced WaterCollection &Pretreatment
SJG
S
ProducedWater
TreatmentSystem
17.5 miles
Produced Water Pipeline
Tri-CityProduced
Water
Hart
Cany
on L
ine
CO2
Gas L
ine
Close-in ProducedWater New Intertie & Extention
SatelliteCollection
Stations
SWD DirectInjection
FairwayProduced
Water
(Bloomfield)
Burlington Resources
Dugan ProductionRichardson OperatingPrax AirBHP Billiton
11 miles
Phase 2Phase 1

Produced Water Treatment

Produced Water SalinityBurlington Resources, McGrath SWD
5,000
10,000
15,000
20,000
25,000
4/4/03 4/9/03 4/14/03 4/19/03 4/24/03 4/29/03 5/4/03 5/9/03
Sample Date
TDS,
mg/
l

Bloomfield Collection CenterPNM – Produced Water Project - SJGS
Produced WaterReceiving Tanks (2)
Gravity-CoalescingO/W Separators
(2-100%)
Skimmed Oil
Grit
Gas Floatation Units(2-100%)
Float
2-Day Equalization Basin
PipelineCharge Pumps
(4-33%)
Off-spec
40,000 BPDProducedWater
AETurb
AECond
DP
Walnut Shell Filters(2-100%)
Rinse
Backwash
Produced WaterReceiving Tanks (2)
Gravity-CoalescingO/W Separators
(2-100%)
Skimmed Oil
Grit
Gas Floatation Units(2-100%)
Float
2-Day Equalization Basin
PipelineCharge Pumps
(4-33%)
Off-spec
40,000 BPDProducedWater
AETurb
AECond
DP
Walnut Shell Filters(2-100%)
Rinse
Backwash
AETurb
AECond
DP
Walnut Shell Filters(2-100%)
Rinse
Backwash

HERO System – Process SchematicSan Juan Generating Station
Degassifier
Ca(OH)2
Na2 CO3
Coagulant Aide
H2 SO4 NaOCl
Vent
Air
Reactor-Clarifier& Thickener
Weak-Acid CationExchanger (WAC)
Backwash & Spent Regenerant
ThickenedSludge toScrubbers
NaOH
Reverse Osmosis
Permeate to Reuse
Reject to Evaporators
NaHSO3
ProducedWater
Permeate to FilterBW & WAC Regen
Ove
rflow
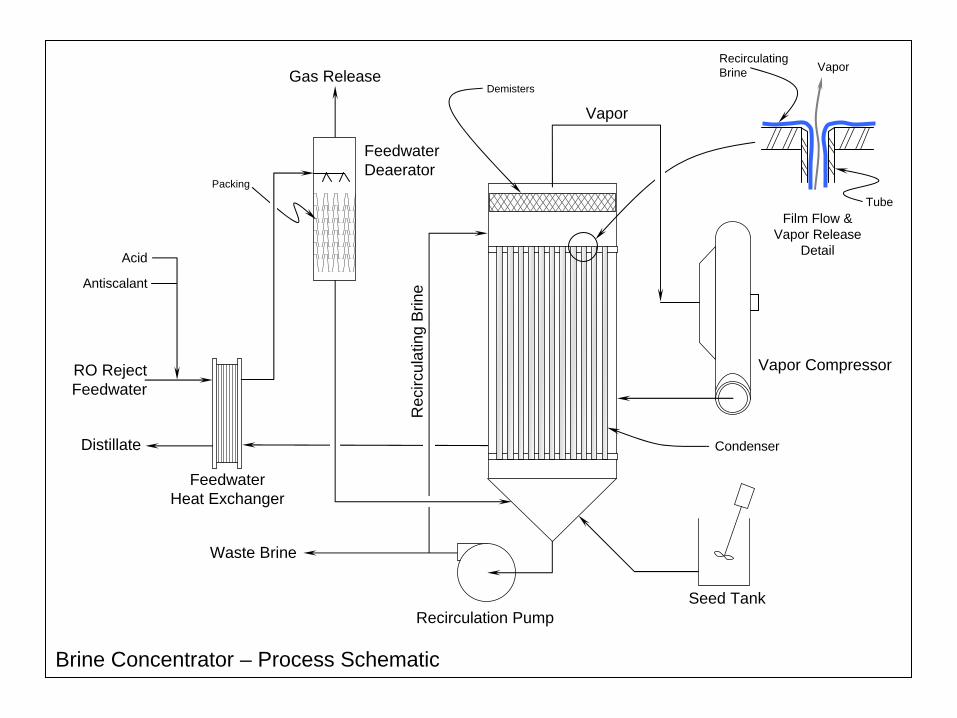
Recirculation PumpSeed Tank
FeedwaterDeaerator
FeedwaterHeat Exchanger
Waste Brine
Distillate
RO RejectFeedwater
Rec
ircul
atin
g B
rine
Vapor
Gas ReleaseDemisters
Packing
Vapor Compressor
Acid
Antiscalant
Vapor
Tube
RecirculatingBrine
Film Flow &Vapor Release
Detail
Brine Concentrator – Process Schematic
Condenser

Simplified Water BalanceSan Juan Generating Station
Cooling Towers(4 units)
Ash System(4 units)
ProcessWastewater
Ponds
BrineConcentrators (2)
Demins
FGDs(4 units)
Evaporation Ponds (75 acres)
Limestone Prep
Slurry Dewatering
San Juan River
Water Lostto Disposal
Water Lostto Disposal
Boiler Make-up
Brin
e
FGD Purge Water
Boiler Cleaning(occasional)
Recycle to Limestone Prep
Evap & Drift
Blowdown
Boiler Blowdown
Plant Drains
Distillate
Water Lossto Flue Gas
Steam Losses
Plant ServiceWater
Coal Pile Runoff(occasional)
Overflow(occasional)
Spe
nt R
egen

Treated Produced Water Reuse PointsSan Juan Generating Station
Cooling Towers(4 units)
Ash System(4 units)
ProcessWastewater
Ponds
BrineConcentrators (2)
Demins
FGDs(4 units)
Evaporation Ponds (75 acres)
Limestone Prep
Slurry Dewatering
San Juan River
Water Lostto Disposal
Water Lostto Disposal
Boiler Make-up
Brin
e
Boiler Cleaning(occasional)
Recycle to Limestone Prep
Evap & Drift
Blowdown
Boiler Blowdown
Plant Drains
Distillate
Water Lossto Flue Gas
Steam Losses
Plant ServiceWater
Coal Pile Runoff(occasional)
Overflow(occasional)
Spe
nt R
egen
ProducedWater
Treatment
Rer
oute
d FG
D P
urge
Wat
er
FGD Purge Water
Prod
uced
Wat
er
Trea
tmen
t Was
tew
ater
Wastewater toEvap Ponds

Economic Analysis2004 Basis

Collection 14-inch HERO + TotalCenter Pipeline BC 3 Project
Capacity, BPD 34,000 60,000 53,000Peak Conditions, BPD 30,670 44,710 48,130Equipment & Installation $5,200,000 $12,900,000 $11,800,000 $29,900,000Contingency 15% $780,000 $1,940,000 $1,770,000 $4,490,000NMGRT (1) 6.125% $320,000 $790,000 $720,000 $1,830,000PNM G&A (2) 5.5% $290,000 $710,000 $650,000 $1,650,000Total Project $6,590,000 $16,340,000 $14,940,000 $37,870,000
Notes…..1. NMGRT is the New Mexico Gross Receipts Tax.2. G&A is a "general and admistrative" charge applied to all PNM projects.
Capital Costs Incurred by PNMCapital Costs Incurred by PNM

Total Project Capital Costs BR Gathering system to Collection Center $5,000,000Dugan Inject into pipeline $100,000Richardson Inject into pipeline $100,000PNM Collection Center, pipeline & treatment $37,900,000Total Project $43,100,000
Notes..... 1. Installation costs for Dugan and Richardson are most likely high.
Infrastructure Costs Incurred by PNM & Oil Producers

PNM Operating CostsPNM - Produced Water Project - SJGS
$5.0
$5.5
$6.0
$6.5
$7.0
2005 2010 2015 2020 2025 2030
Mill
ions
Project Year
Esca
late
d A
nnua
l Op
Cos
t
Water Recovery Cases90% – Case 580% – Case 470% – Case 3
Scenario 36% Declination
Likely Recovery Range

Annual Tax CreditPNM - Produced Water Project - SJGS
$0.0
$0.5
$1.0
$1.5
$2.0
$2.5
2005 2010 2015 2020 2025 2030
Mill
ions
Project Year
Ann
ual T
ax C
redi
t
Likely Recovery Range
Water Recovery Cases90% – Case 580% – Case 470% – Case 3
Scenario 36% Declination
PNM was planning to qualify for a State of New Mexico for a tax credit of $1,000/AF for water- savings infrastructure. The tax credit would have an annual limit and life-time cap.....

Total Annual Project RevenuePNM - Produced Water Project - SJGS
$0
$2
$4
$6
$8
$10
$12
2005 2010 2015 2020 2025 2030
Mill
ions
Project Year
Esca
late
d A
nnua
l Rev
enue
Water Recovery Cases90% – Case 580% – Case 470% – Case 3
Scenario 36% Declination
Likely Recovery Range
Revenue to PNM would be generated by reducing producer disposal costs.....
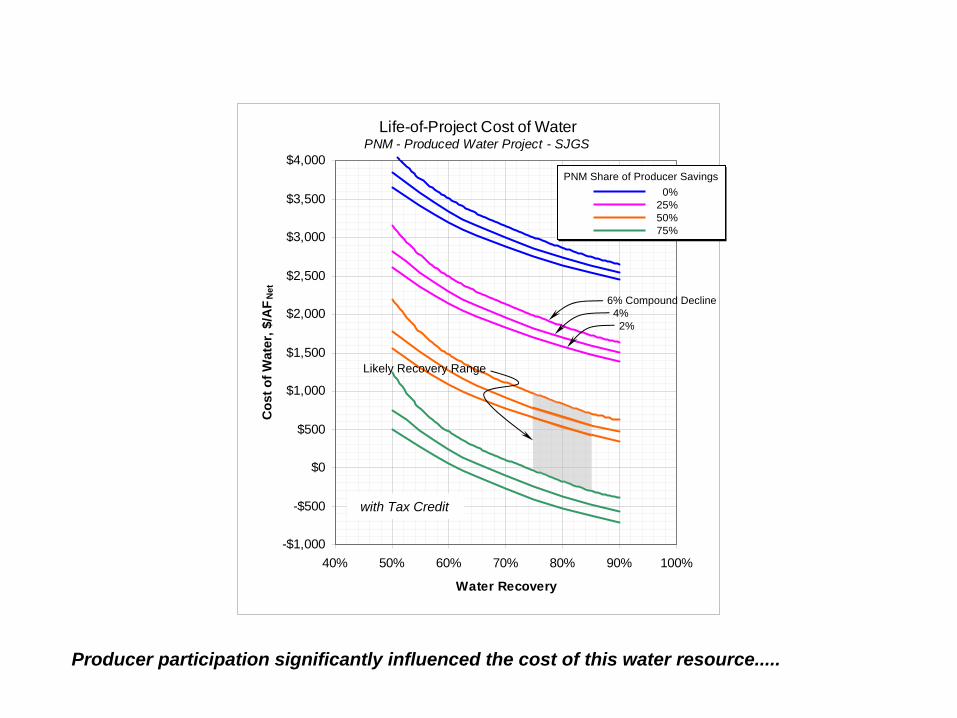
Life-of-Project Cost of WaterPNM - Produced Water Project - SJGS
-$1,000
-$500
$0
$500
$1,000
$1,500
$2,000
$2,500
$3,000
$3,500
$4,000
40% 50% 60% 70% 80% 90% 100%
Water Recovery
Cos
t of W
ater
, $/A
FN
et
PNM Share of Producer Savings0%
25%50%75%
6% Compound Decline4%
2%
Likely Recovery Range
with Tax Credit
Producer participation significantly influenced the cost of this water resource.....

Project Economics.....
Produced water project economics are based on capital and operating costs as well as a revenue stream. PNM’s operating costs include treatment chemicals, power, labor, materials, maintenance and capital recovery costs.Revenue streams offset PNM operating costs.The first revenue stream would be a tax credit of $1,000/AF provided by the State of New Mexico (the tax credit would have an annual limit and life-time cap). The second revenue stream would be a share of the oil-producer savings derived from reduced disposal of produced water and deferred costs of injection wells.Depending on the revenue scenario, the 20-year, life-of-project costs would vary as follows:
50-50 Share of producers savingswith the New Mexico tax credit
$720 to $970/AF ($125 to $150/AF)* $1.3 to $1.7 million/year
50-50 Share of producers savingswithout the tax credit
$1,200 to $1,500/AF ($160 to $200/AF) $2.0 to $2.6 million/year
No revenue streams $2,500 to $3,000/AF ($260 to $330/AF) $4.3 to $5.1 million/year
*Blended water costs – San Juan River @ $75/AF plus treated produced water.

PNM Project Benefits…..
Conserve river water for other beneficial uses in New Mexico.Enable the San Juan Generating Station to be more drought resistant.Avoid costly fuel-delivery penalties and power purchase costs.
Oil & Gas Producer Benefits.....
Reduce the volume of produced water that must be handled and injected.Establish an infrastructure to minimize produced water injection in the San Juan Basin.Establish area-wide opportunities to reduce produced water handling and injection costs.


