Product as a Service: Enabling Physical Products as Service End-Points Completed Research Paper Runhua Xu ETH Zurich Department of Management, Technology and Economics, Weinbergstrasse 56/58, 8092, Zurich, Switzerland, [email protected]Alexander Ilic University of St. Gallen Institute of Technology Management, Dufourstrasse 40a, 9000 St. Gallen, Switzerland [email protected]Abstract Manufacturers of consumer goods are trying to establish a direct link to consumers and to strengthen their competitive position by offering additional services. Even for simple services like a free warranty extension, manufacturers often rely on old-fashioned mail- in coupons and have to encourage consumers to reach out to them over inefficient channels. We suspect that the transaction costs for initiating such relationships are prohibitively high and limit the potential. Therefore, we conducted a survey among 1012 consumers to determine the current and desired level of product-related service consumptions. Our findings suggest an increase of 22% in intention to use if search cost were reduced. In a second step, we quantify the potential of reducing search cost by developing and evaluating a mobile IS for services. The results show a potential of effort reduction by factor 11 and identify opportunities for enabling an increase in product- related service consumption with information systems. Keywords: Post-purchase service, mobile IS, product service, search cost Thirty Fifth International Conference on Information Systems, Auckland 2014 1
Transcript
Product as a Service: Enabling Physical Products as Service End-Points
Completed Research Paper
Runhua Xu ETH Zurich
Department of Management, Technology and Economics,
Manufacturers of consumer goods are trying to establish a direct link to consumers and to strengthen their competitive position by offering additional services. Even for simple services like a free warranty extension, manufacturers often rely on old-fashioned mail-in coupons and have to encourage consumers to reach out to them over inefficient channels. We suspect that the transaction costs for initiating such relationships are prohibitively high and limit the potential. Therefore, we conducted a survey among 1012 consumers to determine the current and desired level of product-related service consumptions. Our findings suggest an increase of 22% in intention to use if search cost were reduced. In a second step, we quantify the potential of reducing search cost by developing and evaluating a mobile IS for services. The results show a potential of effort reduction by factor 11 and identify opportunities for enabling an increase in product-related service consumption with information systems.
Keywords: Post-purchase service, mobile IS, product service, search cost
Thirty Fifth International Conference on Information Systems, Auckland 2014 1
Service Science and IS
Introduction
Because traditional goods-dominant (G-D) logic has its inherent shortcomings in explaining value exchange, Vargo and Lusch (2004, 2007, 2008) proposed a new service-dominant (S-D) paradigm that is now widely accepted by researchers to understand markets. According to the new paradigm, value is not created by companies and embedded in goods during manufacturing process. Instead, companies only make value propositions and consumers derive the value by using products (Prahalad and Ramaswamy 2000, 2004a, 2004b). Consequently, in addition to selling goods, companies should also base their strategies on services as a business logic and provide consumers with additional resources to help consumers actualize the value potential of the offerings (Grönroos 2007, 2008a, 2008b).
Meanwhile in the business community, after realizing that in most markets products become similar and the room for product differentiation is limited (Joseph Pine and Gilmore 1999), some machine manufacturing companies have changed from G-D business models that aim to maximize the number of products sold to S-D business models that make money by being paid by services offered (Tukker 2013). Take IBM for example, the previous hardware-manufacturing giant is now mainly a global service provider and software company. More than half of the company’s $90 billion revenue in 2006 came from its service business (Chesbrough 2007; IfM and IBM 2008). Other leading-edge manufacturing companies such as General Electric, Toyota Industries and ABB have increasingly shifted their strategic focus from selling goods to providing services to serve consumers in new ways (Gebauer and Friedli 2005; Mathieu 2001; Oliva and Kallenberg 2003; Saarijärvi et al. 2014).
Most of the above-mentioned manufacturers sell services in the B2B environment, where manufacturers are able to interact with customers in a contractual relationship and often can therefore bundle products directly with services (Stremersch and Frambach 2001). Bundled services are typically sold in the form of maintenance contracts (Oliva and Kallenberg 2003) that contain several support mechanisms and service level agreements. Due to the contractual setting, information like contact details, product usage and service requirement of each customer are accessible to a manufacturer, which enables the manufacturer to proactively interact with customers and lowers customer acquisition costs (Oliva and Kallenberg 2003). While more and more companies in the B2B setting achieve the implementation of a successful service strategy, this contractual setting is not easily applicable to the B2C environment (Day 2006; Saarijärvi et al. 2013). Products are often of less value and consumers are, except for phones, not used to engaging in a contractual post-purchase relation when buying a product at a retailer (Marceau 2002). Some manufacturers try to overcome this problem by producing more intelligent products represent as an integrated product-service bundle. However, intelligent products are more expensive, which makes the concept not applicable to a wide range of goods. Consequently, consumers have to find product-related services on their own for the majority of products they buy every day. We believe that with advancing mobile IS, it becomes possible for manufacturers to tap into this huge opportunity of loosely coupled services.
In this study, we want to address the challenge for a manufacturer to engage consumers into product-related services in a non-contractual post-purchase setting. Advanced information technology makes it easier and cheaper for manufacturers to provide services online, therefore, consumers do not need to go to companies or physical stores to receive services (Taherdoost et al. 2014). Nevertheless, even if a product that requires for service is physically in front of consumers, it is still impossible for them to interact with it and order services for it directly. For consumers, it represents a two-fold search/match problem. In most of the cases, consumers have to open a Web browser, type in some key words on search engines, and then try to find out a Web page that provides the service they need. Despite often having the product right in front of them, consumers still need to spend time for an additional search that is typically concerned with finding the correct product number. Thus, service search cost (defined as the cost for a consumer to initiate a service transaction) remains high at the moment. For online services, it typically consists of the number of mouse clicks and the time elapsed for finding out a service. According to the Technology Acceptance Model (Davis 1989; Venkatesh and Davis 2000), high search cost could decrease perceived ease-of-use and consequently lower people’s intention of using product services.
With the proliferation of mobile IS and increasing interconnectivity and interactivity, services can be created, delivered, and experienced in new ways (Heeks 2010) regardless of time and place (Klabjan and Pei 2011; Varnali and Toker 2010). Our work is thus motivated to leverage mobile IS to help manufacturers enable physical products as service end-points, thereby reducing consumers’ service search cost. Our
2 Thirty Fifth International Conference on Information Systems, Auckland 2014
Product as a Service
proposed approach comprises a novel mobile, product-aware assistants (MPA). An MPA is a mobile IS that reduces the search cost for product-related services by identifying a product uniquely with different means (such as a QR code) and matching the product identifier with a list of available services. Consumers can access product-related services directly from physical products. While QR codes have been used so far for marketing purposes, the purposes in scope of the MPA is that manufacturers deliberately use these identifiers as hooks for consumers to interact on service relationships.
Therefore, the objective of our work is to quantify the impact of service search cost on people’s intention of using different product-related services and to find out a solution to help consumers reduce actual search cost. Our work comprises two main contributions. First, we conducted an extensive census representative study and showed that a MPA had the potential to increase people’s intention of using service. Second, we proposed a lightweight proof-of-concept implementation of a MPA and in a user study, quantified its potential for reducing search cost compared to current alternatives.
Related Work
Research in Mobile Services Enabled by Scanning QR Codes
Mobile services can be defined as “content and transaction services that are accessed and/or delivered via a mobile handheld device (PDA, mobile, cellular or phone, GPS, etc.) based on the interaction/transaction between an organization and a customer (Gummerus and Pihlström 2011)”. Because mobile devices provide ubiquitous and universal access to information as well as opportunity for providing highly personalized experiences, mobile services are increasingly important to companies (Kleijnen et al. 2007; Lee et al. 2012; Nysveen and Thorbjernsen 2005). As indicated by Scornavacca and Barnes (2006), companies have opportunities to link products with individual consumers to provide personalized services, by leveraging mobile applications with barcode solutions. As product information (e.g. model, serial number, URL) can be encoded in the QR code and consumer information (e.g. email address, age, gender) can be saved in mobile applications, by scanning a QR code with a smartphone, it is possible to connect consumers with different products, as well as product services.
According to Liu et al. (2007), QR code technology has many advantages over other technologies, including a large storage capacity, high information density, strong encoding, high reliability, low cost and ease of implementation. Regarding user acceptance, scanning a QR code to interact with a physical product outperforms other approaches that are available at the moment. Rukzio et al. (2006) surveyed 134 consumers to compare their preference over different mobile interaction approaches, namely touching RFID or NFC tags, scanning QR Codes and communicating over Bluetooth. They revealed that scanning QR codes was the best-perceived approach among all the other approaches. In addition, scanning QR codes is getting popular and better accepted. Comscore (2012) found that the number of European smartphone users scanning QR codes increased by 96% in 2011 to 17.4 million users in July 2012. The study reported that 71.7% of all the users scanned QR codes to retrieve product information.
QR codes are used widely in different situations. Lorenzi et al (2014) proposed to integrate QR code systems and corresponding smartphone applications into existing government services to provide a new level of interactivity for the public. In one of their studies, by scanning a QR code on an existing signage in a national park, people can get helpful information like geospatial data, recommended itineraries and park warnings in a mobile app. The study revealed that by deploying the mobile service with QR codes, government systems could provide greater interactivity to the public in an effective and low cost way.
Several museums offer guiding services based on QR codes to allow tourists to browse exhibition contents on their own demand through mobile devices (Huang et al. 2010). In addition to providing supplemental information, video and audio resources in a simple way, QR codes make it easier to keep information up to date compared to installing printed texts. It is more cost efficient for museums because they do not need to invest in additional equipment as visitors get all the information through their own devices. The solution is also perceived as more convenient by visitors (Bard and Markus 2012).
Many libraries use QR codes to present additional book information (e.g. link to the author Website, book reviews), to provide library guiding service and to facilitate book searching (Schultz 2013; Wilson 2012). Some libraries place QR codes on study room doors to provide easy access to room reservation service; others use QR codes to receive user feedbacks through online survey (Ashford 2010). Similar examples exist
Thirty Fifth International Conference on Information Systems, Auckland 2014 3
Service Science and IS
widely in other use cases like mobile payment, mobile ticketing, mobile couponing and mobile learning (Liu et al. 2007; Scornavacca and Barnes 2006).
Research in Providing Product-Related Services
Oliva and Kallenberg (2003) conducted an inter-disciplinary study with 11 German machine manufacturers that offered services for their products to understand how manufacturers could successfully sell product-related services. Instead of giving away initial services (e.g. installation, commissioning) after selling a product, they suggested manufacturers to generate close relationship with customers and provide services along a product’s lifecycle to help customers improve continuously the utilization and effectiveness of a product. Such services (e.g. preventive maintenance, spare parts management and condition monitoring) were normally bundled with products in maintenance contracts, which enabled manufacturers to contact directly with consumers to sell services (Marceau 2002; Oliva and Kallenberg 2003).
In a B2C setting, however, product and services are loosely bundled and contractual services are not commonly available. There are still several methods for manufacturers to provide product-related services directly to consumers. One such method would be to make products smart. A smart or intelligent product is “a product system that contains sensing, memory, data processing, reasoning and communication capabilities at various intelligence level (Kiritsis 2011)”. Such a product is able to get data about its environment, communicate to other smart devices, make decisions and react automatically to different conditions at any phase of its lifecycle. For example, if it captures an error event, it will report the problem to the manufacturer and call repair services directly. Manufacturers producing intelligent products can easily interact with their products and customers to sell additional services. Nevertheless, integrating products with services in the manufacturing process is costly (Marceau 2002). Therefore, most intelligent products are usually expensive and their installed base is still limited at the moment.
Second, some B2C manufacturers require consumers to use personal information to bundle products with services and use them as an integrated solution. For new Internet of Things (IoT) products like the Nest smoke-alarm and the Hue light-bulb (Notra et al. 2014), each consumer has to input personal information (e.g. email address, household size, location) to first register a product with the manufacturer before using product functions and services. The bundle of service registration to each product is made mandatory. Consequently, those manufacturers are able to know each individual customer in detail. Proactively reaching customers to sell additional services becomes uncomplicated for them.
However, a wider range of products like consumer goods are not intelligent enough and they are not closely bundled with services during selling processes. Instead of providing services proactively, most manufacturers have to wait until being reached by consumers. Some manufacturers provide product services over the Internet to help consumers easily find them (Hassan et al. 2011). For example, Samsung and Lenovo provide Web portals to offer services like product registration and warranty extension. Compared to traditional service provision, consumers do not need to go to companies or physical stores to receive services (Taherdoost et al. 2014), which delivers significant benefits to consumers and service providers (Taherdoost et al. 2012). Nevertheless, it takes additional time and effort for consumers to manually find the correct Web portal for each service provision. Consumers have to make decisions about defining search key words, checking relevance and judging authenticity during the whole process.
For some specific use cases, some manufacturers have started to attach QR codes to their non-intelligent products to help customers directly access product-related services. HP attaches QR codes to packages of some products to enable consumers to easily verify the authenticity of its products. SHIPSU attaches QR codes to maritime products to help consumers reorder same products quickly. However, most QR codes nowadays are still used for marketing purpose or product inventory management instead of enabling manufacturers to proactively support product-service mapping along a product’s lifetime. To the best of our knowledge, no research has evaluated the user acceptance of such a service provision solution for non-intelligent products and to what extend it is able to reduce service search cost. In addition, no research has revealed what product services were perceived more useful from consumers’ perspective. Our work is thus motivated to address the research gaps.
4 Thirty Fifth International Conference on Information Systems, Auckland 2014
Product as a Service
Research Questions and Methodology
Research Questions
Nowadays consuming product-related services still requires high search cost. Even for simple services like getting an online product manual, consumers need to go to the manufacturer’s homepage, find out the product Web page and look for its manual. According to the Technology Acceptance Model, high search cost could decrease perceived ease-of-use and consequently lower people’s intention of using product services. To better understand the effect, we try to quantify the impact of service search cost on people’s intention of using services. Therefore, our first research question is:
RQ1a: How would the reduction of service search cost impact consumers’ intention of service usage related to physical products?
According to Edvardsson et al (2005) and Saarijärvi et al (2014), services differ from each other and from product to product; thus, research focus should be placed on exploring and comparing different services to help companies foster a more holistic understanding. Consequently, we also try to answer:
RQ1b: How would consumers’ intention of using service differ between product services if search cost were reduced?
RQ1c: How would consumers’ intention of using service differ between product categories if search cost were reduced?
If consumers’ intention of using product services increases significantly compared to their current service consumption due to the reduced search cost, we want to understand to what extent we can reduce search cost with our proposed MPA over the current state of the art. Thus, we try to answer:
RQ2: How would the MPA impact service search cost compared to existing IS?
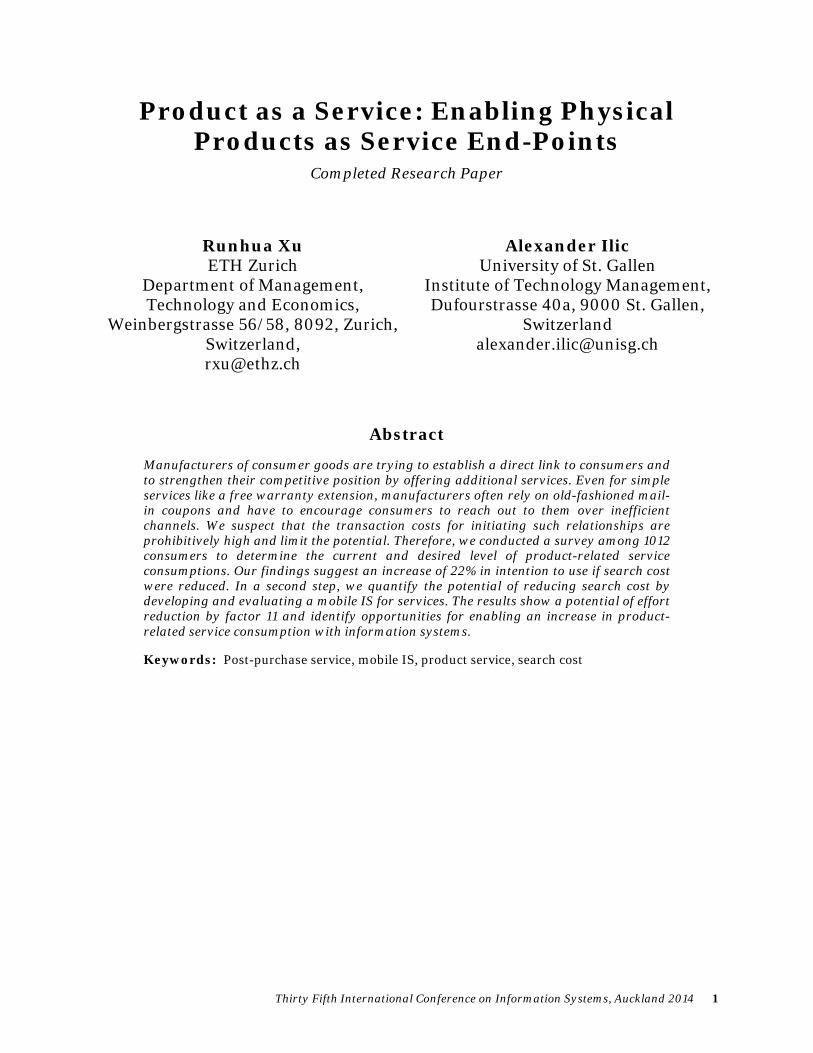
Figure 1 shows the research framework. RQ1 (1a, 1b and 1c) asks how people’s intention of using product services will change if search cost can be reduced. RQ2 asks how different information systems that are able to link product with services will impact search cost. To answer RQ1, we will conduct an online-based panel study (Study 1) to explore the product-related service domain across service types, product categories and industries. To answer RQ2, we will conduct a lab-based user study (Study 2) to evaluate the order of magnitude of the MPA in reducing search cost. Our future research tries to study a potential intention-behavioral gap.
Figure 1. Research Framework
Research Methodology
Design of Study 1
Figure 2 shows the design overview of Study 1. First, we conduct an exploratory pre-study with industry partners to determine service types and product categories. We ask them to itemize product-related services that they are providing and/or will provide to consumers for their products. After consolidating the results,
Thirty Fifth International Conference on Information Systems, Auckland 2014 5
Service Science and IS
we categorize the selected services and group them into three phases according to the product post-sales lifecycle proposed by Oliva and Kallenberg (2003) and Cao and Folan (2012): services directly after purchase (SP1), services during the use (SP2), and services at the end of use (SP3). We focus on post-purchase services in the study because they are more important for retrieving values embedded in products along a product’s lifecycle, according to the S-D logic (Vargo and Lusch 2008).
Figure 2. Design Overview of Study 1
Afterwards, questionnaire will be distributed to consumers and consumers rate their usage of each service in the past (without a MPA) as well as their intention of using the same service if search cost were reduced due to the presence of a MPA. In addition, respondents also rate different approaches of interacting with a physical product. As the proposed solution is a mobile IS that leverages smartphones and mobile Internet to link products with services, we thus target people with an affinity for mobile Internet instead of general public as relevant users. Consequently, only respondents who use advanced features (e.g. mobile email, applications, Internet) of smartphones at least once a week will be included in the data analysis. After filtering out invalid responses, we analyze the data to draw a conclusion. As a respondent rates each service repeatedly in two scenarios (with and without a MPA), the paired t-test is used to compare mean ratings if the differences between two paired ratings of the same service are normally distributed. Otherwise, Wilcoxon signed ranks test is used to compare mean values (Field 2009). Regarding the different product interaction methods, repeated ANOVA is used to compare mean values.
Design of Study 2
If the result of Study 1 shows that reducing service search cost can significantly improve consumers’ intention of using product-related services, we will then develop a prototype of a MPA and measure its actual contribution of reducing search cost compared to current IS solutions in Study 2. The idea of a MPA is as follows. A manufacturer creates a landing Web page for a product, in which all product-related services the manufacturer prefers to offer are demonstrated. By encoding the URL of the landing page into a QR code and attaching the code to the product, the manufacturer enables the product as a service end-point. From consumers’ perspective, they can access all product services by simply scanning the QR code with the MPA and being redirected to the landing page. Search cost is thus equal to scanning the QR code and pressing a button that represents the service a consumer intends to use.
After developing the prototype, we conduct a user study to measure actual service search cost of using the current most widely used IS and the MPA prototype in four scenarios. The number of clicks and time elapsed for completing each task is logged for comparison. The ‘current most widely used IS’ is defined as searching for services online with a laptop because 1) compared to offline solutions, online information searching has gained more visibility in recent years (Maity et al. 2014) and 2) it is widely undertaken by users (Pauwels et al. 2011). 3) Although mobile devices are ubiquitous and belong to each individual, laptops are more suitable for searching and typing information (Bao et al. 2011). Thus, the measured result of searching services with laptops represents the best result we are able to achieve at the moment; we thus use it as a baseline for performance comparison.
In the end of the study, participants are asked to evaluate the perceived user experience and usability of both approaches in an AttrakDiff questionnaire (Hassenzahl and Monk 2010) that consists of 28 bipolar verbal anchors rated on a 7-point scale. AttrakDiff evaluates an interactive system from four aspects: perceived pragmatic quality (PQ) that measures the support of achieving a goal, hedonic quality – stimulation (HQ-S) that measures perceived novelty and potential to attract a user’s attention, hedonic quality – identification (HQ-I) that measures potential of identification with a system, as well as perceived overall attractiveness (ATT). Moreover, participants also give qualitative feedbacks on the MPA prototype.
6 Thirty Fifth International Conference on Information Systems, Auckland 2014
Product as a Service
Similar to the data analysis method used in Study 1, the measured search cost and ratings of the AttrakDiff questionnaire is analyzed with paired t-test or Wilcoxon signed ranks test depend on the distribution of the differences between each paired mean values. Regarding the qualitative feedbacks, content analysis method (Krippendorff 2012) is applied.
Study 1: Potential Improvement on Consumers’ Intention of Using Services due to Reduced Search Cost
Questionnaire Design
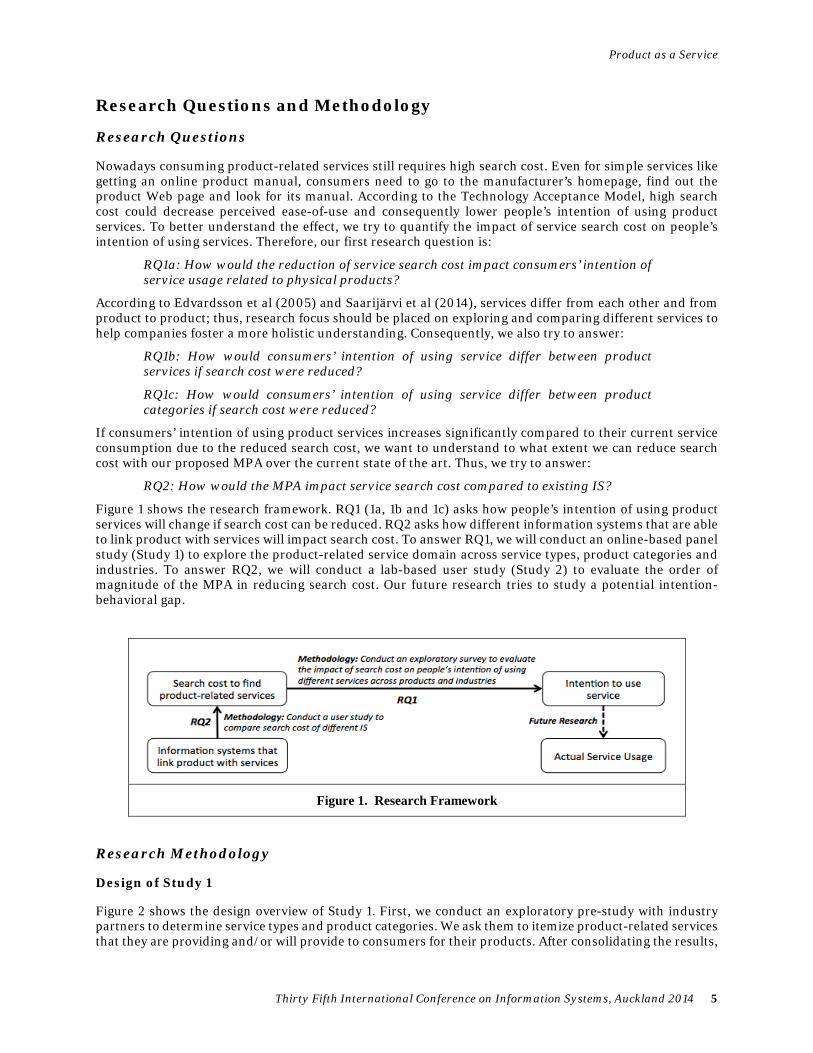
Based on an exploratory pre-study with 25 industry partners that produce different products like sport articles, electronic devices, music instruments and fashion products, we selected 27 product services (as shown in Table 1) and designed a questionnaire that consisted of three parts with 15 questions in total.
Table 1. List of Services Selected in the Post-Purchase Stage
Product Usage Phase Service Name Service Description Direct after purchase (SP1)
Manage Invoice Manage invoice or other proofs of purchase
Manage Documents Manage product manuals and other documents
Register Products Register products with manufacturers
Add to Inventory Add a product to an inventory for management
Add Personal Info Attach name, address, phone number to products
Check Authenticity Verify whether a product is authentic or not
Extend Warranty Extend the length of warranty for a product
During the use (SP2) Recommend Products Recommend products on social media
Remind Update Remind software update or scheduled services
Show New Models Demonstrate follow-up models if available
Notify Recall Notify when a product is being recalled
Show Accessories List accessories that can improve product usage
Show Handbooks Show handbooks digitally to provide information
Show Parts Show spare parts or equipment belong to a product
Ask for Help Ask for help from others who also own the product
Show Repair Resources List service providers for repairing a product
Protect from Lost A service that protects products from lost
Protect from Theft A service that protects products from theft
Lend for Free Lend out products to others for free
Lend for Remuneration Lend out products to others for remuneration
Become a Trial User Register as a trial user for new products
Add Notes Add notes (e.g. tips, configuration info) to products
In the end of use (SP3)
Show Current Value Show the actual product value for reselling
Resell Products Resell products through online platforms
Hand over for Free Hand over products to other people for free
Dispose Properly Dispose products properly after using them
Thirty Fifth International Conference on Information Systems, Auckland 2014 7
Service Science and IS
The first part of the questionnaire asked respondents about demographics such as age, gender, income and frequency of mobile Internet usage. In the second part, respondents were asked to rate each service in SP1, SP2 and SP3 for 1) how frequently they had used the service in the past 12 months, and 2) how frequently they would use the same service if a MPA were available to reduce service search cost. A MPA was described in text on an abstract level: instead of showing screen-snaps of a MPA, we described it as a mobile app that could help consumers easily and quickly access different product-related services. The rating was based on a 7-point Likert scale where one stood for the lowest frequency and seven represented the highest frequency. Furthermore, respondents were asked to select maximum eight most relevant product categories for all the services in each phase. In the last part, respondents were asked to rate three different approaches of interacting with physical products. The approaches are: scanning a QR code, scanning a wireless tag (e.g. RFID, NFC label), and communicating over Bluetooth. These three approaches were chosen on the one hand because previous research (Rukzio et al. 2006) defined them as the most widely used approaches in interacting with a product on mobile devices. On the other hand, they were also recommended by the industry partners in the pre-study. Scanning the barcode of a product was also one of the most widely used approaches of interacting with products at the moment. However, it is not easy to directly encode a URL into current barcodes. To transform a barcode to a product URL, specific barcode scanning apps are required to attach a prefix to each barcode. Therefore, this approach was excluded in the study. The rating was based on a 7-point Likert scale where one stood for the least preferred and seven represented the most preferred.
Participants
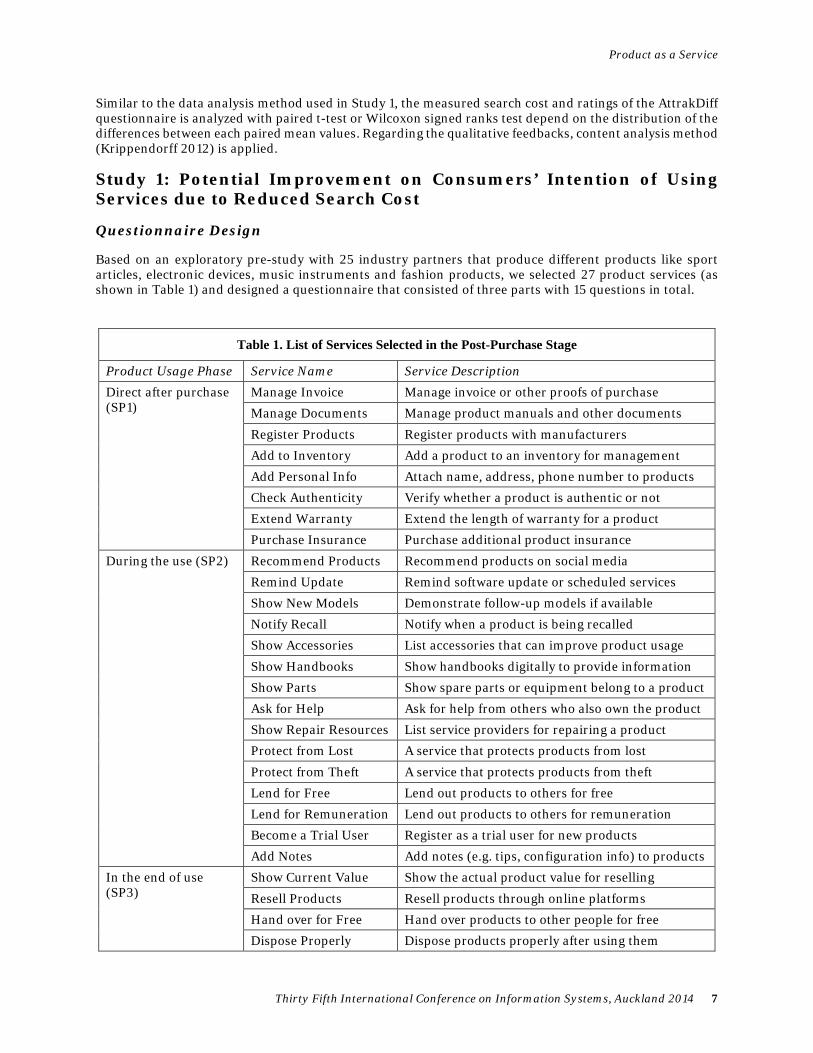
Study 1 was conducted from January 22nd to January 27th, 2014. An online survey recruiting company helps to recruit participants and distributes the questionnaire to them through its online platform. It sent invitations to 1177 people in Germany and 1012 of them participated in the study. The actual incidence rate was 85.98%. Each participant spent on average eight minutes in finishing a questionnaire. Our final data set consisted 991 respondents and their characteristics are shown in Table 2.
Table 2. Characteristics of Respondents in Study 1
Respondents Range N % Age 18-25 148 14.9
26-35 197 19.9
36-45 272 27.5
46-55 250 25.2
56-65 124 12.5
Total 991 100.0 Gender Female 513 51.8
Male 478 48.2
Total 991 100.0 Net Income (EUR per month)
> 4000 83 8.4
3000-3999 127 12.8
2000-2999 242 24.4
1000-1999 271 27.3
500-999 114 11.5
< 500 59 6.0
No Answer 95 9.6
Total 991 100.0
8 Thirty Fifth International Conference on Information Systems, Auckland 2014
Product as a Service
Impact of Search Cost
Figure 2 shows respondents’ ratings for all the services in SP1. There are two boxplots for each service: the left one represents users’ frequency of using a service in the past 12 months, whereas the right one shows the potential frequency of using the same service with a MPA that helps to reduce search cost in the future. The bottom and top of each box are the first and third quartiles, and the horizontal bolt line in the middle represents the median rating. The error bars above and under each box stand for the maximum and minimum ratings. The number, which is shown in percentage in the parenthesis at the bottom of each service name, indicates how much the mean value of a service rating would increase when a MPA were present. Take ‘Add Personal Info’ for example: With a MPA to reduce search cost, people’s potential frequency of using this service will be on average 40% higher than their current usage of the same service. Furthermore, a sign right to each percentage number indicates whether the difference between the two ratings for a service is statistically significant or not.
N=991, Sig. (2-tailed): ns - not significant, p>.05; * significant at p<.05; ** significant at p<.005; *** significant at p<.001
Figure 2. Comparison of Service Ratings with and without a Product Assistant in SP1
In the past 12 months, the average rating of all the services in SP1 (without a MPA) is 3.27 (SD=1.89). With a MPA in place to reduce search cost, the average rating will increase around 25% to 4.09 (SD=1.83). In both scenarios (with and without a MPA), ‘Manage Invoice’ and ‘Manage Documents’ are the most frequent actions direct after people purchase goods, while ‘Purchase Insurance’ and ‘Extend Warranty’ are the least frequently used services. The highest increase in SP1 occurs on ‘Check Authenticity’ with 52%, followed by ‘Add Personal Info’ with 40%.
N=991, Sig. (2-tailed): ns - not significant, p>.05; * significant at p<.05; ** significant at p<.005; *** significant at p<.001
Figure 3. Comparison of Service Ratings with and without a Product Assistant in SP2
Similarly, Figure 3 presents the ratings for all the services in SP2. When a MPA were present, the average rating of all the services would increase from 3.18 (SD=1.67) to 3.71 (SD=1.71). The respondents rate ‘Remind Update’ (M=4.22) and ‘Become a Trial User’ (M=4.18) as the most frequently used service in the future. Conversely, ‘Lend for Remuneration’ remains the lowest rated service regardless of whether a MPA
Thirty Fifth International Conference on Information Systems, Auckland 2014 9
Service Science and IS
was in place or not. However, it is the largest improved service (60%) among services in all the three phases when search cost is reduced. The services ‘Become a Trial User’, ‘Protect from Theft’ and ‘Protect from Lost’ would have both high ratings and large increases if a MPA were present. Surprisingly, the ratings of ‘Lend for Free’ and ‘Recommend Products’ decrease by 1% and 2% respectively. However, the difference is not statistically significant, which means reducing search cost will have no impact on these two services.
N=991, Sig. (2-tailed): ns - not significant, p>.05; * significant at p<.05; ** significant at p<.005; *** significant at p<.001
Figure 4. Comparison of Service Ratings with and without a Product Assistant in SP3
Figure 4 illustrates the service ratings in SP3. In the past 12 months, the average rating of all services is 3.31 (SD=1.62). If search cost were reduced, the average rating of all the four services would increase by around 24% to 4.10 (SD= 1.66). Interestingly, when a MPA does not exist, people choose to hand over a product for free (M=3.25) rather than reselling it (M=3.17) if the product is no longer needed. Nevertheless, when a MPA helps to reduce search cost for evaluating a product’s value and reselling the product, people will conversely prefer reselling the product (M=4.25) as opposed to giving it away for free (M=3.62). Therefore, combing ‘Show Current Value’ and ‘Resell Products’ may have a potential to become a useful service in the future.
Overall, all the selected services would on average experience a 22% improvement (SD=17%) on potential frequency of use when service search cost were reduced. Thus, RQ1a is addressed.
Categorizing Services
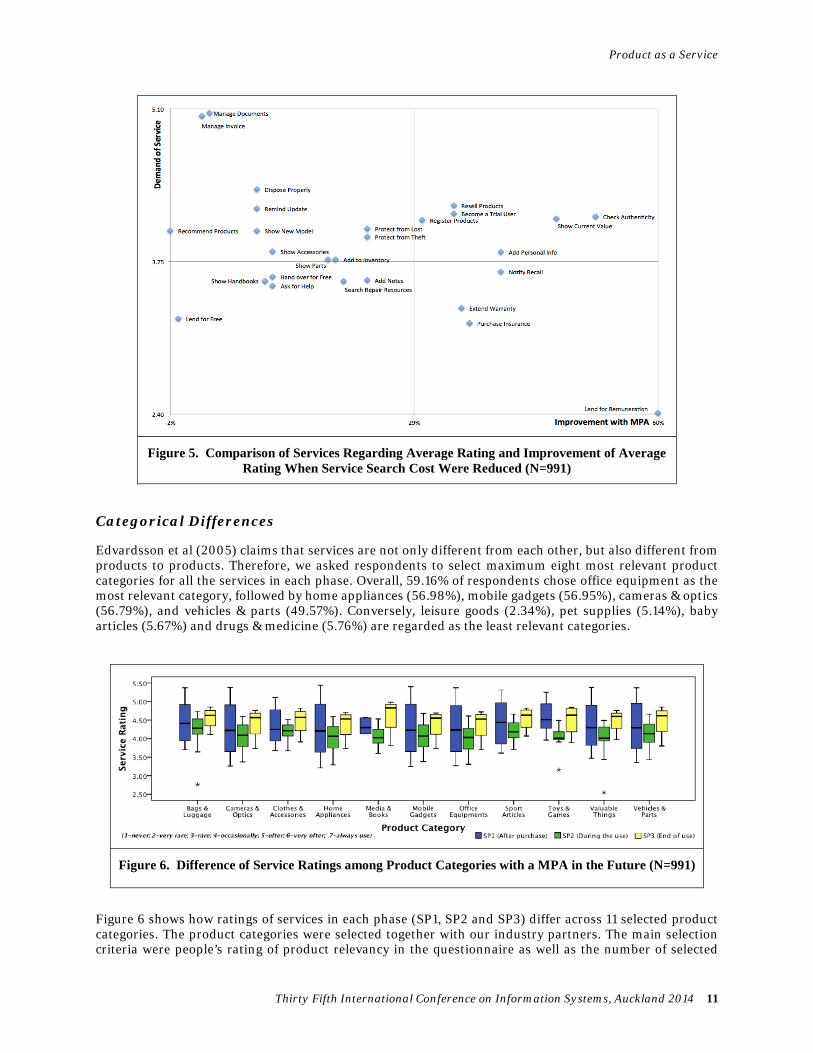
As demonstrated in Figure 5, all services are loaded in a 2×2 matrix based on their rating improvements and average ratings when a MPA were in place. Services at the top-right corner, like ‘Check Authenticity’, ‘Become a Trial User’ and ‘Resell Products’, are the ones that have high ratings and show large increases. People’s willingness to obtain such services (indicated by a high rating) and the current absence of support to facilitate the access to these services (indicated by a large increase) might make a service in this quadrant potentially useful in the future. Services at the top-left corner, like ‘Manage Documents’, ‘Remind Update’ and ‘Show New Model’, are the ones that have high ratings but show low increases. This indicates that although the potential increase is low, it would be good for manufacturers to support the use of services in this quadrant because nowadays consumers already use them frequently.
Services at the bottom-right corner are the ones that have low ratings but show large increases. At the moment, the perceived uptake of services in this quadrant is low; but it is still interesting to keep an eye on these services because of their potential large improvements. For instance, as revealed by Byers et al (2013) and Sundararajan (2013), sharing economics is getting more attention in empowering individuals, companies, organizations and governments to distribute, share and reuse the value of goods and services. Once a large and reliable platform that allows people to share products is in place, the service ‘Lend for Remuneration’ might move from bottom-right corner towards top-right corner and then becomes a useful and widely accepted service. Finally, services at the bottom-left corner are of less interest because both the perceived frequency of use and the potential improvement are lower compared to services in the other three quadrants. If a manufacturer can only provide limited number of services, services in this quadrant should get low priority. Therefore, RQ1b is answered.
10 Thirty Fifth International Conference on Information Systems, Auckland 2014
Product as a Service
Figure 5. Comparison of Services Regarding Average Rating and Improvement of Average Rating When Service Search Cost Were Reduced (N=991)
Categorical Differences
Edvardsson et al (2005) claims that services are not only different from each other, but also different from products to products. Therefore, we asked respondents to select maximum eight most relevant product categories for all the services in each phase. Overall, 59.16% of respondents chose office equipment as the most relevant category, followed by home appliances (56.98%), mobile gadgets (56.95%), cameras & optics (56.79%), and vehicles & parts (49.57%). Conversely, leisure goods (2.34%), pet supplies (5.14%), baby articles (5.67%) and drugs & medicine (5.76%) are regarded as the least relevant categories.
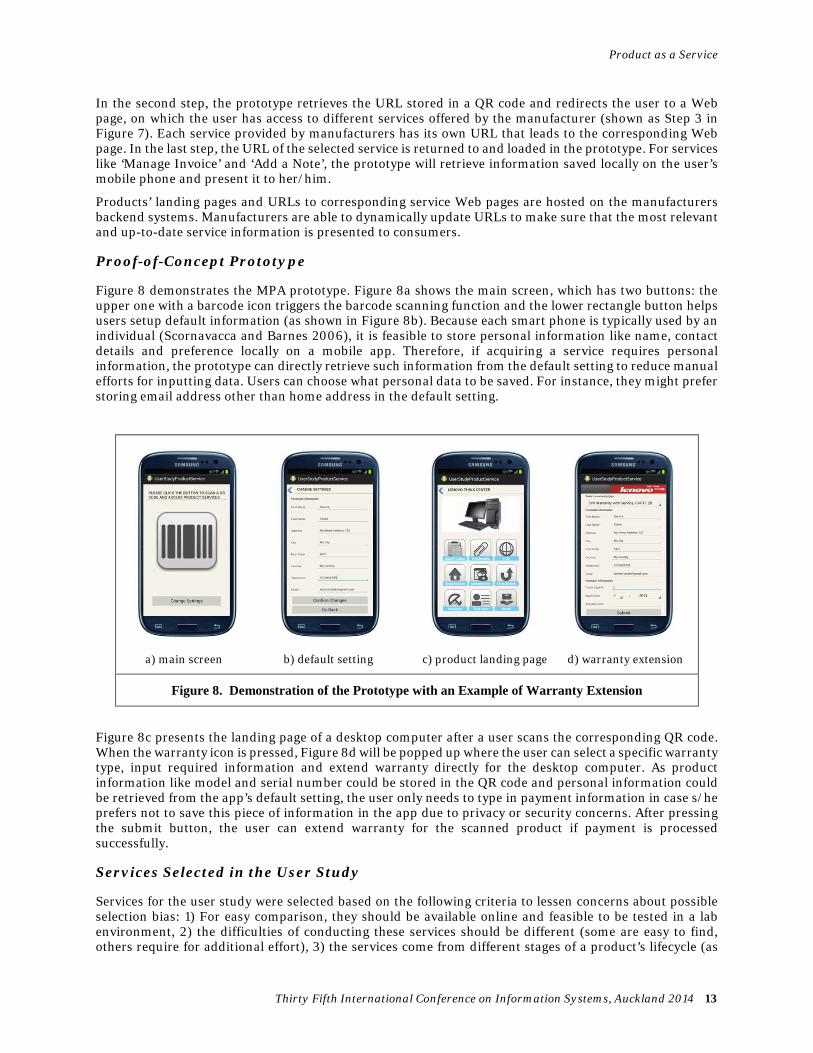
Figure 6. Difference of Service Ratings among Product Categories with a MPA in the Future (N=991)
Figure 6 shows how ratings of services in each phase (SP1, SP2 and SP3) differ across 11 selected product categories. The product categories were selected together with our industry partners. The main selection criteria were people’s rating of product relevancy in the questionnaire as well as the number of selected
Thirty Fifth International Conference on Information Systems, Auckland 2014 11
Service Science and IS
services that could be used for a product category. There are three boxplots representing the ratings of all services in SP1, SP2 and SP3 for each product category. The horizontal bolt line in the middle represents the average rating of the median service in each phase, and the bottom and top of each box are the first and third quartiles. The error bars above and under each box stand for the highest and lowest rated service in each phase. The figure demonstrates that for the same product category, services in each phase differ significantly [F(1.80, 17.98) = 127.87, p<.001]. The differences between each pair of two phases are all statistically significant (p<.01). Take toys & games for example, services in SP2 are rated more than 12% lower than services in SP1 and SP3. In addition to mean difference, the variance of services in SP1 is 40% higher than that of services in SP2 and SP3 because some services in SP1 (e.g. manage invoice and documents) are already widely used while others (e.g. purchase insurance, extend warranty) are seldom used at the moment. Furthermore, services in the same phase also differ significantly from category to category. For instance, services in SP3 are rated 7.85% higher for bags & luggage than for office equipment [t(14) = 7.79, p<.001, r=.90]. The results show that people’s intention of using services can differ significantly among product categories. RQ1c is thus addressed.
Evaluation of Product Interaction Approaches
In the questionnaire, respondents were asked to rate three approaches that are available on smartphones to interact with a physical product. The result shows that interacting with a product through scanning a QR code has a mean rating at 4.48, through a wireless tag (e.g. NFC, RFID) has a mean rating at 4.11, and through Bluetooth communication has a mean rating at 3.94. It also shows that respondents’ rating was significantly affected by the type of interaction approach, F(1.66, 1640.09) = 64.52, p<.001. The differences between each pair of two approaches are all statistically significant. Therefore, in addition to previous research, result from our questionnaire confirms again that consumers prefer to interact with products by scanning QR codes.
Study 2: Search Cost Reduction Potential due to Properly Designed IS
After understanding that reducing search cost has a potential to increase use of services, we developed a prototype for a MPA to quantify the potential reduction in search cost. The prototype was then evaluated and compared with currently available IS in a user study.
Design of the System
Figure 7 explains the design and information flow of the system. Four main steps are involved when a user wants to access product services through the prototype. First, the user scans the QR code attached to a physical product with the prototype. If a manufacturer intends to provide product services to consumers, an easy solution will be that the manufacturer prints a QR code on the body of each product. Nowadays, manufacturers already print information like serial number, ingredients, attention notice and/or 1-D barcode on their products. Technically, it is feasible to implement the solution. The URL of a product’s landing Web page is encoded in the QR code. Additional information such as product model and serial number could also be encoded, which makes it possible to identify each individual product and to provide highly personalized services.
Figure 7. Design and Information Flow of the System
12 Thirty Fifth International Conference on Information Systems, Auckland 2014
Product as a Service
In the second step, the prototype retrieves the URL stored in a QR code and redirects the user to a Web page, on which the user has access to different services offered by the manufacturer (shown as Step 3 in Figure 7). Each service provided by manufacturers has its own URL that leads to the corresponding Web page. In the last step, the URL of the selected service is returned to and loaded in the prototype. For services like ‘Manage Invoice’ and ‘Add a Note’, the prototype will retrieve information saved locally on the user’s mobile phone and present it to her/him.
Products’ landing pages and URLs to corresponding service Web pages are hosted on the manufacturers backend systems. Manufacturers are able to dynamically update URLs to make sure that the most relevant and up-to-date service information is presented to consumers.
Proof-of-Concept Prototype
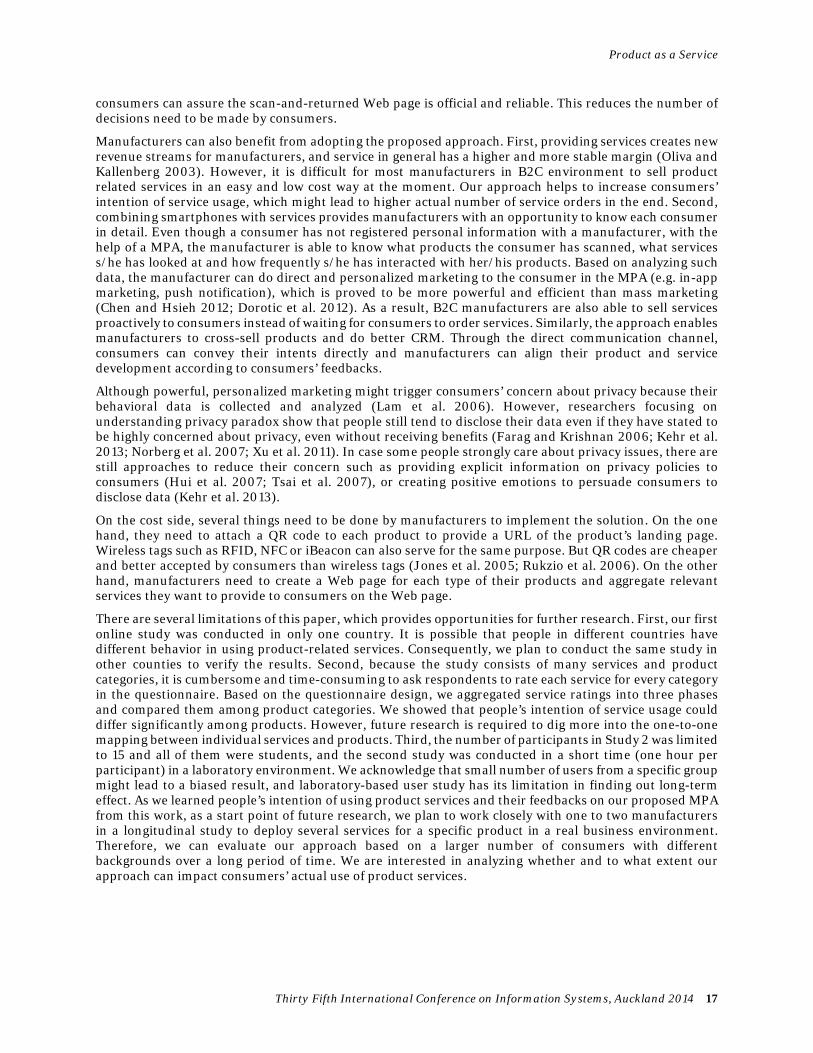
Figure 8 demonstrates the MPA prototype. Figure 8a shows the main screen, which has two buttons: the upper one with a barcode icon triggers the barcode scanning function and the lower rectangle button helps users setup default information (as shown in Figure 8b). Because each smart phone is typically used by an individual (Scornavacca and Barnes 2006), it is feasible to store personal information like name, contact details and preference locally on a mobile app. Therefore, if acquiring a service requires personal information, the prototype can directly retrieve such information from the default setting to reduce manual efforts for inputting data. Users can choose what personal data to be saved. For instance, they might prefer storing email address other than home address in the default setting.
a) main screen b) default setting c) product landing page d) warranty extension
Figure 8. Demonstration of the Prototype with an Example of Warranty Extension
Figure 8c presents the landing page of a desktop computer after a user scans the corresponding QR code. When the warranty icon is pressed, Figure 8d will be popped up where the user can select a specific warranty type, input required information and extend warranty directly for the desktop computer. As product information like model and serial number could be stored in the QR code and personal information could be retrieved from the app’s default setting, the user only needs to type in payment information in case s/he prefers not to save this piece of information in the app due to privacy or security concerns. After pressing the submit button, the user can extend warranty for the scanned product if payment is processed successfully.
Services Selected in the User Study
Services for the user study were selected based on the following criteria to lessen concerns about possible selection bias: 1) For easy comparison, they should be available online and feasible to be tested in a lab environment, 2) the difficulties of conducting these services should be different (some are easy to find, others require for additional effort), 3) the services come from different stages of a product’s lifecycle (as
Thirty Fifth International Conference on Information Systems, Auckland 2014 13
Service Science and IS
defined as SP1, SP2 and SP3 in the paper) and 4) they are located in different quadrants in Figure 5. Moreover, the most relevant product categories as identified in Study 1 were combined with the selected services. As a result, the following four scenarios were used:
• Extend warranty for a desktop computer: It is a two-step action. First, participants need to search for the official Web page to extend warranty for a desktop computer. Second, they need to type in information (product serial number, personal information, payment information) required by the manufacturer to purchase the warranty. Dummy data for both personal and payment information was provided in the scenario. After inputting all the required information, the task would be considered as completed.
• Find out the online manual of a digital camera: Participants were asked to find out the digital version of the manual. When the manual was being loaded, the task was considered as completed to reduce influence of Internet connection quality on our result.
• Check out new models of a road bike: Participants were asked to find out a list of all new models of an old road bike in this scenario. Information could be found both through search engines and on the manufacturer’s official Website.
• Resell a smartphone on an online platform: It is a two-step action. First, participants need to figure out the correct model and storage capacity of the smartphone. Afterwards, they were asked to resell it on a specific online platform. For participants who were not familiar with the platform, we guided them through all the required steps for reselling a product.
Figure 9. The Set of Products Used in the Tasks Together with Users Completing the Tasks
The user study was conducted in three steps. First, we introduced the goal of the study, demonstrated the prototype and let participants play with the prototype to become acquainted with it. Second, participants were asked to search for four specific product services online in four different scenarios. The introduction of each scenario was read from a script. After confirming that they understood a scenario and its task, participants began to search for the service with the above-mentioned two approaches. Each participant had to experience both approaches in a randomized order so as to reduce possible biasing effects of the task order on our dependent measures. Both the task completion time and the number of clicks were logged to measure service search cost. We mentioned to participants that we were comparing different approaches other than evaluating their abilities to avoid biasing them into rushing through the tasks under time pressure. Figure 9 shows pictures taken when participants were searching for services.
Evaluation of Results
Participants
A total of 15 people participated in this user study, 5 of which were female. Their ages ranged from 18 to 35 years. Fourteen of them used advanced features (e.g. mobile email, app, Internet) of their smartphones many times a day and one of them used such features once a day. All of them were students from different
14 Thirty Fifth International Conference on Information Systems, Auckland 2014
Product as a Service
universities in Switzerland. Each session took around an hour and each participant got a voucher worth 20 Swiss Franc as compensation. The study was conducted from April 3rd, 2014 to April 9th, 2014.
Quantitative Analysis of Service Search Cost
Table 3 compares the search time, the number of clicks and information input time required by both approaches in searching for product services. Except for the number of clicks in Task 2, test result shows that acquiring a service with the mobile IS requires significantly less search time, search effort and information input time than that with a laptop, and all of them represent a large effect (as r > 0.5). Overall, the total service search time with our mobile IS is 11 times less than that with current IS. Similarly, the total number of clicks is four times less. This answers RQ2.
Table 3. Comparison between Two Approaches on Service Search Cost (N=15)
With laptop With MPA Effect
size (r) Sig. (2-tailed) M SD M SD
Task 1 Service search time (s) 150.2 101.5 7.0 1.8 .62 .001
Information input time (s) 104.9 25.6 44.3 8.1 .62 .001
Task complete time (s) 263.9 58.9 63.5 9.7 .97 < .001
# Clicks 10.5 3.2 2.1 0.3 .62 .001
Task 2 Service search time (s) 22.8 5.6 13.1 2.6 .85 < .001
# Clicks 2.6 0.7 2.2 0.6 .41 .111
Task 3 Service search time (s) 122.2 61.2 13.2 5.1 .87 < .001
# Clicks 8.5 3.7 2.0 0.0 .88 < .001
Task 4 Model check time (s) 150.7 104.8 0.0 0.0 .83 < .001
Service search time (s) 200.7 92.2 11.8 2.7 .91 < .001
# Clicks 11.4 4.3 2.1 0.3 .92 < .001
All tasks Total complete time (s) 609.5 145.0 101.6 13.3 .97 < .001
Total search time (s) 495.9 183.0 45.1 7.1 .93 < .001
Total # Clicks 33.1 6.8 8.3 0.7 .96 < .001
Regarding mistakes and errors made during the search, in the ‘with laptop’ approach, participants had loaded on average 6.7 Web pages (SD = 1.5) until they found the correct page to extend warranty for the desktop computer in Task 1. Two participants made typos in inputting the product serial number. In Task 3, they clicked on average 1.7 wrong pages (SD = 1.9) before reaching the official Web site. In Task 4, three of them received hints from the experimenter because they had no clue how to check the capacity of a smartphone although they themselves were smartphone users. Two participants resold the smartphone with a wrong model in the end. In the ‘with MPA’ approach, two and three participants encountered problems in scanning QR code in Task 2 and Task 3, respectively. They either scanned the codes too far or too close. One participant clicked ‘Help’ and ‘Specs’ service before clicking the ‘Handbook’ button in Task 2. In Task 4, one participant clicked another service button by mistake. Overall, participants made fewer mistakes and errors with the MPA prototype than with a laptop.
Quantitative Analysis of the AttrakDiff Questionnaire
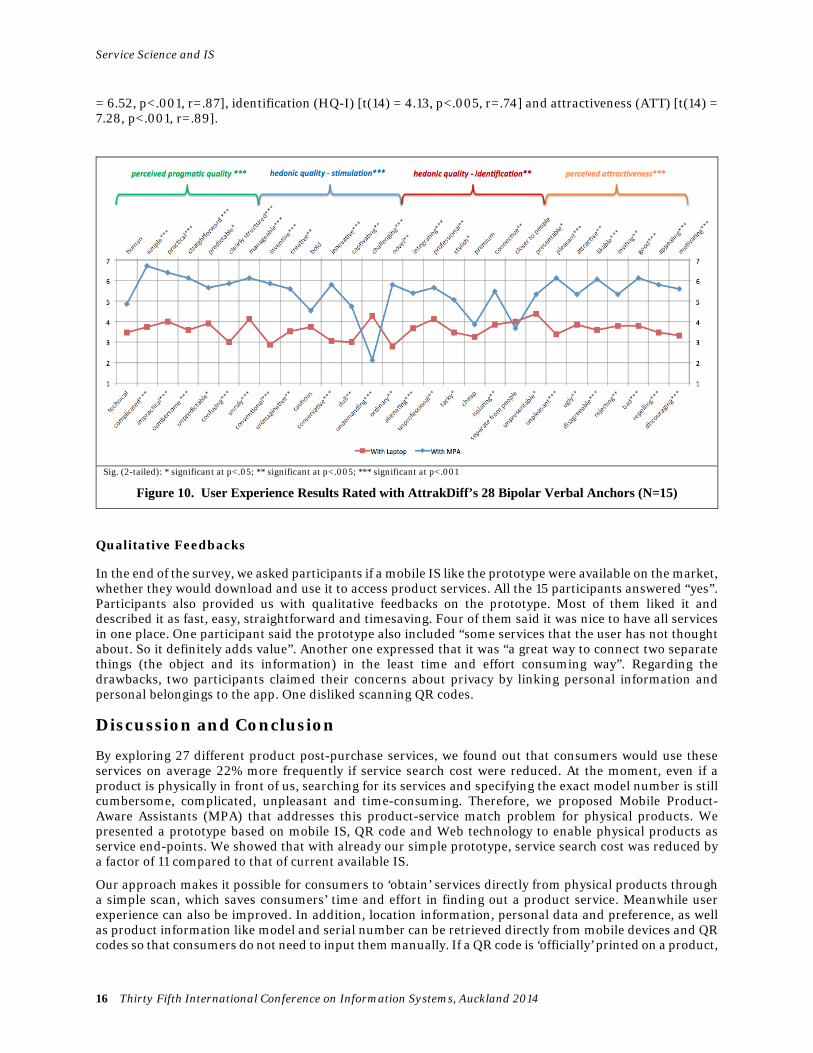
The per-item ratings of the two approaches on the AttrakDiff scales are shown in Figure 10. The ‘with MPA’ approach was ranked significantly higher than the ‘with laptop’ approach on most of the scales. It also has significant higher perceived pragmatic quality (PQ) [t(14) = 7.52, p<.001, r=.90], stimulation (HQ-S) [t(14)
Thirty Fifth International Conference on Information Systems, Auckland 2014 15
Sig. (2-tailed): * significant at p<.05; ** significant at p<.005; *** significant at p<.001
Figure 10. User Experience Results Rated with AttrakDiff’s 28 Bipolar Verbal Anchors (N=15)
Qualitative Feedbacks
In the end of the survey, we asked participants if a mobile IS like the prototype were available on the market, whether they would download and use it to access product services. All the 15 participants answered “yes”. Participants also provided us with qualitative feedbacks on the prototype. Most of them liked it and described it as fast, easy, straightforward and timesaving. Four of them said it was nice to have all services in one place. One participant said the prototype also included “some services that the user has not thought about. So it definitely adds value”. Another one expressed that it was “a great way to connect two separate things (the object and its information) in the least time and effort consuming way”. Regarding the drawbacks, two participants claimed their concerns about privacy by linking personal information and personal belongings to the app. One disliked scanning QR codes.
Discussion and Conclusion
By exploring 27 different product post-purchase services, we found out that consumers would use these services on average 22% more frequently if service search cost were reduced. At the moment, even if a product is physically in front of us, searching for its services and specifying the exact model number is still cumbersome, complicated, unpleasant and time-consuming. Therefore, we proposed Mobile Product-Aware Assistants (MPA) that addresses this product-service match problem for physical products. We presented a prototype based on mobile IS, QR code and Web technology to enable physical products as service end-points. We showed that with already our simple prototype, service search cost was reduced by a factor of 11 compared to that of current available IS.
Our approach makes it possible for consumers to ‘obtain’ services directly from physical products through a simple scan, which saves consumers’ time and effort in finding out a product service. Meanwhile user experience can also be improved. In addition, location information, personal data and preference, as well as product information like model and serial number can be retrieved directly from mobile devices and QR codes so that consumers do not need to input them manually. If a QR code is ‘officially’ printed on a product,
16 Thirty Fifth International Conference on Information Systems, Auckland 2014
Product as a Service
consumers can assure the scan-and-returned Web page is official and reliable. This reduces the number of decisions need to be made by consumers.
Manufacturers can also benefit from adopting the proposed approach. First, providing services creates new revenue streams for manufacturers, and service in general has a higher and more stable margin (Oliva and Kallenberg 2003). However, it is difficult for most manufacturers in B2C environment to sell product related services in an easy and low cost way at the moment. Our approach helps to increase consumers’ intention of service usage, which might lead to higher actual number of service orders in the end. Second, combining smartphones with services provides manufacturers with an opportunity to know each consumer in detail. Even though a consumer has not registered personal information with a manufacturer, with the help of a MPA, the manufacturer is able to know what products the consumer has scanned, what services s/he has looked at and how frequently s/he has interacted with her/his products. Based on analyzing such data, the manufacturer can do direct and personalized marketing to the consumer in the MPA (e.g. in-app marketing, push notification), which is proved to be more powerful and efficient than mass marketing (Chen and Hsieh 2012; Dorotic et al. 2012). As a result, B2C manufacturers are also able to sell services proactively to consumers instead of waiting for consumers to order services. Similarly, the approach enables manufacturers to cross-sell products and do better CRM. Through the direct communication channel, consumers can convey their intents directly and manufacturers can align their product and service development according to consumers’ feedbacks.
Although powerful, personalized marketing might trigger consumers’ concern about privacy because their behavioral data is collected and analyzed (Lam et al. 2006). However, researchers focusing on understanding privacy paradox show that people still tend to disclose their data even if they have stated to be highly concerned about privacy, even without receiving benefits (Farag and Krishnan 2006; Kehr et al. 2013; Norberg et al. 2007; Xu et al. 2011). In case some people strongly care about privacy issues, there are still approaches to reduce their concern such as providing explicit information on privacy policies to consumers (Hui et al. 2007; Tsai et al. 2007), or creating positive emotions to persuade consumers to disclose data (Kehr et al. 2013).
On the cost side, several things need to be done by manufacturers to implement the solution. On the one hand, they need to attach a QR code to each product to provide a URL of the product’s landing page. Wireless tags such as RFID, NFC or iBeacon can also serve for the same purpose. But QR codes are cheaper and better accepted by consumers than wireless tags (Jones et al. 2005; Rukzio et al. 2006). On the other hand, manufacturers need to create a Web page for each type of their products and aggregate relevant services they want to provide to consumers on the Web page.
There are several limitations of this paper, which provides opportunities for further research. First, our first online study was conducted in only one country. It is possible that people in different countries have different behavior in using product-related services. Consequently, we plan to conduct the same study in other counties to verify the results. Second, because the study consists of many services and product categories, it is cumbersome and time-consuming to ask respondents to rate each service for every category in the questionnaire. Based on the questionnaire design, we aggregated service ratings into three phases and compared them among product categories. We showed that people’s intention of service usage could differ significantly among products. However, future research is required to dig more into the one-to-one mapping between individual services and products. Third, the number of participants in Study 2 was limited to 15 and all of them were students, and the second study was conducted in a short time (one hour per participant) in a laboratory environment. We acknowledge that small number of users from a specific group might lead to a biased result, and laboratory-based user study has its limitation in finding out long-term effect. As we learned people’s intention of using product services and their feedbacks on our proposed MPA from this work, as a start point of future research, we plan to work closely with one to two manufacturers in a longitudinal study to deploy several services for a specific product in a real business environment. Therefore, we can evaluate our approach based on a larger number of consumers with different backgrounds over a long period of time. We are interested in analyzing whether and to what extent our approach can impact consumers’ actual use of product services.
Thirty Fifth International Conference on Information Systems, Auckland 2014 17
Service Science and IS
References
Ashford, R. 2010. “QR Codes and Academic Libraries,” College & Research Library News, (71:10), pp. 526–530.
Bao, P., Pierce, J., Whittaker, S., and Zhai, S. 2011. “Smart Phone Use by Non-Mobile Business Users,” in Proceedings of the 13th International Conference on Human Computer Interaction with Mobile Devices and Services, Stockholm, Sweden.
Bard, E., and Markus, Z. L. 2012. “Extending the GUIDE@HAND Tourist Guide Application with QR Codes for Museum Learning,” Digital Presentation and Preservation of Cultural and Scientific Heritage (Digital Presentation and Preservation of Cultural and Scientific Heritage) (2), pp. 19–26.
Byers, J. W., Zervas, G., and Proserpio, D. 2013. “The Rise of the Sharing Economy: Estimating the Impact of Airbnb on the Hotel Industry,” No. 2013-16.
Cao, H., and Folan, P. 2012. “Product Life Cycle: the Evolution of a Paradigm and Literature Review from 1950–2009,” Production Planning & Control (23:8), pp. 641–662.
Chen, P. T., and Hsieh, H. P. 2012. “Personalized Mobile Advertising: Its Key Attributes, Trends, and Social Impact,” Technological Forecasting and Social Change (79:3), Elsevier Inc., pp. 543–557.
Chesbrough, H. 2007. “Business Model Innovation: It’s Not Just about Technology Anymore,” Strategy & Leadership (35:6), pp. 12–17.
Comscore Report. 2012. “QR Code Usage among European Smartphone Owners Doubles Over Past Year”. Davis, F. D. 1989. “Perceived Usefulness, Perceived Ease of Use, and User Acceptance of Information
Technology,” MIS quarterly (13:3), pp. 319–340. Day, G. S. 2006. Achieving Advantage with a Service-Dominant Logic, The Service-Dominant Logic of
Marketing: Dialog, Debate and Directions, (R. F. Lusch and S. L. Vargo, eds.), M.E. Sharpe. Dorotic, M., Bijmolt, T. H. A., and Verhoef, P. C. 2012. “Loyalty Programmes: Current Knowledge and
Research Directions,” International Journal of Management Reviews (14:3), pp. 217–237. Edvardsson, B., Gustafsson, A., and Roos, I. 2005. “Service Portraits in Service Research: A Critical
Review,” International Journal of Service Industry Management (16:1), pp. 107–121. Farag, N., and Krishnan, M. S. 2006. “The Personalization Privacy Paradox: An Empirical Evaluation of
Information Transparency and the Willingness to Be Profiled Online for Personalization,” MIS Quarterly (30:1), pp. 13–28.
Field, A. 2009. Discovering Statistics Using SPSS, (Third Edit.), SAGE Publications Ltd. Gebauer, H., and Friedli, T. 2005. “Behavioral Implications of the Transition Process from Products to
Services,” Journal of Business & Industrial Marketing (20:2), pp. 70–78. Grönroos, C. 2007. “In Search of a New Logic for Marketing: Foundations of Contemporary Marketing
Theory,” John Wiley & Sons Incorporated. Grönroos, C. 2008a. “Service Logic Revisited: Who Creates Value? And Who Co-Creates?” European
Business Review (20:4), pp. 298–314. Grönroos, C. 2008b. “Adopting a Service Business Logic in Relational Business-to-Business Marketing:
Value Creation, Interaction and Joint Value Co-Creation,” in Proceedings of the Otago Forum 2, (Vol. 2) Dunedin, New Zealand.
Gummerus, J., and Pihlström, M. 2011. “Context and Mobile Services’ Value-in-Use,” Journal of Retailing and Consumer Services (18:6), pp. 521–533.
Hassan, H. S., Shehab, E., and Peppard, J. 2011. “Recent Advances in E-Service in the Public Sector: State-of-the-Art and Future Trends,” Business Process Management Journal (17:3), pp. 526–545.
Hassenzahl, M., and Monk, A. 2010. “The Inference of Perceived Usability from Beauty,” Human-Computer Interaction (25:3), pp. 235–260.
Heeks, R. 2010. “Development 2.0: The IT-Enabled Transformation of International Development,” Communications of the ACM (53:4), p. 22.
Huang, Y. P., Chang, Y. T., and Sandnes, F. E. 2010. “Ubiquitous Information Transfer across Different Platforms by QR Codes,” Journal of Mobile Multimedia (6), pp. 3–13.
Hui, K.-L., Teo, H.-H., and Lee, S. T. 2007. “The Value of Privacy Assurance: An Exploratory Field Experiment,” MIS Quarterly (31:1), pp. 19–33.
IfM, and IBM. 2008. “Succeeding through Service Innovation: A Service Perspective for Education, Research, Business and Government,” University of Cambridge Institute for Manufacturing (IfM), Cambridge.
18 Thirty Fifth International Conference on Information Systems, Auckland 2014
Product as a Service
Jones, P., Clarke-Hill, C., Hillier, D., and Comfort, D. 2005. “The Benefits, Challenges and Impacts of Radio Frequency Identification Technology (RFID) for Retailers in the UK,” Marketing Intelligence & Planning (23:4), pp. 395–402.
Joseph Pine, B., and Gilmore, J. H. 1999. The Experience Economy, Harvard Business School Press. Kehr, F., Wentzel, D., and Mayer, P. 2013. “Rethinking the Privacy Calculus: On the Role of Dispositional
Factors and Affect,” in The 34th International Conference on Information Systems, Milan, Italy, pp. 1–10.
Kiritsis, D. 2011. “Closed-Loop PLM for Intelligent Products in the Era of the Internet of Things,” Computer-Aided Design (43:5), Elsevier Ltd, pp. 479–501.
Klabjan, D., and Pei, J. 2011. “In-Store One-to-One Marketing,” Journal of Retailing and Consumer Services (18:1), pp. 64–73.
Kleijnen, M., de Ruyter, K., and Wetzels, M. 2007. “An Assessment of Value Creation in Mobile Service Delivery and the Moderating Role of Time Consciousness,” Journal of Retailing (83:1), pp. 33–46.
Krippendorff, K. 2012. Content Analysis: An Introduction to Its Methodology, SAGE Publications Ltd. Lam, S. K. T., Frankowski, D., and Riedl, J. 2006. “Do You Trust Your Recommendations? An Exploration
of Security and Privacy Issues in Recommender Systems,” in International Conference on Emerging Trends in Information and Communication Security, Freiburg, Germany.
Lee, S., Noh, M. J., and Kim, B. G. 2012. “An Integrated Adoption Model for Mobile Services,” International Journal of Mobile Communications (10:4), pp. 405–426.
Liu, T., Tan, T., and Chu, Y. 2007. “2D Barcode and Augmented Reality Supported English Learning System,” in the 6th IEEE/ACIS International Conference on Computer and Information Science, pp. 2–7.
Lorenzi, D., Vaidya, J., Chun, S., Shafiq, B., and Atluri, V. 2014. “Enhancing the Government Service Experience through QR Codes on Mobile Platforms,” Government Information Quarterly (31:1), pp. 6–16.
Maity, M., Dass, M., and Malhotra, N. K. 2014. “The Antecedents and Moderators of Offline Information Search: A Meta-Analysis,” Journal of Retailing New York University.
Marceau, J. 2002. “Selling Solutions: Product-Service Packages as Links between New and Old Economies,” in DRUID Summer Conference on Industrial Dynamics of the New and Old Economy–who Is Embracing Whom, Copenhagen.
Mathieu, V. 2001. “Service Strategies within the Manufacturing Sector: Benefits, Costs and Partnership,” International Journal of Service Industry Management (12:5), pp. 451–475.
Norberg, P. A., Horne, D. R., and Horne, D. A. 2007. “The Privacy Paradox: Personal Information Disclosure Intentions versus Behaviors,” Journal of Consumer Affairs (41:1), pp. 100–126.
Notra, S., Siddiqi, M., Gharakheili, H. H., Sivaraman, V., and Boreli, R. 2014. “An Experimental Study of Security and Privacy Risks with Emerging Household Appliances,” in International Workshop on Security and Privacy in Machine-to-Machine Communications, San Francisco, CA, USA.
Nysveen, H., and Thorbjernsen, H. 2005. “Intentions to Use Mobile Services: Antecedents and Cross-Service Comparisons,” Journal of the Academy of Marketing Science (33:3), pp. 330–346.
Oliva, R., and Kallenberg, R. 2003. “Managing the Transition from Products to Services,” International Journal of Service Industry Management (14:2), pp. 160–172.
Pauwels, K., Leeflang, P. S. H., Teerling, M. L., and Huizingh, K. R. E. 2011. “Does Online Information Drive Offline Revenues?,” Journal of Retailing (87:1)New York University, pp. 1–17.
Prahalad, C. K., and Ramaswamy, V. 2000. “Co-Opting Customer Competence,” Harvard Business Review (78:1), pp. 79–87.
Prahalad, C. K., and Ramaswamy, V. 2004a. “Co-Creating Unique Value with Customers,” Strategy & Leadership (32:3), pp. 79–87.
Prahalad, C. K., and Ramaswamy, V. 2004b. “Co-Creation Experiences: the Next Practice in Value Creation,” Journal of Interactive Marketing (18:3), pp. 5–14.
Rukzio, E., Leichtenstern, K., Callaghan, V., Holleis, P., Schmidt, A., and Chin, J. 2006. “An Experimental Comparison of Physical Mobile Interaction Techniques: Touching, Pointing and Scanning,” in The 8th International Conference on Ubiquitous Computing, pp. 87–104.
Saarijärvi, H., Kannan, P. K., and Kuusela, H. 2013. “Value Co-Creation: Theoretical Approaches and Practical Implications,” European Business Review (25:1), pp. 6–19.
Saarijärvi, H., Mitronen, L., and Yrjölä, M. 2014. “From Selling to Supporting – Leveraging Mobile Services in the Context of Food Retailing,” Journal of Retailing and Consumer Services (21:1), Elsevier, pp. 26–36.
Thirty Fifth International Conference on Information Systems, Auckland 2014 19
Service Science and IS
Schultz, M. K. 2013. “A Case Study on the Appropriateness of Using Quick Response (QR) Codes in Libraries and Museums,” Library & Information Science Research (35:3) Elsevier Inc., pp. 207–215.
Scornavacca, E., and Barnes, S. J. 2006. “Barcode Enabled M-Commerce: Strategic Implications and Business Models,” International Journal Mobile Communications (4:2), pp. 163–177.
Stremersch, S., and Frambach, R. T. 2001. “The Purchasing of Full-Service Contracts: Maintenance Market,” Industrial Marketing Management (30:1), pp. 1–12.
Sundararajan, A. 2013. “From Zipcar to the Sharing Economy,” Harvard Business Review (Retrieved 22 April 2014).
Taherdoost, H., Sahibuddin, S., and Jalaliyoon, N. 2012. “Estimation of Electronic Services Usage based on the Applications’ level of Digitalization and Co-Creation,” Archives Des Sciences.
Taherdoost, H., Sahibuddin, S., and Jalaliyoon, N. 2014. “Features’ Evaluation of Goods, Services and E-services; Electronic Service Characteristics Exploration,” Procedia Technology (12) Elsevier B.V., pp. 204–211.
Tsai, J., Egelman, S., Cranor, L., and Acquisti, A. 2007. “The Effect of Online Privacy Information on Purchasing Behavior: An Experimental Study,” Information Systems Research (22), pp. 254–268.
Tukker, A. 2013. “Product Services for a Resource-Efficient and Circular Economy – A Review,” Journal of Cleaner Production Elsevier Ltd.
Vargo, S. L., and Lusch, R. F. 2004. “Evolving to a New Dominant Logic,” Journal of Marketing (68:1), pp. 1–17.
Vargo, S. L., and Lusch, R. F. 2007. “Service-Dominant Logic: Continuing the Evolution,” Journal of the Academy of Marketing Science (36:1), pp. 1–10.
Vargo, S. L., and Lusch, R. F. 2008. “From Goods to Service(s): Divergences and Convergences of Logics,” Industrial Marketing Management (37:3), pp. 254–259.
Varnali, K., and Toker, A. 2010. “Mobile Marketing Research: The-State-of-the-Art,” International Journal of Information Management (30:2), pp. 144–151.
Venkatesh, V., and Davis, F. D. 2000. “A Theoretical Extension of the Technology Acceptance Model: Four Longitudinal Field Studies,” Management Science (46:2), pp. 186–204.
Wilson, A. 2012. “QR Codes in the Library: Are They Worth the Effort?” Journal of Access Services (9:3), pp. 101–110.
Xu, H., Luo, X. (Robert), Carroll, J. M., and Rosson, M. B. 2011. “The Personalization Privacy Paradox: An Exploratory Study of Decision Making Process for Location-Aware Marketing,” Decision Support Systems (51:1), pp. 42–52.
20 Thirty Fifth International Conference on Information Systems, Auckland 2014