ECMWF COPERNICUS REPORT Copernicus Climate Change Service Product User Guide and Specification Version 2.1 Issued by: BIRA-IASB / Michel Van Roozendael Date: 23/05/2018 Ref: C3S_312a_Lot4.2.9.2_201804_PUGS_v2.1 Official reference number service contract: 2016/C3S_312a_Lot4_BIRA-IASB/SC1
Transcript
ECMWF COPERNICUS REPORT
Copernicus Climate Change Service
Product User Guide and Specification
Version 2.1
Issued by: BIRA-IASB / Michel Van Roozendael
Date: 23/05/2018
Ref: C3S_312a_Lot4.2.9.2_201804_PUGS_v2.1
Official reference number service contract: 2016/C3S_312a_Lot4_BIRA-IASB/SC1
This document has been produced in the context of the Copernicus Climate Change Service (C3S). The activities leading to these results have been contracted by the European Centre for Medium-Range Weather Forecasts, operator of C3S on behalf of the European Union (Delegation Agreement signed on 11/11/2014). All information in this document is provided "as is" and no guarantee or warranty is given that the information is fit for any particular purpose. The user thereof uses the information at its sole risk and liability. For the avoidance of all doubts, the European Commission and the European Centre for Medium-Range Weather Forecasts has no liability in respect of this document, which is merely representing the authors view.
Copernicus Climate Change Service
C3S_312a_Lot4_BIRA-IASB_2016SC1 - Product User Guide and Specification Page 3 of 59
Contributors
BIRA-IASB M. Van Roozendael C. Lerot T. Danckaert A. Keppens D. Hubert J.-C. Lambert J.Vlietinck
LATMOS/UPMC A. Boynard C. Clerbaux
DLR D. Loyola K.-P. Heue M. Coldewey-Egbers
UiB N. Rahpoe K.-U. Eichmann M. Weber
KNMI R. van der A M. van Weele J. van Peet O. Tuinder M. Allaart
RAL B. Latter R. Siddans B. Kerridge
FMI V. Sofieva S. Tukiainen
Copernicus Climate Change Service
C3S_312a_Lot4_BIRA-IASB_2016SC1 - Product User Guide and Specification Page 4 of 59
History of modifications Version Date Description of modification Chapters / Sections
v0 22.2.2017 ECMWF PSUG template adapted for C3S_312a_Lot4 Whole document
v0.1 22.3.2017 Template reformatted according to ECMWF’s new rules Whole document
Lists of related documents, acronyms, products, tables added
Related documents; Acronyms; Scope; Tables
Table of contents outlined Table of contents
Info on UV-nadir ozone columns added Section 1; Appendix A
Various info from Ozone_cci reference documents integrated (formats, etc.)
Whole document
23.3.2017 General definitions; product descriptions; target requirements; specification
Whole document
24.3.2017 Access information. Specification. Section 5; Appendices A, B, C, D
v0.2 11.4.2017 Figures: sensors; data flow. Partners’ contact details. Target requirements. Uncertainty and stability specifications.
v0.4 26.4.2017 Contribution by DLR (L3 UV TC) added. Section 1; Appendix A
v0.5 27.4.2017 Contribution by FMI (limb profiles) added. Section 4; Appendix D
v0.6 28.4.2017 Contribution by LATMOS (TTC IASI) added. Corrections by FMI.
Sections 0; 5. Section 4.
v1 28.4.2017 General information. Scope of document. Executive summary.
v1.1 17.4.2018 Appendix E added. Appendix E
v1.2 23.4.2018 Contribution by DLR (L3 UV TC) added. Section 1; Appendix A
v1.3 24.4.2018 Contribution by LATMOS (TTC IASI) added. Sections 0; 4 ; 5 ; Appendix B.
v1.4 25.4.2018 Contribution by FMI (limb profiles) added. Section 4; Appendix D
v1.5 27.4.2018 General information. Figure 1, Table 1
v2 30.4.2018 General information.
Copernicus Climate Change Service
C3S_312a_Lot4_BIRA-IASB_2016SC1 - Product User Guide and Specification Page 5 of 59
Related documents
[RD-1] Van Roozendael, M. (ed.) and the C3S Ozone team, C3S Ozone Algorithm Theoretical Basis Document (ATBD), Version 1, C3S_312a_Lot4.2.9.1_201704_ATBD_v1, 2017, in preparation.
[RD-2] Van Roozendael, M. (ed.), M. van Weele and the C3S Ozone team, C3S Ozone Target Requirement Document (TRD), Version 1, C3S_312a_Lot4.1.1.1_v1, in preparation.
[RD-3] Wolfmüller, M. (ed.) and W. Som de Cerff, R. van der A, C. Lerot, D. Loyola, G. Miles, P.-F. Coheur, V. Sofieva, A. Laeng, N. Rahpoe, K. Walker, C. Roth and N. Kalb, Ozone_cci Phase-II System Specification Document (SSD), Issue 1, Revision 0, Ozone_cci_DLR_SS_01_00, 22 April 2015.
[RD-4] Wolfmüller, M. (ed.) and C. Lerot, D. Loyola, M. Coldewey-Egbers, K.-P. Heue, G. Miles, R. van der A, N. Rahpoe, V.Sofieva, A. Laeng, C. Roth, J. Urban, P.-F. Coheur, R. Astoreca, R. Hargreaves, V. Sofieva and M. Weber, Ozone_cci Phase-II System Verification Report (SVR), Issue 1, Revision 1, Ozone_cci_DLR_SVR_01, 30 October 2015.
[RD-5] van der A, R.J. (ed.) and the Ozone_cci science team, Ozone_cci Phase-II Product Specification Document (PSD), Issue 4, Revision 6, Ozone_cci_PSD_4.6, 12 November 2015.
[RD-6] Sofieva, V. (ed.) and R. van der A, M. Coldewey-Egbers, C. Lerot, D. Loyola, J. van Peet, R. Siddans, N. Rahpoe, K.-P. Heue and R. Astoreca, Ozone_cci Phase-II Product User Guide (PUG), Issue 1, Revision 1, Ozone_cci_PUG_01_01, 5 December 2015.
[RD-7] van Weele, M. and the Ozone_cci science team, Ozone_cci Phase-II User Requirement Document (URD), Version 3, Ozone_cci_URD_3.0, 12 April 2016.
[RD-8] Van Roozendael, M. (ed.) and M. Koukouli, A. Laeng, J.-C. Lambert, D. Loyola, R. Siddans, G. Miles, G. Stieler, J. Tamminen, R. van der A, M. Weber, E. Maillard, P. Coheur, C. Wespes, D. Degenstein, J. Urban, K. Walker and C. Lerot, Ozone_cci Phase-II Data Access Requirement Document (DARD), Issue 2, Revision 1, Ozone_cci_DARD_2.1, 25 May 2016.
[RD-9] Rahpoe, N., A. Laeng, G. Stiller, M. Weber (eds) and R. van der A, C. Adams, P. Bernath, T. von Clarmann, M. Coldewey-Egbers, D. Degenstein, A. Dudhia, R. Hargreaves, C. Lerot, D. Loyola, J. van Peet, V. Sofieva, J. Tamminen, J. Urban, M. Van Roozendael, T. Danckaert, R. Astoreca, K.-P. Heue, K. Walker and S. Tukiainen, Ozone_cci Phase-II Algorithm Theoretical Basis Document (ATBD), Version 1, Issue 3, Revision 0, Ozone_cci_ATBD_Phase2_V1_03_00, 30 May 2016.
[RD-10] Lambert, J.-C. (ed.) and D. Balis, A. Delcloo, F. Goutail, J. Granville, D. Hubert, A. Keppens, R. Kivi, M. Koukouli, J.-P. Pommereau, R. Stübi, T. Verhoelst, D. Loyola, R. Siddans, R. van der A, C. Clerbaux, A. Laeng, V. Sofieva and M. Weber, Ozone_cci Phase-II Product Validation and Intercomparison Report (PVIR), Issue 2, Revision 0, Ozone_cci_Phase-II_PVIR_2.0, 30 June 2016.
Copernicus Climate Change Service
C3S_312a_Lot4_BIRA-IASB_2016SC1 - Product User Guide and Specification Page 6 of 59
[RD-11] Dameris, M. (ed.) and P. Braesicke, M. Coldewey-Egbers and M. van Weele, Ozone_cci Phase-II Climate Assessment Report (CAR), 2nd draft, CAR_Ozone_CCI-phase-2_2draft, 30 June 2016.
[RD-12] Laeng, A. (ed.) and T. von Clarmann, G. Stiller, V. Sofieva, N. Rahpoe, D. Degenstein, K. Walker, D. Murtagh, J.-C. Lambert, T. Verhoelst, C. Lerot, C. Clerbaux, A. Boyard, K.-P. Heue, J. van Peet, R. Siddans, R. Astoreca and J. Hadji-Lazaro, Ozone_cci Phase-II Comprehensive Error Characterization Report (CECR), Version 2, Issue 1, Revision 2, Ozone_cci_KIT_CECR_02_01_02, 22 December 2016.
Copernicus Climate Change Service
C3S_312a_Lot4_BIRA-IASB_2016SC1 - Product User Guide and Specification Page 7 of 59
WOUDC World Ozone and Ultraviolet Radiation Data Centre
Copernicus Climate Change Service
C3S_312a_Lot4_BIRA-IASB_2016SC1 - Product User Guide and Specification Page 10 of 59
General definitions
Essential climate variable (ECV)
An ECV is a physical, chemical, or biological variable or a group of linked variables that critically contributes to the characterization of Earth’s climate (Bojinski et al., 2014).
Climate data record (CDR)
The US National Research Council (NRC) defines a CDR as a time series of measurements of sufficient length, consistency, and continuity to determine climate variability and change (National
Research Council, 2004).
Thematic climate data record (TCDR)
A thematic climate data record (TCDR) is a long time series of an essential climate variable (ECV) (Werscheck, 2015).
Intermediate climate data record (ICDR)
An intermediate climate data record (ICDR) is a TCDR which undergoes regular and consistent updates (Werscheck, 2015), for example because it is being generated by a satellite sensor in operation.
Copernicus Climate Change Service
C3S_312a_Lot4_BIRA-IASB_2016SC1 - Product User Guide and Specification Page 11 of 59
Table of Contents
History of modifications 4
Related documents 5
Acronyms 7
General definitions 10
Essential climate variable (ECV) 10
Climate data record (CDR) 10
Thematic climate data record (TCDR) 10
Intermediate climate data record (ICDR) 10
Scope of the document 13
Executive summary 15
Tables 16
1. L-3 and L-4 ozone total column retrieved from UV-nadir sensors 18
1.1 Introduction 18
1.2 Product description 18 1.2.1 The data set 18 1.2.2 Originating satellite/sensor system, temporal coverage and ICDR update 18 1.2.3 Algorithm and processing level 19 1.2.4 Ancillary data: auxiliary parameters used in the GODFIT algorithm 20 1.2.5 Bias corrections 20
1.3 Target requirements 21
1.4 Data usage information 22 1.4.1 Data file content, format and names 22 1.4.2 Quality indicators for the multi-sensor reanalysis (MSR) 23 1.4.3 Other useful information 23
2. L-3 ozone total and tropospheric column retrieved from IASI 25
2.1 Introduction 25
2.2 Product description 25 2.2.1 The data set 25 2.2.2 Ancillary data 26 2.2.3 Bias corrections 26
2.3 Target requirements 26
2.4 Data usage information 26 2.4.1 Data file content, format and names 26
Copernicus Climate Change Service
C3S_312a_Lot4_BIRA-IASB_2016SC1 - Product User Guide and Specification Page 12 of 59
3. L-3 ozone profile retrieved from UV-nadir sensors 28
3.1 Introduction 28
3.2 Product description 28 3.2.1 The data set 28 3.2.2 Originating satellite/sensor system, temporal coverage and ICDR update 28 3.2.3 Ancillary data 29 3.2.4 Bias corrections 29
3.3 Target requirements 29
3.4 Data usage information 31 3.4.1 Data file content, format and names 31 3.4.2 Data v1 disclaimer 32
4. L-3 ozone profile retrieved from limb and occultation sensors 33
4.1 Introduction 33
4.2 Product description 33 4.2.1 The data set 33 4.2.2 Originating system, temporal coverage and ICDR update 33 4.2.3 Type of average, horizontal resolution and retrieval algorithm 34 4.2.4 Vertical coordinate 35 4.2.5 Ancillary data 36 4.2.6 Bias corrections 36
4.3 Target requirements 36
4.4 Data usage information 39 4.4.1 Data file content, format and names 39 4.4.2 Data v1 disclaimer 43
5. Data access information 44
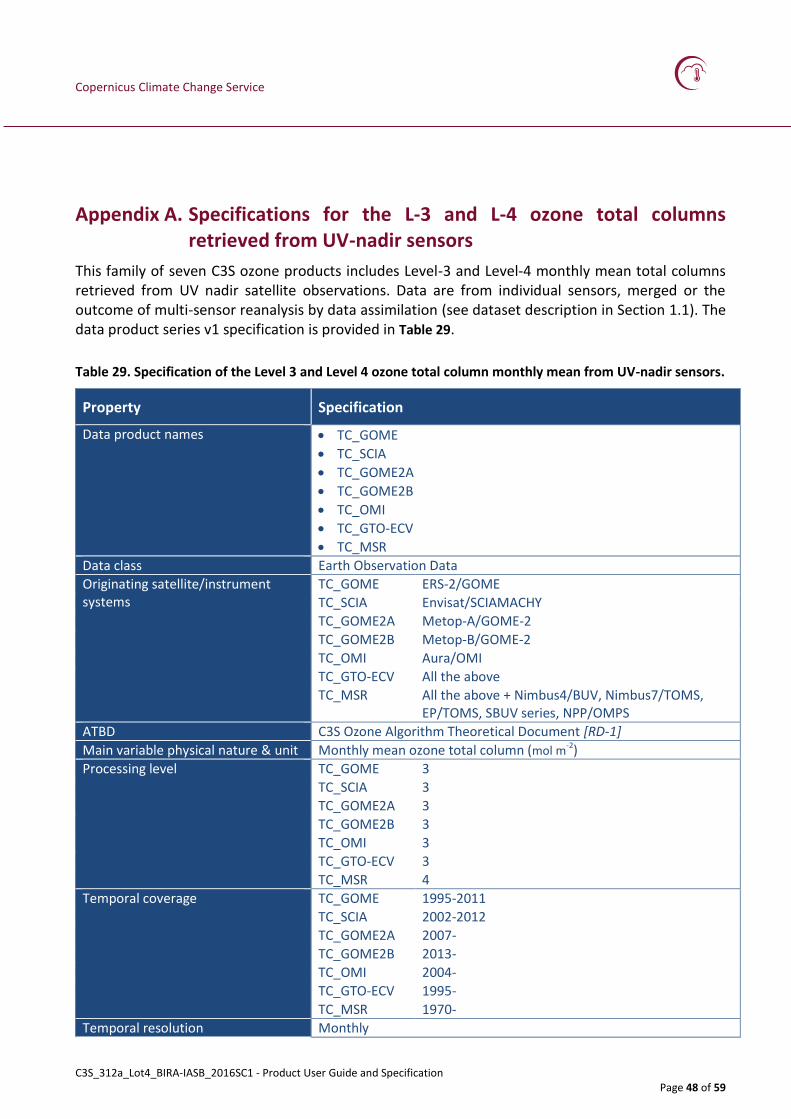
Appendix A. Specifications for the L-3 and L-4 ozone total columns retrieved from UV-nadir sensors 48
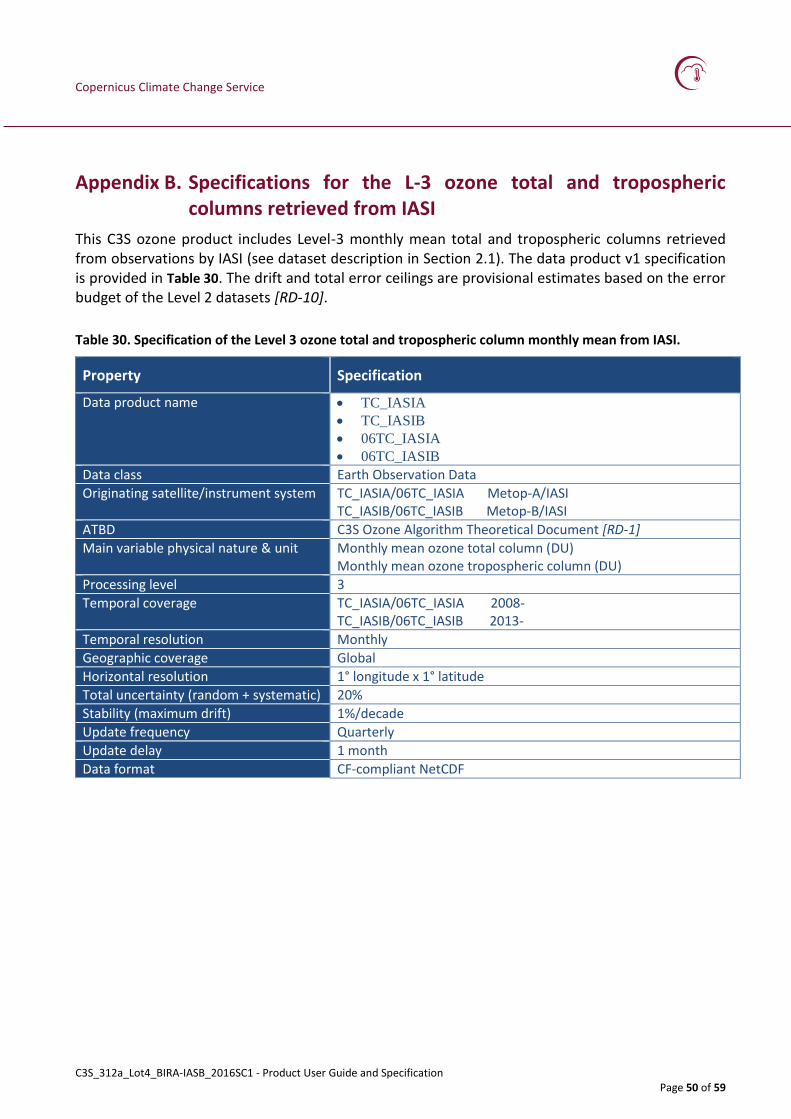
Appendix B. Specifications for the L-3 ozone total and tropospheric columns retrieved from IASI 50
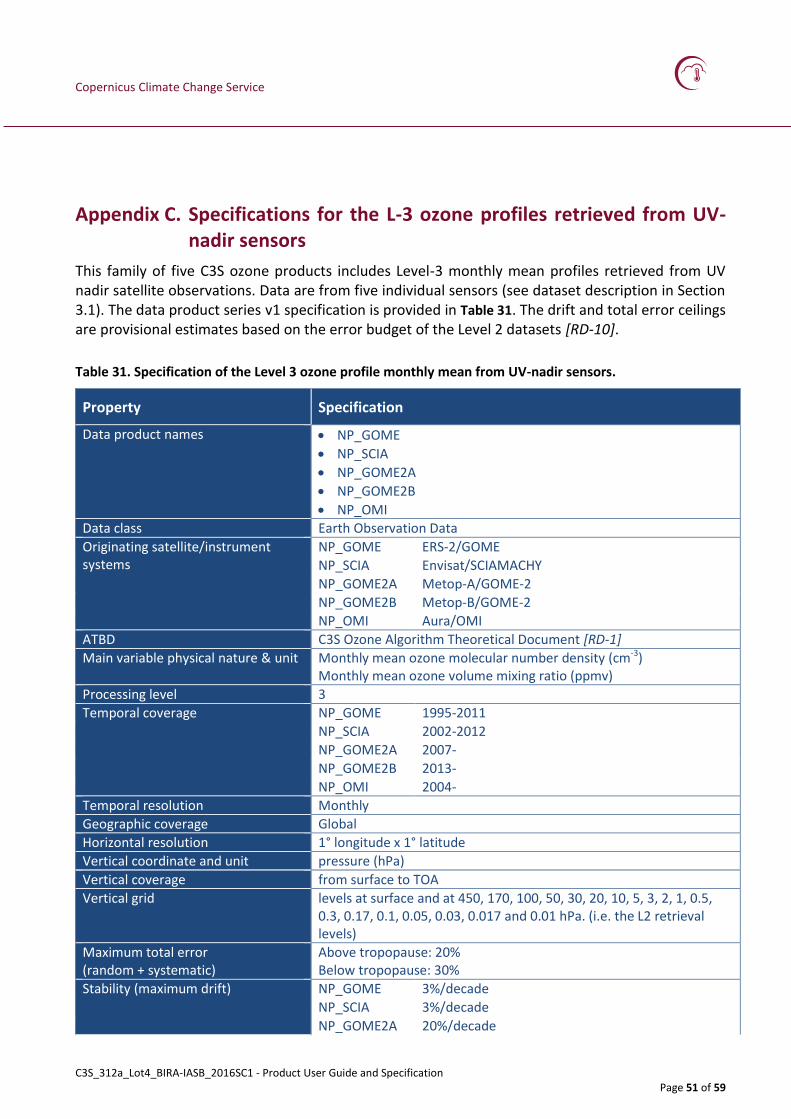
Appendix C. Specifications for the L-3 ozone profiles retrieved from UV-nadir sensors 51
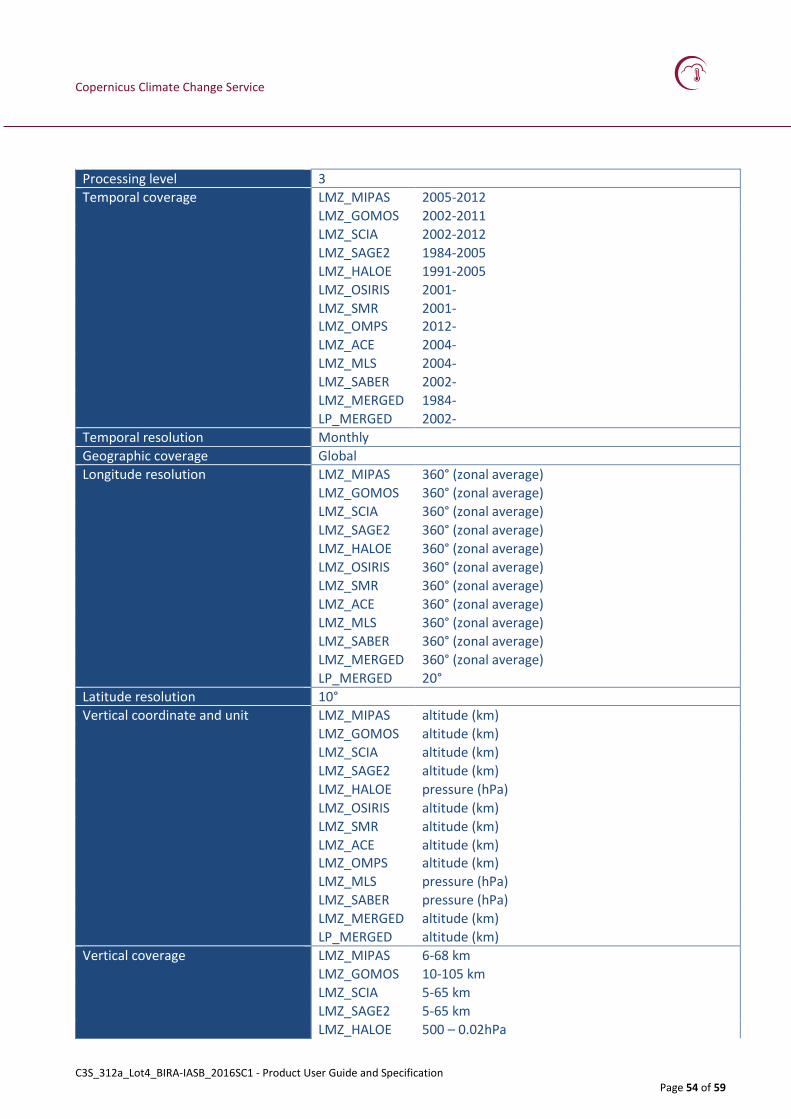
Appendix D. Specifications for the L-3 ozone profiles retrieved from limb and occultation sensors 53
References 58
Copernicus Climate Change Service
C3S_312a_Lot4_BIRA-IASB_2016SC1 - Product User Guide and Specification Page 13 of 59
Scope of the document
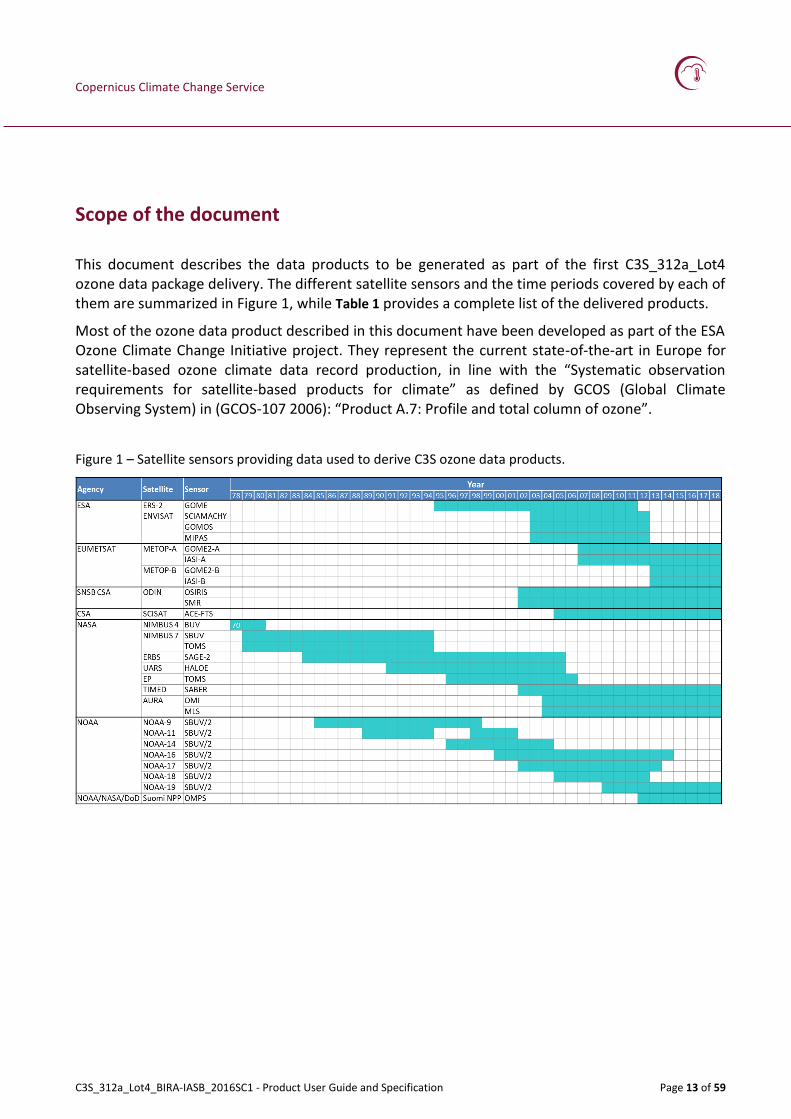
This document describes the data products to be generated as part of the first C3S_312a_Lot4 ozone data package delivery. The different satellite sensors and the time periods covered by each of them are summarized in Figure 1, while Table 1 provides a complete list of the delivered products.
Most of the ozone data product described in this document have been developed as part of the ESA Ozone Climate Change Initiative project. They represent the current state-of-the-art in Europe for satellite-based ozone climate data record production, in line with the “Systematic observation requirements for satellite-based products for climate” as defined by GCOS (Global Climate Observing System) in (GCOS-107 2006): “Product A.7: Profile and total column of ozone”.
Figure 1 – Satellite sensors providing data used to derive C3S ozone data products.
Copernicus Climate Change Service
C3S_312a_Lot4_BIRA-IASB_2016SC1 - Product User Guide and Specification Page 14 of 59
Table 1. List of the C3S ozone data products.
Product name Product definition
Sensor input
Processing level
Product type
Temporal coverage
Temporal resolution
Timeliness Spatial coverage
Spatial resolution
Uncertainty information
Provision and provenance
Format
TC_GOME Total ozone
GOME 3 CDR 1995-2011 monthly N/A Global 1°x1° Random and smoothing error
LMZ_SMR SMR 3 CDR 2001-2014 monthly Global 10° lat zones UNI-HB/FMI NetCDF-CF
LMZ_ACE ACE 3 ICDR 2004- monthly Global 10° lat zones UNI-HB/FMI NetCDF-CF
LMZ_MLS MLS 3 ICDR 2004- monthly Global 10° lat zones UNI-HB/FMI NetCDF-CF
LMZ_SABER SABER 3 ICDR 2002- monthly Global 10° lat zones UNI-HB/FMI NetCDF-CF
LMZ_OMPS OMPS 3 ICDR 2012- monthly Global 10° lat zones UNI-HB/FMI NetCDF-CF
LMZ_MERGED (2) 3 ICDR 1984- monthly Global 10° lat zones FMI NetCDF-CF
LP_MERGED (3) 3 ICDR 2002- monthly Global 10°x20° FMI NetCDF-CF
TC Total column monthly gridded average product (1) Merged/assimilated product based on GOME, SCIAMACHY, OMI, GOME-2A/B, BUV-Nimbus4, TOMS-Nimbus7, TOMS-EP, SBUV-7, -9, -11, -14, -16, -17, -18, -19and OMPS NP Nadir profile monthly gridded average product
LP Limb profile monthly gridded average product (2) Monthly zonal mean merged product based on MIPAS, GOMOS, SCIAMACHY, OSIRISACE and SAGE-2 and OMPS LMZ Limb monthly zonal profile average product
(3) Latitude-longitude gridded merged product based on MIPAS, GOMOS, SCIAMACHY and OSIRIS
Copernicus Climate Change Service
C3S_312a_Lot4_BIRA-IASB_2016SC1 - Product User Guide and Specification Page 15 of 59
Executive summary
The C3S_312a_Lot4 Product User Guide and Specification (PUGS) version 1, contains a full description of the various data products to be made available in the first data package delivery. This includes a description of target requirements and specifications for each product as well as details of the netCDF file format.
The document is organized in 4 main sections, according to the main data products main categories:
• Ozone total column retrieval from UV-nadir sensors • Ozone total and tropospheric column retrieval from IASI • Ozone profile retrieval from UV-nadir sensors • Ozone profile retrieval from limb and occultation sensors
In addition, section 5 provides an information on the data origin and access. Note that the descriptions provided here relate to the first data package delivery planned for the end of April 2017. It is anticipated that adjustments and/or additions will be necessary in the course of the project according to progress.
Copernicus Climate Change Service
C3S_312a_Lot4_BIRA-IASB_2016SC1 - Product User Guide and Specification Page 16 of 59
Tables
Table 1. List of the C3S ozone data products. ...................................................................................... 14
Table 2. Common characteristics of the C3S ozone total column monthly means retrieved from UV-nadir sensors. ....................................................................................................................................... 18
Table 3. Originating system, temporal coverage, algorithm name and version, and processing level of the seven C3S data products including ozone total column monthly means from UV-nadir sensors. In case of TC_GTO-ECV the input data are individual L3 records and the output is the merged L3 product. ................................................................................................................................................ 19
Table 4. List of auxiliary input needs for generating the Level 2 total ozone product with the GODFIT retrieval algorithm. .............................................................................................................................. 20
Table 5. Selected properties of the ozone total column monthly mean retrieved from UV-nadir sensors (Column 3) together with their specified and target values (Columns 4 and 5) and the type of application for which the requirement holds (Column 6). .............................................................. 21
Table 6. Dimension and description of all variables contained in the individual and merged L3 monthly mean total ozone NetCDF files. Nlat = 180 and Nlon = 360. .................................................... 23
Table 7. Dimension and description of all variables contained in the L4 merged monthly mean total ozone NetCDF files. Nlat = 361, Nlon = 720 and Nmonth = 444. ............................................................... 23
Table 8. Cut-off values for latitude as a function of month for the individual and merged UV nadir level 3 monthly mean total ozone products. ....................................................................................... 24
Table 9. Level 3 ozone total and tropospheric column monthly mean from IASI. .............................. 25
Table 10. Selected properties of the ozone total and tropospheric column monthly means retrieved from IASI (Column 1) together with their specified and target values (Columns 2 and 3) and the type of application for which the requirement holds (Column 4). .............................................................. 26
Table 11. Dimension and description of the variables contained in the current L3 ozone NetCDF files. Nlat and Nlon represent the number of latitude and longitude, respectively. ..................................... 27
Table 12. Level 3 ozone profile monthly mean from UV-nadir sensors. ............................................. 28
Table 13. Originating system and temporal coverage of the five C3S data products including ozone vertical profile monthly means from UV-nadir sensors....................................................................... 29
Table 14. Selected properties of the ozone vertical profile monthly mean retrieved from UV-nadir sensors (Column 3) together with their specified and target values (Columns 4 and 5) and the type of application for which the requirement holds (Column 6). .............................................................. 29
Table 15. The variables in the NetCDF files containing ozone nadir profiles. Ntime, Nlayer, Np, Nlat and Nlon are number of time, layers, pressures levels, latitude and longitude zones, respectively. ......... 31
Table 16. Level 3 ozone profile monthly mean from limb and occultation sensors. .......................... 33
Table 17. Originating system and temporal coverage of the twelve C3S data products providing ozone profile monthly means from limb or occultation sensors. Instruments with names preceded
Copernicus Climate Change Service
C3S_312a_Lot4_BIRA-IASB_2016SC1 - Product User Guide and Specification Page 17 of 59
with a (*) are used to derive the LMZ_MERGED product. Instruments with names preceded with (**) are used to derive the LMZ_MERGED and LP_MERGED products. .............................................. 34
Table 18. Type of average, horizontal resolution and retrieval algorithms of the C3S ozone profile monthly means from limb and occultation sensors. ........................................................................... 34
Table 19. Vertical domain of definition of the C3S ozone vertical profile monthly means from limb and occultation sensors. The vertical resolution indicated in the table is the vertical spacing. The vertical resolution of all datasets is 2-4 km. ........................................................................................ 35
Table 20. Selected properties of the ozone vertical profile monthly mean retrieved from limb and occultation sensors (Column 3) together with their specified and target values (Columns 4 and 5) and the type of application for which the requirement holds (Column 6). ........................................ 36
Table 21. The variables in altitude-gridded LZM NetCDF files. Nalt and Nlat are number of altitude levels and latitude zones, respectively. ............................................................................................... 39
Table 22. The variables in pressure –gridded LZM NetCDF files. Nalt and Nlat are number of months, pressures levels and latitude zones, respectively. ............................................................................... 40
Table 23. The variables in LMZ_merged NetCDF files with deseasonalized anomalies. Nalt and Nlat are number of altitude levels and latitude zones, respectively.......................................................... 41
Table 24. The variables in LMZ_merged NetCDF files with ozone concentrations. Nalt and Nlat are number of altitude levels and latitude zones, respectively. ................................................................ 41
Table 25. The variables in LP_MERGED NetCDF file with deseasonalized anomalies. Nalt, Nlat , Nlon are number of altitude levels, latitude and longitude zones, respectively. .............................................. 42
Table 26. The variables in LP_MERGED NetCDF file with ozone concentrations. Nalt, Nlat , Nlon are number of altitude levels, latitude and longitude zones, respectively. .............................................. 42
Table 25. C3S ozone data provider details........................................................................................... 44
Table 26. Level-2 data developer details. ............................................................................................ 46
Table 27. Specification of the Level 3 and Level 4 ozone total column monthly mean from UV-nadir sensors. ................................................................................................................................................ 48
Table 28. Specification of the Level 3 ozone total and tropospheric column monthly mean from IASI. .............................................................................................................................................................. 50
Table 29. Specification of the Level 3 ozone profile monthly mean from UV-nadir sensors. ............. 51
Table 30. Specification of the Level 3 ozone profile monthly mean from limb and occultation sensors. ................................................................................................................................................ 53
Copernicus Climate Change Service
C3S_312a_Lot4_BIRA-IASB_2016SC1 - Product User Guide and Specification Page 18 of 59
1. L-3 and L-4 ozone total column retrieved from UV-nadir sensors
1.1 Introduction
The stratospheric ozone layer protects organisms and ecosystems on Earth from harmful effects of solar ultraviolet radiation. A strong decline in ozone amounts attributable to anthropogenic emissions of ozone-depleting substances (ODSs) has been observed in the late eighties. Since 1987, the Montreal Protocol and its subsequent amendments control the production and release of ODSs. Measurements indicate that stratospheric concentrations of ODSs peaked in the late 1990s and have begun to decrease since the turn of the century. A key issue is now the monitoring of the effectiveness of the Montreal Protocol, i.e., the detection of the expected onset of ozone recovery and its spatial fingerprint. To this aim, high-quality and stable long-term data sets are needed. Total integrated ozone vertical columns measured by passive remote-sensing UV spectrometry onboard of nadir sensors such as SBUV, TOMS, GOME, SCIAMACHY or OMI provide stable data sets suitable for long-term trend assessment.
1.2 Product description
1.2.1 The data set
The family of products described in Section 1.1 includes seven climate data records (CDR) derived from nadir-viewing UV sensors. Five of them are intermediate climate data records (ICDR), meaning that they are being regularly and consistently updated with new observations, since (some of) the associated instruments are still in operation. In all cases, the retrieved variable is the monthly average of the ozone total column.
Features common to the seven products are listed in Table 2. Features specific to one product or a subgroup of products are described in the following subsections.
Table 2. Common characteristics of the C3S ozone total column monthly means retrieved from UV-nadir sensors.
Originating satellite sensor type Nadir-viewing UV sensor
Main variable physical nature and unit Monthly mean ozone total column (mol m-2)
Data format CF-compliant NetCDF
1.2.2 Originating satellite/sensor system, temporal coverage and ICDR update
All seven products include ozone column monthly means retrieved from UV-nadir observations by one or several sensors. The temporal coverage of the data depends on the life-time of the associated satellite, or rather of the sensor on board the satellite. Columns 2 and 3 of Table 3 list the observation systems and associated time-spans of the seven products named in Column 1. All instruments are described in the C3S Ozone ATBD [RD-1].
Copernicus Climate Change Service
C3S_312a_Lot4_BIRA-IASB_2016SC1 - Product User Guide and Specification Page 19 of 59
Table 3. Originating system, temporal coverage, algorithm name and version, and processing level of the seven C3S data products including ozone total column monthly means from UV-nadir sensors. In case of TC_GTO-ECV the input data are individual L3 records and the output is the merged L3 product.
TC_GTO-ECV All the above 1995- / / GTO-ECV V3.0 / 3
TC_MSR All the above + Nimbus4 / BUV Nimbus7 / TOMS EP / TOMS SBUV series NPP / OMPS
1970- / / / TMDAM 4
The update frequency and delay of the five ICDR are the following.
TC_GOME2A, TC_GOME2B and TC_OMI are updated quarterly with a 4-month delay.
TC_GTO-ECV is updated semi-annually with a 4-month delay.
TC_MSR is updated annually with a 3-month delay.
1.2.3 Algorithm and processing level
Names and version numbers of algorithms applied within the C3S Ozone project to derive UV-nadir ozone columns are listed in Columns 4, 5, 6 and 7 of Table 3. Column 8 provides the processing level of the data included in the end products made available to the C3S data store (named in Column 1).
Algorithms to transform Level-0 into Level-1 data (radiances along the satellite swaths) are described in the ATBDs of the different instruments - see references cited in the C3S Ozone ATBD [RD-1].
The GODFIT algorithm developed at BIRA-IASB is applied to retrieve ozone columns (Level-2) from radiances (Level-1). It is described in detail in the C3S Ozone ATBD [RD-1] (Section 3.1.2).
The five C3S data products that include Level-3 monthly mean ozone columns retrieved from individual sensors (see first five entries in Table 3) are generated from the corresponding Level-2 datasets by DLR using the UCAS algorithm. The algorithm applied to transpose ozone data along the satellite paths (Level-2) to ozone data on a regular longitude-latitude grid (Level-3) is described in Section 3.1.3.1 of the C3S Ozone ATBD [RD-1].
The algorithm giving rise to the Level-3 merged GOME-type total ozone (GTO-ECV) by combination of Level-3 ozone data from GOME, GOME2, SCIAMACHY and OMI is described in Section 3.1.3.2 of the C3S Ozone ATBD [RD-1].
The multi-sensor reanalysis (MSR) producing the Level-4 TC_MSR dataset by assimilation of Level-2 ozone columns observed by a large number of UV-nadir sensors is described in Section 3.1.4 of the C3S Ozone ATBD [RD-1].
Copernicus Climate Change Service
C3S_312a_Lot4_BIRA-IASB_2016SC1 - Product User Guide and Specification Page 20 of 59
1.2.4 Ancillary data: auxiliary parameters used in the GODFIT algorithm
Table 4 lists static and dynamic auxiliary data needed by the retrieval algorithm GODFIT to generate the total ozone ECV.
Table 4. List of auxiliary input needs for generating the Level 2 total ozone product with the GODFIT retrieval algorithm.
Parameter Physical unit Source Comments
High-resolution solar spectrum
[mol s−1 m−2 nm−1] Chance and Kurucz [2010] Static
Absorption O3 cross sections at various temperatures
Surface height m GTOPO30 [https://lta.cr.usgs.gov/GTOPO30]
Static
Degraded at instrumental resolution
A-priori O3 vertical profile shapes
DU Total O3-classified climatology (Labow et al., [2015]) combined with the OMI/MLS tropospheric O3 climatology (Ziemke et al., [2011])
Static
Cloud fraction --- Cloud product FRESCOv7/O2-02 OMI product
Dynamic
Cloud top height/pressure
Pa Cloud product FRESCOv7/O2-02 OMI product
Dynamic
Temperature profiles
°K ECMWF - ERA Interim Dynamic
Only to compute soft-calibration factors.
1.2.5 Bias corrections
1.2.5.1 Ozone column from individual sensors
No bias corrections have been applied to level-3 data from the individual sensors.
1.2.5.2 Merged UV-nadir ozone column (GTO-ECV)
Before merging the monthly mean level-3 ozone columns from the individual sensors into the GTO-ECV product bias corrections have been applied to GOME, SCIAMACHY, GOME-2A, and GOME-2B in
Copernicus Climate Change Service
C3S_312a_Lot4_BIRA-IASB_2016SC1 - Product User Guide and Specification Page 21 of 59
which OMI has been used as a reference. A detailed description of this procedure can be found in Section 3.1.3.2 of the C3S Ozone ATBD [RD-1].
1.3 Target requirements
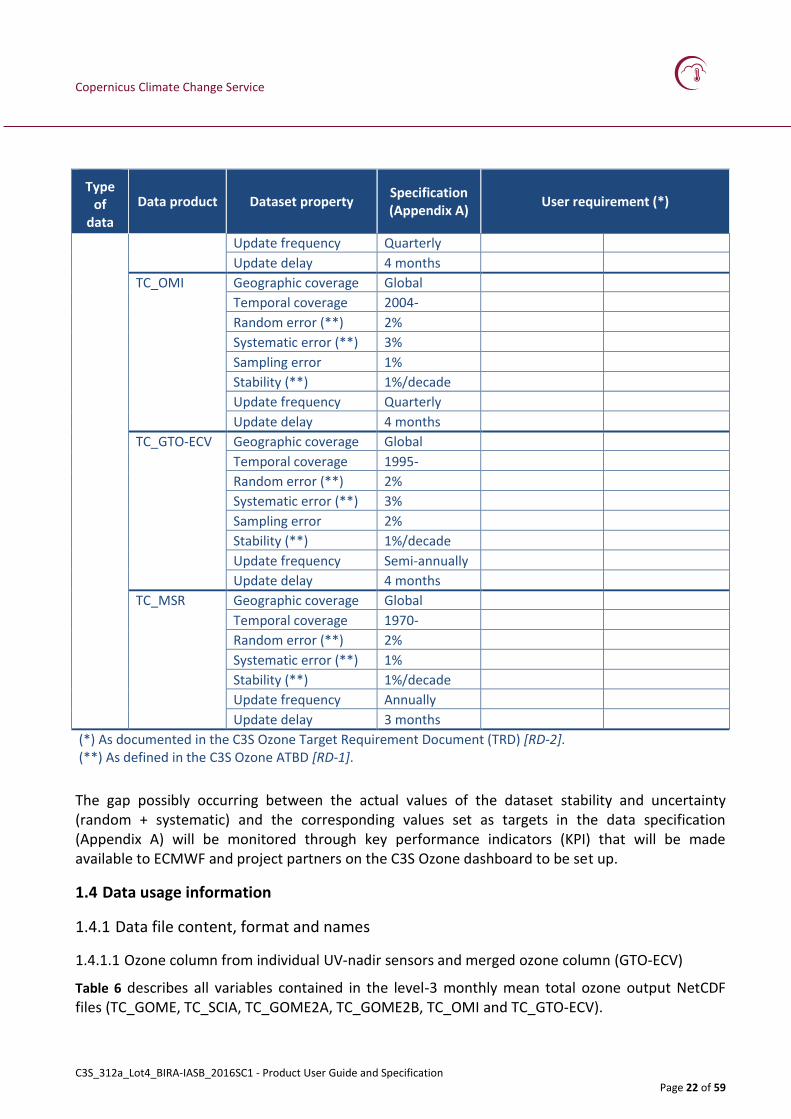
Table 5 lists selected dataset properties (Column 3) together with their values as set in the a priori data specification of Appendix A (Column 4) and the values required by users (Column 5), as collected in the C3S Ozone Target Requirement Document (TRD) [RD-2]. Column 6 shows the type of application for which the requirement holds.
Table 5. Selected properties of the ozone total column monthly mean retrieved from UV-nadir sensors (Column 3) together with their specified and target values (Columns 4 and 5) and the type of application for which the requirement holds (Column 6).
Type of
data record
Data product Dataset property Specification (Appendix A)
User requirement (*)
Target Application type
CDR TC_GOME Geographic coverage Global (1) …
(2) …
(1) …
(2) …
Temporal coverage 1995-2011
Random error (**) 2%
Systematic error (**) 3%
Sampling error 2%
Stability (**) 1%/decade
TC_SCIA Geographic coverage Global
Temporal coverage 2002-2012
Random error (**) 2%
Systematic error (**) 3%
Sampling error 2%
Stability (**) 1%/decade
ICDR TC_GOME2A Geographic coverage Global
Temporal coverage 2007-
Random error (**) 2%
Systematic error (**) 3%
Sampling error 1%
Stability (**) 1%/decade
Update frequency Quarterly
Update delay 4 months
TC_GOME2B Geographic coverage Global
Temporal coverage 2013-
Random error (**) 2%
Systematic error (**) 3%
Sampling error 1%
Stability (**) 1%/decade
Copernicus Climate Change Service
C3S_312a_Lot4_BIRA-IASB_2016SC1 - Product User Guide and Specification Page 22 of 59
Type of
data record
Data product Dataset property Specification (Appendix A)
User requirement (*)
Update frequency Quarterly
Update delay 4 months
TC_OMI Geographic coverage Global
Temporal coverage 2004-
Random error (**) 2%
Systematic error (**) 3%
Sampling error 1%
Stability (**) 1%/decade
Update frequency Quarterly
Update delay 4 months
TC_GTO-ECV Geographic coverage Global
Temporal coverage 1995-
Random error (**) 2%
Systematic error (**) 3%
Sampling error 2%
Stability (**) 1%/decade
Update frequency Semi-annually
Update delay 4 months
TC_MSR Geographic coverage Global
Temporal coverage 1970-
Random error (**) 2%
Systematic error (**) 1%
Stability (**) 1%/decade
Update frequency Annually
Update delay 3 months
(*) As documented in the C3S Ozone Target Requirement Document (TRD) [RD-2]. (**) As defined in the C3S Ozone ATBD [RD-1].
The gap possibly occurring between the actual values of the dataset stability and uncertainty (random + systematic) and the corresponding values set as targets in the data specification (Appendix A) will be monitored through key performance indicators (KPI) that will be made available to ECMWF and project partners on the C3S Ozone dashboard to be set up.
1.4 Data usage information
1.4.1 Data file content, format and names
1.4.1.1 Ozone column from individual UV-nadir sensors and merged ozone column (GTO-ECV)
Table 6 describes all variables contained in the level-3 monthly mean total ozone output NetCDF files (TC_GOME, TC_SCIA, TC_GOME2A, TC_GOME2B, TC_OMI and TC_GTO-ECV).
Copernicus Climate Change Service
C3S_312a_Lot4_BIRA-IASB_2016SC1 - Product User Guide and Specification Page 23 of 59
Table 6. Dimension and description of all variables contained in the individual and merged L3 monthly mean total ozone NetCDF files. Nlat = 180 and Nlon = 360.
Variable Name Unit Dimension Description
Latitude degree Nlat Latitude of grid center
Longitude degree Nlon Longitude of grid center
total_ozone_column mol m-2
Nlat x Nlon Mean Total Ozone Column
total_ozone_column_standard_deviation mol m-2
Nlat x Nlon Standard Deviation of Mean Total Ozone Column
total_ozone_column_standard_error mol m-2
Nlat x Nlon Standard Error of Mean Total Ozone Column
total_ozone_column_number_of_observations - Nlat x Nlon The Number of Measurements used to derive the Mean Total Ozone
1.4.1.2 Multi-sensor reanalysis (MSR)
Table 7 describes all variables contained in the level-4 merged monthly mean total ozone output NetCDF files (MSR).
Table 7. Dimension and description of all variables contained in the L4 merged monthly mean total ozone NetCDF files. Nlat = 361, Nlon = 720 and Nmonth = 444.
Variable Name Unit Dimension Description
latitude degree Nlat Latitude of grid center
longitude degree Nlon Longitude of grid center
time months Nmonth number of months since January 1970
total_ozone_column DU Nmonth X Nlat x Nlon Mean Total Ozone Column in Dobson Units
total_ozone_column_standard_deviation
DU Nmonth X Nlat x Nlon Standard Deviation of Mean Total Ozone Column in Dobson Units
1.4.2 Quality indicators for the multi-sensor reanalysis (MSR)
The standard deviation is the best criterion for the quality of the data value. If the error is more than 20 DU, it is advised not to use this data value, since there have been likely no observations for some time over this grid cell.
1.4.3 Other useful information
1.4.3.1 Ozone column from individual sensors
In order to provide representative monthly mean values that contain a sufficient number of measurements equally distributed over all days in a month, cut-off values for latitude as a function of month have been defined (see Table 8). These cut-off values are applied during the calculation of the monthly means.
GOME/ERS-2 lost its global coverage in June 2003 due to an onboard tape recorder failure. Thus, since that date coverage of TC_GOME monthly mean level-3 ozone columns is limited to the regions where the platform was in direct contact with ESA ground receiving stations.
Copernicus Climate Change Service
C3S_312a_Lot4_BIRA-IASB_2016SC1 - Product User Guide and Specification Page 24 of 59
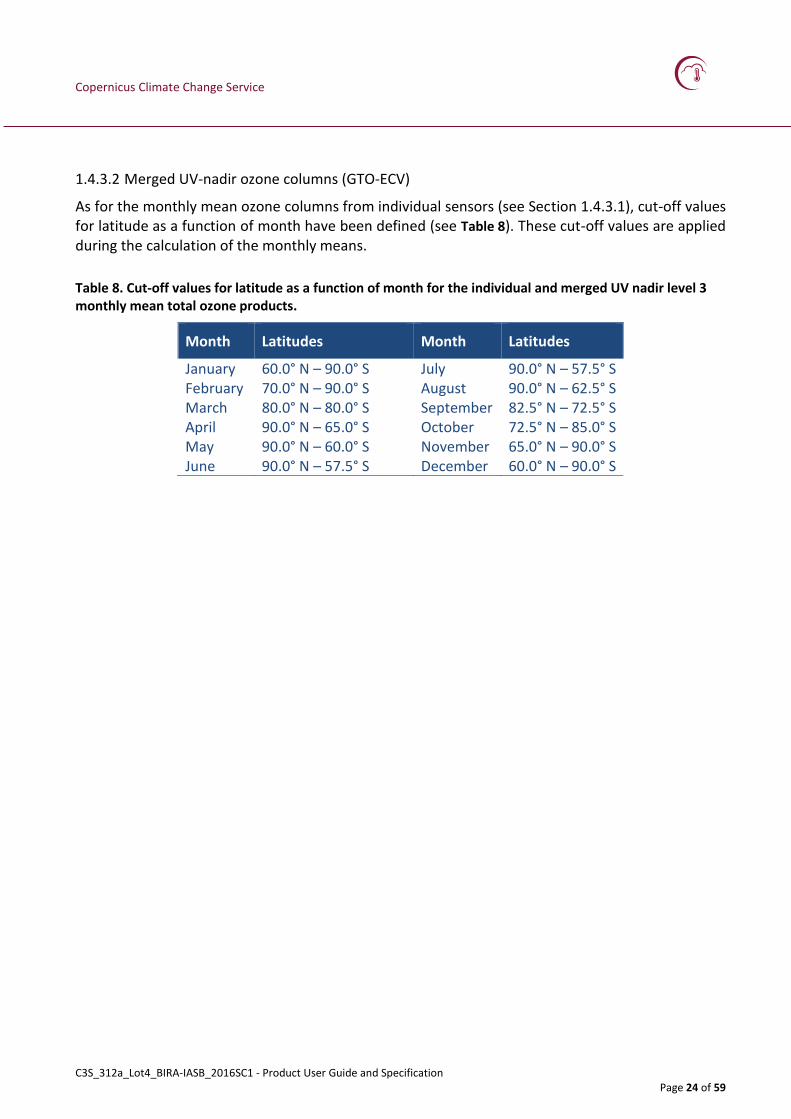
1.4.3.2 Merged UV-nadir ozone columns (GTO-ECV)
As for the monthly mean ozone columns from individual sensors (see Section 1.4.3.1), cut-off values for latitude as a function of month have been defined (see Table 8). These cut-off values are applied during the calculation of the monthly means.
Table 8. Cut-off values for latitude as a function of month for the individual and merged UV nadir level 3 monthly mean total ozone products.
Month Latitudes Month Latitudes
January 60.0° N – 90.0° S July 90.0° N – 57.5° S February 70.0° N – 90.0° S August 90.0° N – 62.5° S March 80.0° N – 80.0° S September 82.5° N – 72.5° S April 90.0° N – 65.0° S October 72.5° N – 85.0° S May 90.0° N – 60.0° S November 65.0° N – 90.0° S June 90.0° N – 57.5° S December 60.0° N – 90.0° S
Copernicus Climate Change Service
C3S_312a_Lot4_BIRA-IASB_2016SC1 - Product User Guide and Specification Page 25 of 59
2. L-3 ozone total and tropospheric column retrieved from IASI
2.1 Introduction
Space observation in the nadir geometry is the most efficient way to obtain global information on horizontal distribution of O3, along with coarse information on the vertical axis. However, in contrast to total ozone, retrievals of tropospheric O3 remain challenging since most of the O3 is contained in the stratosphere. Although tropospheric O3 columns were first derived from backscatter nadir UV measurements by subtracting an estimate of the stratospheric component from the measured total column (e.g., Fishman and Larsen, 1987), the recently developed thermal infrared (TIR) nadir-viewing spectrometers offer more sensitivity in the troposphere, as demonstrated by the Infrared Atmospheric Sounding Interferometer (IASI) on board MetOp-A and B.
2.2 Product description
2.2.1 The data set
The C3S ozone columns retrieved from observations by IASI include Level-3 monthly mean total and tropospheric columns (Table 9).
Table 9. Level 3 ozone total and tropospheric column monthly mean from IASI.
Originating satellite / sensor system Nadir-viewing sensor IASI on board the Metop satellites – cf. C3S Ozone ATBD [RD-1], Section 1.1.5
Data class Earth Observation Data
Data product names TC_IASI-A
TC_IASI-B
06TC_IASI-A
06TC_IASI-B
Algorithm name and version number L1 to L2: FORLI-O3 v20151001 L2 to L3: v0001
Main variable physical nature and unit Monthly mean ozone total column (mol.m-2)
Monthly mean ozone tropospheric column (mol.m-2)
Data format CF-compliant NetCDF
Copernicus Climate Change Service
C3S_312a_Lot4_BIRA-IASB_2016SC1 - Product User Guide and Specification Page 26 of 59
2.2.2 Ancillary data
Ancillary data required to derive Level 2 data from the Level 1 datasets are described in Section 2.2.6 of the C3S Ozone ATBD [RD-1].
No ancillary data are required for the generation of the L3 products.
2.2.3 Bias corrections
No bias correction is applied to the Level 3 products.
2.3 Target requirements
Table 10 lists selected dataset properties (Column 1) together with their values as set in the a priori data specification of Appendix B (Column 2) and the values required by users (Column 3), as collected in the C3S Ozone Target Requirement Document (TRD) [RD-2]. Column 4 shows the type of application for which the requirement holds.
Table 10. Selected properties of the ozone total and tropospheric column monthly means retrieved from IASI (Column 1) together with their specified and target values (Columns 2 and 3) and the type of application for which the requirement holds (Column 4).
Dataset property Specification (Appendix B)
User requirement (*)
Target Application type
Geographic coverage Global (1) …
(2) …
(1) …
(2) …
Temporal coverage 2008-
Total uncertainty (random + systematic) (**)
20%
Stability (**) 1%/decade
Update frequency Quarterly
Update delay 1 month
(*) As documented in the C3S Ozone Target Requirement Document (TRD) [RD-2]. (**) As defined in the C3S Ozone ATBD [RD-1].
The gap possibly occurring between the actual values of the dataset stability and uncertainty (random + systematic) and the corresponding values set as targets in the data specification (Appendix B) will be monitored through key performance indicators (KPI) that will be made available to ECMWF and project partners on the C3S Ozone dashboard to be set up.
2.4 Data usage information
2.4.1 Data file content, format and names
Common datasets for all NetCDF output files are latitude, and longitude. Missing values in the dataset are indicated with the ’-999.’ values.
The filed ‘time’ is not given because monthly files are provided. The fields ‘latitude’ and ‘longitude’ give the latitude and longitude of the L3 grid cell centers. Latitude varies between -90 and +90 and longitude between -180 and +180.
Copernicus Climate Change Service
C3S_312a_Lot4_BIRA-IASB_2016SC1 - Product User Guide and Specification Page 27 of 59
The NetCDF datasets are:
total_ozone_column,
total_ozone_column_error,
surface_6km_ozone_column,
surface_6km_ozone_column_error,
which are the total column and its associated error (both in mol/m2) and the surface_6km_ozone_column (defined as the 0-6km column) and its associated error (both in mol/m2).
The full list with NetCDF variables in can be found in Table 11.
Table 11. Dimension and description of the variables contained in the current L3 ozone NetCDF files. Nlat and Nlon represent the number of latitude and longitude, respectively.
Variable Name Precision and
dimension Unit Description
Latitude float, Nlat
degree latitude, from -90 (south) to +90 (north) given at gridcell centers
Longitude float, Nlon
degree longitude, from -180 (west) to +180 (east) given at gridcell centers
total_ozone_column float, Nlat x Nlon
mol m-2 weighted average of the total ozone columns
total_ozone_column_error float, Nlat x Nlon
mol m-2 uncertainty in the weighted average of the total ozone columns
surface_6km_ozone_column float, Nlat x Nlon
mol m-2 weighted average of the surface 6km ozone columns
surface_6km_ozone_column_error float, Nlat x Nlon
mol m-2 error in the weighted average of the surface 6km ozone columns
Copernicus Climate Change Service
C3S_312a_Lot4_BIRA-IASB_2016SC1 - Product User Guide and Specification Page 28 of 59
3. L-3 ozone profile retrieved from UV-nadir sensors
3.1 Introduction
The total atmospheric column of ozone is routinely measured with high accuracy by UV nadir-viewing sensors (e.g. BUV, SBUV, TOMS, SBUV-2, GOME, SCIAMACHY, OMI and GOME- 2). From the same type of instruments, ozone profiles have also been produced based on the exploitation of the strongly variable ozone absorption around the ozone cutoff spectral region (280-320 nm). Although retrieving tropospheric ozone presents a significant challenge in the UV (like in the TIR spectral range), tropospheric columns can be directly derived from temperature-dependent spectral structures in the Huggins bands (320–345 nm). Recently large efforts have been devoted within the ESA CCI programme to build harmonized ozone data sets from the European nadir UV spectral instruments GOME, SCIAMACHY, OMI and GOME- 2. Level-3 products generated in this portfolio are based on level-2 data sets produced using a common level-2 algorithm baseline developed at RAL.
3.2 Product description
3.2.1 The data set
The family of C3S ozone products described in Section 3.1 includes Level-3 monthly mean ozone vertical profiles retrieved from five UV nadir sensors. Features common to the five products are listed in Table 12. Product-specific features are described in Section 3.2.2.
Table 12. Level 3 ozone profile monthly mean from UV-nadir sensors.
Originating sensor type Nadir-viewing UV sensor
Data class Earth Observation Data
Retrieval algorithm name and version number
L1 to L2: L1 to L2: RALo3 fv0301(G1), fv0214(SCIA), fv0214(OMI), fv0300(G2A), fv0215(G2B)
Monthly mean ozone molecular number density (cm-3) Monthly mean ozone volume mixing ratio (ppmv)
Data format CF-compliant NetCDF
Vertical coordinate pressure
Vertical coverage surface to TOA
Vertical resolution levels at surface and at 450, 170, 100, 50, 30, 20, 10, 5, 3, 2, 1, 0.5, 0.3, 0.17, 0.1, 0.05, 0.03, 0.017 and 0.01 hPa. (i.e. the L2 retrieval levels)
3.2.2 Originating satellite/sensor system, temporal coverage and ICDR update
Each of the five products includes ozone profile monthly means retrieved from UV-nadir observations by one sensor. The temporal coverage of the data depends on the life-time of the associated satellite / sensor. Columns 2 and 3 of Table 13 list the observation systems and
Copernicus Climate Change Service
C3S_312a_Lot4_BIRA-IASB_2016SC1 - Product User Guide and Specification Page 29 of 59
associated time-spans of the five products named in Column 1. All instruments are described in the C3S Ozone ATBD [RD-1].
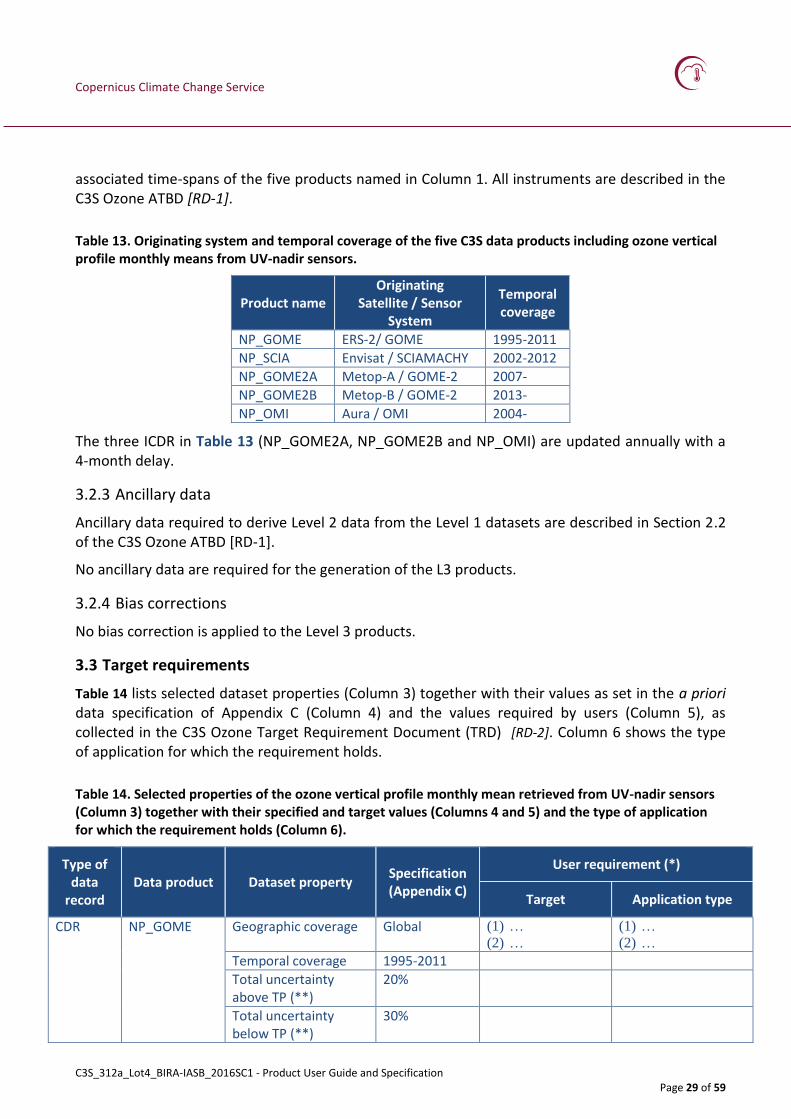
Table 13. Originating system and temporal coverage of the five C3S data products including ozone vertical profile monthly means from UV-nadir sensors.
Product name Originating
Satellite / Sensor System
Temporal coverage
NP_GOME ERS-2/ GOME 1995-2011
NP_SCIA Envisat / SCIAMACHY 2002-2012
NP_GOME2A Metop-A / GOME-2 2007-
NP_GOME2B Metop-B / GOME-2 2013-
NP_OMI Aura / OMI 2004-
The three ICDR in Table 13 (NP_GOME2A, NP_GOME2B and NP_OMI) are updated annually with a 4-month delay.
3.2.3 Ancillary data
Ancillary data required to derive Level 2 data from the Level 1 datasets are described in Section 2.2 of the C3S Ozone ATBD [RD-1].
No ancillary data are required for the generation of the L3 products.
3.2.4 Bias corrections
No bias correction is applied to the Level 3 products.
3.3 Target requirements
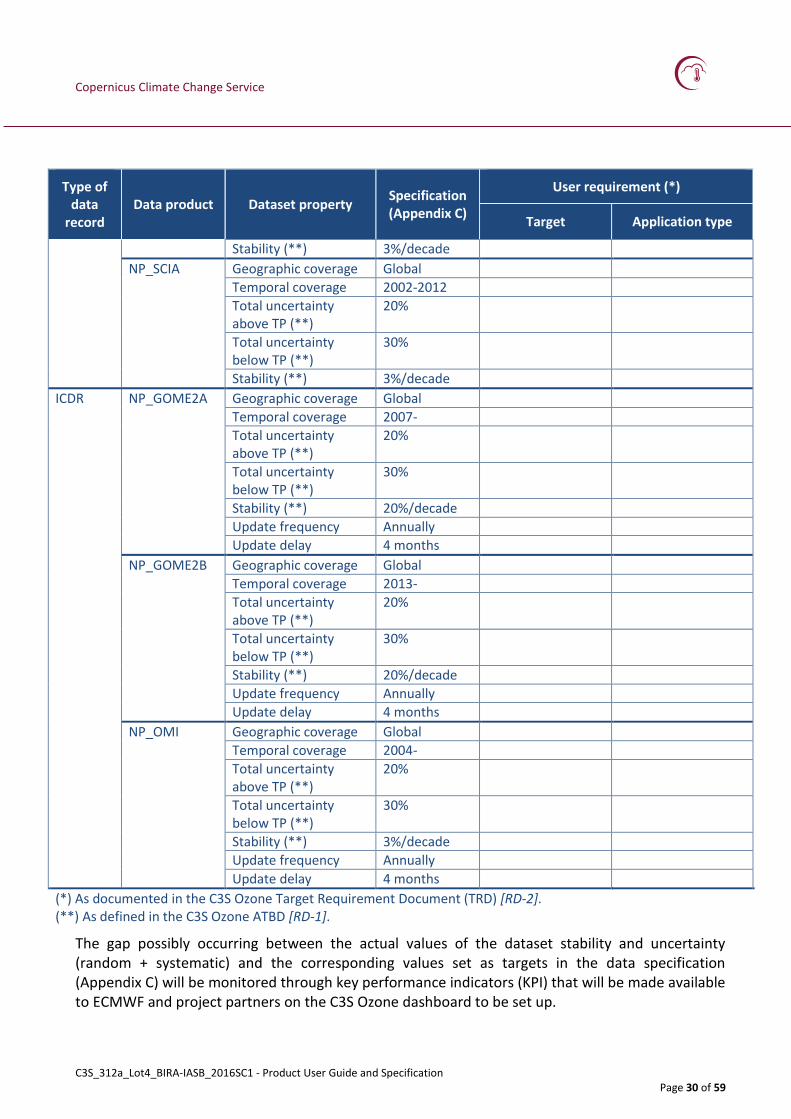
Table 14 lists selected dataset properties (Column 3) together with their values as set in the a priori data specification of Appendix C (Column 4) and the values required by users (Column 5), as collected in the C3S Ozone Target Requirement Document (TRD) [RD-2]. Column 6 shows the type of application for which the requirement holds.
Table 14. Selected properties of the ozone vertical profile monthly mean retrieved from UV-nadir sensors (Column 3) together with their specified and target values (Columns 4 and 5) and the type of application for which the requirement holds (Column 6).
Type of data
record Data product Dataset property
Specification (Appendix C)
User requirement (*)
Target Application type
CDR NP_GOME Geographic coverage Global (1) …
(2) …
(1) …
(2) …
Temporal coverage 1995-2011
Total uncertainty above TP (**)
20%
Total uncertainty below TP (**)
30%
Copernicus Climate Change Service
C3S_312a_Lot4_BIRA-IASB_2016SC1 - Product User Guide and Specification Page 30 of 59
Type of data
record Data product Dataset property
Specification (Appendix C)
User requirement (*)
Target Application type
Stability (**) 3%/decade
NP_SCIA Geographic coverage Global
Temporal coverage 2002-2012
Total uncertainty above TP (**)
20%
Total uncertainty below TP (**)
30%
Stability (**) 3%/decade
ICDR NP_GOME2A Geographic coverage Global
Temporal coverage 2007-
Total uncertainty above TP (**)
20%
Total uncertainty below TP (**)
30%
Stability (**) 20%/decade
Update frequency Annually
Update delay 4 months
NP_GOME2B Geographic coverage Global
Temporal coverage 2013-
Total uncertainty above TP (**)
20%
Total uncertainty below TP (**)
30%
Stability (**) 20%/decade
Update frequency Annually
Update delay 4 months
NP_OMI Geographic coverage Global
Temporal coverage 2004-
Total uncertainty above TP (**)
20%
Total uncertainty below TP (**)
30%
Stability (**) 3%/decade
Update frequency Annually
Update delay 4 months
(*) As documented in the C3S Ozone Target Requirement Document (TRD) [RD-2]. (**) As defined in the C3S Ozone ATBD [RD-1].
The gap possibly occurring between the actual values of the dataset stability and uncertainty (random + systematic) and the corresponding values set as targets in the data specification (Appendix C) will be monitored through key performance indicators (KPI) that will be made available to ECMWF and project partners on the C3S Ozone dashboard to be set up.
Copernicus Climate Change Service
C3S_312a_Lot4_BIRA-IASB_2016SC1 - Product User Guide and Specification Page 31 of 59
3.4 Data usage information
3.4.1 Data file content, format and names
Common datasets for all NetCDF output files are time, latitude, longitude, surface_pressure and pressure. Missing values in the dataset are indicated with the IEEE ’NaN’ values.
Time is given in seconds since some reference time. Since the L3 fields are monthly averages, the time is equal to the reference time, which has been set to the first day of the month. The fields lat and lon give the latitude and longitude of the L3 gridcell centers. Latitude varies between -90 and +90 and longitude between -180 and +180.
The surface pressure and air pressure fields are given in hPa and to obtain the full 3D pressure field, one should extend the surface pressure field in the third dimension with the air pressure field. The first entry from the air pressure field should not be used, since it is only a dummy entry for the surface pressure.
The NetCDF (partial) column datasets are
ozone_partial_column,
ozone_partial_column_standard_error,
total_ozone_column,
total_ozone_column_standard_error,
which are the profile in partial columns and its associated error (both in mol/m2/layer) and the total column and its associated error (both in mol/m2). If the original L2 data was given in number density, the weighted mean number density and its error and the volume mixing ratio and its error are also given as
ozone_concentration,
ozone_concentration_standard_error,
ozone_mixing_ratio,
ozone_mixing_ratio_standard_error.
The partial column datasets have been calculated for the layers between the number density levels. The full list with NetCDF variables can be found in Table 15.
Table 15. The variables in the NetCDF files containing ozone nadir profiles. Ntime, Nlayer, Np, Nlat and Nlon are number of time, layers, pressures levels, latitude and longitude zones, respectively.
Parameter and unit
Dimension and precision
Description
lon(degree East) float,
Nlon1
longitude, from -180 (west) to +180 (east) given at gridcell centers. NetCDF dimension
lat(degree North) float,
Nlat1
latitude, from -90 (south) to +90 (north) given at gridcell centers. NetCDF dimension
layers integer, Nlayer1 layer number, starting at 1. NetCDF dimension.
air_pressure (hPa) float,
Np1
air pressure at layer boundaries, replace the first element from this array with the corresponding surface pressure element. NetCDF dimension.
Copernicus Climate Change Service
C3S_312a_Lot4_BIRA-IASB_2016SC1 - Product User Guide and Specification Page 32 of 59
Parameter and unit
Dimension and precision
Description
time integer,
Ntime1
seconds since reference time, usually the start of the month. NetCDF dimension.
surface_pressure float,
Ntime Nlat Nlon
pressure at the bottom of the atmosphere
ozone partial column (mol/m
-2)
float,
Ntime NlayerNlat Nlon
weighted average of the partial ozone columns (mol/m2 per layer)
ozone partial column standard error (mol/m
-2)
float
Ntime NlayerNlat Nlon
error in the weighted average of the partial ozone columns (mol/m2 per layer)
total ozone column (mol/m
-2)
float,
Ntime Nlat Nlon
total column: vertically integrated ozone partial column dataset
total ozone column standard error (mol/m
-2)
float,
Ntime Nlat Nlon
total column error: quadratically added ozone partial column standard error
ozone mixing ratio(ppmv)
float
Ntime NpNlat Nlon
weighted average of the volume mixing ratio
ozone mixing ratio standard error(ppmv)
float,
Ntime NpNlat Nlon
error in the weighted average of the volume mixing ratio
ozone concentration (mol/m
-3)
float
Ntime NpNlat Nlon
weighted average of the ozone concentration
ozone concentration standard error (mol/m
-3)
float
Ntime NpNlat Nlon
error in the weighted average of the ozone concentration
3.4.2 Data v1 disclaimer
Known instrument related artefacts are known to be present in the UV-nadir ozone profiles (Version 1), which are being addressed for the next data release. The data should not yet be considered of climate quality.
Copernicus Climate Change Service
C3S_312a_Lot4_BIRA-IASB_2016SC1 - Product User Guide and Specification Page 33 of 59
4. L-3 ozone profile retrieved from limb and occultation sensors
4.1 Introduction
High-quality vertically-resolved satellite datasets are essential to assess the fate of atmospheric ozone and better understand its link with anthropogenic activities. For reliable estimates of ozone trends, long-term data records are needed in order to separate natural ozone variability (e.g. due to solar activity) and trends of anthropogenic origin. The data records proposed here combine a large number of high quality limb and occultation sensors covering a time-period suitable for trend evaluation. Ozone profile data are provided on an altitude grid or on a pressure grid depending on the native coordinate of the instrument. This ensures optimal accuracy and stability from all sensors. Ancillary information is provided with the data products to allow conversion from pressure to altitude when necessary. Merged data sets are also generated using on de-seasonalized anomalies computed from each individual dataset. The main advantage of this approach is that biases due to different sampling patterns (including e.g. the difference in local time) and instrumental biases are automatically removed, which makes these data ideal for long-term analysis.
4.2 Product description
4.2.1 The data set
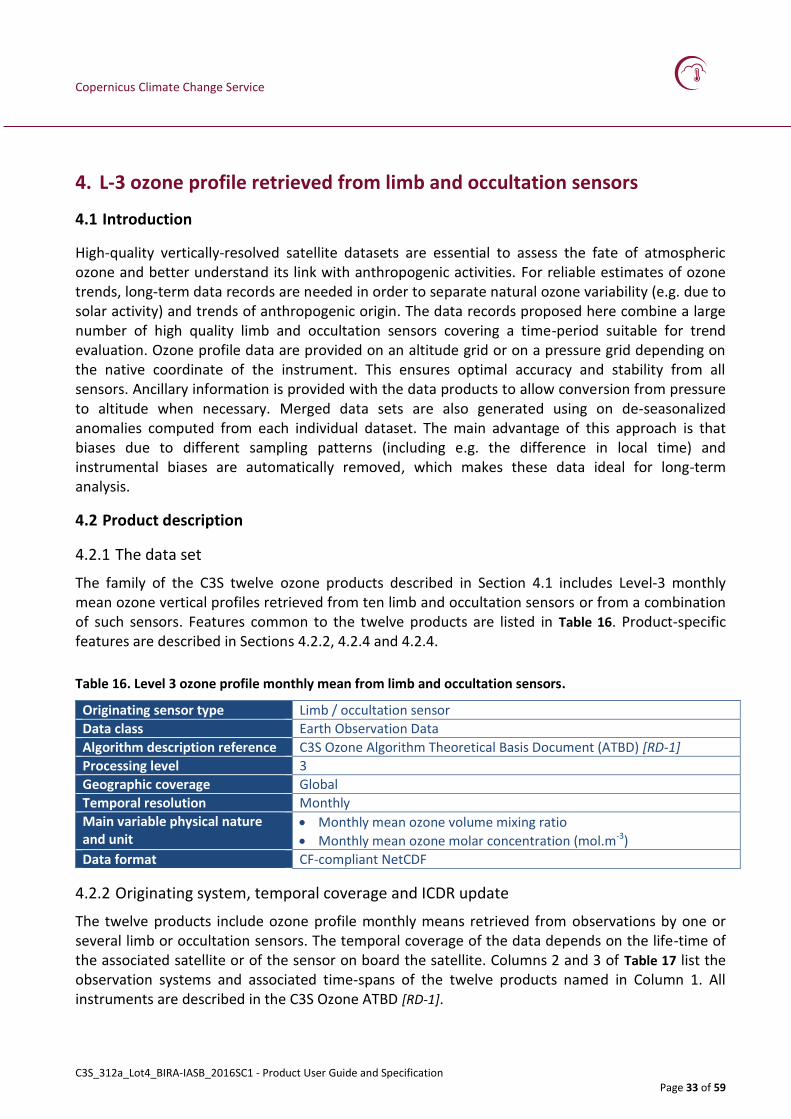
The family of the C3S twelve ozone products described in Section 4.1 includes Level-3 monthly mean ozone vertical profiles retrieved from ten limb and occultation sensors or from a combination of such sensors. Features common to the twelve products are listed in Table 16. Product-specific features are described in Sections 4.2.2, 4.2.4 and 4.2.4.
Table 16. Level 3 ozone profile monthly mean from limb and occultation sensors.
4.2.2 Originating system, temporal coverage and ICDR update
The twelve products include ozone profile monthly means retrieved from observations by one or several limb or occultation sensors. The temporal coverage of the data depends on the life-time of the associated satellite or of the sensor on board the satellite. Columns 2 and 3 of Table 17 list the observation systems and associated time-spans of the twelve products named in Column 1. All instruments are described in the C3S Ozone ATBD [RD-1].
Copernicus Climate Change Service
C3S_312a_Lot4_BIRA-IASB_2016SC1 - Product User Guide and Specification Page 34 of 59
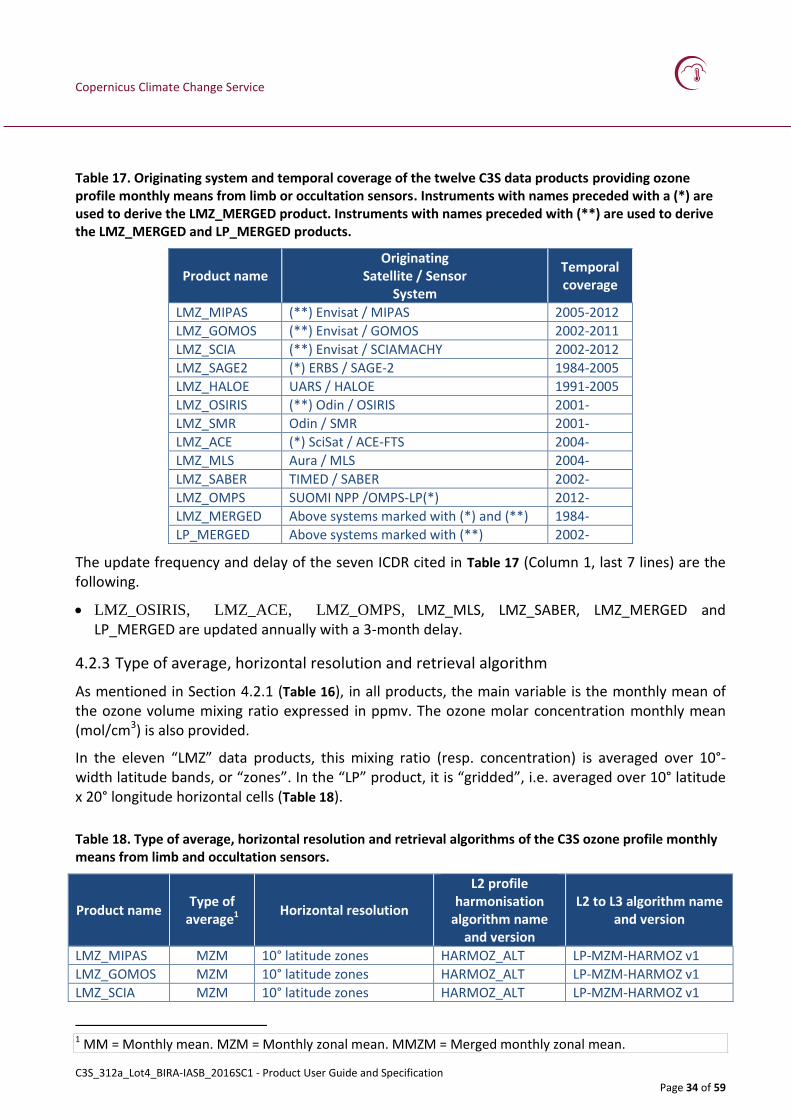
Table 17. Originating system and temporal coverage of the twelve C3S data products providing ozone profile monthly means from limb or occultation sensors. Instruments with names preceded with a (*) are used to derive the LMZ_MERGED product. Instruments with names preceded with (**) are used to derive the LMZ_MERGED and LP_MERGED products.
Product name Originating
Satellite / Sensor System
Temporal coverage
LMZ_MIPAS (**) Envisat / MIPAS 2005-2012
LMZ_GOMOS (**) Envisat / GOMOS 2002-2011
LMZ_SCIA (**) Envisat / SCIAMACHY 2002-2012
LMZ_SAGE2 (*) ERBS / SAGE-2 1984-2005
LMZ_HALOE UARS / HALOE 1991-2005
LMZ_OSIRIS (**) Odin / OSIRIS 2001-
LMZ_SMR Odin / SMR 2001-
LMZ_ACE (*) SciSat / ACE-FTS 2004-
LMZ_MLS Aura / MLS 2004-
LMZ_SABER TIMED / SABER 2002-
LMZ_OMPS SUOMI NPP /OMPS-LP(*) 2012-
LMZ_MERGED Above systems marked with (*) and (**) 1984-
LP_MERGED Above systems marked with (**) 2002-
The update frequency and delay of the seven ICDR cited in Table 17 (Column 1, last 7 lines) are the following.
LMZ_OSIRIS, LMZ_ACE, LMZ_OMPS, LMZ_MLS, LMZ_SABER, LMZ_MERGED and LP_MERGED are updated annually with a 3-month delay.
4.2.3 Type of average, horizontal resolution and retrieval algorithm
As mentioned in Section 4.2.1 (Table 16), in all products, the main variable is the monthly mean of the ozone volume mixing ratio expressed in ppmv. The ozone molar concentration monthly mean (mol/cm3) is also provided.
In the eleven “LMZ” data products, this mixing ratio (resp. concentration) is averaged over 10°-width latitude bands, or “zones”. In the “LP” product, it is “gridded”, i.e. averaged over 10° latitude x 20° longitude horizontal cells (Table 18).
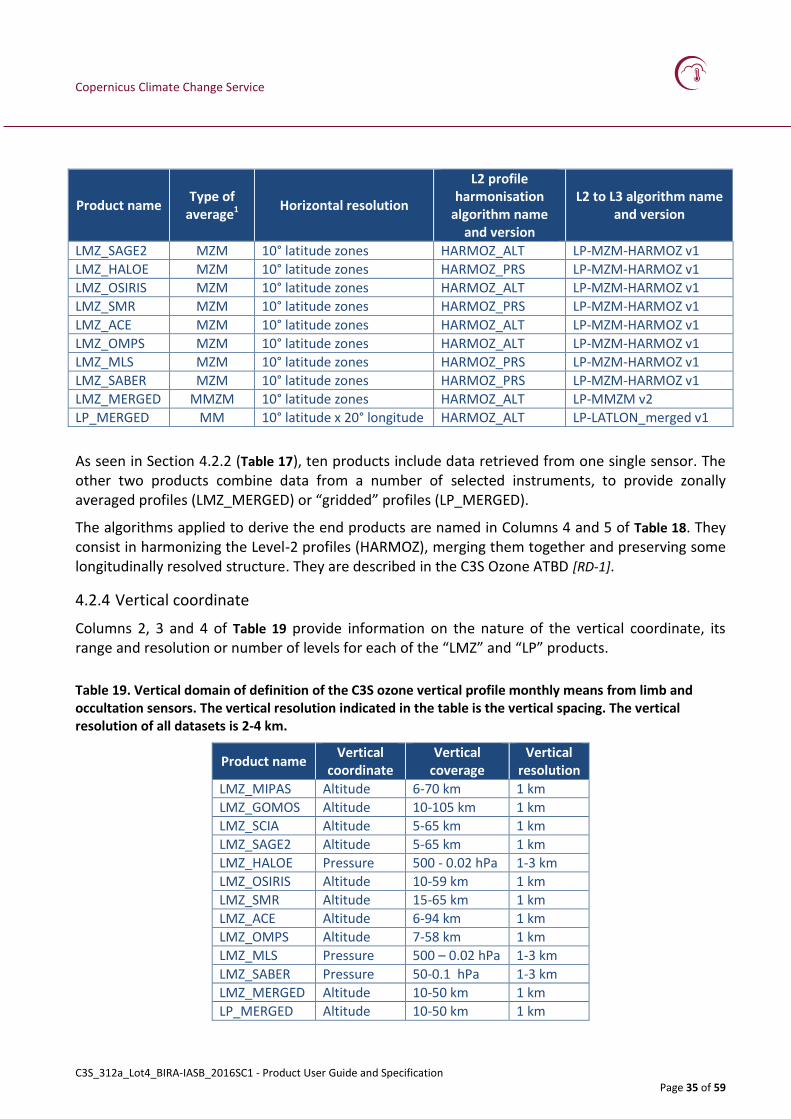
Table 18. Type of average, horizontal resolution and retrieval algorithms of the C3S ozone profile monthly means from limb and occultation sensors.
Product name Type of
average1 Horizontal resolution
L2 profile harmonisation
algorithm name and version
L2 to L3 algorithm name and version
LMZ_MIPAS MZM 10° latitude zones HARMOZ_ALT LP-MZM-HARMOZ v1
LMZ_GOMOS MZM 10° latitude zones HARMOZ_ALT LP-MZM-HARMOZ v1
LMZ_SCIA MZM 10° latitude zones HARMOZ_ALT LP-MZM-HARMOZ v1
C3S_312a_Lot4_BIRA-IASB_2016SC1 - Product User Guide and Specification Page 35 of 59
Product name Type of
average1 Horizontal resolution
L2 profile harmonisation
algorithm name and version
L2 to L3 algorithm name and version
LMZ_SAGE2 MZM 10° latitude zones HARMOZ_ALT LP-MZM-HARMOZ v1
LMZ_HALOE MZM 10° latitude zones HARMOZ_PRS LP-MZM-HARMOZ v1
LMZ_OSIRIS MZM 10° latitude zones HARMOZ_ALT LP-MZM-HARMOZ v1
LMZ_SMR MZM 10° latitude zones HARMOZ_PRS LP-MZM-HARMOZ v1
LMZ_ACE MZM 10° latitude zones HARMOZ_ALT LP-MZM-HARMOZ v1
LMZ_OMPS MZM 10° latitude zones HARMOZ_ALT LP-MZM-HARMOZ v1
LMZ_MLS MZM 10° latitude zones HARMOZ_PRS LP-MZM-HARMOZ v1
LMZ_SABER MZM 10° latitude zones HARMOZ_PRS LP-MZM-HARMOZ v1
LMZ_MERGED MMZM 10° latitude zones HARMOZ_ALT LP-MMZM v2
LP_MERGED MM 10° latitude x 20° longitude HARMOZ_ALT LP-LATLON_merged v1
As seen in Section 4.2.2 (Table 17), ten products include data retrieved from one single sensor. The other two products combine data from a number of selected instruments, to provide zonally averaged profiles (LMZ_MERGED) or “gridded” profiles (LP_MERGED).
The algorithms applied to derive the end products are named in Columns 4 and 5 of Table 18. They consist in harmonizing the Level-2 profiles (HARMOZ), merging them together and preserving some longitudinally resolved structure. They are described in the C3S Ozone ATBD [RD-1].
4.2.4 Vertical coordinate
Columns 2, 3 and 4 of Table 19 provide information on the nature of the vertical coordinate, its range and resolution or number of levels for each of the “LMZ” and “LP” products.
Table 19. Vertical domain of definition of the C3S ozone vertical profile monthly means from limb and occultation sensors. The vertical resolution indicated in the table is the vertical spacing. The vertical resolution of all datasets is 2-4 km.
Product name Vertical
coordinate Vertical
coverage Vertical
resolution
LMZ_MIPAS Altitude 6-70 km 1 km
LMZ_GOMOS Altitude 10-105 km 1 km
LMZ_SCIA Altitude 5-65 km 1 km
LMZ_SAGE2 Altitude 5-65 km 1 km
LMZ_HALOE Pressure 500 - 0.02 hPa 1-3 km
LMZ_OSIRIS Altitude 10-59 km 1 km
LMZ_SMR Altitude 15-65 km 1 km
LMZ_ACE Altitude 6-94 km 1 km
LMZ_OMPS Altitude 7-58 km 1 km
LMZ_MLS Pressure 500 – 0.02 hPa 1-3 km
LMZ_SABER Pressure 50-0.1 hPa 1-3 km
LMZ_MERGED Altitude 10-50 km 1 km
LP_MERGED Altitude 10-50 km 1 km
Copernicus Climate Change Service
C3S_312a_Lot4_BIRA-IASB_2016SC1 - Product User Guide and Specification Page 36 of 59
For climate studies, it is preferable to use only the information provided in the dataset (and avoid as much as possible using the data from models and reanalyses). For majority of limb and occultation instruments (SAGE II, GOMOS, OSIRIS, SCIAMACHY, SMR, ACE-FTS, MIPAS, OMPS), ozone profiles are retrieved on altitude grid. MLS, HALOE and SABER provide mixing ratio of pressure grid. Therefore, the monthly zonal mean have the same “native” representation as original ozone profiles: ozone molar concentration (mol m-3) on altitude grid or ozone mixing ratio on pressure grid (Table 19). The molar concentration values are also provided in pressure-gridded files. Additional average parameters: mean temperature, pressure/altitude profiles are provided in all filres.
The merged ozone profiles are ozone concentrations on altitude grid. To avoid ozone diurnal variations, merged ozone datasets cover the stratospheric altitude range from 10 to 50 km.
4.2.5 Ancillary data
The limb and occultation instruments use the minimum a priori information in retrievals. If the temperature profiles are not retrieved (limb-scattering and UV-VIS occultation instruments), the meteorological model/reanalysis data are used for ray tracing and computing refractive effects. However, this has a rather small impact on ozone profiles in the stratosphere (< 1 %). All European instruments use ECMWF air density and temperature fields for these computations, while SAGE II uses MERRA reanalysis data.
In addition, ozone cross-sections are used in ozone retrievals. More details on ancillary data used in retrievals from limb and occultation instruments are provided in [RD-1].
4.2.6 Bias corrections
The biases between instruments are eliminated using deseasonalized anomalies. The profiles of merged deseasonalized anomalies can be directly used for assessment of ozone trends. For the merged monthly zonal mean dataset, the data before 2001 are from SAGE II solely. Therefore, the absolute ozone values are adjusted to the mean of SAGE II and OSIRIS ozone profiles in 2002-2005 (which nearly coincide also with GOMOS data).
4.3 Target requirements
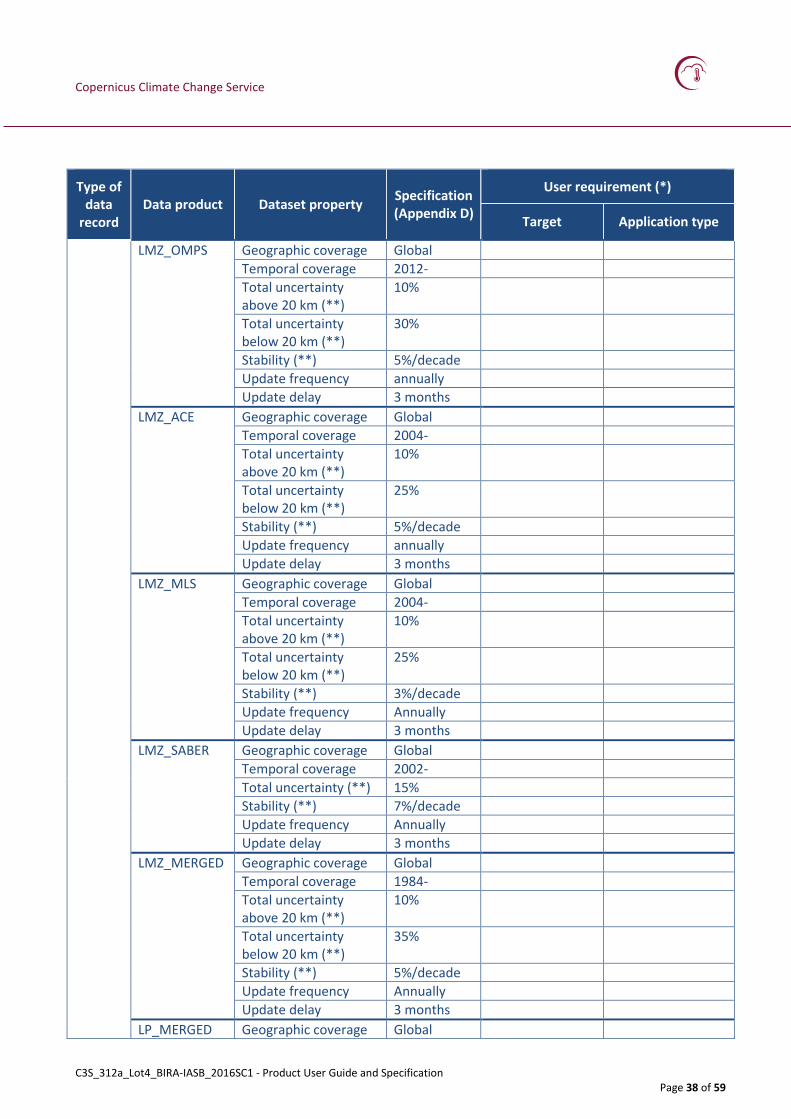
Table 20 lists selected dataset properties (Column 3) together with their values as set in the a priori data specification of Appendix D (Column 4) and the values required by users (Column 5), as collected in the C3S Ozone Target Requirement Document (TRD) [RD-2]. Column 6 shows the type of application for which the requirement holds.
Table 20. Selected properties of the ozone vertical profile monthly mean retrieved from limb and occultation sensors (Column 3) together with their specified and target values (Columns 4 and 5) and the type of application for which the requirement holds (Column 6).
Type of data
record Data product Dataset property
Specification (Appendix D)
User requirement (*)
Target Application type
CDR LMZ_MIPAS Geographic coverage Global (1) …
(2) …
(1) …
(2) …
Copernicus Climate Change Service
C3S_312a_Lot4_BIRA-IASB_2016SC1 - Product User Guide and Specification Page 37 of 59
Type of data
record Data product Dataset property
Specification (Appendix D)
User requirement (*)
Target Application type
Temporal coverage 2005-2012
Total uncertainty above 20 km (**)
10%
Total uncertainty below 20 km (**)
30%
Stability (**) 5%/decade
LMZ_GOMOS Geographic coverage Global
Temporal coverage 2002-2012
Total uncertainty above 20 km (**)
10%
Total uncertainty below 20 km (**)
50%
Stability (**) 7%/decade
LMZ_SCIA Geographic coverage Global
Temporal coverage 2002-2012
Total uncertainty above 20 km (**)
15%
Total uncertainty below 20 km (**)
30%
Stability (**) 7%/decade
LMZ_SAGE2 Geographic coverage Global
Temporal coverage 1984-2005
Total uncertainty above 20 km (**)
10%
Total uncertainty below 20 km (**)
40%
Stability (**) 3%/decade
LMZ_HALOE Geographic coverage Global
Temporal coverage 1991-2005
Total uncertainty above 20 km (**)
10%
Total uncertainty below 20 km (**)
40%
Stability (**) 5%/decade
ICDR LMZ_OSIRIS Geographic coverage Global
Temporal coverage 2001-
Total uncertainty above 20 km (**)
10%
Total uncertainty below 20 km (**)
30%
Stability (**) 5%/decade
Update frequency annually
Update delay 3 months
Copernicus Climate Change Service
C3S_312a_Lot4_BIRA-IASB_2016SC1 - Product User Guide and Specification Page 38 of 59
Type of data
record Data product Dataset property
Specification (Appendix D)
User requirement (*)
Target Application type
LMZ_OMPS Geographic coverage Global
Temporal coverage 2012-
Total uncertainty above 20 km (**)
10%
Total uncertainty below 20 km (**)
30%
Stability (**) 5%/decade
Update frequency annually
Update delay 3 months
LMZ_ACE Geographic coverage Global
Temporal coverage 2004-
Total uncertainty above 20 km (**)
10%
Total uncertainty below 20 km (**)
25%
Stability (**) 5%/decade
Update frequency annually
Update delay 3 months
LMZ_MLS Geographic coverage Global
Temporal coverage 2004-
Total uncertainty above 20 km (**)
10%
Total uncertainty below 20 km (**)
25%
Stability (**) 3%/decade
Update frequency Annually
Update delay 3 months
LMZ_SABER Geographic coverage Global
Temporal coverage 2002-
Total uncertainty (**) 15%
Stability (**) 7%/decade
Update frequency Annually
Update delay 3 months
LMZ_MERGED Geographic coverage Global
Temporal coverage 1984-
Total uncertainty above 20 km (**)
10%
Total uncertainty below 20 km (**)
35%
Stability (**) 5%/decade
Update frequency Annually
Update delay 3 months
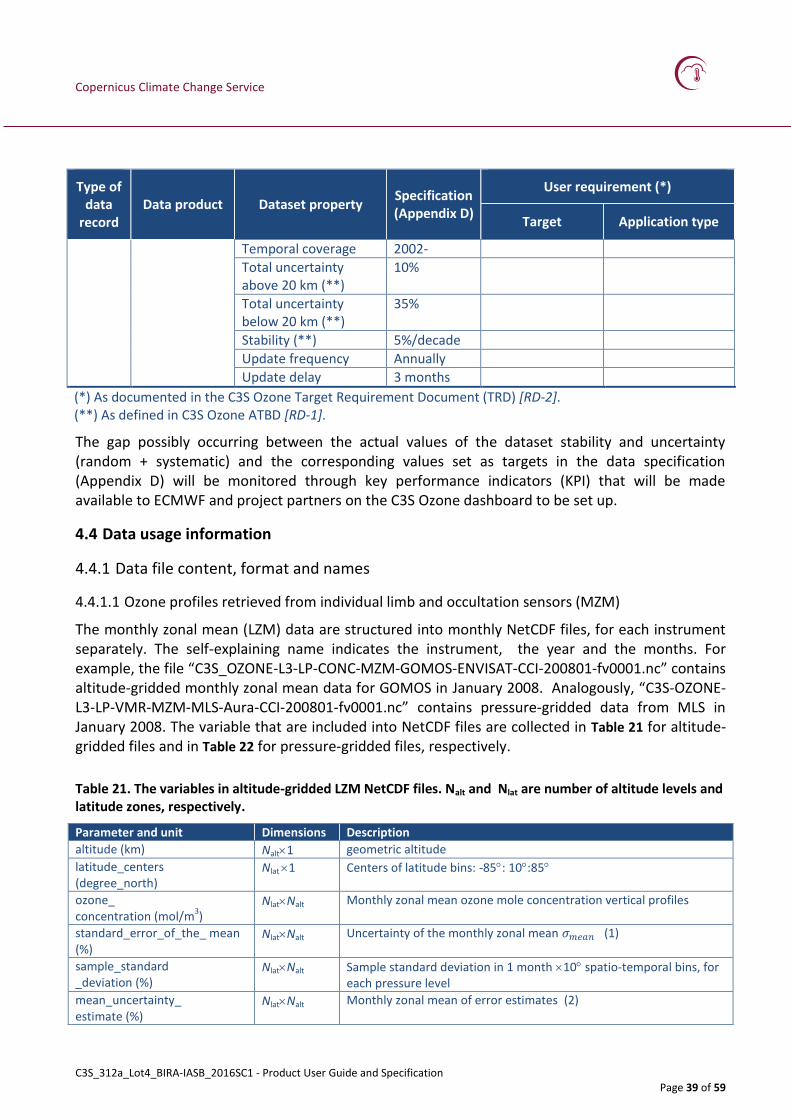
LP_MERGED Geographic coverage Global
Copernicus Climate Change Service
C3S_312a_Lot4_BIRA-IASB_2016SC1 - Product User Guide and Specification Page 39 of 59
Type of data
record Data product Dataset property
Specification (Appendix D)
User requirement (*)
Target Application type
Temporal coverage 2002-
Total uncertainty above 20 km (**)
10%
Total uncertainty below 20 km (**)
35%
Stability (**) 5%/decade
Update frequency Annually
Update delay 3 months
(*) As documented in the C3S Ozone Target Requirement Document (TRD) [RD-2]. (**) As defined in C3S Ozone ATBD [RD-1].
The gap possibly occurring between the actual values of the dataset stability and uncertainty (random + systematic) and the corresponding values set as targets in the data specification (Appendix D) will be monitored through key performance indicators (KPI) that will be made available to ECMWF and project partners on the C3S Ozone dashboard to be set up.
4.4 Data usage information
4.4.1 Data file content, format and names
4.4.1.1 Ozone profiles retrieved from individual limb and occultation sensors (MZM)
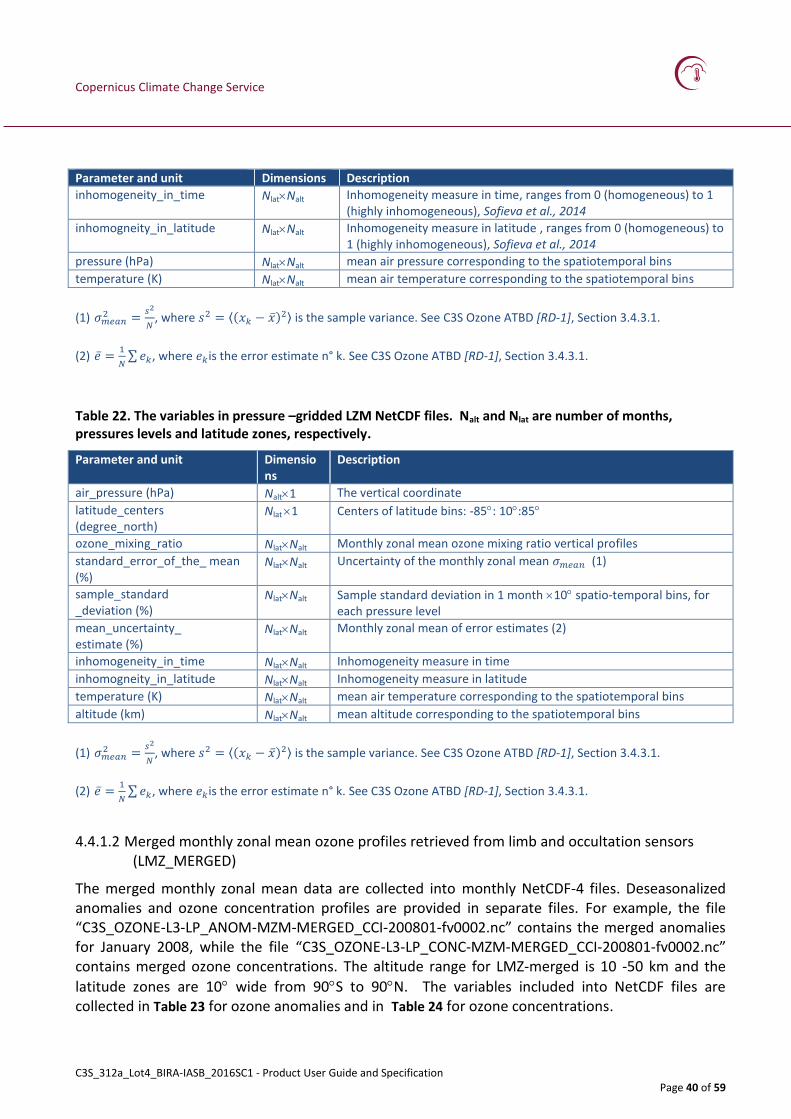
The monthly zonal mean (LZM) data are structured into monthly NetCDF files, for each instrument separately. The self-explaining name indicates the instrument, the year and the months. For example, the file “C3S_OZONE-L3-LP-CONC-MZM-GOMOS-ENVISAT-CCI-200801-fv0001.nc” contains altitude-gridded monthly zonal mean data for GOMOS in January 2008. Analogously, “C3S-OZONE-L3-LP-VMR-MZM-MLS-Aura-CCI-200801-fv0001.nc” contains pressure-gridded data from MLS in January 2008. The variable that are included into NetCDF files are collected in Table 21 for altitude-gridded files and in Table 22 for pressure-gridded files, respectively.
Table 21. The variables in altitude-gridded LZM NetCDF files. Nalt and Nlat are number of altitude levels and latitude zones, respectively.
Parameter and unit Dimensions Description
altitude (km) Nalt1 geometric altitude
latitude_centers (degree_north)
Nlat 1 Centers of latitude bins: -85: 10:85
ozone_ concentration (mol/m
3)
NlatNalt Monthly zonal mean ozone mole concentration vertical profiles
standard_error_of_the_ mean (%)
NlatNalt Uncertainty of the monthly zonal mean 𝜎𝑚𝑒𝑎𝑛 (1)
sample_standard _deviation (%)
NlatNalt Sample standard deviation in 1 month 10 spatio-temporal bins, for each pressure level
mean_uncertainty_ estimate (%)
NlatNalt Monthly zonal mean of error estimates (2)
Copernicus Climate Change Service
C3S_312a_Lot4_BIRA-IASB_2016SC1 - Product User Guide and Specification Page 40 of 59
Parameter and unit Dimensions Description
inhomogeneity_in_time NlatNalt Inhomogeneity measure in time, ranges from 0 (homogeneous) to 1 (highly inhomogeneous), Sofieva et al., 2014
inhomogneity_in_latitude NlatNalt Inhomogeneity measure in latitude , ranges from 0 (homogeneous) to 1 (highly inhomogeneous), Sofieva et al., 2014
pressure (hPa) NlatNalt mean air pressure corresponding to the spatiotemporal bins
temperature (K) NlatNalt mean air temperature corresponding to the spatiotemporal bins
(1) 𝜎𝑚𝑒𝑎𝑛2 =
𝑠2
𝑁, where 𝑠2 = ⟨(𝑥𝑘 − �̅�)2⟩ is the sample variance. See C3S Ozone ATBD [RD-1], Section 3.4.3.1.
(2) �̅� =1
𝑁∑𝑒𝑘, where 𝑒𝑘is the error estimate n° k. See C3S Ozone ATBD [RD-1], Section 3.4.3.1.
Table 22. The variables in pressure –gridded LZM NetCDF files. Nalt and Nlat are number of months, pressures levels and latitude zones, respectively.
Parameter and unit Dimensions
Description
air_pressure (hPa) Nalt1 The vertical coordinate
latitude_centers (degree_north)
Nlat 1 Centers of latitude bins: -85: 10:85
ozone_mixing_ratio NlatNalt Monthly zonal mean ozone mixing ratio vertical profiles
standard_error_of_the_ mean (%)
NlatNalt Uncertainty of the monthly zonal mean 𝜎𝑚𝑒𝑎𝑛 (1)
sample_standard _deviation (%)
NlatNalt Sample standard deviation in 1 month 10 spatio-temporal bins, for each pressure level
mean_uncertainty_ estimate (%)
NlatNalt Monthly zonal mean of error estimates (2)
inhomogeneity_in_time NlatNalt Inhomogeneity measure in time
inhomogneity_in_latitude NlatNalt Inhomogeneity measure in latitude
temperature (K) NlatNalt mean air temperature corresponding to the spatiotemporal bins
altitude (km) NlatNalt mean altitude corresponding to the spatiotemporal bins
(1) 𝜎𝑚𝑒𝑎𝑛2 =
𝑠2
𝑁, where 𝑠2 = ⟨(𝑥𝑘 − �̅�)2⟩ is the sample variance. See C3S Ozone ATBD [RD-1], Section 3.4.3.1.
(2) �̅� =1
𝑁∑𝑒𝑘, where 𝑒𝑘is the error estimate n° k. See C3S Ozone ATBD [RD-1], Section 3.4.3.1.
4.4.1.2 Merged monthly zonal mean ozone profiles retrieved from limb and occultation sensors (LMZ_MERGED)
The merged monthly zonal mean data are collected into monthly NetCDF-4 files. Deseasonalized anomalies and ozone concentration profiles are provided in separate files. For example, the file “C3S_OZONE-L3-LP_ANOM-MZM-MERGED_CCI-200801-fv0002.nc” contains the merged anomalies for January 2008, while the file “C3S_OZONE-L3-LP_CONC-MZM-MERGED_CCI-200801-fv0002.nc” contains merged ozone concentrations. The altitude range for LMZ-merged is 10 -50 km and the
latitude zones are 10 wide from 90S to 90N. The variables included into NetCDF files are collected in Table 23 for ozone anomalies and in Table 24 for ozone concentrations.
Copernicus Climate Change Service
C3S_312a_Lot4_BIRA-IASB_2016SC1 - Product User Guide and Specification Page 41 of 59
Table 23. The variables in LMZ_merged NetCDF files with deseasonalized anomalies. Nalt and Nlat are number of altitude levels and latitude zones, respectively.
Parameter and unit Dimensions Description
Gen
eral
par
amet
ers
time (days since 1984-01-01) Ndate1 one data point for each month: on the 1st of the month
altitude (km) Nalt1 geometric altitude
latitude_centers (degrees_north)
Nlat 1 Centers of latitude bins: -85: 10:85
instruments Ninstru1 A dimension for individual datasets, instrument order 1-GOMOS, 2-MIPAS, 3-SCIAMACHY, 4-OSIRIS, 5-ACE-FTS , 6-OMPS, 7-SAGEII
Mer
ged
dat
a
merged_ozone_anomaly (%) NaltNlat Merged deseasonalized anomalies, see ATBD for details
merged_ozone_concentration (mol/m3) NaltNlat Vertical profiles of merged monthly zonal
mean ozone mole concentration.
uncertainty_of_ merged_ozone_anomaly (%)
NaltNlat Uncertainty of the merged data
pressure (hPa) NaltNlat Mean pressure corresponding to spatiotemporal bins
Temperature (K) NaltNlat Mean temperature corresponding to spatiotemporal bins
Ind
ivid
ual
dat
aset
s
ozone_anomaly_instrument (%) NaltNlatNinstru Deseasonalized anomalies of ozone from individual instruments
Uncertainty_of_ozone_anomaly_instrument (%)
NaltNlatNinstru Uncertainty of deseasonalized anomalies individual datasets
Table 24. The variables in LMZ_merged NetCDF files with ozone concentrations. Nalt and Nlat are number of altitude levels and latitude zones, respectively.
Parameter and unit Dimensions Description
Gen
eral
par
amet
ers altitude (km) Nalt1 geometric altitude
latitude_centers (degrees_north)
Nlat 1 Centers of latitude bins: -85: 10:85
instruments Ninstru1 A dimension for individual datasets, instrument order 1-GOMOS, 2-MIPAS, 3-SCIAMACHY, 4-OSIRIS, 5-ACE-FTS, 6-OMPS, 7-SAGEII
Mer
ged
dat
a
merged_ozone_concentration (mol/m3) NaltNlat Vertical profiles of merged monthly zonal
mean ozone mole concentration.
uncertainty_of_ merged_ozone_concentration(mol/m
3)
NaltNlat Uncertainty of the merged data
pressure (hPa) NaltNlat Mean pressure corresponding to spatiotemporal bins
Temperature (K) NaltNlat Mean temperature corresponding to spatiotemporal bins
Copernicus Climate Change Service
C3S_312a_Lot4_BIRA-IASB_2016SC1 - Product User Guide and Specification Page 42 of 59
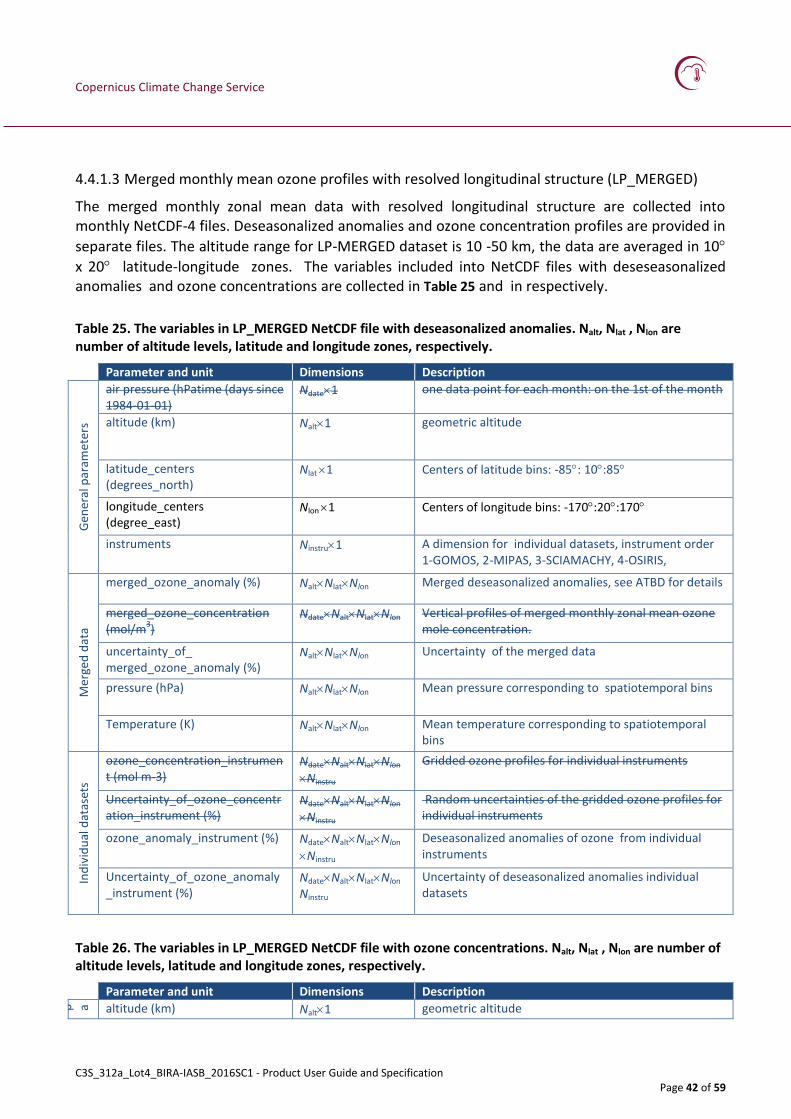
4.4.1.3 Merged monthly mean ozone profiles with resolved longitudinal structure (LP_MERGED)
The merged monthly zonal mean data with resolved longitudinal structure are collected into monthly NetCDF-4 files. Deseasonalized anomalies and ozone concentration profiles are provided in
separate files. The altitude range for LP-MERGED dataset is 10 -50 km, the data are averaged in 10
x 20 latitude-longitude zones. The variables included into NetCDF files with deseseasonalized anomalies and ozone concentrations are collected in Table 25 and in respectively.
Table 25. The variables in LP_MERGED NetCDF file with deseasonalized anomalies. Nalt, Nlat , Nlon are number of altitude levels, latitude and longitude zones, respectively.
Parameter and unit Dimensions Description
Gen
eral
par
amet
ers
air pressure (hPatime (days since 1984-01-01)
Ndate1 one data point for each month: on the 1st of the month
altitude (km) Nalt1 geometric altitude
latitude_centers (degrees_north)
Nlat 1 Centers of latitude bins: -85: 10:85
longitude_centers (degree_east)
Nlon 1 Centers of longitude bins: -170:20:170
instruments Ninstru1 A dimension for individual datasets, instrument order 1-GOMOS, 2-MIPAS, 3-SCIAMACHY, 4-OSIRIS,
Mer
ged
dat
a
merged_ozone_anomaly (%) NaltNlatNlon Merged deseasonalized anomalies, see ATBD for details
merged_ozone_concentration (mol/m
3)
NdateNaltNlatNlon Vertical profiles of merged monthly zonal mean ozone mole concentration.
uncertainty_of_ merged_ozone_anomaly (%)
NaltNlatNlon Uncertainty of the merged data
pressure (hPa) NaltNlatNlon Mean pressure corresponding to spatiotemporal bins
Temperature (K) NaltNlatNlon Mean temperature corresponding to spatiotemporal bins
Ind
ivid
ual
dat
aset
s
ozone_concentration_instrument (mol m-3)
NdateNaltNlatNlon
Ninstru
Gridded ozone profiles for individual instruments
Uncertainty_of_ozone_concentration_instrument (%)
NdateNaltNlatNlon
Ninstru
Random uncertainties of the gridded ozone profiles for individual instruments
ozone_anomaly_instrument (%) NdateNaltNlatNlon
Ninstru
Deseasonalized anomalies of ozone from individual instruments
Uncertainty_of_ozone_anomaly_instrument (%)
NdateNaltNlatNlon
Ninstru
Uncertainty of deseasonalized anomalies individual datasets
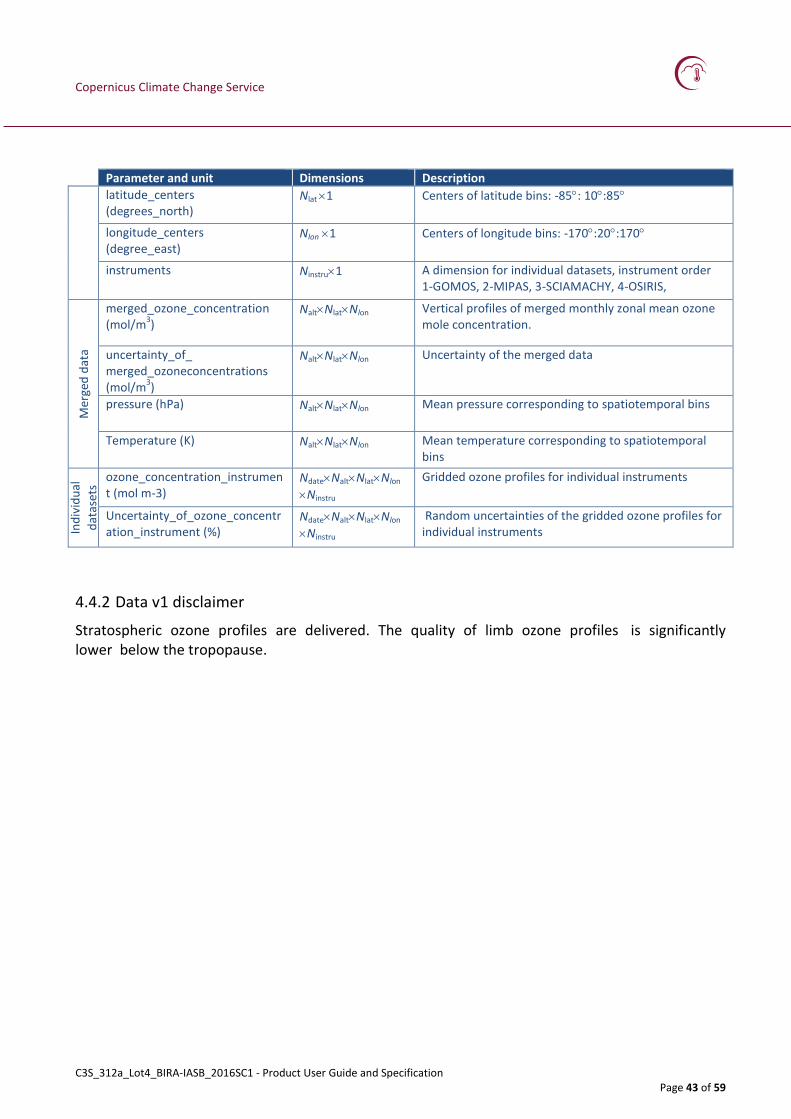
Table 26. The variables in LP_MERGED NetCDF file with ozone concentrations. Nalt, Nlat , Nlon are number of altitude levels, latitude and longitude zones, respectively.
Parameter and unit Dimensions Description
G e n e r a l p a r a m e t e r s altitude (km) Nalt1 geometric altitude
Copernicus Climate Change Service
C3S_312a_Lot4_BIRA-IASB_2016SC1 - Product User Guide and Specification Page 43 of 59
Parameter and unit Dimensions Description
latitude_centers (degrees_north)
Nlat 1 Centers of latitude bins: -85: 10:85
longitude_centers (degree_east)
Nlon 1 Centers of longitude bins: -170:20:170
instruments Ninstru1 A dimension for individual datasets, instrument order 1-GOMOS, 2-MIPAS, 3-SCIAMACHY, 4-OSIRIS,
Mer
ged
dat
a
merged_ozone_concentration (mol/m
3)
NaltNlatNlon Vertical profiles of merged monthly zonal mean ozone mole concentration.
uncertainty_of_ merged_ozoneconcentrations (mol/m
3)
NaltNlatNlon Uncertainty of the merged data
pressure (hPa) NaltNlatNlon Mean pressure corresponding to spatiotemporal bins
Temperature (K) NaltNlatNlon Mean temperature corresponding to spatiotemporal bins
Ind
ivid
ual
dat
aset
s
ozone_concentration_instrument (mol m-3)
NdateNaltNlatNlon
Ninstru
Gridded ozone profiles for individual instruments
Uncertainty_of_ozone_concentration_instrument (%)
NdateNaltNlatNlon
Ninstru
Random uncertainties of the gridded ozone profiles for individual instruments
4.4.2 Data v1 disclaimer
Stratospheric ozone profiles are delivered. The quality of limb ozone profiles is significantly lower below the tropopause.
Copernicus Climate Change Service
C3S_312a_Lot4_BIRA-IASB_2016SC1 - Product User Guide and Specification Page 44 of 59
5. Data access information
The Level-3 and Level-4 data products generated by the C3S Ozone project partners will be stored as they are produced in the Ozone CDR Central Data Base to be set up at BIRA-IASB (Figure 2). Data products will be distributed through the C3S Data Toolbox developed at ECMWF, via a two-way system of query and data flow to be set up.
Figure 2 – C3S ozone data flow.
The main source of documentation on the C3S Ozone data products is the C3S Ozone ATBD [RD-1].
Information and support from the data suppliers can be found as detailed in Table 27. Details of the upstream Level-2 data developers are provided in Table 28.
Table 27. C3S ozone data provider details.
L-3 ozone total columns retrieved from UV nadir sensors
Data product provider German Aerospace Centre (DLR)
Data product names TC_GOME TC_SCIA
TC_GOME2A TC_GOME2B
TC_OMI TC_GTO-ECV
Link(s) to documentation /
Copernicus Climate Change Service
C3S_312a_Lot4_BIRA-IASB_2016SC1 - Product User Guide and Specification Page 45 of 59
C3S_312a_Lot4_BIRA-IASB_2016SC1 - Product User Guide and Specification Page 48 of 59
Appendix A. Specifications for the L-3 and L-4 ozone total columns retrieved from UV-nadir sensors
This family of seven C3S ozone products includes Level-3 and Level-4 monthly mean total columns retrieved from UV nadir satellite observations. Data are from individual sensors, merged or the outcome of multi-sensor reanalysis by data assimilation (see dataset description in Section 1.1). The data product series v1 specification is provided in Table 29.
Table 29. Specification of the Level 3 and Level 4 ozone total column monthly mean from UV-nadir sensors.
Property Specification
Data product names TC_GOME
TC_SCIA
TC_GOME2A
TC_GOME2B
TC_OMI
TC_GTO-ECV
TC_MSR
Data class Earth Observation Data
Originating satellite/instrument systems
TC_GOME ERS-2/GOME
TC_SCIA Envisat/SCIAMACHY
TC_GOME2A Metop-A/GOME-2
TC_GOME2B Metop-B/GOME-2
TC_OMI Aura/OMI
TC_GTO-ECV All the above
TC_MSR All the above + Nimbus4/BUV, Nimbus7/TOMS, EP/TOMS, SBUV series, NPP/OMPS
Main variable physical nature & unit Monthly mean ozone total column (mol m-2)
Processing level TC_GOME 3
TC_SCIA 3
TC_GOME2A 3
TC_GOME2B 3
TC_OMI 3
TC_GTO-ECV 3
TC_MSR 4
Temporal coverage TC_GOME 1995-2011
TC_SCIA 2002-2012
TC_GOME2A 2007-
TC_GOME2B 2013-
TC_OMI 2004-
TC_GTO-ECV 1995-
TC_MSR 1970-
Temporal resolution Monthly
Copernicus Climate Change Service
C3S_312a_Lot4_BIRA-IASB_2016SC1 - Product User Guide and Specification Page 49 of 59
Geographic coverage Global
Horizontal resolution 1° longitude x 1° latitude
Maximum random error 2%
Maximum systematic error TC_GOME 3%
TC_SCIA 3%
TC_GOME2A 3%
TC_GOME2B 3%
TC_OMI 3%
TC_GTO-ECV 3%
TC_MSR 1%
Maximum sampling error (accounted for in the systematic error)
TC_GOME 2%
TC_SCIA 2%
TC_GOME2A 1%
TC_GOME2B 1%
TC_OMI 1%
TC_GTO-ECV 2%
Stability (maximum drift) 1%/decade
ICDR update frequency TC_GOME2A Quarterly
TC_GOME2B Quarterly
TC_OMI Quarterly
TC_GTO-ECV Semi-annually
TC_MSR Annually
ICDR update delay TC_GOME2A 4 months
TC_GOME2B 4 months
TC_OMI 4 months
TC_GTO-ECV 4 months
TC_MSR 3 months
Data format CF-compliant NetCDF
Copernicus Climate Change Service
C3S_312a_Lot4_BIRA-IASB_2016SC1 - Product User Guide and Specification Page 50 of 59
Appendix B. Specifications for the L-3 ozone total and tropospheric columns retrieved from IASI
This C3S ozone product includes Level-3 monthly mean total and tropospheric columns retrieved from observations by IASI (see dataset description in Section 2.1). The data product v1 specification is provided in Table 30. The drift and total error ceilings are provisional estimates based on the error budget of the Level 2 datasets [RD-10].
Table 30. Specification of the Level 3 ozone total and tropospheric column monthly mean from IASI.
Property Specification
Data product name TC_IASIA
TC_IASIB
06TC_IASIA
06TC_IASIB
Data class Earth Observation Data
Originating satellite/instrument system TC_IASIA/06TC_IASIA Metop-A/IASI TC_IASIB/06TC_IASIB Metop-B/IASI
C3S_312a_Lot4_BIRA-IASB_2016SC1 - Product User Guide and Specification Page 51 of 59
Appendix C. Specifications for the L-3 ozone profiles retrieved from UV-nadir sensors
This family of five C3S ozone products includes Level-3 monthly mean profiles retrieved from UV nadir satellite observations. Data are from five individual sensors (see dataset description in Section 3.1). The data product series v1 specification is provided in Table 31. The drift and total error ceilings are provisional estimates based on the error budget of the Level 2 datasets [RD-10].
Table 31. Specification of the Level 3 ozone profile monthly mean from UV-nadir sensors.
Main variable physical nature & unit Monthly mean ozone molecular number density (cm-3) Monthly mean ozone volume mixing ratio (ppmv)
Processing level 3
Temporal coverage NP_GOME 1995-2011
NP_SCIA 2002-2012
NP_GOME2A 2007-
NP_GOME2B 2013-
NP_OMI 2004-
Temporal resolution Monthly
Geographic coverage Global
Horizontal resolution 1° longitude x 1° latitude
Vertical coordinate and unit pressure (hPa)
Vertical coverage from surface to TOA
Vertical grid levels at surface and at 450, 170, 100, 50, 30, 20, 10, 5, 3, 2, 1, 0.5, 0.3, 0.17, 0.1, 0.05, 0.03, 0.017 and 0.01 hPa. (i.e. the L2 retrieval levels)
Maximum total error (random + systematic)
Above tropopause: 20% Below tropopause: 30%
Stability (maximum drift) NP_GOME 3%/decade
NP_SCIA 3%/decade
NP_GOME2A 20%/decade
Copernicus Climate Change Service
C3S_312a_Lot4_BIRA-IASB_2016SC1 - Product User Guide and Specification Page 52 of 59
NP_GOME2B 20%/decade
NP_OMI 3%/decade
ICDR update frequency NP_GOME2A Annually
NP_GOME2B Annually
NP_OMI Annually
ICDR update delay NP_GOME2A 4 months
NP_GOME2B 4 months
NP_OMI 4 months
Data format CF-compliant NetCDF
Copernicus Climate Change Service
C3S_312a_Lot4_BIRA-IASB_2016SC1 - Product User Guide and Specification Page 53 of 59
Appendix D. Specifications for the L-3 ozone profiles retrieved from limb and occultation sensors
This family of twelve C3S ozone products includes Level-3 monthly mean profiles retrieved from limb and occultation satellite observations. Data are from individual sensors or merged (see dataset description in Section 4.1). The data product v1 series specification is provided in Table 32. The drift and total error ceilings are provisional estimates based on the error budget of the Level 2 datasets [RD-10].
Table 32. Specification of the Level 3 ozone profile monthly mean from limb and occultation sensors.
Property Specification
Data product names LMZ_MIPAS
LMZ_GOMOS
LMZ_SCIA
LMZ_SAGE2
LMZ_HALOE
LMZ_OSIRIS
LMZ_SMR
LMZ_ACE
LMZ_OMPS
LMZ_MLS
LMZ_SABER
LMZ_MERGED
LP_MERGED
Data class Earth Observation Data
Originating satellite/instrument systems
LMZ_MIPAS Envisat/MIPAS
LMZ_GOMOS Envisat/GOMOS
LMZ_SCIA Envisat/SCIAMACHY
LMZ_SAGE2 ERBS/SAGE-2
LMZ_HALOE UARS/HALOE
LMZ_OSIRIS Odin/OSIRIS
LMZ_SMR Odin/SMR
LMZ_ACE SciSat/ACE-FTS
LMZ_MLS Aura/MLS
LMZ_SABER TIMED/SABER
LMZ_MERGED Envisat/MIPAS, Envisat/GOMOS, Envisat/SCIAMACHY, ERBS/SAGE-2, Odin/OSIRIS, Suomi NPP/OMPS, SciSat/ACE-FTS
Vertical coordinate and unit LMZ_MIPAS altitude (km)
LMZ_GOMOS altitude (km)
LMZ_SCIA altitude (km)
LMZ_SAGE2 altitude (km)
LMZ_HALOE pressure (hPa)
LMZ_OSIRIS altitude (km)
LMZ_SMR altitude (km)
LMZ_ACE LMZ_OMPS
altitude (km) altitude (km)
LMZ_MLS pressure (hPa)
LMZ_SABER pressure (hPa)
LMZ_MERGED altitude (km)
LP_MERGED altitude (km)
Vertical coverage LMZ_MIPAS 6-68 km
LMZ_GOMOS 10-105 km
LMZ_SCIA 5-65 km
LMZ_SAGE2 5-65 km
LMZ_HALOE 500 – 0.02hPa
Copernicus Climate Change Service
C3S_312a_Lot4_BIRA-IASB_2016SC1 - Product User Guide and Specification Page 55 of 59
LMZ_OSIRIS 10-59 km
LMZ_SMR 15-65 km
LMZ_ACE LMZ_OMPS
6-94 km 6.5-58.5 km
LMZ_MLS 500 – 0.02hPa
LMZ_SABER 50 – 0.1hPa
LMZ_MERGED 10-50 km
LP_MERGED 10-50 km
Vertical resolution or levels LMZ_MIPAS 1 km
LMZ_GOMOS 1 km
LMZ_SCIA 1 km
LMZ_SAGE2 1 km
LMZ_HALOE 1-3 km
LMZ_OSIRIS 1 km
LMZ_SMR 1 km
LMZ_ACE 1 km
LMZ_MLS 1-3 km
LMZ_SABER 1-3 km
LMZ_MERGED 1 km
LP_MERGED 1 km
Maximum total error (random + systematic)
Above 20 km Below 20 km
LMZ_MIPAS 10% 30%
LMZ_GOMOS 10% 50%
LMZ_SCIA 15% 30%
LMZ_SAGE2 10% 40%
LMZ_HALOE 10% 40%
LMZ_OSIRIS LMZ_OMPS
10% 10%
30% 30%
LMZ_SMR 30% 60%
LMZ_ACE 10% 25%
LMZ_MLS 10% 25%
LMZ_SABER 15% /
LMZ_MERGED 10% 35%
LP_MERGED 10% 35%
Stability (maximum drift) LMZ_MIPAS 5%/decade
LMZ_GOMOS 7%/decade
LMZ_SCIA 7%/decade
LMZ_SAGE2 3%/decade
LMZ_HALOE 5%/decade
LMZ_OSIRIS LMZ_OMPS
5%/decade 5%/decade
LMZ_SMR 10%/decade
LMZ_ACE 5%/decade
LMZ_MLS 3%/decade
LMZ_SABER 7%/decade
LMZ_MERGED 5%/decade
LP_MERGED 5%/decade
Copernicus Climate Change Service
C3S_312a_Lot4_BIRA-IASB_2016SC1 - Product User Guide and Specification Page 56 of 59
ICDR update frequency LMZ_OSIRIS Annually
LMZ_OMPS Annually
LMZ_ACE Annually
LMZ_MLS Annually
LMZ_SABER Annually
LMZ_MERGED Annually
LP_MERGED Annually
ICDR update delay LMZ_OSIRIS 3 months
LMZ_OMPS 3 months
LMZ_ACE 3 months
LMZ_MLS 3 months
LMZ_SABER 3 months
LMZ_MERGED 3 months
LP_MERGED 3 months
Data format CF-compliant NetCDF
Copernicus Climate Change Service
C3S_312a_Lot4_BIRA-IASB_2016SC1 - Product User Guide and Specification Page 57 of 59
Copernicus Climate Change Service
C3S_312a_Lot4_BIRA-IASB_2016SC1 - Product User Guide and Specification Page 58 of 59
References
Bojinski, S., M. Verstraete, T. C. Peterson, C. Richter, A. Simmons and M. Zemp, The concept of essential climate variables in support of climate research, applications and policy, Bulletin of the American Meteorological Society (BAMS), 1431-1443, September 2014. http://www.wmo.int/pages/prog/gcos/documents/bams_ECV_article.pdf
McPeters, R. D., G. J. Labow, and J. A. Logan, Ozone climatological profiles for satellite retrieval algorithms, J. Geophys. Res., 112, D05308, doi:10.1029/2005JD006823, 2007.
National Research Council, Climate Data Records from Environmental Satellites: Interim Report 2004, 150 pp., ISBN: 978-0-309-09168-8, DOI: https://doi.org/10.17226/10944, 2004.
Van der A, R.J., M.A.F. Allaart and H.J. Eskes, Extended and refined multi sensor reanalysis of total ozone for the period 1970-2012, Atmospheric Measurement Techniques, 2015, 8, 3021-3035, doi:10.5194/amt-8-3021-2015.
Werschek, M., EUMETSAT Satellite Application Facility on Climate Monitoring, C3S Climate Data Store workshop, Reading, UK, 3-6 March 2015. http://www.ecmwf.int/sites/default/files/elibrary/2015/13546-existing-solutions-eumetsat-satellite-application-facility-climate-monitoring.pdf