59
Professional Development Workshop II
| Date post: | 22-Dec-2015 |
| Category: |
Documents |
| Upload: | rudolph-booker |
| View: | 214 times |
| Download: | 0 times |

Professional Development Workshop
II

Dianthia Gilmore; Nathan Hale & East Tech
Endora Kight; Carl F Shuler, Almira & Mound
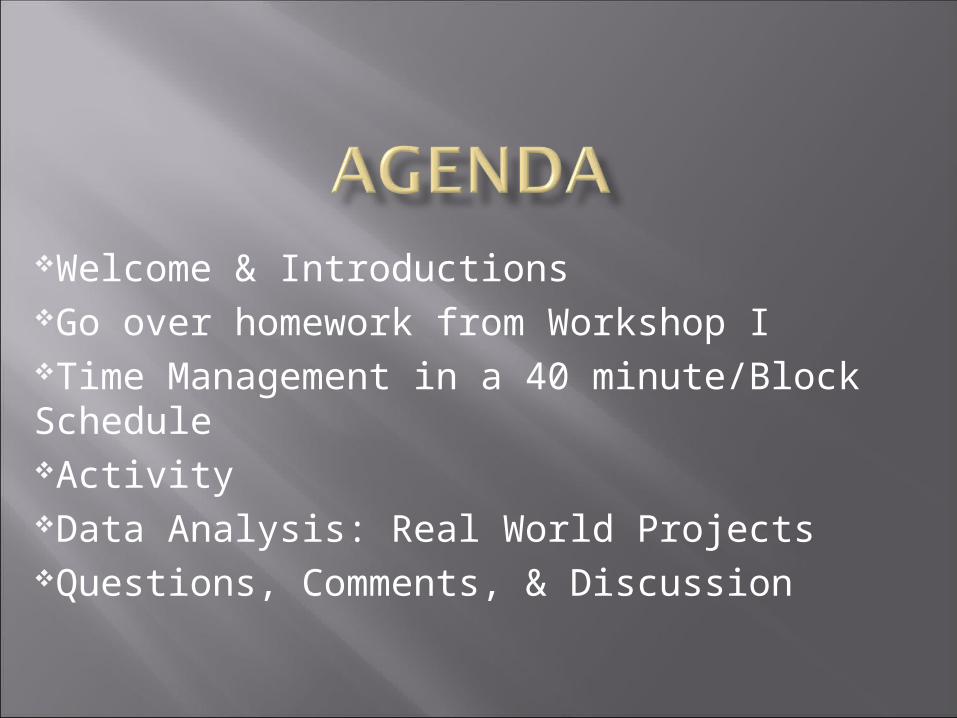
Welcome & IntroductionsGo over homework from Workshop ITime Management in a 40 minute/Block ScheduleActivityData Analysis: Real World ProjectsQuestions, Comments, & Discussion


Hello, my name is___ & my buddy is ___. Since our last session, we connected online and discussed ___

Today, we will continue showing different ways to differentiate in the classroom
environment. Remember, we can differentiate
By contentBy processBy product and/or By climate.
We will present two forms of lesson plans; a Detailed Lesson Plan and a Simple Lesson
plan.
Both forms of lesson plans can be used in any classroom setting.
However, the Detailed Lesson Plan works well in a block setting where time is allotted for
activities, small group and whole group discussions.

The lesson plan templates used are from our district adopted textbook, Holt and teacher
created.

For today’s lesson, we will focus on both math & technology standards
MATH STANDARDSData Analysis & Probability
Mathematical Process
TECHNOLOGY STANDARDSTechnology for Productivity Applications
http://www.ode.state.oh.us/GD/Templates/Pages/ODE/ODEDetail.aspx?
page=3&TopicRelationID=1707&ContentID=1279&Content=72514
9.5 ACreate, interpret and use graphical displays and statistical measures to describe data; e.g., box-and-whisker plots, histograms, scatter plots, measures of center and variability.
8-10 AFormulate a problem or mathematical model in response to a specific need or situation, determine information required to solve the problem, choose a method for obtaining this information, and use limits for acceptable solution.
9.3 BIdentify, select and apply appropriate technology tools and resources to produce creative works and to construct technology enhanced models
9.3 B.2Demonstrate proficiency in all productivity tools (e.g., word processing, spreadsheet, database, desktop publishing).

Unique Challenges in Teaching
Undergraduate Statistics

A statistic instructor faces 4 major challenges when teaching basic statistical concepts.
1.Motivating students to study material they think is uninteresting2.Handling Math Anxiety3.Dealing with Performance Extremes4.Making the Learning Memorable
For motivating students to study material they think is uninteresting
the authors states
Instructors need to make deliberate efforts to enhance motivation by the following:
• Active Learning; having fun and have students generate their own data
• Mastery Learning; achieve mastery of the material rather than just passing an exam
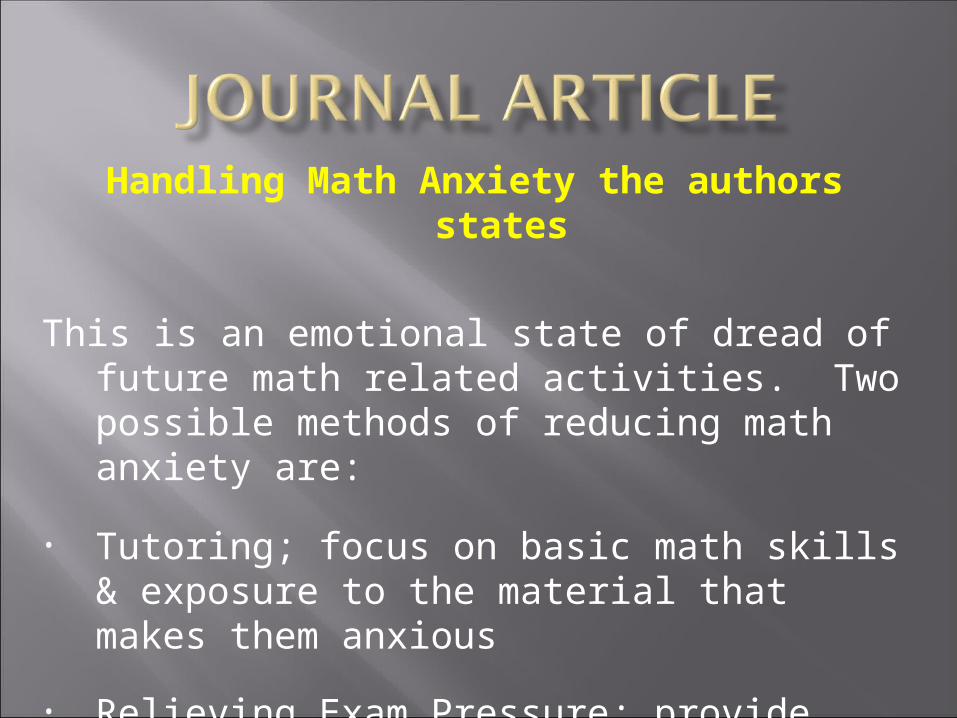
Handling Math Anxiety the authors states
This is an emotional state of dread of future math related activities. Two possible methods of reducing math anxiety are:
• Tutoring; focus on basic math skills & exposure to the material that makes them anxious
• Relieving Exam Pressure; provide unlimited time & allowing repeat examinations

Dealing with Performance Extremes the authors states
Performance extremes in statistics seem larger than in other courses.
It is difficult to address the remedial needs of the low achievers while challenging the high achievers.
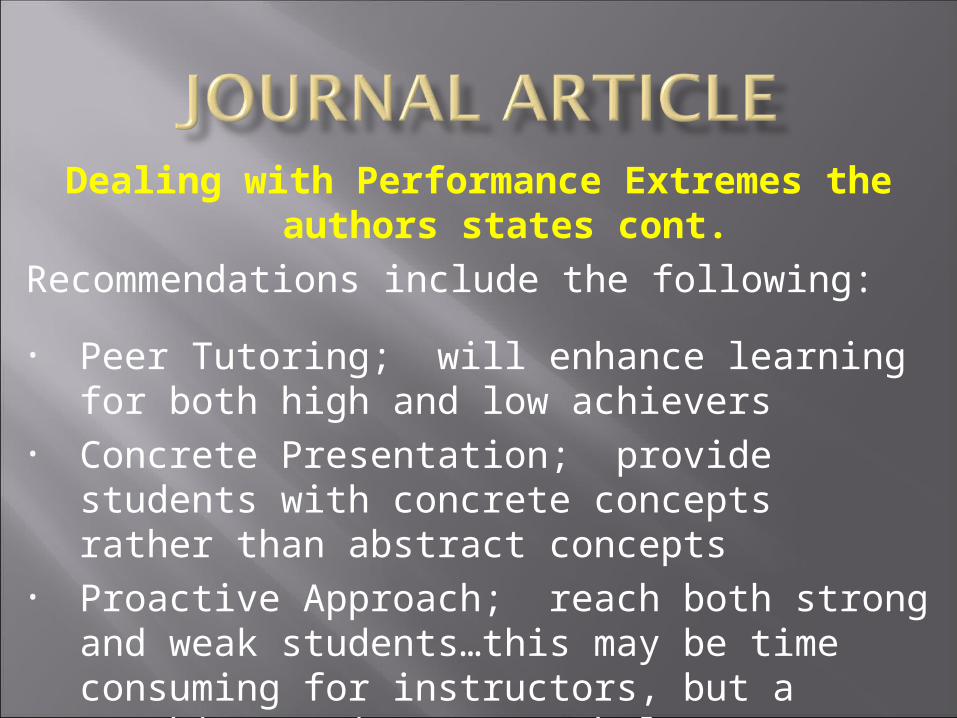
Dealing with Performance Extremes the authors states cont.
Recommendations include the following:
• Peer Tutoring; will enhance learning for both high and low achievers
• Concrete Presentation; provide students with concrete concepts rather than abstract concepts
• Proactive Approach; reach both strong and weak students…this may be time consuming for instructors, but a teaching assistant can help
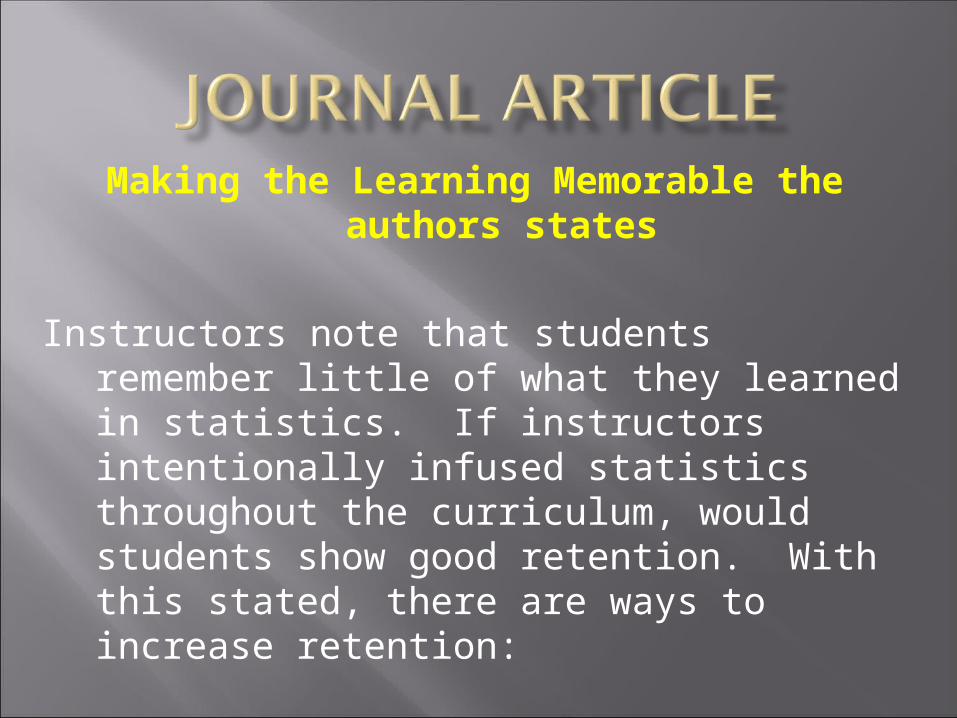
Making the Learning Memorable the authors states
Instructors note that students remember little of what they learned in statistics. If instructors intentionally infused statistics throughout the curriculum, would students show good retention. With this stated, there are ways to increase retention:

Making the Learning Memorable the authors states cont.
• Achieving Initial Understanding; use a distinct organizational scheme of course materials
• Providing Memory Cues; stories, visual images, cartoon, videos, & demonstrations

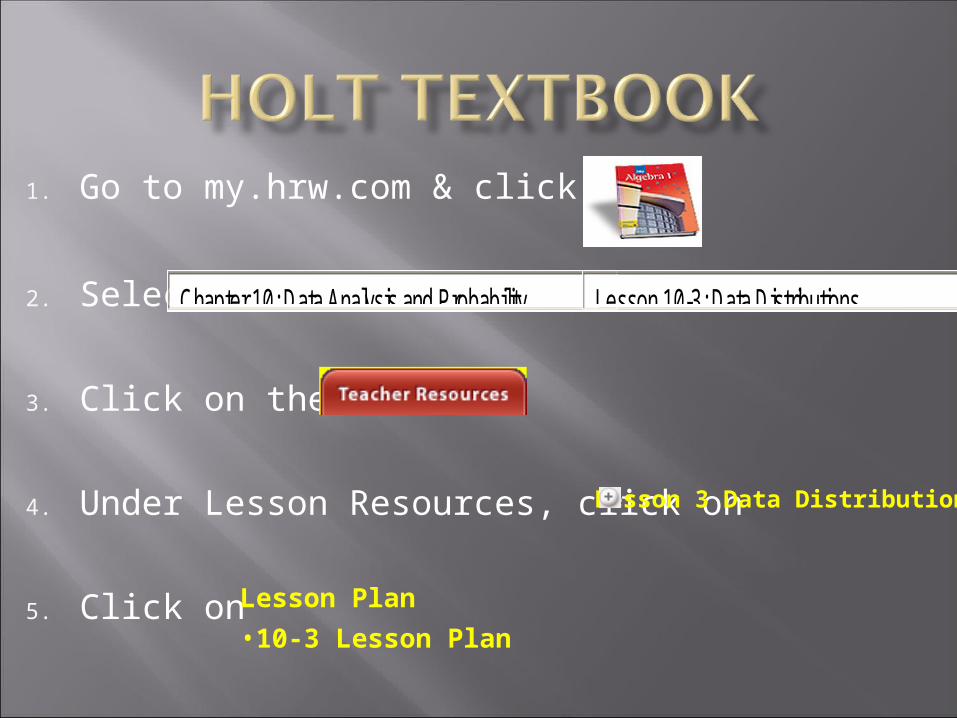
1. Go to my.hrw.com & click on
2. Select
3. Click on the
4. Under Lesson Resources, click on
5. Click on
Lesson 3 Data Distributions
Lesson Plan
•10-3 Lesson Plan
Chapter 10: Data Analysis and Probability Lesson 10-3: Data Distributions
10-3 Lesson Plan Link
http://my.hrw.com/math06_07/teacher/osp/alg1/data/chap10/section03/lesson_plan.pdf

Lesson Plan Link

Lesson Plan Link
http://ims.ode.state.oh.us/ODE/IMS/Lessons/
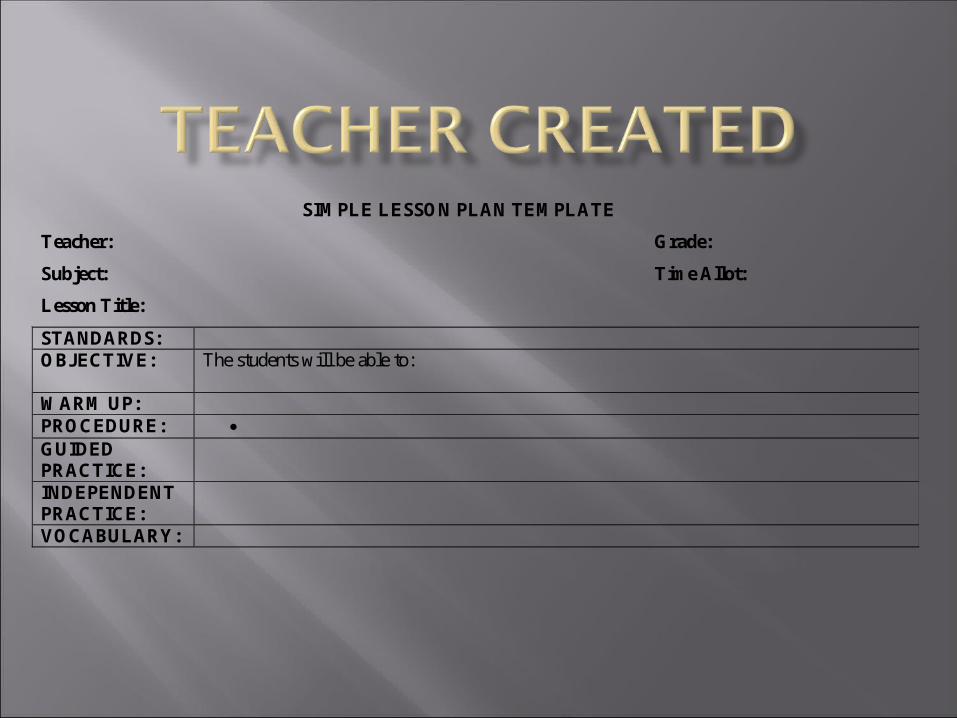
SIMPLE LESSON PLAN TEMPLATE
Teacher: Grade:
Subject: Time Allot:
Lesson Title:
STANDARDS: OBJECTIVE: The students will be able to:
WARM UP: PROCEDURE: GUIDED PRACTICE:
INDEPENDENT PRACTICE:
VOCABULARY:
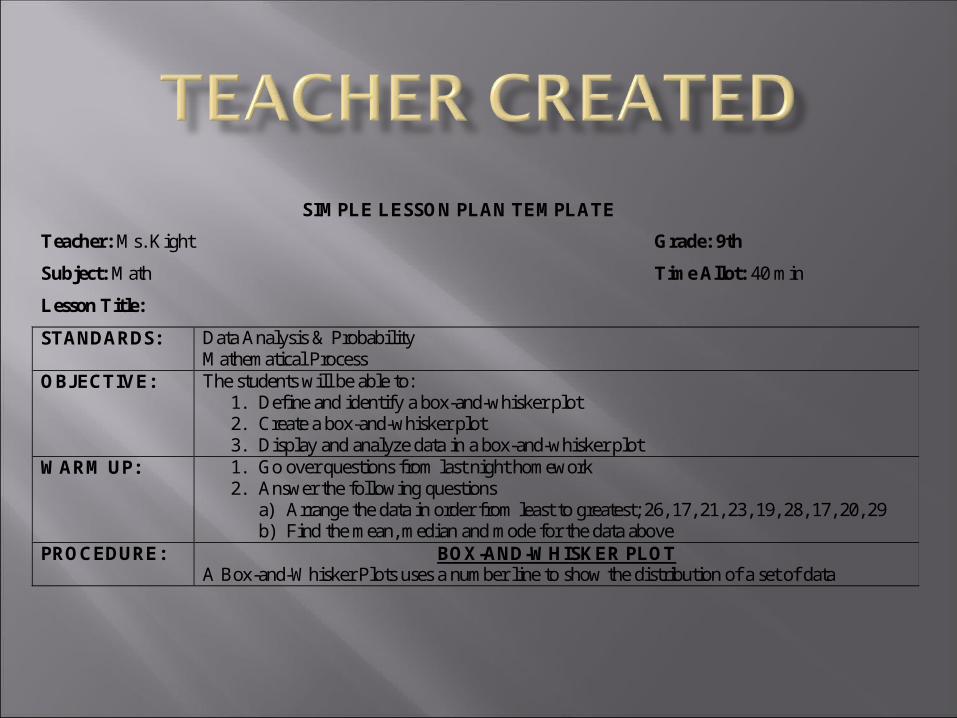
SIMPLE LESSON PLAN TEMPLATE
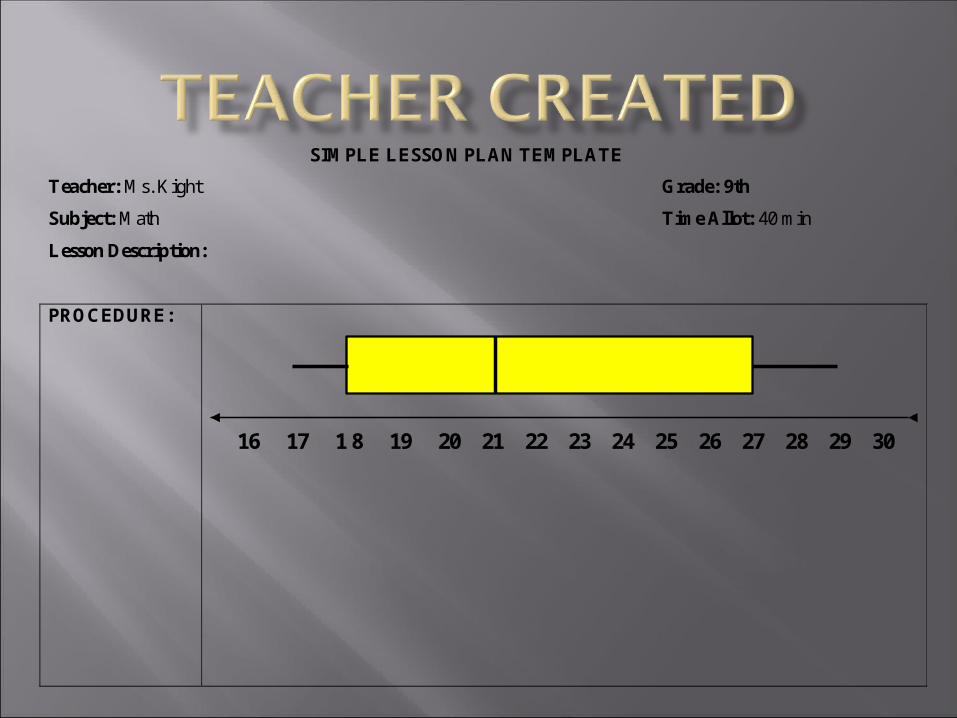
Teacher: Ms. Kight Grade: 9th
Subject: Math Time Allot: 40 min
Lesson Title:
STANDARDS: Data Analysis & Probability Mathematical Process
OBJECTIVE: The students will be able to: 1. Define and identify a box-and-whisker plot 2. Create a box-and-whisker plot 3. Display and analyze data in a box-and-whisker plot
WARM UP: 1. Go over questions from last night homework 2. Answer the following questions
a) Arrange the data in order from least to greatest; 26, 17, 21, 23, 19, 28, 17, 20, 29 b) Find the mean, median and mode for the data above
PROCEDURE: BOX-AND-WHISKER PLOT A Box-and-Whisker Plots uses a number line to show the distribution of a set of data
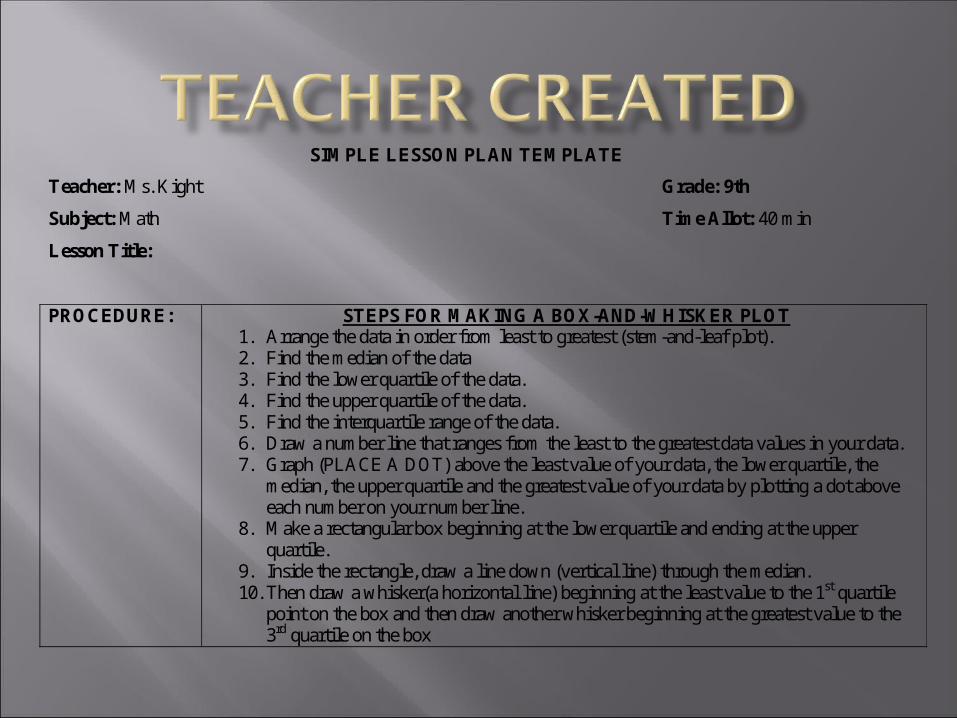
SIMPLE LESSON PLAN TEMPLATE
Teacher: Ms. Kight Grade: 9th
Subject: Math Time Allot: 40 min
Lesson Title:
PROCEDURE: STEPS FOR MAKING A BOX-AND-WHISKER PLOT 1. Arrange the data in order from least to greatest (stem-and-leaf plot). 2. Find the median of the data 3. Find the lower quartile of the data. 4. Find the upper quartile of the data. 5. Find the interquartile range of the data. 6. Draw a number line that ranges from the least to the greatest data values in your data. 7. Graph (PLACE A DOT) above the least value of your data, the lower quartile, the
median, the upper quartile and the greatest value of your data by plotting a dot above each number on your number line.
8. Make a rectangular box beginning at the lower quartile and ending at the upper quartile.
9. Inside the rectangle, draw a line down (vertical line) through the median. 10. Then draw a whisker(a horizontal line) beginning at the least value to the 1st quartile
point on the box and then draw another whisker beginning at the greatest value to the 3rd quartile on the box
SIMPLE LESSON PLAN TEMPLATE
Teacher: Ms. Kight Grade: 9th
Subject: Math Time Allot: 40 min
Lesson Description:
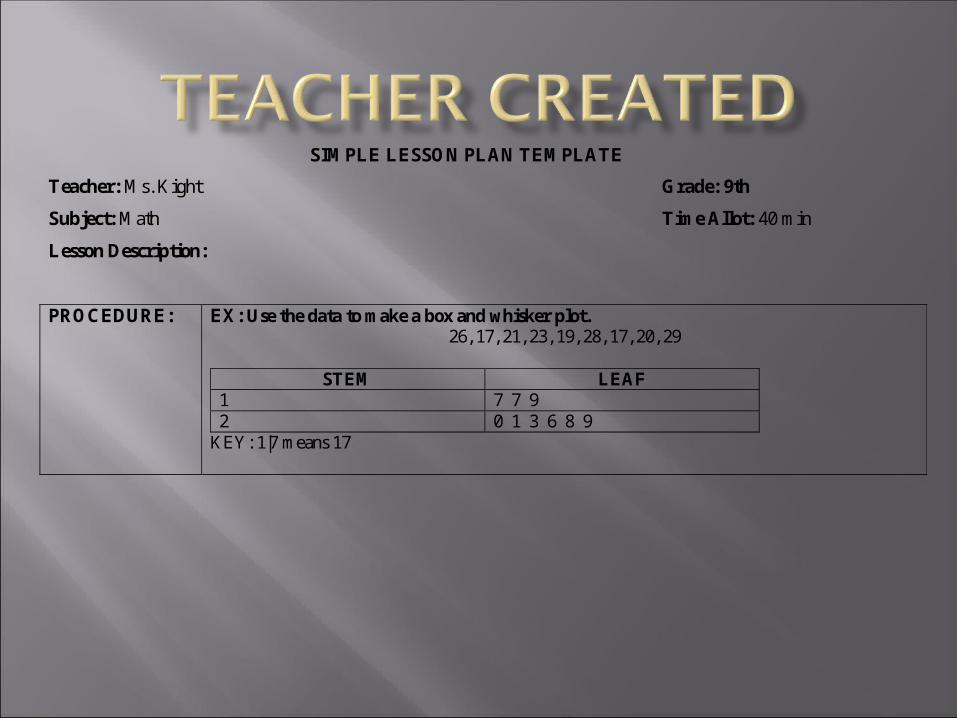
PROCEDURE: EX: Use the data to make a box and whisker plot. 26, 17, 21, 23, 19, 28, 17, 20, 29
STEM LEAF
1 7 7 9 2 0 1 3 6 8 9
KEY: 1|7 means 17
SIMPLE LESSON PLAN TEMPLATE
Teacher: Ms. Kight Grade: 9th
Subject: Math Time Allot: 40 min
Lesson Description:
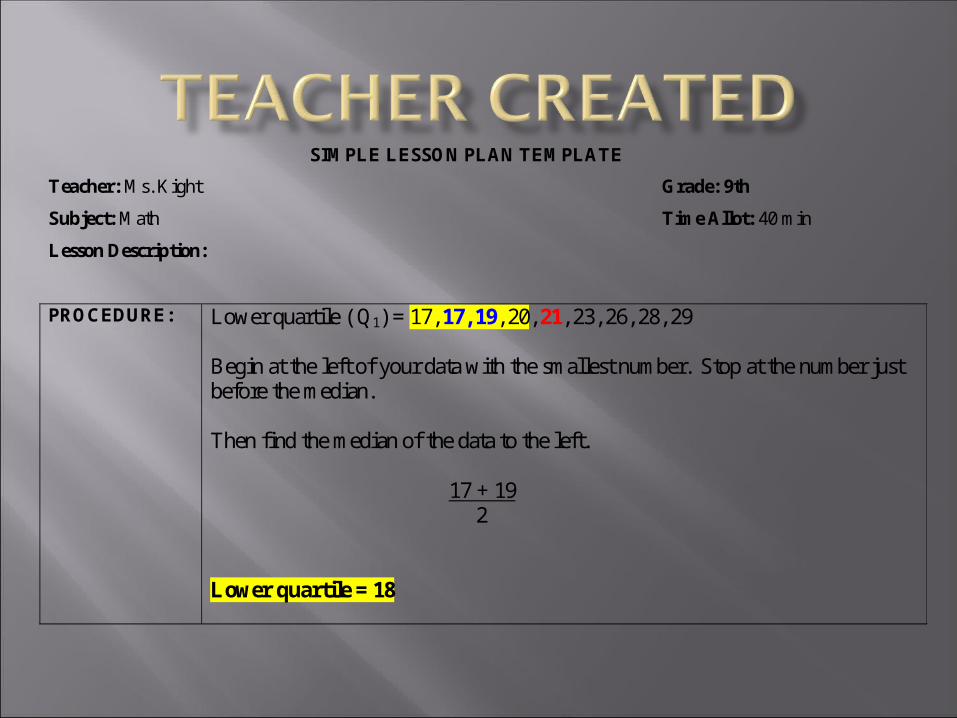
PROCEDURE: Lower quartile ( Q1) = 17, 17, 19, 20, 21, 23, 26, 28, 29 Begin at the left of your data with the smallest number. Stop at the number just before the median. Then find the median of the data to the left. 17 + 19 2 Lower quartile = 18
SIMPLE LESSON PLAN TEMPLATE
Teacher: Ms. Kight Grade: 9th
Subject: Math Time Allot: 40 min
Lesson Description:
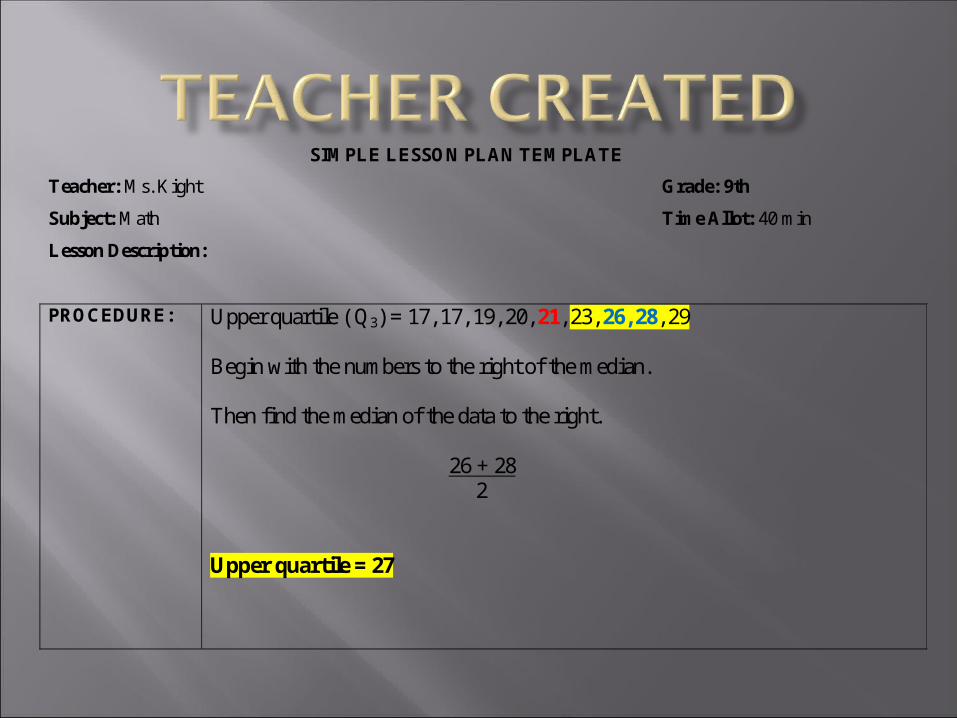
PROCEDURE: Upper quartile ( Q3) = 17, 17, 19, 20, 21, 23, 26, 28, 29 Begin with the numbers to the right of the median. Then find the median of the data to the right. 26 + 28 2 Upper quartile = 27
SIMPLE LESSON PLAN TEMPLATE
Teacher: Ms. Kight Grade: 9th
Subject: Math Time Allot: 40 min
Lesson Description:
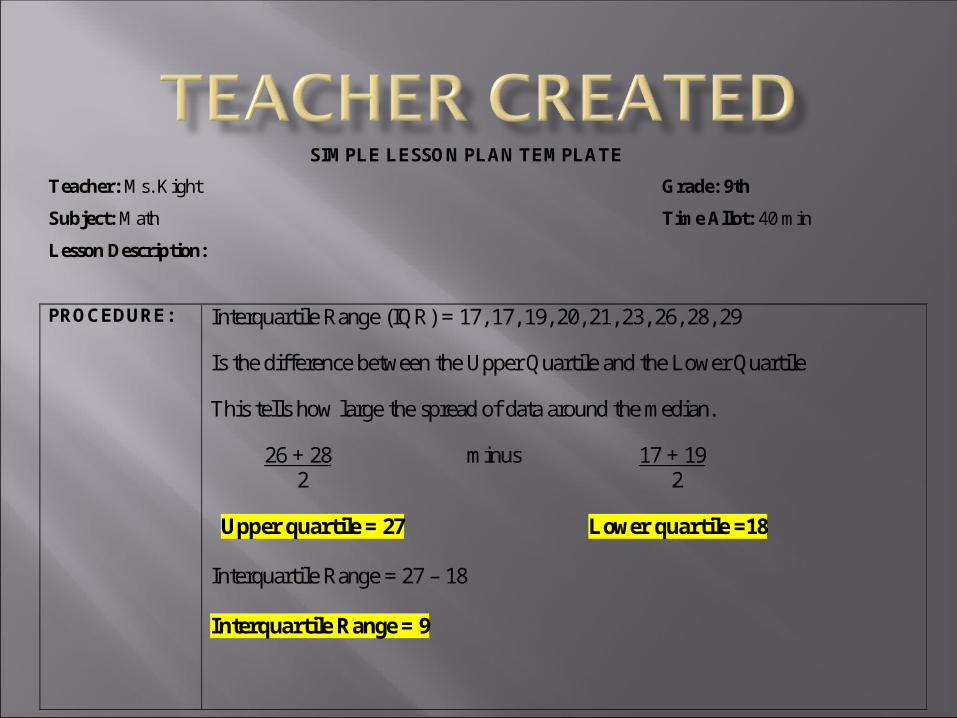
PROCEDURE: Interquartile Range (IQR) = 17, 17, 19, 20, 21, 23, 26, 28, 29 Is the difference between the Upper Quartile and the Lower Quartile This tells how large the spread of data around the median. 26 + 28 minus 17 + 19 2 2 Upper quartile = 27 Lower quartile =18 Interquartile Range = 27 – 18 Interquartile Range = 9
SIMPLE LESSON PLAN TEMPLATE
Teacher: Ms. Kight Grade: 9th
Subject: Math Time Allot: 40 min
Lesson Description:
PROCEDURE: 16 17 1 8 19 20 21 22 23 24 25 26 27 28 29 30
SIMPLE LESSON PLAN TEMPLATE
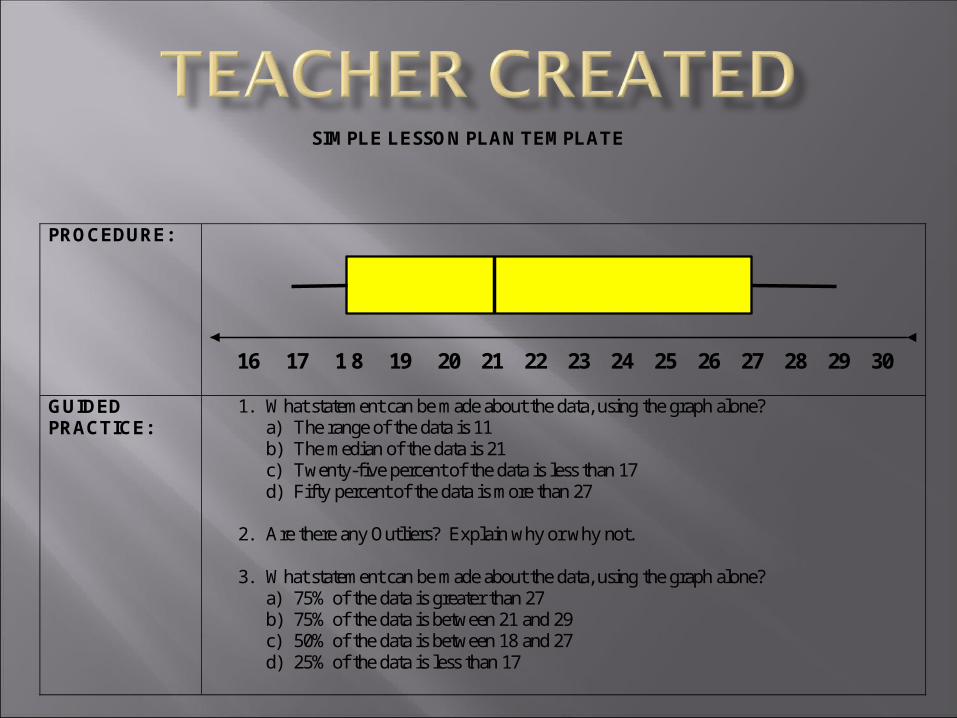
PROCEDURE: 16 17 1 8 19 20 21 22 23 24 25 26 27 28 29 30
GUIDED PRACTICE:
1. What statement can be made about the data, using the graph alone? a) The range of the data is 11 b) The median of the data is 21 c) Twenty-five percent of the data is less than 17 d) Fifty percent of the data is more than 27
2. Are there any Outliers? Explain why or why not.
3. What statement can be made about the data, using the graph alone?
a) 75% of the data is greater than 27 b) 75% of the data is between 21 and 29 c) 50% of the data is between 18 and 27 d) 25% of the data is less than 17
SIMPLE LESSON PLAN TEMPLATE
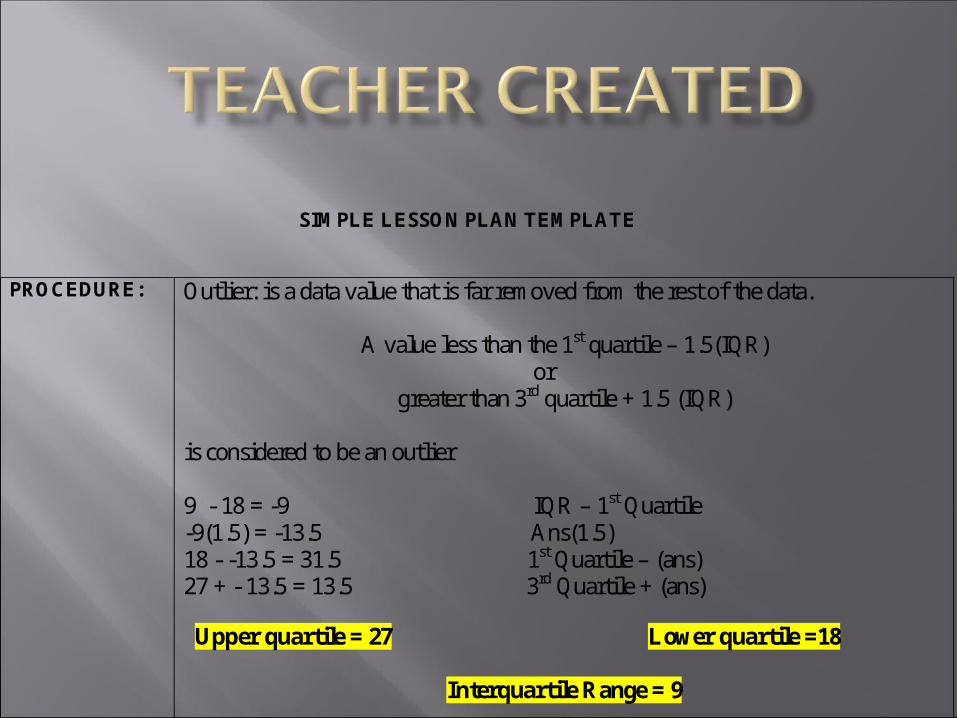
PROCEDURE: Outlier: is a data value that is far removed from the rest of the data.
A value less than the 1st quartile – 1.5(IQR) or
greater than 3rd quartile + 1.5 (IQR) is considered to be an outlier 9 - 18 = -9 IQR – 1st Quartile -9(1.5) = -13.5 Ans(1.5) 18 - -13.5 = 31.5 1st Quartile – (ans) 27 + - 13.5 = 13.5 3rd Quartile + (ans) Upper quartile = 27 Lower quartile =18
Interquartile Range = 9
SIMPLE LESSON PLAN TEMPLATE
Teacher: Grade:
Subject: Time Allot:
Lesson Title:
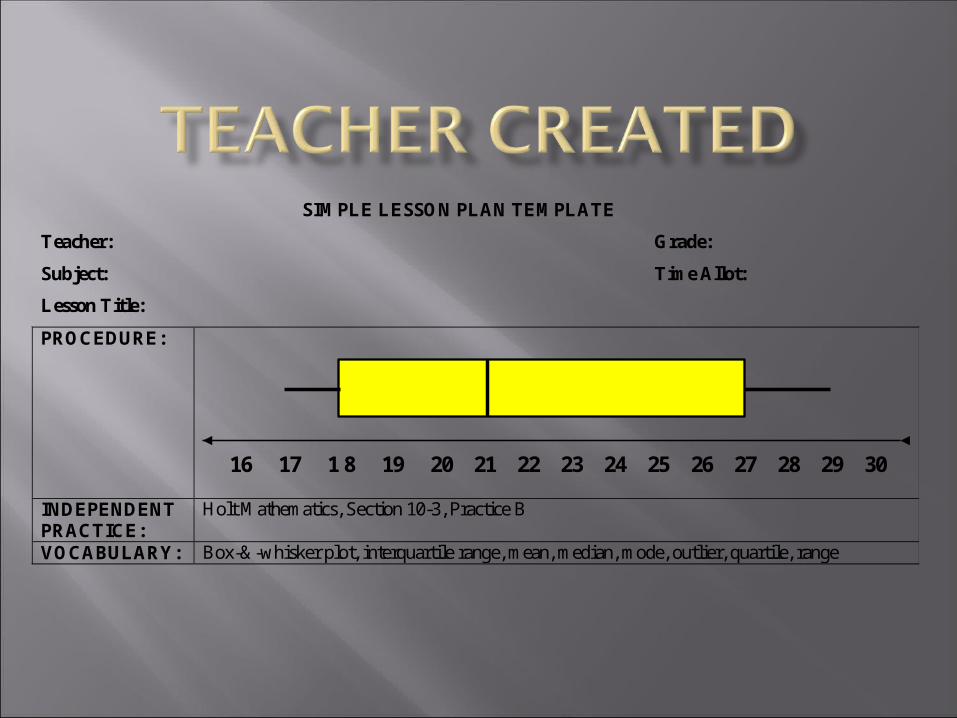
PROCEDURE: 16 17 1 8 19 20 21 22 23 24 25 26 27 28 29 30
INDEPENDENT PRACTICE:
Holt Mathematics, Section 10-3, Practice B
VOCABULARY: Box-&-whisker plot, interquartile range, mean, median, mode, outlier, quartile, range

Detailed Lesson Plan
See word document
Texas Instrumenthttp://education.ti.com/educationportal/activityexchange/activity_list.do?cid=us
ACTIVITY #2
Technology Lab Recording Sheet
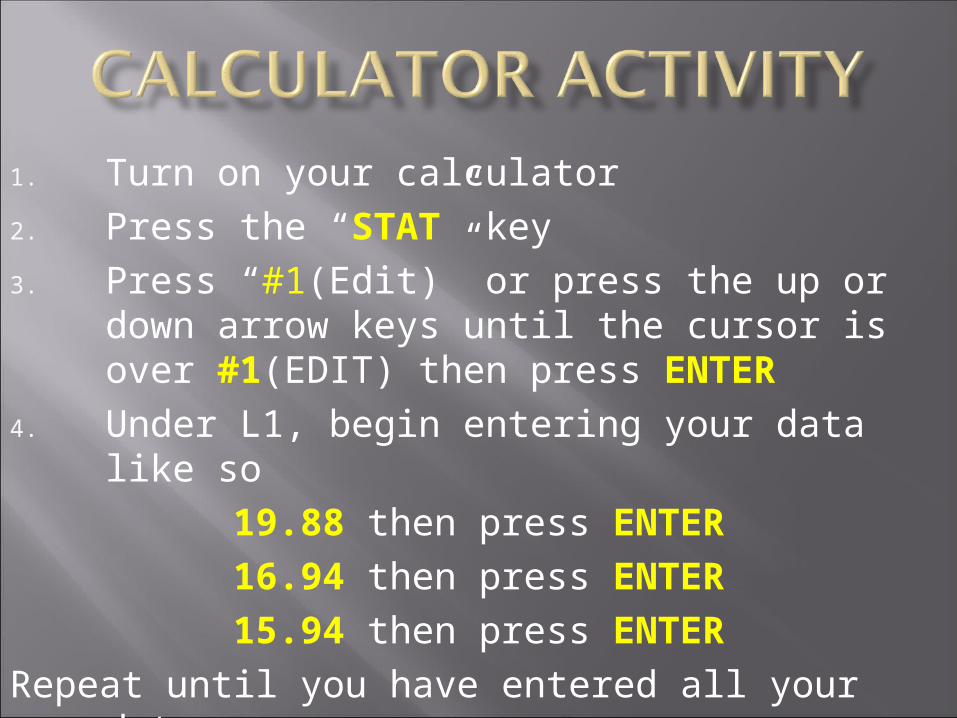
1. Turn on your calculator2. Press the “STAT” key3. Press “#1(Edit)” or press the up or down
arrow keys until the cursor is over #1(EDIT) then press ENTER
4. Under L1, begin entering your data like so19.88 then press ENTER16.94 then press ENTER15.94 then press ENTER
Repeat until you have entered all your data
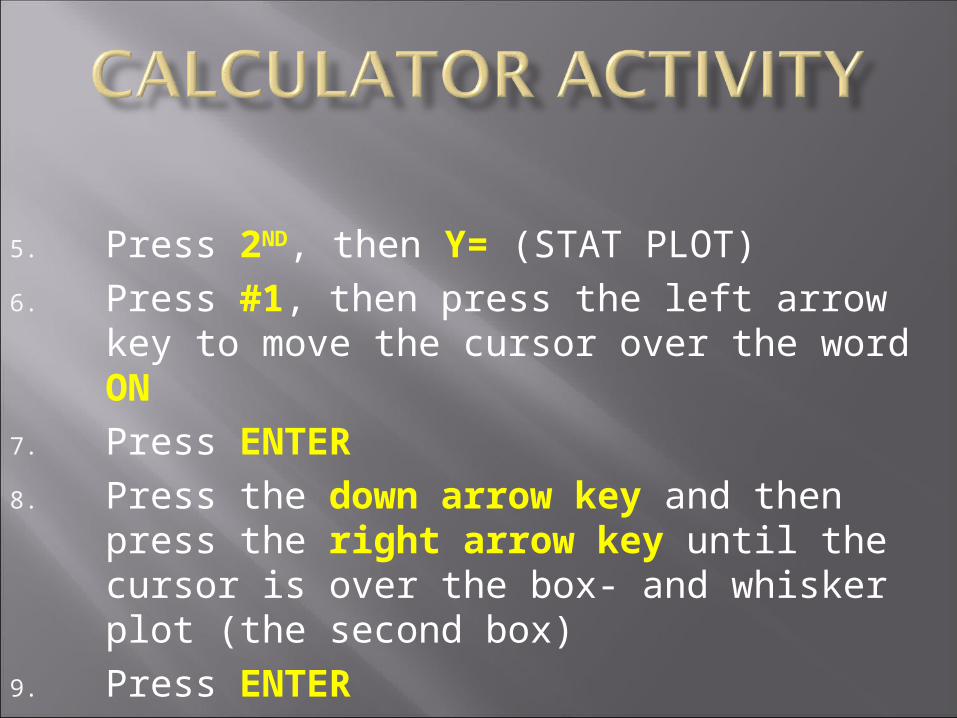
5. Press 2ND, then Y= (STAT PLOT)6. Press #1, then press the left arrow key to
move the cursor over the word ON7. Press ENTER8. Press the down arrow key and then press
the right arrow key until the cursor is over the box- and whisker plot (the second box)
9. Press ENTER
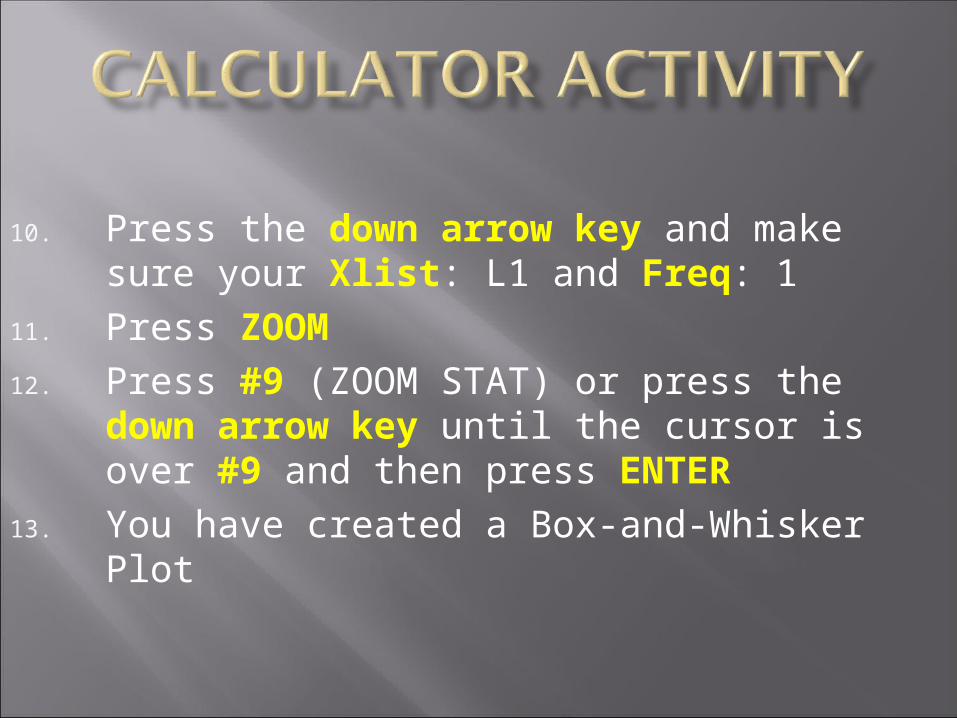
10. Press the down arrow key and make sure your Xlist: L1 and Freq: 1
11. Press ZOOM12. Press #9 (ZOOM STAT) or press the down
arrow key until the cursor is over #9 and then press ENTER
13. You have created a Box-and-Whisker Plot
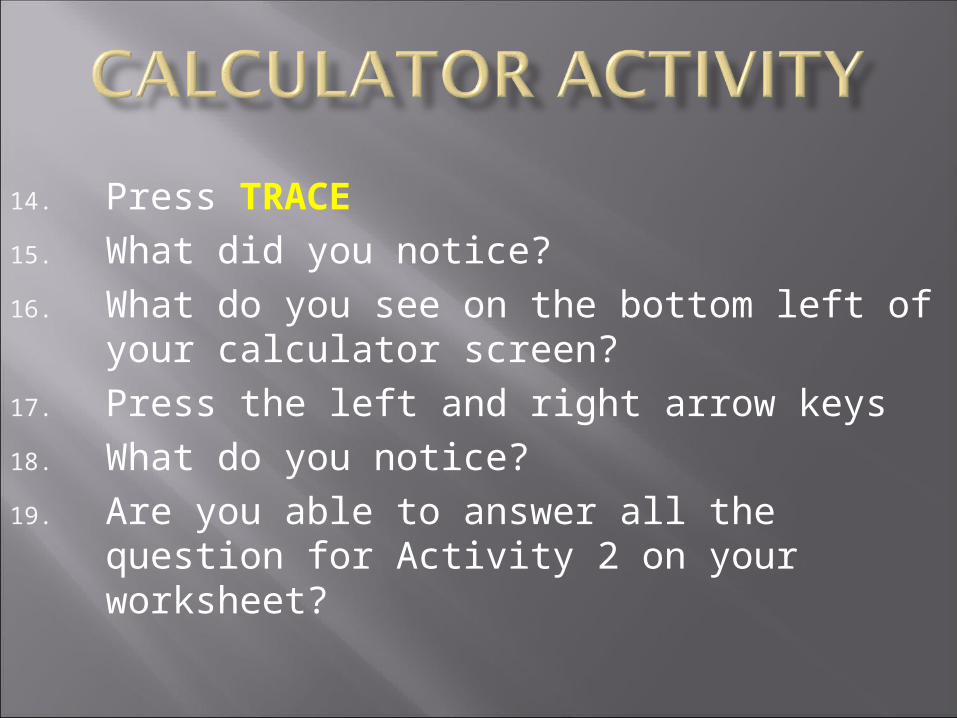
14. Press TRACE15. What did you notice?16. What do you see on the bottom left of your
calculator screen?17. Press the left and right arrow keys18. What do you notice?19. Are you able to answer all the question for
Activity 2 on your worksheet?
ACTIVITY
Problem Solving Worksheet
Technology Lab Recording Sheet
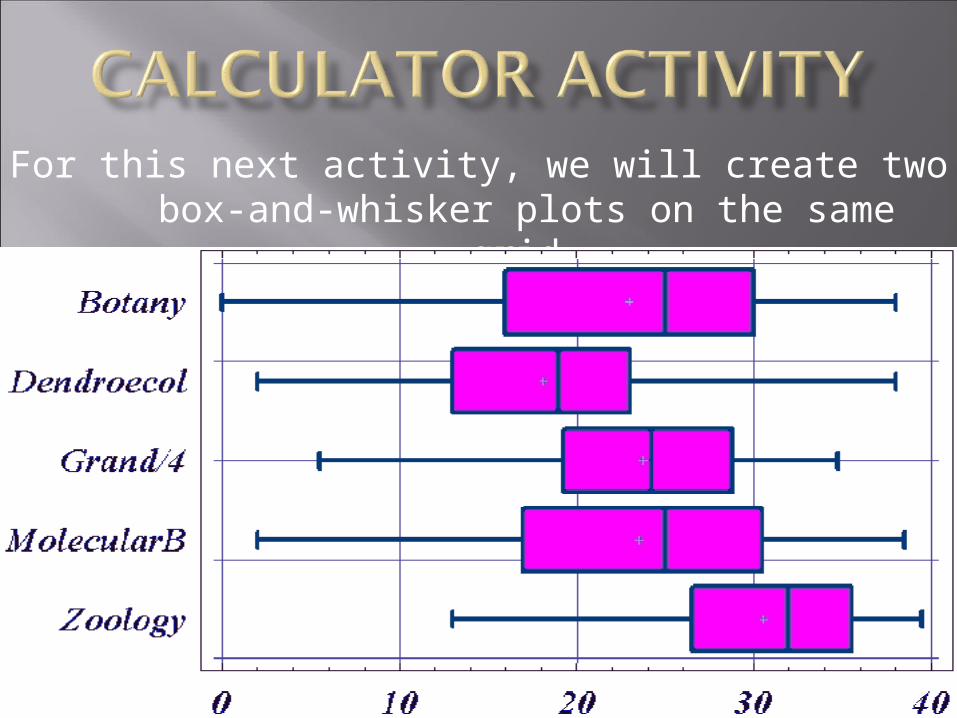
For this next activity, we will create two box-and-whisker plots on the same grid.
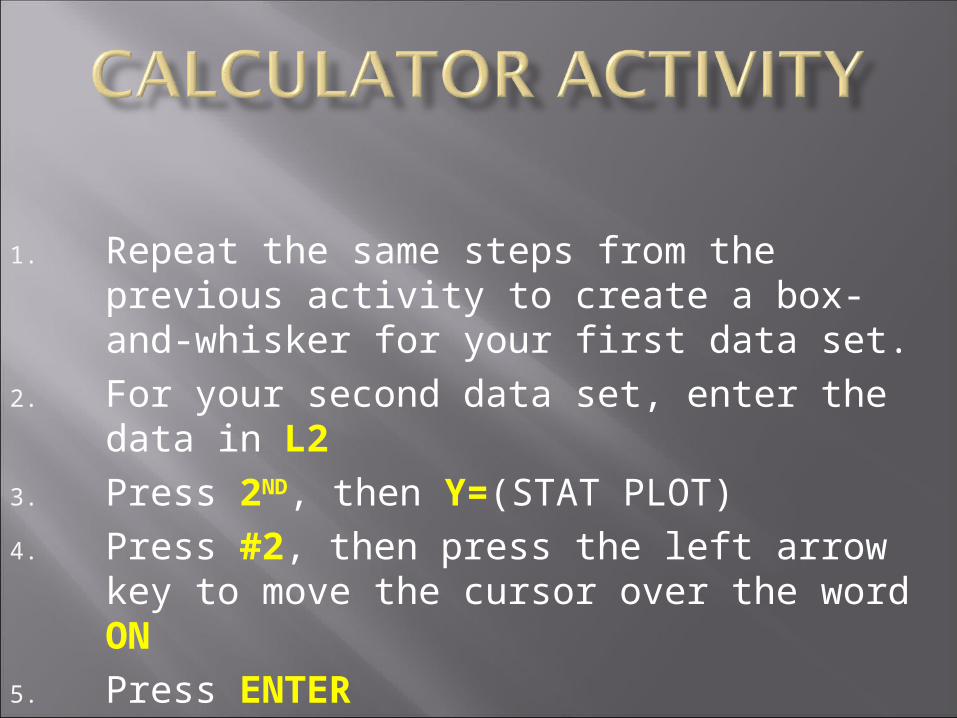
1. Repeat the same steps from the previous activity to create a box-and-whisker for your first data set.
2. For your second data set, enter the data in L2
3. Press 2ND, then Y=(STAT PLOT)4. Press #2, then press the left arrow key to
move the cursor over the word ON5. Press ENTER
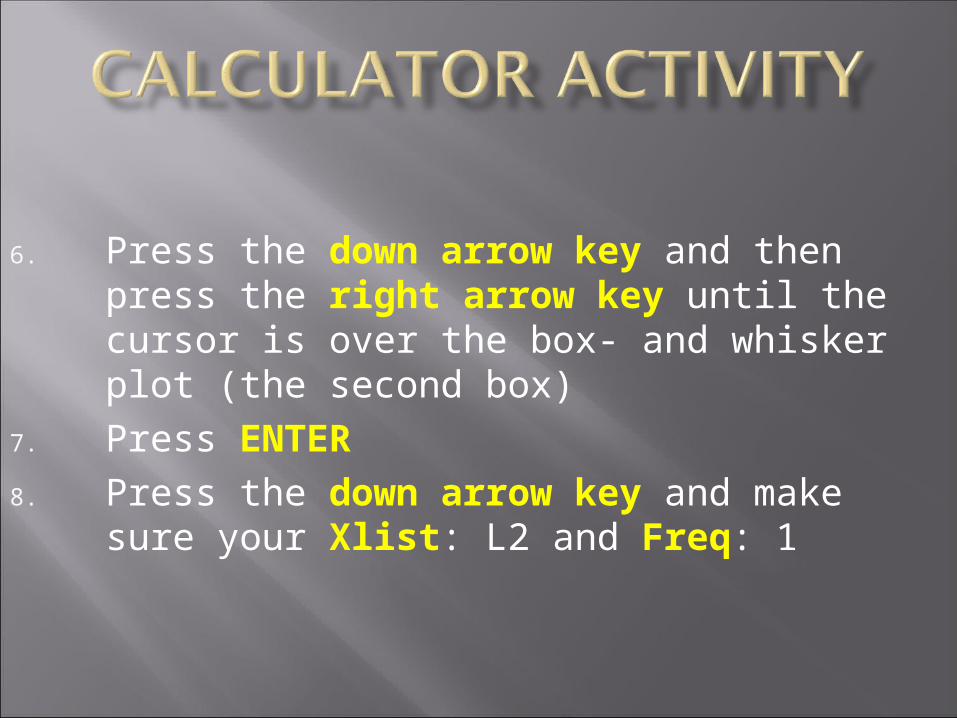
6. Press the down arrow key and then press the right arrow key until the cursor is over the box- and whisker plot (the second box)
7. Press ENTER8. Press the down arrow key and make sure
your Xlist: L2 and Freq: 1
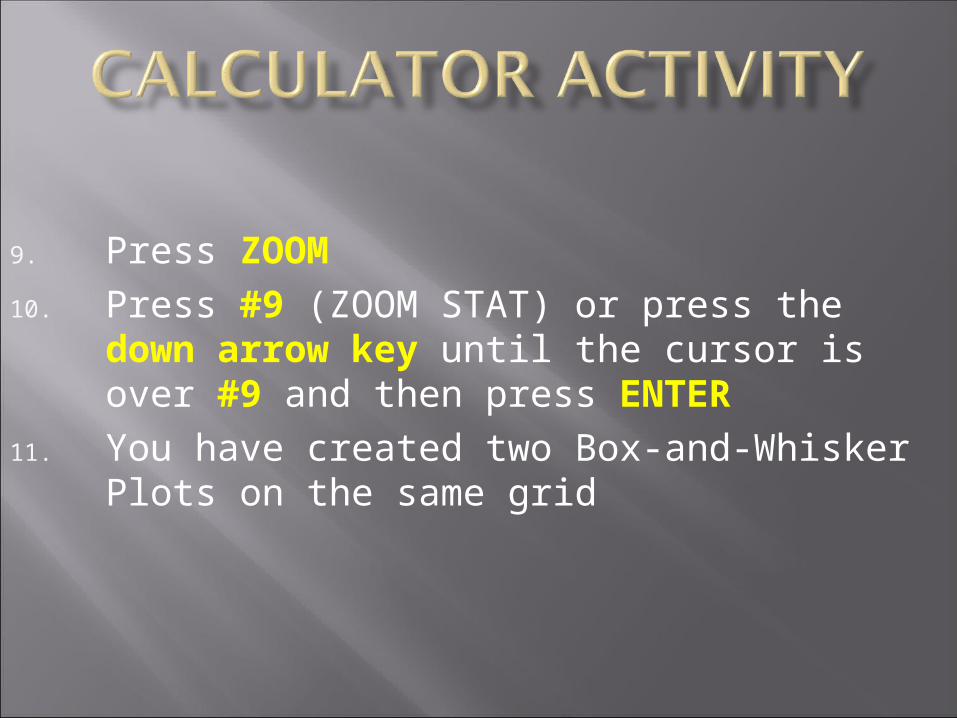
9. Press ZOOM10. Press #9 (ZOOM STAT) or press the down
arrow key until the cursor is over #9 and then press ENTER
11. You have created two Box-and-Whisker Plots on the same grid

We continued to focus on differentiating instruction by content, process, product and climate
We visited the different ways to create lesson plans to ensure all students have the opportunity to succeed with strategies designed to reach students of all learning styles and skill levels implementing differentiated instruction
We have viewed topics in the journal article which outlines ways to teach statistical data to students effectively
We have identified where we can find instructional resources for the range of learning styles in our classroom
We have identified modified tests, quizzes and worksheets
We have gone over calculator keystrokes for creating one and multiple box-and-whisker plots on the same grid
We came together once again to gain professional knowledge of our content area and continue to network within our district to improve student learning.

E-mail me, Endora Kight, if you would like to have the calculator instructions for creating a box-and-whisker plot.
E-mail me, Endora Kight, if you may have any questions regarding anything we have covered today
E-mail me, Endora Kight, if you have any questions regarding any of the professional development workshops
With your buddy, create a lesson plan with an activity for next session. Use the standard Data Analysis & Probability and Benchmark A, B, C or D.