28 PROFILING OF GROUNDWATER QUALITY BASED ON ITS UTILIZATION Maria Wons 1 , Sławomir Szymczyk 2 , Józef Koc 2 1 County Sanitary and Epidemiological Station in Tczew, Obr. Westerplatte 10, 83-110 Tczew, Poland, e-mail: [email protected]2 Department of Land Reclamation and Environmental Development, University of Warmia and Mazury in Olsztyn, pl. Łódzki 2, 10-719 Olsztyn, Poland, e-mail: [email protected]; [email protected]INTRODUCTION It is believed that groundwater is the most important natural resource and requires constant monitoring of intakes and changes in its composi- tion. Groundwater is typically well isolated from the ground surface by a layer of soil, eluvium formations and rocks in comparison with surface water and is thus protected against contamination. However, with excessive extraction, the quality of groundwater may deteriorate [Wen et al. 2005] affecting such parameters as water reaction (pH) which is one of the most important indices of wa- ter quality, even though its potential changes are not directly felt by consumers. Reaction of wa- ter may change due to, for instance, saturation with carbon dioxide. In the case of natural water, higher reaction changes may indicate water con- tamination. It is important for untreated water, as it impacts water treatment and natural processes occurring in water. Journal of Ecological Engineering Volume 14, No. 4, Oct. 2013, pp. 28–35 DOI: 10.5604/2081139X.1066222 Research Article ABSTRACT This paper presents an analysis of groundwater from the intakes “Park” and “Motława” situated in Tczew (Poland). These water intakes have varied hydrological conditions and volume of utilized resources (wells). In this area, the deepest drillings extend to 180 m (cretaceous stage) with 20% being constituted by tertiary-quaternary forma- tions with depths ranging from 60 to 63.7 m. The distribution of water from the in- takes depended on the population to which it was supplied and the average production of water ranged from 5,802.4 to 7,591.5 m 3 per day on “Motława” intake and from 3,196.3 to 4,125.4 m 3 /day on “Park” intake and did not exceed the production capacity specified by the regulations. In 1994–2009, analyses of water intended for consump- tion from the above-mentioned intakes in Tczew were performed by testing the water reaction and the content of ammonium ions and chlorides. In the period of the studies, the permissible reaction was not exceeded and the concentrations of ammonium ion and chlorides were on a relatively steady level. Keywords: groundwater, aquifer stages, operational capacity, reaction, ammonium ion, chlorides. Received: 2013.08.11 Accepted: 2013.09.06 Published: 2013.10.10 Water reaction requires careful control at all stages of water treatment to ensure a sufficient degree of decontamination and disinfection. The control of pH is also important at the stage of driving water into pipelines and internal instal- lations. Hence, the highest permissible value of water reaction should range between 6.5 and 8.5. Non-compliance with these requirements may cause secondary contamination of drinking wa- ter and negatively influence its taste, smell and appearance. Ammonium ions in groundwater originate mainly from the reduction of nitrates and nitrites in the presence of hydrogen sulphide or other reductive compounds. From a sanitary point of view, both the content of ammonium ions and their origin are important. They are often gen- erated by decomposition of animal waste prod- ucts, which pose a serious risk, especially if wa- ter is used for consumption. Non-organic origin of ammonium ions in water does not present a
Transcript
28
PROFILING OF GROUNDWATER QUALITY BASED ON ITS UTILIZATION
Maria Wons1 Sławomir Szymczyk2 Joacutezef Koc2
1 County Sanitary and Epidemiological Station in Tczew Obr Westerplatte 10 83-110 Tczew Poland e-mail mariawonswppl
2 Department of Land Reclamation and Environmental Development University of Warmia and Mazury in Olsztyn pl Łoacutedzki 2 10-719 Olsztyn Poland e-mail katemeluwmedupl szymekuwmedupl
INTRODUCTION
It is believed that groundwater is the most important natural resource and requires constant monitoring of intakes and changes in its composi-tion Groundwater is typically well isolated from the ground surface by a layer of soil eluvium formations and rocks in comparison with surface water and is thus protected against contamination However with excessive extraction the quality of groundwater may deteriorate [Wen et al 2005] affecting such parameters as water reaction (pH) which is one of the most important indices of wa-ter quality even though its potential changes are not directly felt by consumers Reaction of wa-ter may change due to for instance saturation with carbon dioxide In the case of natural water higher reaction changes may indicate water con-tamination It is important for untreated water as it impacts water treatment and natural processes occurring in water
Journal of Ecological EngineeringVolume 14 No 4 Oct 2013 pp 28ndash35DOI 1056042081139X1066222 Research Article
ABSTRACTThis paper presents an analysis of groundwater from the intakes ldquoParkrdquo and ldquoMotławardquo situated in Tczew (Poland) These water intakes have varied hydrological conditions and volume of utilized resources (wells) In this area the deepest drillings extend to 180 m (cretaceous stage) with 20 being constituted by tertiary-quaternary forma-tions with depths ranging from 60 to 637 m The distribution of water from the in-takes depended on the population to which it was supplied and the average production of water ranged from 58024 to 75915 m3 per day on ldquoMotławardquo intake and from 31963 to 41254 m3day on ldquoParkrdquo intake and did not exceed the production capacity specified by the regulations In 1994ndash2009 analyses of water intended for consump-tion from the above-mentioned intakes in Tczew were performed by testing the water reaction and the content of ammonium ions and chlorides In the period of the studies the permissible reaction was not exceeded and the concentrations of ammonium ion and chlorides were on a relatively steady level
Keywords groundwater aquifer stages operational capacity reaction ammonium ion chlorides
Received 20130811Accepted 20130906Published 20131010
Water reaction requires careful control at all stages of water treatment to ensure a sufficient degree of decontamination and disinfection The control of pH is also important at the stage of driving water into pipelines and internal instal-lations Hence the highest permissible value of water reaction should range between 65 and 85 Non-compliance with these requirements may cause secondary contamination of drinking wa-ter and negatively influence its taste smell and appearance
Ammonium ions in groundwater originate mainly from the reduction of nitrates and nitrites in the presence of hydrogen sulphide or other reductive compounds From a sanitary point of view both the content of ammonium ions and their origin are important They are often gen-erated by decomposition of animal waste prod-ucts which pose a serious risk especially if wa-ter is used for consumption Non-organic origin of ammonium ions in water does not present a
29
Journal of Ecological Engineering vol 14(4) 2013
direct health risk as its toxic effects are seen when its intake exceeds 200 mgkg BW How-ever ammonium ions may reduce the efficacy of water disinfection cause nitrite formation hin-der manganese elimination and cause changes in water smell and taste [WHO 2004] Neverthe-less from 2007 the recommended permissible limit for ammonium ion in drinking water is 050 mgmiddotdm-3 NH4
+Chlorides may be an indicator of potential wa-
ter contamination but the risk of their presence in drinking water depends on natural conditions to a large extent [Kabata-Pendias Pendias 1999] In shallow groundwater layers contamination with chlorides often cause water salinity by inversion especially in urbanized areas and within rural in-frastructure [Macioszczyk Jeż 1995]
Liquid inclusions in the minerals of igne-ous rocks may be an additional source of small amounts of chlorides [Prince Edward Island 2000] Substantial amounts of Cl- ions may origi-nate from easily-soluble minerals of sedimentary rocks mainly from halite (NaCl) The origin of
chlorides is varied and a fraction of their amount may be supplied with precipitation especially on coastal marine areas and on saline soil The presence of chlorides in drinking water gives it a salty taste in the case of NaCl and salty-bitter taste with Ca2+ Mg2+ or NH4+ cations co-present with chlorides Taste perception is important as it determines common implementation of the regulations that limit the amount of Cl- in water intended for consumption Although the highest permissible limit of chlorides in drinking water is 250 mgmiddotdm-3 [The Regulation by the Minister of Health] the World Health Organization [Wen et al 2005] has not proposed any recommended per-missible limit of chlorides in water intended for consumption based on health premises The pres-ence of chlorides in water at 100 mgmiddotdm-3 causes its aggressive effects on iron and concrete
Considering the aforementioned the objec-tive of the paper was to determine the impact of utilization of wells on the utility value of water on the background of reaction variability and chang-es in ammonium ion and chloride concentrations
Table 1 Compilation of the existing well holes on the ldquoMotławardquo intake located in Tczew [Legal documentation on water utilization 2005]
Table 2 Compilation of the existing well holes on the ldquoParkrdquo intake situated in Tczew [Legal documentation on water utilization 2005]
The number of well Depth of well [m] Production capacity [m3h-1] Aquifer stages
1 1000 902 Tertiary
2 950 604 Tertiary
3 1000 1107 Tertiary
4 975 1107 Tertiary
5 1015 902 Tertiary
6 953 914 Tertiary
7 1500 858 Cretaceous
8 990 391 Tertiary
9 930 693 Tertiary
10 960 600 Tertiary
11 960 1020 Tertiary
The number of well Depth of well [m] Production capacity [m3h-1] Aquifer stages
1b 976 600 Quaternary-tertiary
5 960 743 Quaternary-tertiary
2a 1010 720 Quaternary-tertiary
4 920 600 Quaternary-tertiary
6 963 637 Quaternary-tertiary
K-1 1800 740 Cretaceous
K-2 1500 1384 Cretaceous
K-3 1600 880 Cretaceous
Journal of Ecological Engineering vol 14(4) 2013
30
MATERIALS AND METHODS
The studies were carried out on the intakes located in Tczew (E 18ordm46rsquo574rdquo N 54ordm05rsquo232rdquo) which supply water to approx 60 000 inhabitants Two intakes are the main source of drinking water (Tables 1 and 2) and they utilize groundwater from the tertiary and cretaceous stages (the ldquoMotławardquo intake Figure 1) and tertiary-quaternary and creta-ceous stages (the ldquoPark Miejskirdquo intake Figure 2)
The wells on the ldquoMotławardquo intake (Fig 1) de-rive groundwater from the cretaceous and tertiary aquifer layers The quaternary aquifer stages are supplied mainly by a lateral influx from the upland and to a minor extent by filtration from the tertiary stage and direct infiltration of precipitation and melting water and surface water The tertiary layer is supplied with a lateral influx and filtration
The oldest formations identified on the ldquoMotławardquo intake are marls and limestone reach-ing depths of 150 m whereas the oldest quaternary formations are aqua-glacial sands of mid-Polish glaciations linked to tertiary sands located under-neath The ldquoMotławardquo intake meets approx 65 of the requirements of the town and the approved utility resources are set at Qmax = 16 872 m3d-1 including the volume from the tertiary formations
at Qmax= 14712 m3d-1 (with the wells No 1 2 3 4 5 6 8 9 10 11) and from the cretaceous for-mations at Qmax= 2160 m3d-1 (with the well No 7) The wells are used alternately usually three to five of them at the same time Additional wells are mobilized occasionally in the case of a high intensity of distribution
Although the ldquoParkrdquo intake (Fig 2) from eight wells supplies approx 35 of the water to the municipal water pipeline the intake of water cannot exceed the utilization limits specified in the legal documentation on water utilization set at Qmax = 12 200 m3d-1 of which Qmax = 14 660 m3d-1 for quaternary-tertiary formations (with the wells No 1b 2a 4 5 6) and Qmax = 7540 m3d-1 for cretaceous formations (with the wells No K-1 K-2 K-3)
The oldest formations that were drilled dur-ing intake construction are cretaceous fine sands with a roof approx 200 m below the sea level and a depth of horizon of over 55 m They are covered with a complex of marls often with clefts Crevise water of the cretaceous stage is fed exclusively with filtration mainly from the tertiary aquifer layer The degree of mixing is variable which is indicated by unsteady salinity The quaternary-tertiary aquifer stage is composed of sands with a complete range of grain size composition and
Fig 1 Map at 1 25000 of the ldquoMotławardquo intake situated in Tczew [Legal documentation on water utilization 2005]
31
Journal of Ecological Engineering vol 14(4) 2013
at roof-adjacent zones they may be fed with car-bonaceous substances although near the bottom they may be muddy and contain glauconite
The thickness of the aquifer layer ranges from 12 to 19 m and the water mirror oscillates around 20 m below sea level (Fig 3) Under natural con-ditions water in the quaternary-tertiary aquifer stage flowed from the upland towards the east and the Vistula River Valley
The water parameters were tested with the fol-lowing methods reaction (pH) with potentiometric
method ammonium with colorimetric method us-ing Nesslerrsquos reagent at 410 nm wavelength and the thickness of cuvette at 5 mm and chlorides with titration with silver nitrate in relation to potassium chromate as an indicator [PN-75C-0461702 PN-75C-0454002 PN-75C0-0457601]
The results of the measurement of water op-erational capacity from the intakes (wells) and the legal documentation on water utilization were submitted by the manufacturer of water [Legal documentation on water utilization 2005] The
Fig 2 Map at 1 25000 of the intake ldquoParkrdquo located in Tczew [Legal documentation on water utilization 2005]
Fig 3 Depth of the wells (m) taking water from the aquifer layers QT K and T
Journal of Ecological Engineering vol 14(4) 2013
32
analysis of hydro-geological conditions was per-formed based on the documentation of the dispos-able groundwater resources [Kreczko et al 2000]
The data included several environmental fac-tors which were used in the statistical analysis for calculating correlations and in the one-way analysis of variance (ANOVA) with Duncanrsquos parametric test at p le005 The impact of environ-mental factors on the concentration of parameters in the analysed water samples was determined us-ing principal component analysis (PCA)
RESULTS
The results of the studies conducted in 1994ndash2009 on the water intakes located in Tczew dem-onstrated that the water reaction and concentra-tions of chlorides and ammonium varied across a wide range of values and were differentiated depending on the water intake and well depths as well as operational capacity (Table 3)
The reaction of tested water ranged from 710 to 780 on the intake ldquoParkrdquo and from 720 to 840 on the ldquoMotławardquo intake The average values in-dicate a comparable reaction of tested water re-gardless of the intake Higher diversification was found in water from different aquifer layers The statistical data shows that the reaction values of QT and T water stages were insignificant which is indicated by the same homogenous group in re-lation to significant differences recorded for wa-ter samples from the cretaceous stage expressed with a homogenous group
The presence of ammonia in water at higher concentrations may suggest an effect of anthro-pogenic factors as it is important in a techno-logical context
In the tested water samples the content of ammonia was diversified in the extreme ranges
Table 3 Profile of the environmental and chemical parameters of non-treated water on the ldquoParkrdquo and ldquoMotławardquo intakes (wells) in 1994ndash2009
Parameter Unit Tczew ldquoParkrdquo Tczew ldquoMotławardquo
for the examined intakes from 074 to 176 mg middot dm-3 NH4 for the ldquoParkrdquo intake and from 045 to 167 mg middot dm-3 NH4 for the ldquoMotławardquo intake (Table 3) However the values of this parameter were similar for both intakes (107 mgmiddotdm-3 NH4) what indicates comparable chemism conditions of this chemical group in the water samples col-lected from both intakes (Fig 5)
The diversification of this parameter was dem-onstrated for the aquifer stages (Fig 5) Similar to the reaction of water originating from QT and T layers the differences in the content of ammonia were statistically insignificant which is indicated by the same homogenous group The K water stages which were statistically included in the ho-mogenous group had a significantly lower content of ammonia than the QT and T water layers
Chlorides are another parameter which im-pact the quality of water and their presence is thus very important for humans The results (Table 3) show that the content of chlorides in groundwa-ter at both intakes varied across a wide range of values It is interesting to note that at comparable fluctuation ranges in the concentration of this ele-ment its average content was highly diversified between the intakes In the case of the ldquoParkrdquo intake the content was 527 mg middot dm-3 Cl and for the ldquoMotławardquo intake it was 141 mg middot dm-3 Cl
Statistically significant differences in the con-tent of chlorides (Fig 6) demonstrate that their concentration was influenced by a type of aquifer stages At QT and T stages that were predomi-nant in the area of ldquoParkrdquo intake the content of chlorides was at a comparable level Significantly higher concentrations of this element were de-tected in water from the cretaceous aquifer stage This factor may be associated with the type of layer as well as the depth of individual aquifer layer even though the strength of this relation-ship was different for the individual water intakes
33
Journal of Ecological Engineering vol 14(4) 2013
(Table 4) being the strongest for ldquoParkrdquo intake both in relation to the aquifer layer (r = 084) and to depth (r = 083)
In the face of increasing groundwater utiliza-tion it is recommended to wisely use water sourc-es in order to ensure abundant water resources for the next generations It is therefore important that a water supplier applies specific evaluation
systems for all extraction procedures in relation to for instance water protection to eliminate dif-ferent and changing factors while simultaneously monitoring water pollutant concentrations
The awareness of the general public as well as representatives of different industries should be involved to ensure the protection of ground-water quality and resources
Fig 4 Homogenous groups for the reaction (pH) of water at the tested groundwater intakes and the margin mean values depending on the aquifer stages
Fig 5 Homogenous groups for ammonia (mgmiddotdm-3NH4+) at the tested groundwater intakes
and the margin mean values depending on the aquifer stages
Journal of Ecological Engineering vol 14(4) 2013
34
Fig 6 Homogenous groups of chlorides (mgmiddotdm-3Cl) on the tested groundwater intakes and the margin mean values depending on the aquifer stages
Table 4 Pearsonrsquos simple correlation (r) coefficients at p lt005 for the intakes of untreated water
Parameter Water-bearing horizon Depth of well [m] Exploitation Reaction Ammonia
Intake located in Tczew ldquoPark and Motławardquo
Depth of well 057
Exploitation 037 018
Reaction 064 026 028
Ammonia -044 -024 -025 -037
Chlorides 020 051 -007 -009 -024
Intake located in Tczew ldquoParkrdquo
Depth of well 085
Exploitation 043 024
Reaction 071 066 026
Ammonia -058 -039 -039 -043
Chlorides 084 083 025 056 -045
Intake located in Tczew ldquoMotławardquo
Depth of well 050
Exploitation 015 024
Reaction 051 017 014
Ammonia -050 -013 -018 -045
Chlorides 020 017 -003 -014 -020
Explanation essential correlations
CONCLUSIONS
During water extraction from the intakes no significant changes in its quality and utility value were detected and it was not necessary to modify the treatment technology
It was demonstrated that regardless of intake volume the concentration of ammonia in water ex-ceeded the permissible sanitary limits which neces-sitated implementing a water treatment procedure
It was found that the type of aquifer creta-ceous stage exerted a significant impact on the
35
Journal of Ecological Engineering vol 14(4) 2013
increase in water reaction and the content of chlo-ride although it contributed to a decrease in am-monia concentration
REFERENCES
1 Kabata-Pendias A Pendias H 1999 Biogeo-chemia pierwiastkoacutew śladowych Wydawnictwo Naukowe PWN SA Warszawa pp 397
2 Macioszczyk A Jeż L 1995 Chlorki czułym wskaźnikiem zanieczyszczeń antropogenicznych woacuted podziemnych Mat VI Symp Wspoacutełczesne problemy hydrogeologiirdquo Krakoacutew-Krynica
3 Prince Edward Island 2000 Water Wise Chlo-ride httpwwwgovpeca
4 Rozporządzenie Ministra Zdrowia z dnia 29 marca 2007 r w sprawie jakości wody przeznaczonej do spożycia przez ludzi Dz U Nr 61 poz 417
5 PN-75c-0461702 Badania zawartości chlorkoacutew Oznaczanie chlorkoacutew w wodzie i ściekach metodą argentometrycznego miareczkowania 1-3
6 PN-90C-0454002 Badania pH kwasowości i zasadowości Oznaczanie kwasowości i zasado-
wości mineralnej i ogoacutelnej metodą miareczkowania wobec wskaźnikoacutew 1-2
7 PN-73C-0457601 Badania zawartości związkoacutew azotu Oznaczanie azotu amonowego metodą kolorymetryczną z odczynnikiem Nesslera 1-3
8 Kreczko M Kordalski Z Lidzbarski M Prusak E Sokołowski K 2000 Dokumentacja zasoboacutew dyspozycyjnych woacuted podziemnych Żuław i Mi-erzei Wiślanej Państwowy Instytut Geologiczny 23-46 79-92
9 Legal documentation on water utilization 2005Operaty wodnoprawne na poboacuter wody podziem-nej z utworoacutew trzeciorzędowych i kredowych ujęcia Motławardquo i Parkrdquo w Tczewie 2005 Bi-uro Studioacutew i Badań Geologicznych Gdańsk Własność ndash Zakład Wodociągoacutew i Kanalizacji w Tczewie 3-17
10 Wen X Wu Y Su J Zhang Y Liu F 2005 Hydrochemical characteristics and salinity of groundwater in the Ejina Basin Northern China Environ Geol 48
11 WHO 2004 Guidelines for drinking water qual-ity Genewa (vol 3) wwwwhoint water_sanita-tion _heath
Journal of Ecological Engineering vol 14(4) 2013
30
MATERIALS AND METHODS
The studies were carried out on the intakes located in Tczew (E 18ordm46rsquo574rdquo N 54ordm05rsquo232rdquo) which supply water to approx 60 000 inhabitants Two intakes are the main source of drinking water (Tables 1 and 2) and they utilize groundwater from the tertiary and cretaceous stages (the ldquoMotławardquo intake Figure 1) and tertiary-quaternary and creta-ceous stages (the ldquoPark Miejskirdquo intake Figure 2)
The wells on the ldquoMotławardquo intake (Fig 1) de-rive groundwater from the cretaceous and tertiary aquifer layers The quaternary aquifer stages are supplied mainly by a lateral influx from the upland and to a minor extent by filtration from the tertiary stage and direct infiltration of precipitation and melting water and surface water The tertiary layer is supplied with a lateral influx and filtration
The oldest formations identified on the ldquoMotławardquo intake are marls and limestone reach-ing depths of 150 m whereas the oldest quaternary formations are aqua-glacial sands of mid-Polish glaciations linked to tertiary sands located under-neath The ldquoMotławardquo intake meets approx 65 of the requirements of the town and the approved utility resources are set at Qmax = 16 872 m3d-1 including the volume from the tertiary formations
at Qmax= 14712 m3d-1 (with the wells No 1 2 3 4 5 6 8 9 10 11) and from the cretaceous for-mations at Qmax= 2160 m3d-1 (with the well No 7) The wells are used alternately usually three to five of them at the same time Additional wells are mobilized occasionally in the case of a high intensity of distribution
Although the ldquoParkrdquo intake (Fig 2) from eight wells supplies approx 35 of the water to the municipal water pipeline the intake of water cannot exceed the utilization limits specified in the legal documentation on water utilization set at Qmax = 12 200 m3d-1 of which Qmax = 14 660 m3d-1 for quaternary-tertiary formations (with the wells No 1b 2a 4 5 6) and Qmax = 7540 m3d-1 for cretaceous formations (with the wells No K-1 K-2 K-3)
The oldest formations that were drilled dur-ing intake construction are cretaceous fine sands with a roof approx 200 m below the sea level and a depth of horizon of over 55 m They are covered with a complex of marls often with clefts Crevise water of the cretaceous stage is fed exclusively with filtration mainly from the tertiary aquifer layer The degree of mixing is variable which is indicated by unsteady salinity The quaternary-tertiary aquifer stage is composed of sands with a complete range of grain size composition and
Fig 1 Map at 1 25000 of the ldquoMotławardquo intake situated in Tczew [Legal documentation on water utilization 2005]
31
Journal of Ecological Engineering vol 14(4) 2013
at roof-adjacent zones they may be fed with car-bonaceous substances although near the bottom they may be muddy and contain glauconite
The thickness of the aquifer layer ranges from 12 to 19 m and the water mirror oscillates around 20 m below sea level (Fig 3) Under natural con-ditions water in the quaternary-tertiary aquifer stage flowed from the upland towards the east and the Vistula River Valley
The water parameters were tested with the fol-lowing methods reaction (pH) with potentiometric
method ammonium with colorimetric method us-ing Nesslerrsquos reagent at 410 nm wavelength and the thickness of cuvette at 5 mm and chlorides with titration with silver nitrate in relation to potassium chromate as an indicator [PN-75C-0461702 PN-75C-0454002 PN-75C0-0457601]
The results of the measurement of water op-erational capacity from the intakes (wells) and the legal documentation on water utilization were submitted by the manufacturer of water [Legal documentation on water utilization 2005] The
Fig 2 Map at 1 25000 of the intake ldquoParkrdquo located in Tczew [Legal documentation on water utilization 2005]
Fig 3 Depth of the wells (m) taking water from the aquifer layers QT K and T
Journal of Ecological Engineering vol 14(4) 2013
32
analysis of hydro-geological conditions was per-formed based on the documentation of the dispos-able groundwater resources [Kreczko et al 2000]
The data included several environmental fac-tors which were used in the statistical analysis for calculating correlations and in the one-way analysis of variance (ANOVA) with Duncanrsquos parametric test at p le005 The impact of environ-mental factors on the concentration of parameters in the analysed water samples was determined us-ing principal component analysis (PCA)
RESULTS
The results of the studies conducted in 1994ndash2009 on the water intakes located in Tczew dem-onstrated that the water reaction and concentra-tions of chlorides and ammonium varied across a wide range of values and were differentiated depending on the water intake and well depths as well as operational capacity (Table 3)
The reaction of tested water ranged from 710 to 780 on the intake ldquoParkrdquo and from 720 to 840 on the ldquoMotławardquo intake The average values in-dicate a comparable reaction of tested water re-gardless of the intake Higher diversification was found in water from different aquifer layers The statistical data shows that the reaction values of QT and T water stages were insignificant which is indicated by the same homogenous group in re-lation to significant differences recorded for wa-ter samples from the cretaceous stage expressed with a homogenous group
The presence of ammonia in water at higher concentrations may suggest an effect of anthro-pogenic factors as it is important in a techno-logical context
In the tested water samples the content of ammonia was diversified in the extreme ranges
Table 3 Profile of the environmental and chemical parameters of non-treated water on the ldquoParkrdquo and ldquoMotławardquo intakes (wells) in 1994ndash2009
Parameter Unit Tczew ldquoParkrdquo Tczew ldquoMotławardquo
for the examined intakes from 074 to 176 mg middot dm-3 NH4 for the ldquoParkrdquo intake and from 045 to 167 mg middot dm-3 NH4 for the ldquoMotławardquo intake (Table 3) However the values of this parameter were similar for both intakes (107 mgmiddotdm-3 NH4) what indicates comparable chemism conditions of this chemical group in the water samples col-lected from both intakes (Fig 5)
The diversification of this parameter was dem-onstrated for the aquifer stages (Fig 5) Similar to the reaction of water originating from QT and T layers the differences in the content of ammonia were statistically insignificant which is indicated by the same homogenous group The K water stages which were statistically included in the ho-mogenous group had a significantly lower content of ammonia than the QT and T water layers
Chlorides are another parameter which im-pact the quality of water and their presence is thus very important for humans The results (Table 3) show that the content of chlorides in groundwa-ter at both intakes varied across a wide range of values It is interesting to note that at comparable fluctuation ranges in the concentration of this ele-ment its average content was highly diversified between the intakes In the case of the ldquoParkrdquo intake the content was 527 mg middot dm-3 Cl and for the ldquoMotławardquo intake it was 141 mg middot dm-3 Cl
Statistically significant differences in the con-tent of chlorides (Fig 6) demonstrate that their concentration was influenced by a type of aquifer stages At QT and T stages that were predomi-nant in the area of ldquoParkrdquo intake the content of chlorides was at a comparable level Significantly higher concentrations of this element were de-tected in water from the cretaceous aquifer stage This factor may be associated with the type of layer as well as the depth of individual aquifer layer even though the strength of this relation-ship was different for the individual water intakes
33
Journal of Ecological Engineering vol 14(4) 2013
(Table 4) being the strongest for ldquoParkrdquo intake both in relation to the aquifer layer (r = 084) and to depth (r = 083)
In the face of increasing groundwater utiliza-tion it is recommended to wisely use water sourc-es in order to ensure abundant water resources for the next generations It is therefore important that a water supplier applies specific evaluation
systems for all extraction procedures in relation to for instance water protection to eliminate dif-ferent and changing factors while simultaneously monitoring water pollutant concentrations
The awareness of the general public as well as representatives of different industries should be involved to ensure the protection of ground-water quality and resources
Fig 4 Homogenous groups for the reaction (pH) of water at the tested groundwater intakes and the margin mean values depending on the aquifer stages
Fig 5 Homogenous groups for ammonia (mgmiddotdm-3NH4+) at the tested groundwater intakes
and the margin mean values depending on the aquifer stages
Journal of Ecological Engineering vol 14(4) 2013
34
Fig 6 Homogenous groups of chlorides (mgmiddotdm-3Cl) on the tested groundwater intakes and the margin mean values depending on the aquifer stages
Table 4 Pearsonrsquos simple correlation (r) coefficients at p lt005 for the intakes of untreated water
Parameter Water-bearing horizon Depth of well [m] Exploitation Reaction Ammonia
Intake located in Tczew ldquoPark and Motławardquo
Depth of well 057
Exploitation 037 018
Reaction 064 026 028
Ammonia -044 -024 -025 -037
Chlorides 020 051 -007 -009 -024
Intake located in Tczew ldquoParkrdquo
Depth of well 085
Exploitation 043 024
Reaction 071 066 026
Ammonia -058 -039 -039 -043
Chlorides 084 083 025 056 -045
Intake located in Tczew ldquoMotławardquo
Depth of well 050
Exploitation 015 024
Reaction 051 017 014
Ammonia -050 -013 -018 -045
Chlorides 020 017 -003 -014 -020
Explanation essential correlations
CONCLUSIONS
During water extraction from the intakes no significant changes in its quality and utility value were detected and it was not necessary to modify the treatment technology
It was demonstrated that regardless of intake volume the concentration of ammonia in water ex-ceeded the permissible sanitary limits which neces-sitated implementing a water treatment procedure
It was found that the type of aquifer creta-ceous stage exerted a significant impact on the
35
Journal of Ecological Engineering vol 14(4) 2013
increase in water reaction and the content of chlo-ride although it contributed to a decrease in am-monia concentration
REFERENCES
1 Kabata-Pendias A Pendias H 1999 Biogeo-chemia pierwiastkoacutew śladowych Wydawnictwo Naukowe PWN SA Warszawa pp 397
2 Macioszczyk A Jeż L 1995 Chlorki czułym wskaźnikiem zanieczyszczeń antropogenicznych woacuted podziemnych Mat VI Symp Wspoacutełczesne problemy hydrogeologiirdquo Krakoacutew-Krynica
3 Prince Edward Island 2000 Water Wise Chlo-ride httpwwwgovpeca
4 Rozporządzenie Ministra Zdrowia z dnia 29 marca 2007 r w sprawie jakości wody przeznaczonej do spożycia przez ludzi Dz U Nr 61 poz 417
5 PN-75c-0461702 Badania zawartości chlorkoacutew Oznaczanie chlorkoacutew w wodzie i ściekach metodą argentometrycznego miareczkowania 1-3
6 PN-90C-0454002 Badania pH kwasowości i zasadowości Oznaczanie kwasowości i zasado-
wości mineralnej i ogoacutelnej metodą miareczkowania wobec wskaźnikoacutew 1-2
7 PN-73C-0457601 Badania zawartości związkoacutew azotu Oznaczanie azotu amonowego metodą kolorymetryczną z odczynnikiem Nesslera 1-3
8 Kreczko M Kordalski Z Lidzbarski M Prusak E Sokołowski K 2000 Dokumentacja zasoboacutew dyspozycyjnych woacuted podziemnych Żuław i Mi-erzei Wiślanej Państwowy Instytut Geologiczny 23-46 79-92
9 Legal documentation on water utilization 2005Operaty wodnoprawne na poboacuter wody podziem-nej z utworoacutew trzeciorzędowych i kredowych ujęcia Motławardquo i Parkrdquo w Tczewie 2005 Bi-uro Studioacutew i Badań Geologicznych Gdańsk Własność ndash Zakład Wodociągoacutew i Kanalizacji w Tczewie 3-17
10 Wen X Wu Y Su J Zhang Y Liu F 2005 Hydrochemical characteristics and salinity of groundwater in the Ejina Basin Northern China Environ Geol 48
11 WHO 2004 Guidelines for drinking water qual-ity Genewa (vol 3) wwwwhoint water_sanita-tion _heath
Journal of Ecological Engineering vol 14(4) 2013
32
analysis of hydro-geological conditions was per-formed based on the documentation of the dispos-able groundwater resources [Kreczko et al 2000]
The data included several environmental fac-tors which were used in the statistical analysis for calculating correlations and in the one-way analysis of variance (ANOVA) with Duncanrsquos parametric test at p le005 The impact of environ-mental factors on the concentration of parameters in the analysed water samples was determined us-ing principal component analysis (PCA)
RESULTS
The results of the studies conducted in 1994ndash2009 on the water intakes located in Tczew dem-onstrated that the water reaction and concentra-tions of chlorides and ammonium varied across a wide range of values and were differentiated depending on the water intake and well depths as well as operational capacity (Table 3)
The reaction of tested water ranged from 710 to 780 on the intake ldquoParkrdquo and from 720 to 840 on the ldquoMotławardquo intake The average values in-dicate a comparable reaction of tested water re-gardless of the intake Higher diversification was found in water from different aquifer layers The statistical data shows that the reaction values of QT and T water stages were insignificant which is indicated by the same homogenous group in re-lation to significant differences recorded for wa-ter samples from the cretaceous stage expressed with a homogenous group
The presence of ammonia in water at higher concentrations may suggest an effect of anthro-pogenic factors as it is important in a techno-logical context
In the tested water samples the content of ammonia was diversified in the extreme ranges
Table 3 Profile of the environmental and chemical parameters of non-treated water on the ldquoParkrdquo and ldquoMotławardquo intakes (wells) in 1994ndash2009
Parameter Unit Tczew ldquoParkrdquo Tczew ldquoMotławardquo
for the examined intakes from 074 to 176 mg middot dm-3 NH4 for the ldquoParkrdquo intake and from 045 to 167 mg middot dm-3 NH4 for the ldquoMotławardquo intake (Table 3) However the values of this parameter were similar for both intakes (107 mgmiddotdm-3 NH4) what indicates comparable chemism conditions of this chemical group in the water samples col-lected from both intakes (Fig 5)
The diversification of this parameter was dem-onstrated for the aquifer stages (Fig 5) Similar to the reaction of water originating from QT and T layers the differences in the content of ammonia were statistically insignificant which is indicated by the same homogenous group The K water stages which were statistically included in the ho-mogenous group had a significantly lower content of ammonia than the QT and T water layers
Chlorides are another parameter which im-pact the quality of water and their presence is thus very important for humans The results (Table 3) show that the content of chlorides in groundwa-ter at both intakes varied across a wide range of values It is interesting to note that at comparable fluctuation ranges in the concentration of this ele-ment its average content was highly diversified between the intakes In the case of the ldquoParkrdquo intake the content was 527 mg middot dm-3 Cl and for the ldquoMotławardquo intake it was 141 mg middot dm-3 Cl
Statistically significant differences in the con-tent of chlorides (Fig 6) demonstrate that their concentration was influenced by a type of aquifer stages At QT and T stages that were predomi-nant in the area of ldquoParkrdquo intake the content of chlorides was at a comparable level Significantly higher concentrations of this element were de-tected in water from the cretaceous aquifer stage This factor may be associated with the type of layer as well as the depth of individual aquifer layer even though the strength of this relation-ship was different for the individual water intakes
33
Journal of Ecological Engineering vol 14(4) 2013
(Table 4) being the strongest for ldquoParkrdquo intake both in relation to the aquifer layer (r = 084) and to depth (r = 083)
In the face of increasing groundwater utiliza-tion it is recommended to wisely use water sourc-es in order to ensure abundant water resources for the next generations It is therefore important that a water supplier applies specific evaluation
systems for all extraction procedures in relation to for instance water protection to eliminate dif-ferent and changing factors while simultaneously monitoring water pollutant concentrations
The awareness of the general public as well as representatives of different industries should be involved to ensure the protection of ground-water quality and resources
Fig 4 Homogenous groups for the reaction (pH) of water at the tested groundwater intakes and the margin mean values depending on the aquifer stages
Fig 5 Homogenous groups for ammonia (mgmiddotdm-3NH4+) at the tested groundwater intakes
and the margin mean values depending on the aquifer stages
Journal of Ecological Engineering vol 14(4) 2013
34
Fig 6 Homogenous groups of chlorides (mgmiddotdm-3Cl) on the tested groundwater intakes and the margin mean values depending on the aquifer stages
Table 4 Pearsonrsquos simple correlation (r) coefficients at p lt005 for the intakes of untreated water
Parameter Water-bearing horizon Depth of well [m] Exploitation Reaction Ammonia
Intake located in Tczew ldquoPark and Motławardquo
Depth of well 057
Exploitation 037 018
Reaction 064 026 028
Ammonia -044 -024 -025 -037
Chlorides 020 051 -007 -009 -024
Intake located in Tczew ldquoParkrdquo
Depth of well 085
Exploitation 043 024
Reaction 071 066 026
Ammonia -058 -039 -039 -043
Chlorides 084 083 025 056 -045
Intake located in Tczew ldquoMotławardquo
Depth of well 050
Exploitation 015 024
Reaction 051 017 014
Ammonia -050 -013 -018 -045
Chlorides 020 017 -003 -014 -020
Explanation essential correlations
CONCLUSIONS
During water extraction from the intakes no significant changes in its quality and utility value were detected and it was not necessary to modify the treatment technology
It was demonstrated that regardless of intake volume the concentration of ammonia in water ex-ceeded the permissible sanitary limits which neces-sitated implementing a water treatment procedure
It was found that the type of aquifer creta-ceous stage exerted a significant impact on the
35
Journal of Ecological Engineering vol 14(4) 2013
increase in water reaction and the content of chlo-ride although it contributed to a decrease in am-monia concentration
REFERENCES
1 Kabata-Pendias A Pendias H 1999 Biogeo-chemia pierwiastkoacutew śladowych Wydawnictwo Naukowe PWN SA Warszawa pp 397
2 Macioszczyk A Jeż L 1995 Chlorki czułym wskaźnikiem zanieczyszczeń antropogenicznych woacuted podziemnych Mat VI Symp Wspoacutełczesne problemy hydrogeologiirdquo Krakoacutew-Krynica
3 Prince Edward Island 2000 Water Wise Chlo-ride httpwwwgovpeca
4 Rozporządzenie Ministra Zdrowia z dnia 29 marca 2007 r w sprawie jakości wody przeznaczonej do spożycia przez ludzi Dz U Nr 61 poz 417
5 PN-75c-0461702 Badania zawartości chlorkoacutew Oznaczanie chlorkoacutew w wodzie i ściekach metodą argentometrycznego miareczkowania 1-3
6 PN-90C-0454002 Badania pH kwasowości i zasadowości Oznaczanie kwasowości i zasado-
wości mineralnej i ogoacutelnej metodą miareczkowania wobec wskaźnikoacutew 1-2
7 PN-73C-0457601 Badania zawartości związkoacutew azotu Oznaczanie azotu amonowego metodą kolorymetryczną z odczynnikiem Nesslera 1-3
8 Kreczko M Kordalski Z Lidzbarski M Prusak E Sokołowski K 2000 Dokumentacja zasoboacutew dyspozycyjnych woacuted podziemnych Żuław i Mi-erzei Wiślanej Państwowy Instytut Geologiczny 23-46 79-92
9 Legal documentation on water utilization 2005Operaty wodnoprawne na poboacuter wody podziem-nej z utworoacutew trzeciorzędowych i kredowych ujęcia Motławardquo i Parkrdquo w Tczewie 2005 Bi-uro Studioacutew i Badań Geologicznych Gdańsk Własność ndash Zakład Wodociągoacutew i Kanalizacji w Tczewie 3-17
10 Wen X Wu Y Su J Zhang Y Liu F 2005 Hydrochemical characteristics and salinity of groundwater in the Ejina Basin Northern China Environ Geol 48
11 WHO 2004 Guidelines for drinking water qual-ity Genewa (vol 3) wwwwhoint water_sanita-tion _heath
Journal of Ecological Engineering vol 14(4) 2013
34
Fig 6 Homogenous groups of chlorides (mgmiddotdm-3Cl) on the tested groundwater intakes and the margin mean values depending on the aquifer stages
Table 4 Pearsonrsquos simple correlation (r) coefficients at p lt005 for the intakes of untreated water
Parameter Water-bearing horizon Depth of well [m] Exploitation Reaction Ammonia
Intake located in Tczew ldquoPark and Motławardquo
Depth of well 057
Exploitation 037 018
Reaction 064 026 028
Ammonia -044 -024 -025 -037
Chlorides 020 051 -007 -009 -024
Intake located in Tczew ldquoParkrdquo
Depth of well 085
Exploitation 043 024
Reaction 071 066 026
Ammonia -058 -039 -039 -043
Chlorides 084 083 025 056 -045
Intake located in Tczew ldquoMotławardquo
Depth of well 050
Exploitation 015 024
Reaction 051 017 014
Ammonia -050 -013 -018 -045
Chlorides 020 017 -003 -014 -020
Explanation essential correlations
CONCLUSIONS
During water extraction from the intakes no significant changes in its quality and utility value were detected and it was not necessary to modify the treatment technology
It was demonstrated that regardless of intake volume the concentration of ammonia in water ex-ceeded the permissible sanitary limits which neces-sitated implementing a water treatment procedure
It was found that the type of aquifer creta-ceous stage exerted a significant impact on the
35
Journal of Ecological Engineering vol 14(4) 2013
increase in water reaction and the content of chlo-ride although it contributed to a decrease in am-monia concentration
REFERENCES
1 Kabata-Pendias A Pendias H 1999 Biogeo-chemia pierwiastkoacutew śladowych Wydawnictwo Naukowe PWN SA Warszawa pp 397
2 Macioszczyk A Jeż L 1995 Chlorki czułym wskaźnikiem zanieczyszczeń antropogenicznych woacuted podziemnych Mat VI Symp Wspoacutełczesne problemy hydrogeologiirdquo Krakoacutew-Krynica
3 Prince Edward Island 2000 Water Wise Chlo-ride httpwwwgovpeca
4 Rozporządzenie Ministra Zdrowia z dnia 29 marca 2007 r w sprawie jakości wody przeznaczonej do spożycia przez ludzi Dz U Nr 61 poz 417
5 PN-75c-0461702 Badania zawartości chlorkoacutew Oznaczanie chlorkoacutew w wodzie i ściekach metodą argentometrycznego miareczkowania 1-3
6 PN-90C-0454002 Badania pH kwasowości i zasadowości Oznaczanie kwasowości i zasado-
wości mineralnej i ogoacutelnej metodą miareczkowania wobec wskaźnikoacutew 1-2
7 PN-73C-0457601 Badania zawartości związkoacutew azotu Oznaczanie azotu amonowego metodą kolorymetryczną z odczynnikiem Nesslera 1-3
8 Kreczko M Kordalski Z Lidzbarski M Prusak E Sokołowski K 2000 Dokumentacja zasoboacutew dyspozycyjnych woacuted podziemnych Żuław i Mi-erzei Wiślanej Państwowy Instytut Geologiczny 23-46 79-92
9 Legal documentation on water utilization 2005Operaty wodnoprawne na poboacuter wody podziem-nej z utworoacutew trzeciorzędowych i kredowych ujęcia Motławardquo i Parkrdquo w Tczewie 2005 Bi-uro Studioacutew i Badań Geologicznych Gdańsk Własność ndash Zakład Wodociągoacutew i Kanalizacji w Tczewie 3-17
10 Wen X Wu Y Su J Zhang Y Liu F 2005 Hydrochemical characteristics and salinity of groundwater in the Ejina Basin Northern China Environ Geol 48
11 WHO 2004 Guidelines for drinking water qual-ity Genewa (vol 3) wwwwhoint water_sanita-tion _heath
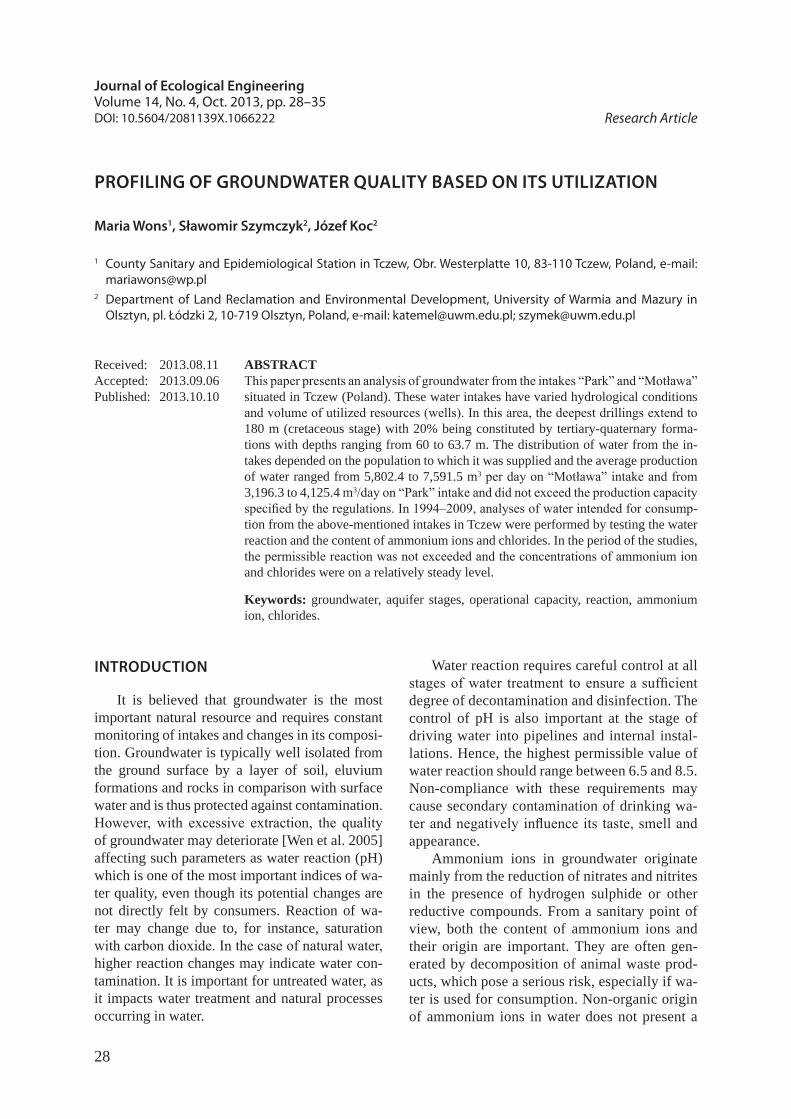
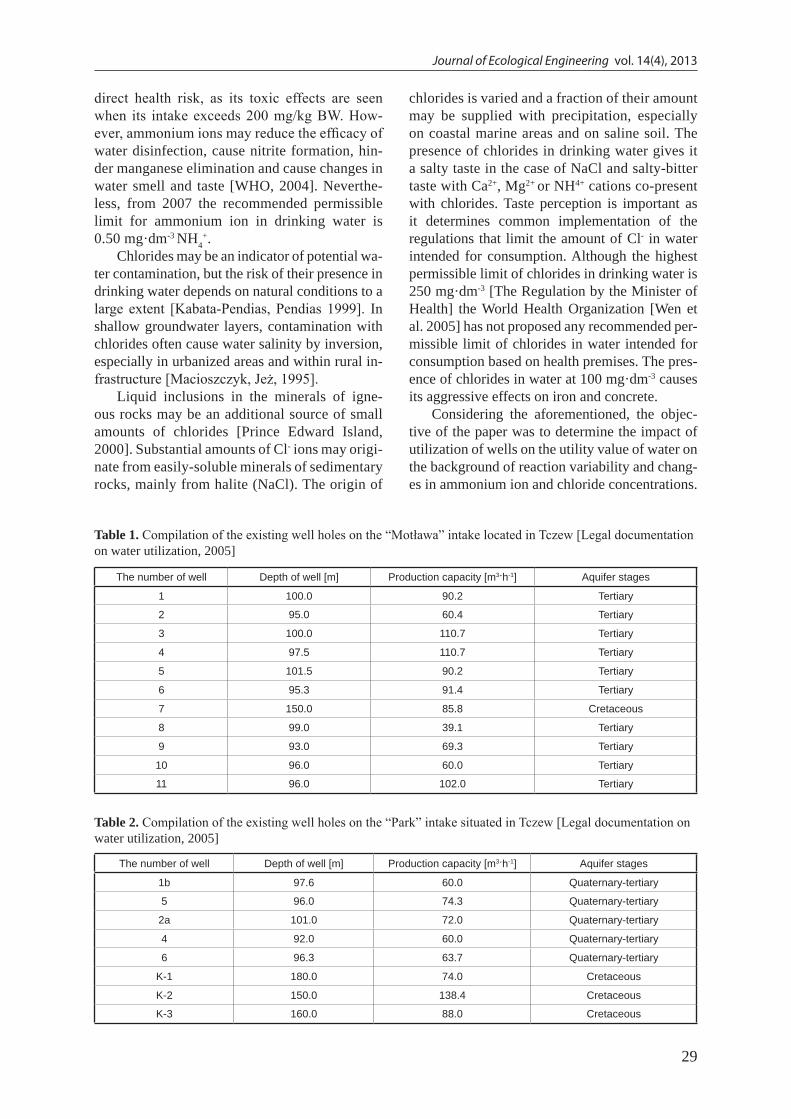

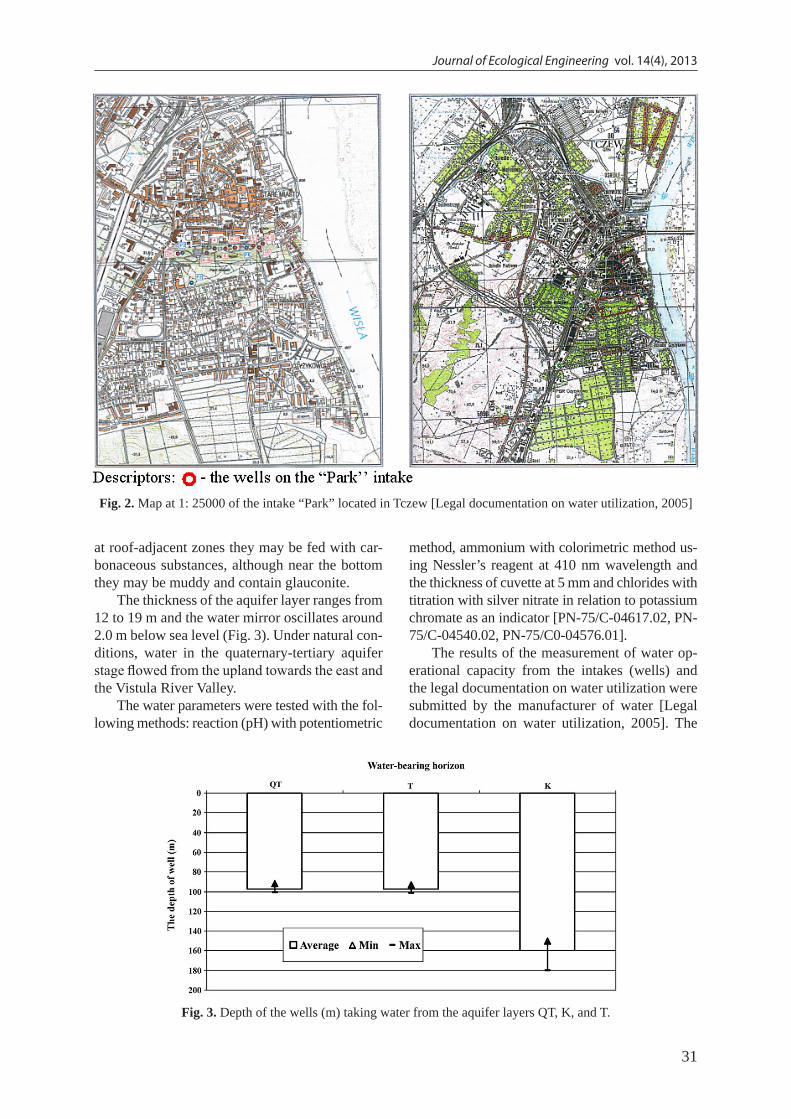

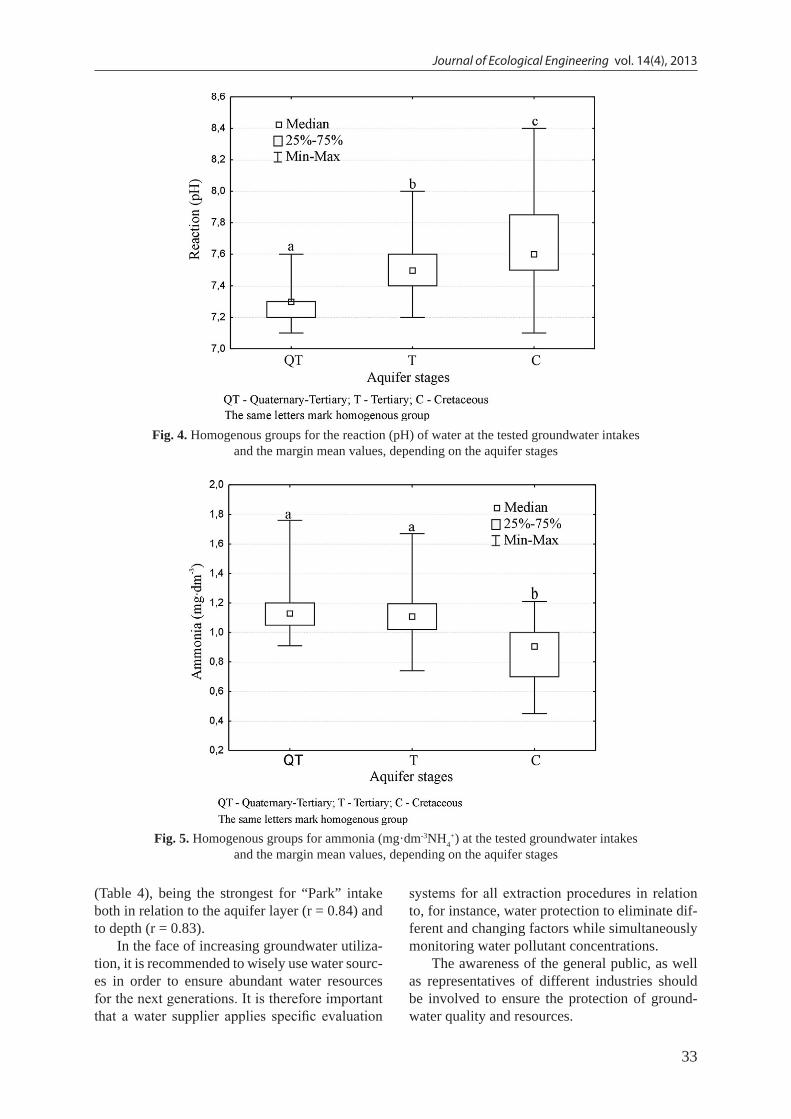


![Data Profiling Guide - start [Gerardnico] · PDF fileData Profiling Guide. Informatica PowerCenter Data Profiling Guide ... available at http:](https://static.documents.pub/doc/80x56/5aa4fb3a7f8b9ab4788c93d6/data-profiling-guide-start-gerardnico-profiling-guide-informatica-powercenter.jpg)


