Delivered by ICEVirtualLibrary.com to:
IP: 115.145.147.105
On: Wed, 13 Apr 2011 03:50:20
Magazine of Concrete Research, 2011, 63(4), 297–310
doi: 10.1680/macr.9.00170
Paper 900170
Received 15/09/2009; revised 29/05/2010; accepted 16/06/2010
Published online ahead of print 09/03/2011
Thomas Telford Ltd & 2011
Magazine of Concrete ResearchVolume 63 Issue 4
Progressive collapse-resisting capacity of RCbeam–column sub-assemblageChoi and Kim
Progressive collapse-resistingcapacity of RC beam–columnsub-assemblageH. ChoiResearch engineer, Research Institute of Technology, SamsungEngineering & Construction, Seoul, Korea
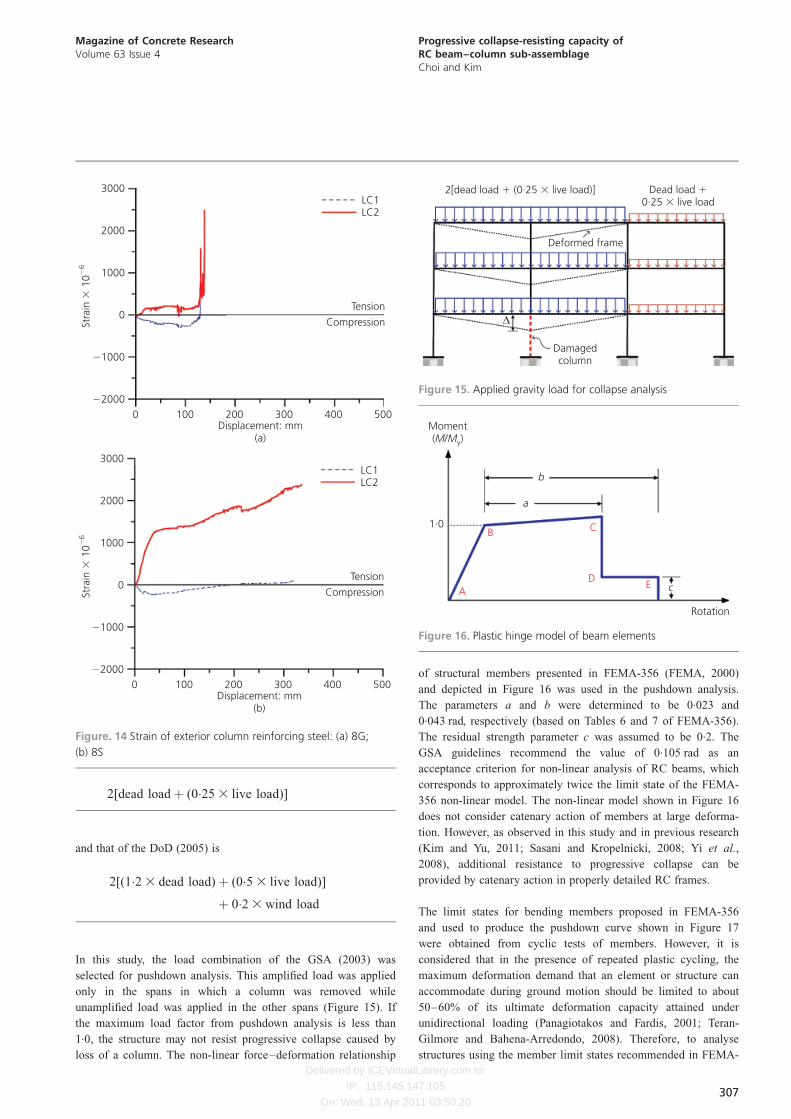
J. KimProfessor, Department of Architectural Engineering, SungkyunkwanUniversity, Suwon, Korea
Experiments were carried out to investigate the progressive collapse-resisting capacity of reinforced concrete beam–
column sub-assemblages designed with and without seismic load. The two-span sub-assemblages were designed as
part of five- and eight-storey reinforced concrete moment-resisting frames. The exterior columns of the right-hand
girders were designed to be 1.5 times larger in size than the middle columns to take into account continuation of
the girder. A monotonically increasing load was applied at the middle column of the specimens and force–
displacement relationships were plotted. It was observed that the non-seismically designed specimen failed by
crushing of concrete at the exterior column–girder joint of the left-hand girder before catenary action was activated.
However, the force–displacement relationship of the specimen designed for seismic load kept increasing after
fracture of the girder lower rebars near the middle column due to the catenary force of the upper rebars. Based on
the test results it was concluded that significant catenary action of girders could be induced in reinforced concrete
moment-resisting buildings designed as per current seismic design codes against progressive collapse initiated by
sudden loss of a column.
IntroductionFrom a series of accidents it was observed that, in order to
prevent progressive collapse, a structure should have continuity
for offering an alternate path and stability of the structure when
an element of vertical load-resisting systems is removed. Euro-
code 1 (CEN, 2002) presented a design standard for selecting
plan types for preventing progressive collapse and recommended
that buildings should be integrated. In the USA, the American
Concrete Institute (ACI, 2005) requires structural integrity (e.g.
continuity insurance of reinforcing bars) so that partial damage
by abnormal load does not result in total collapse. The American
Society of Civil Engineers (ASCE, 2005) recommends a design
method and load combination as well as structural integrity. The
General Service Administration (GSA, 2003) presented practical
design guidelines to reduce the collapse potential of federal
buildings and the Department of Defense (DoD, 2005) also
presented a guideline for new and existing DoD buildings.
Ellingwood (2006) summarised strategies for progressive col-
lapse risk mitigation and identified the challenges for implement-
ing general provisions in the design codes. Starossek (2007)
suggested that progressive collapse produced by various mechan-
isms can be classified into five distinct types: pancake, zipper,
domino, section and instability. Much research has been con-
ducted on the collapse behaviour of moment-resisting frames
caused by a sudden loss of columns (Khandelwal and El-Tawil,
2005; Kim and Kim, 2009, Kim et al., 2009a; Tsai and Lin
2008).
Recently, the effect of catenary action on progressive collapse has
been investigated. Kim and An (2009) investigated the effect of
catenary action on the progressive collapse potential of steel
structures. Milner et al. (2007) and Sasani and Kropelnicki
(2008) carried out experiments to study the behaviour of a scaled
model of a continuous perimeter beam in a reinforced concrete
(RC) frame structure following removal of a supporting column.
Yi et al. (2008) carried out a static experimental study of a three-
storey RC frame structure to investigate progressive failure due to
the loss of a lower storey column. In those experiments it was
observed that, after the plastic mechanism formed, the concrete
strain in the compression zone at the beam ends reached its
ultimate compressive strain and the compressive rebars were
gradually subject to tension with increasing displacement. Finally,
at large deformation, catenary action was activated in floor beams
due to the tensile resistance of the reinforcing bars.
Previous experimental research on RC beam–column sub-assem-
blages has been carried out under the assumption or experimental
condition that longitudinal rebars are continuous in both sides of
the spans from which a column is removed. In this study, monotonic
tests of RC beam–column sub-assemblages designed with and
without seismic load were carried out to investigate the progressive
collapse-resisting capacity. The two-span sub-assemblages were
designed as part of five- and eight-storey RC moment-resisting
frames. Based on the test results, the performance of an eight-storey
RC moment frame with a missing column was evaluated by
297
Delivered by ICEVirtualLibrary.com to:
IP: 115.145.147.105
On: Wed, 13 Apr 2011 03:50:20
pushdown analysis and the results were compared with those
obtained by using the member limit state recommended in FEMA-
356 (FEMA, 2000).
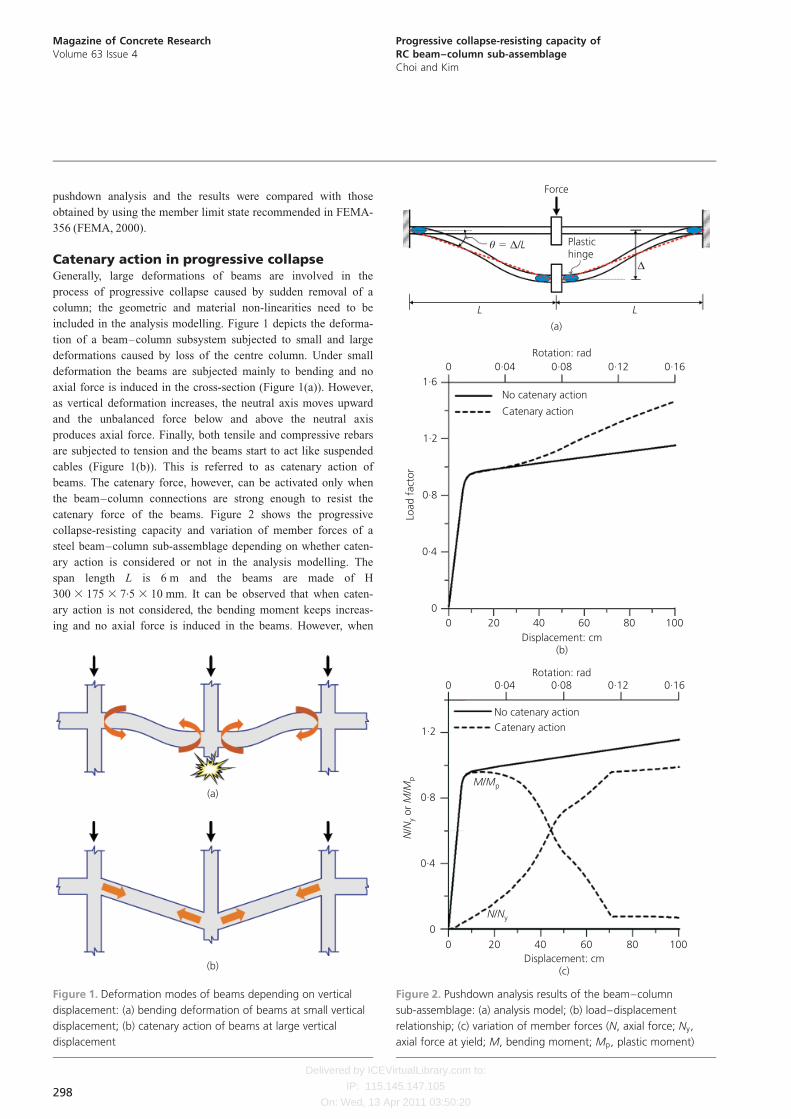
Catenary action in progressive collapseGenerally, large deformations of beams are involved in the
process of progressive collapse caused by sudden removal of a
column; the geometric and material non-linearities need to be
included in the analysis modelling. Figure 1 depicts the deforma-
tion of a beam–column subsystem subjected to small and large
deformations caused by loss of the centre column. Under small
deformation the beams are subjected mainly to bending and no
axial force is induced in the cross-section (Figure 1(a)). However,
as vertical deformation increases, the neutral axis moves upward
and the unbalanced force below and above the neutral axis
produces axial force. Finally, both tensile and compressive rebars
are subjected to tension and the beams start to act like suspended
cables (Figure 1(b)). This is referred to as catenary action of
beams. The catenary force, however, can be activated only when
the beam–column connections are strong enough to resist the
catenary force of the beams. Figure 2 shows the progressive
collapse-resisting capacity and variation of member forces of a
steel beam–column sub-assemblage depending on whether caten-
ary action is considered or not in the analysis modelling. The
span length L is 6 m and the beams are made of H
300 3 175 3 7.5 3 10 mm. It can be observed that when caten-
ary action is not considered, the bending moment keeps increas-
ing and no axial force is induced in the beams. However, when
(a)
(b)
Figure 1. Deformation modes of beams depending on vertical
displacement: (a) bending deformation of beams at small vertical
displacement; (b) catenary action of beams at large vertical
displacement
Rotation: rad0 0·04 0·08 0·12 0·16
No catenary action
Catenary action
1·6
1·2
0·8
0·4
00 20 40 60 80 100
Displacement: cm(b)
Load
fac
tor
Rotation: rad0 0·04 0·08 0·12 0·16
No catenary actionCatenary action1·2
0·8
0·4
00 20 40 60 80 100
Displacement: cm(c)
NM
/or
/y
pN
M
(a)
Force
θ /� ∆ L Plastichinge
∆
LL
M/ pM
N N/ y
Figure 2. Pushdown analysis results of the beam–column
sub-assemblage: (a) analysis model; (b) load–displacement
relationship; (c) variation of member forces (N, axial force; Ny,
axial force at yield; M, bending moment; Mp, plastic moment)
298
Magazine of Concrete ResearchVolume 63 Issue 4
Progressive collapse-resisting capacity ofRC beam–column sub-assemblageChoi and Kim
Delivered by ICEVirtualLibrary.com to:
IP: 115.145.147.105
On: Wed, 13 Apr 2011 03:50:20
catenary action is considered, the bending moment decreases after
flexural yielding and the axial force increases until tensile
yielding. Activation of catenary action in beams may help provide
an alternate load path in the case of progressive failure.
From analysis of RC moment frames it was observed that the
number of rebars – both longitudinal and transverse – is the
most important factor for early initiation of catenary action and
for achievement of high strength (Kim and Yu, 2011). In the
analysis it was assumed that the beam–column connections had
sufficient strength to resist the catenary force induced in the
beams. In practice, however, only a finite length of reinforcing
steel is embedded in the connections, especially in the exterior
connections, and it is not known whether the bond strength is
sufficient for activation of catenary action. The amount of
longitudinal steel and stirrups depends significantly on the design
load considered, as do the activation of catenary force and its
effect on progressive collapse-resisting capacity.
Experimental programme
Design of model structures and testing specimens
It has been reported that damage to the Alfred P. Murrah building
as a result of a bomb attack would have been significantly
reduced if the structure had been seismically designed (Elling-
wood et al., 2007). In the current work, five- and eight-storey RC
prototype structures were designed in accordance with ACI 318-
05 (ACI, 2005), with and without considering seismic load. The
storey heights of the model structures were 3.5 m, and the design
dead and live loads were 5.9 and 2.45 kN/m2, respectively. The
design spectral response acceleration parameters for seismic load,
SDS and SD1, were 0.44 and 0.23, respectively (in International
Building Code (ICC, 2006) format); the response modification
factor R was 5.0. A design compressive strength of concrete ( f 9c)
of 21 was used for the five-storey structure and 30 MPa for the
eight-storey structure. The yield strength of rebars was
Fy ¼ 392 MPa.
To evaluate the progressive collapse-resisting capacity of a
beam–column sub-assemblage, scaled models of the part en-
closed in the dotted curve in Figure 3 were manufactured for
testing. To compare the performance of the sub-assemblage
depending on concrete strength and amount and detailing of
rebars, four different specimens were constructed. The seismic
and non-seismic designed specimens of the five-storey structure
were named 5S and 5G, respectively, and those of the eight-storey
structure 8S and 8G, respectively. The detail design of the
specimens was conducted based on the ACI detailing manual
(ACI, 2004). The scales of the specimens corresponding to the
sub-assemblages of the five- and eight-storey structures were 37
and 35%, determined in consideration of the capacity of the
testing facility. Member sizes and rebar placements are shown in
Tables 1–4, and details of the rebar placements of specimens 8G
and 8S are depicted in Figure 4. The right-hand columns in the
test specimens were made 1.5 times larger than the left-hand
columns, considering the fact that girder rebars were continuous
through the internal columns. In the case of non-seismically
designed beams, bottom bars extended into the support (the
exterior column) without a hook. However, the top and bottom
bars of the seismically designed specimens were anchored with a
standard 908 hook into the exterior columns. To take into account
the continuation of the right-hand girder (G2 in Figure 3) in the
specimens, the longitudinal bars were anchored with the tail
extension of the hook. The length of the tail of the hook was
longer than that required in the code (ACI, 2004). D10 (nominal
diameter 9.53 mm) rebars were used for the main reinforcing
steel for beams and columns, and ˘6 steel bars were used for
stirrups and tie bars. From coupon tests of rebars used in the
specimens, it was observed that the yield and ultimate strengths
of the main rebars were 493 and 611 MPa, respectively, and those
of the stirrups and tie bars 363 and 423 MPa, respectively. It was
assumed that the five-storey structure was an old structure with
its concrete strength somewhat deteriorated. Specimens 5S and
5G were therefore cast with concrete with a higher water/cement
ratio; the concrete strength was determined to be 17 MPa from
cylinder tests. The concrete strength of specimens 8S and 8G was
30 MPa.
Test set-up
Figure 5 shows the test set-up for the specimens. The right- and
left-hand columns were fixed to the jigs and the actuator was
connected to the middle column. It was assumed that the middle
columns of the sub-assemblages were removed by accident and
displacement-controlled monotonic pushdown force was applied
at the middle column using a hydraulic actuator with a maximum
capacity of 2000 kN and maximum stroke of �250 mm. The tests
were carried out horizontally; to prevent vertical deflection of the
specimens due to self-weight, rollers were placed beneath the
beam–column joint during the test as shown in Figure 6. Strain
a b c d e f
5 @ 500 cm
3 @
700
cm
1
2
4
5
G1
G2
G2
G2
G2
G2
G2
G2
G2
G2
G2
G1
G3
G3
G3
G3
G3
G3
G4
G4
G4
G4
G4
G4
G4
G4
G4
G4
G4
G1
G1
G1
G1
G1
G1
G1
G1
C1
C1
C3
C1
C1
C2
C2
C4
C4
C4
C4
C4
C4
C4
C4
C3
C3
C2
C2
C2
C2
C2
C2
Region tobe tested
Figure 3. Plan layout of the prototype structures: C represents
column and G represents girder
299
Magazine of Concrete ResearchVolume 63 Issue 4
Progressive collapse-resisting capacity ofRC beam–column sub-assemblageChoi and Kim
Delivered by ICEVirtualLibrary.com to:
IP: 115.145.147.105
On: Wed, 13 Apr 2011 03:50:20
Member Column Beam (G2) (depth 3 width)
Exterior (C3) Interior (C4)
Prototype frame Size: mm 450 3 450 500 3 500 600 3 400
Rebar 4 D25 8 D25 Top 3 D25* 2 D25†
2 D25
Bottom 2 D25 3 D25
Specimen Size: mm 170 3 170 185 3 185 225 3 150
Rebar 4 D10 8 D10 Top 3 D10 2 D10
2 D10
Bottom 2 D10 3 D10
*Longitudinal reinforcement at both ends of beam†Longitudinal reinforcement at middle of beam
Table 1. Sectional properties of region tested in model 5S
(five-storey, seismic-load-resisting)
Member Column Beam (G2) (depth 3 width)
Exterior (C3) Interior (C4)
Prototype frame Size: mm 450 3 450 450 3 450 500 3 400
Rebar 4 D25 8 D25 Top 2 D25 2 D25
Bottom 2 D25 2 D25
Specimen Size: mm 170 3 170 170 3 170 185 3 150
Rebar 4 D10 8 D10 Top 2 D10 2 D10
Bottom 2 D10 2 D10
Table 2. Sectional properties of region tested in model 5G
(five-storey, gravity-load-resisting)
Member Column Beam (G2) (depth 3 width)
Exterior (C3) Interior (C4)
Prototype frame Size: mm 500 3 500 550 3 550 550 3 400
Rebar 6 D25 12 D25 Top 3 D25* 2 D25†
2 D25
Bottom 3 D25 3 D25
Specimen Size: mm 180 3 180 190 3 190 195 3 140
Rebar 6 D10 12 D10 Top 3 D10 2 D10
2 D10
Bottom 3 D10 3 D10
*Longitudinal reinforcement at both ends of beam†Longitudinal reinforcement at middle of beam
Table 3. Sectional properties of region tested in model 8S
(eight-storey, seismic-load-resisting frame)
300
Magazine of Concrete ResearchVolume 63 Issue 4
Progressive collapse-resisting capacity ofRC beam–column sub-assemblageChoi and Kim
Delivered by ICEVirtualLibrary.com to:
IP: 115.145.147.105
On: Wed, 13 Apr 2011 03:50:20
Member Column Beam (G2) (depth 3 width)
Exterior (C3) Interior (C4)
Prototype frame Size: mm 450 3 450 550 3 550 450 3 350
Rebar 4 D25 8 D25 Top 2 D25 2 D25
Bottom 2 D25 2 D25
Specimen Size: mm 160 3 160 190 3 190 160 3 125
Rebar 4 D10 8 D10 Top 2 D10 2 D10
Bottom 2 D10 2 D10
Table 4. Sectional properties of region tested in model 8G
(eight-storey, gravity-load-resisting frame)
160
LC1 LC2
1000
2 D10
2 D10
∅6
∅6
190
D10 ( 71 mmAs2� )
D10 ( 71 mmAs2� )
∅6 ( 28 mm )2As �
∅6 ( 28 mm )2As �
A�
A
285
125
160
<A–A section>�
<A–A section>� <B–B section>�
3770
4-4- 4-ba c
180
LC1LC2
LL
1000
2 D10
A�
A
2 D10195
140
190
B�
B
195
5 D10
285
2 D10140
3780
(a)
(b)
RL LR RR
Figure 4. Reinforcement detailing of the sub-assemblage
specimens (eight-storey structure): (a) gravity-load-resisting frame
(8G); (b) seismic load-resisting frame (8S). Dimensions in mm; As
is the cross-sectional area of steel bar
301
Magazine of Concrete ResearchVolume 63 Issue 4
Progressive collapse-resisting capacity ofRC beam–column sub-assemblageChoi and Kim
Delivered by ICEVirtualLibrary.com to:
IP: 115.145.147.105
On: Wed, 13 Apr 2011 03:50:20
gauges were attached on the longitudinal rebars located at the
ends of girders and at columns.
Experimental results
Failure modes of test specimens
Figure 7 shows the deformed shape and crack pattern of speci-
mens 8S and 8G. In specimen 8G (part of the eight-storey gravity-
load-resisting system), plastic hinges formed at the ends of the
girders accompanied by flexural cracks and crushing of concrete
under compression. As deflection increased, major cracks formed
at the exterior beam–column connection, which led to connection
failure (Figure 7(a)). It was also observed that, at failure, most
damage was concentrated at the ends of the beams. In specimen
8S (which is part of the seismic-load-resisting system), it was
noted that, after plastic hinges formed at both ends of the beams,
damage spread towards the centre of the beams (Figure 7(b)). This
is due to the enhanced amount of shear reinforcement at the ends
of the beams and the seismic detailing of the rebars at the beam–
column joints including anchoring of bottom rebars using standard
hooks. The cracks formed in the middle of the beams perpendi-
cular to the beam axis seemed to be results of catenary action of
the beams at large vertical displacement. Figures 8 and 9 show the
damage in the beam–exterior-column joints at failure of the sub-
assemblages. The damage states of both 5G and 5S, made of
concrete with a compressive strength of 17 MPa, are similar to
that of specimen 8G. This implies that concrete strength is an
important factor in preventing splitting of the concrete in a beam–
column joint and distributing damage along the beams. That is, to
activate catenary action of beams, the beam–column joint,
especially the exterior joints, should retain concrete strength
sufficient to resist the tensile force generated in the hooks of the
longitudinal bars even in seismic-load-resisting systems. In speci-
men 8G, the beam longitudinal steels (which were embedded in
the joints without hooks) were pulled out from the joints at joint
failure (Figure 9(a)). It was only in specimen 8S – designed with
seismic detailing and with a concrete compressive strength of
30 MPa – that major damage occurred at beam ends, not at the
joints, and cracks were distributed throughout the beams.
Force–displacement relationships
Figure 10 shows the load–displacement relationships of the sub-
assemblage specimens. It can be observed that the maximum
strengths of the sub-assemblages designed for seismic load are
almost twice as high as those of the specimens not designed for
seismic load. The strength of the specimens dropped rapidly
when the bottom rebars, which were subjected to tension,
fractured. The strength of specimen 8G, however, soon recovered
and kept increasing as catenary force of the beams contributed
from the top rebars was activated. At small deformation, the top
rebars were subjected mostly to compression; however, at large
deformation both top and bottom rebars were under tensile
catenary force and resisted collapse of the specimen. The
catenary forces of the other specimens could not be activated
since the concrete of the beam–column joints fail to provide
proper anchorage for the rebars. Based on the experimental
results, it can be concluded that RC moment frames that are
seismically designed using a concrete strength high enough to
provide strong anchorage for beam rebars can resist progressive
collapse by activation of beam catenary force.
In the experiments of Sasani and Kropelnicki (2008) and Yi et al.
(2008), which were carried out with interior girder–column sub-
assemblages, damage was observed only in the girders, not in the
girder–column joints. However, in this study of girder–column
sub-assemblages it was observed that the concrete strength and
anchoring detailing of rebars in an exterior joint played important
roles in activating catenary action of girders.
Strain of longitudinal rebars
Figure 11 shows normal strain of the rebars in specimen 8S,
which shows that the strain of all the rebars subjected to tensile
force reached 0.003 (the yield strain obtained from the coupon
test) at a vertical displacement of around or a little less than
50 mm. This corresponds well with the force–displacement
relationship of specimen 8S depicted in Figure 10(b), in which
the system yielded at a vertical displacement of about 50 mm.
First storey
Second storey
Interiorcolumn (C4)
Exteriorcolumn (C3)
C4
Actuator
Loading
Figure 5. Test set-up for the beam–column sub-assemblage
specimens
Specimen Actuator
Roller
Screw jackRoller
Floor
Figure 6. Supporting structure of the specimens
302
Magazine of Concrete ResearchVolume 63 Issue 4
Progressive collapse-resisting capacity ofRC beam–column sub-assemblageChoi and Kim
Delivered by ICEVirtualLibrary.com to:
IP: 115.145.147.105
On: Wed, 13 Apr 2011 03:50:20
The specimen showed ductile behaviour until the vertical dis-
placement reached about 250 mm. The force then increased again
until the strength suddenly dropped at a displacement of 363 mm
due to fracture of the bottom rebars in the right-hand girder.
Figure 11 shows that when the vertical displacement exceeded
250 mm, the strain of the compressive rebars started to decrease.
In particular, the bottom bars located in the left end of the left-
hand beam were subjected to tension when the vertical displace-
ment exceeded 315 mm.
The pushdown curve of specimen 8G, shown in Figure 10(b),
increased again at a vertical displacement of about 200 mm and
started to decrease as the displacement exceeded about 250 mm.
The strain–displacement relationship of the specimen 8G pre-
sented in Figure 12 shows that the strain of the rebars under
compression (the left-end bottom bars of left-hand beam (LL,
Figure 12(a)), the right-end top bars of the left-hand beam (RL,
Figure 12(b)) and the left-end top bars of the right-hand beam
(LR, Figure 12(c))) generally decreased after vertical displace-
ment of about 200 mm was reached. The strain then decreased to
zero and started to be subjected to tension. As vertical displace-
ment increases, however, the stress is reversed again and the
rebars located in RL and LR are subjected to compression. The
variation of rebar force seems to be due to the formation of
cracks, especially in the exterior beam–column joint. Figure
12(a) shows that the rebars located in the LL of specimen 8G are
subjected to compression (bottom bars) or to slight tension
(bottom bars) when vertical displacement exceeds 300 mm. This
implies that catenary force is not activated in the beam of the
specimen designed only for gravity load, even at large deforma-
tion. A similar phenomenon can be observed in specimen 5S, as
shown in Figure 13(a) in which all rebars are under compression
at large deformation. Figures 13(b) and 13(c) also show that the
strains of the top rebars of specimen 5S located at RL and LR
decrease at vertical displacements of 263 and 285 mm, respec-
tively. These displacements correspond to the points of rapid drop
Exterior column
Exterior column
(a)
(b)
Figure 7. Deformation configurations of the specimens at various
loading steps (sub-assemblage from the eight-storey structure):
(a) 8G; (b) 8S
303
Magazine of Concrete ResearchVolume 63 Issue 4
Progressive collapse-resisting capacity ofRC beam–column sub-assemblageChoi and Kim
Delivered by ICEVirtualLibrary.com to:
IP: 115.145.147.105
On: Wed, 13 Apr 2011 03:50:20
of force, as can be observed in the force–displacement relation-
ship depicted in Figure 10(a).
Figure 14 shows the axial strains of the exterior main rebar (LC1)
and the interior main rebar (LC2) of the exterior columns in
specimens 8G and 8S (the locations of the rebars LC1 and LC2
are depicted in Figure 4). It can be observed that the exterior
rebar of model 8G, which was subjected to compression at first,
started to resist tension at a vertical displacement of about
130 mm. However, the main rebar LC2 of model 8S started to be
subjected to tension at the larger displacement of about 200 mm,
due mainly to the more closely spaced tie bars. The interior rebar
LC2 in specimen 8S was also subjected to larger tension from the
first stage of loading.
Progressive collapse potential of eight-storeymodel structureIn this section, progressive collapse potential of the frame of the
eight-storey structure shown in Figure 3 (labelled fl) was
(a)
(b)
Figure 8. Damaged beam–column joints of the sub-assemblage
from the five-storey structure: (a) 5G; (b) 5S
(a)
(b)
Figure 9. Damaged beam–column joints of the sub-assemblage
from the eight-storey structure: (a) 8G; (b) 8S
304
Magazine of Concrete ResearchVolume 63 Issue 4
Progressive collapse-resisting capacity ofRC beam–column sub-assemblageChoi and Kim
Delivered by ICEVirtualLibrary.com to:
IP: 115.145.147.105
On: Wed, 13 Apr 2011 03:50:20
evaluated by pushdown analysis using the program code
SAP2000 (CSI, 2004). The pushdown analysis was applied by
gradually increasing the vertical displacement of the girder-
removed column joint and computing element forces correspond-
ing to the given deformation level to investigate the resistance of
the structure against progressive collapse. Publications of the
GSA (2003) and DoD (2005) proposed an amplification factor of
2 for static analysis to account for dynamic redistribution of
forces. The load combination proposed by the GSA (2003) is
5S
5S
5G
5G
Fractures of rebars
Fractures of rebars
Fractures of rebars
Fractures of rebars
0
0
100
100
200
200
300
300
400
400
500
500
Displacement: mm(a)
Displacement: mm(b)
0
0
0·06
0·06
0·12
0·13
0·18
0·19
0·24
0·26
0·30
0·32
50
100
40
80
30
60
20
40
10
20
0
0
Forc
e: k
NFo
rce:
kN
Rotation, : rad∆/L
Rotation, : rad∆/L
Figure 10. Load–displacement relationships of (a) sub-assemblage
from five-storey structure and (b) sub-assemblage from
eight-storey structure
Top bar
Top bar
Top bar
Bottom bar
Bottom bar
Bottom bar
Tension
Tension
Tension
Compression
Compression
Compression
20000
20000
20000
15000
15000
15000
10000
10000
10000
5000
5000
5000
0
0
0
�5000
�5000
�5000
�10000
�10000
�10000
�15000
�15000
�15000
Stra
in10
��
6St
rain
10�
�6
Stra
in10
��
6
0
0
0
100
100
100
200
200
200
300
300
300
400
400
400
500
500
500
Displacement: mm(a)
Displacement: mm(b)
Displacement: mm(c)
Figure 11. Strain of beam reinforcing steel in specimen 8S:
(a) left end of left-hand beam (LL); (b) right end of left-hand beam
(RL); (c) left end of right-hand beam (LR)
305
Magazine of Concrete ResearchVolume 63 Issue 4
Progressive collapse-resisting capacity ofRC beam–column sub-assemblageChoi and Kim
Delivered by ICEVirtualLibrary.com to:
IP: 115.145.147.105
On: Wed, 13 Apr 2011 03:50:20
Top bar
Top bar
Top bar
Bottom bar
Bottom bar
Bottom bar
Tension
Tension
Tension
Compression
Compression
Compression
12000
12000
12000
9000
9000
9000
3000
3000
3000
6000
6000
6000
0
0
0
�3000
�3000
�3000
Stra
in10
��
6St
rain
10�
�6
Stra
in10
��
6
0
0
0
100
100
100
200
200
200
300
300
300
400
400
400
500
500
500
Displacement: mm(a)
Displacement: mm(b)
Displacement: mm(c)
Figure 12. Strain of beam reinforcing steel in specimen 8G:
(a) left end of left-hand beam (LL); (b) right end of left-hand beam
(RL); (c) left end of right-hand beam (LR)
Top bar
Top bar
Top bar
Bottom bar
Bottom bar
Bottom bar
Tension
Tension
Tension
Compression
Compression
Compression
6000
�20000
4000
15000
15000
2000
10000
10000
5000
5000
0
0
0
�2000
�5000
�5000
�4000
�10000
�20000
�10000
�6000
�15000
�15000
Stra
in10
��
6St
rain
10�
�6
Stra
in10
��
6
0
0
0
100
100
100
200
200
200
300
300
300
400
400
400
500
500
500
Displacement: mm(a)
Displacement: mm(b)
Displacement: mm(c)
Figure 13. Strain of beam reinforcing steel in specimen 5S:
(a) left end of left-hand beam (LL); (b) right end of left-hand beam
(RL); (c) left end of right-hand beam (LR)
306
Magazine of Concrete ResearchVolume 63 Issue 4
Progressive collapse-resisting capacity ofRC beam–column sub-assemblageChoi and Kim
Delivered by ICEVirtualLibrary.com to:
IP: 115.145.147.105
On: Wed, 13 Apr 2011 03:50:20
2[dead loadþ (0:253 live load)]
and that of the DoD (2005) is
2[(1:23 dead load)þ (0:53 live load)]
þ 0:23 wind load
In this study, the load combination of the GSA (2003) was
selected for pushdown analysis. This amplified load was applied
only in the spans in which a column was removed while
unamplified load was applied in the other spans (Figure 15). If
the maximum load factor from pushdown analysis is less than
1.0, the structure may not resist progressive collapse caused by
loss of a column. The non-linear force–deformation relationship
of structural members presented in FEMA-356 (FEMA, 2000)
and depicted in Figure 16 was used in the pushdown analysis.
The parameters a and b were determined to be 0.023 and
0.043 rad, respectively (based on Tables 6 and 7 of FEMA-356).
The residual strength parameter c was assumed to be 0.2. The
GSA guidelines recommend the value of 0.105 rad as an
acceptance criterion for non-linear analysis of RC beams, which
corresponds to approximately twice the limit state of the FEMA-
356 non-linear model. The non-linear model shown in Figure 16
does not consider catenary action of members at large deforma-
tion. However, as observed in this study and in previous research
(Kim and Yu, 2011; Sasani and Kropelnicki, 2008; Yi et al.,
2008), additional resistance to progressive collapse can be
provided by catenary action in properly detailed RC frames.
The limit states for bending members proposed in FEMA-356
and used to produce the pushdown curve shown in Figure 17
were obtained from cyclic tests of members. However, it is
considered that in the presence of repeated plastic cycling, the
maximum deformation demand that an element or structure can
accommodate during ground motion should be limited to about
50–60% of its ultimate deformation capacity attained under
unidirectional loading (Panagiotakos and Fardis, 2001; Teran-
Gilmore and Bahena-Arredondo, 2008). Therefore, to analyse
structures using the member limit states recommended in FEMA-
0
0
100
100
200
200
300
300
400
400
500
500
Displacement: mm(a)
Displacement: mm(b)
�2000
�2000
�1000
�1000
0
0
1000
1000
2000
2000
3000
3000
Stra
in10
��
6St
rain
10�
�6
Tension
Tension
Compression
Compression
LC1
LC1
LC2
LC2
Figure. 14 Strain of exterior column reinforcing steel: (a) 8G;
(b) 8S
2[dead load (0·25 live load)]� � Dead load0·25 live load
��
Deformed frame
∆
Damagedcolumn
Figure 15. Applied gravity load for collapse analysis
Moment( / )M My
1·0
a
b
A
B C
DE c
Rotation
Figure 16. Plastic hinge model of beam elements
307
Magazine of Concrete ResearchVolume 63 Issue 4
Progressive collapse-resisting capacity ofRC beam–column sub-assemblageChoi and Kim
Delivered by ICEVirtualLibrary.com to:
IP: 115.145.147.105
On: Wed, 13 Apr 2011 03:50:20
356 may underestimate their progressive collapse-resisting capa-
city. Therefore, in addition to the FEMA-recommended para-
meters for the non-linear force–deformation relationship, the
values recommended in the GSA guidelines for RC beams and
those determined based on the experimental results obtained in
this study were also applied in the pushdown analysis and the
results were compared. It can be observed in Figure 2(b) that
when the pushdown curve starts to re-increase due to catenary
action, the bending moment starts to decrease. In the pushdown
curve of specimen 8S shown in Figure 10(b), this point corre-
sponds to vertical displacement of approximately 250 mm. This
displacement divided by the span length (1565 mm) results in
beam rotation of 0.15 rad, which is a little larger than the GSA-
recommended value of 0.105 rad.
Figure 17 shows the pushdown curves of the model structure
obtained using the FEMA-recommended force–deformation rela-
tionship, with and without considering catenary action, with the
first-storey second column from the left removed. The maximum
strength is close to (but slightly less than) 1.0, which does not
satisfy the safety criterion specified in the GSA guidelines.
However, previous research (Kim et al., 2009b) showed that
structures with a maximum strength of less than 1.0 obtained
from pushdown analysis might prove to have enough strength to
resist progressive collapse through dynamic analysis, especially
when the maximum strength is close to 1.0. In the case catenary
action was not considered, the curve decreased more rapidly after
maximum strength was reached. Figures 18 and 19 compare the
distribution of axial force and bending moment of structural
elements at a vertical displacement of 500 mm. When catenary
action was not considered (Figure 18), collapse was resisted by
the bending moments of the girders and axial forces of the
columns. However, when catenary action was considered (Figure
19), the bending moments were reduced but axial forces of
girders were significantly increased. This resulted in an increase
of the pushdown curve.
Figure 20 compares the pushdown curves of the model structure
obtained using the FEMA-356 non-linear force–deformation
Geometric non-linearityNo geometric non-linearity
1·4
1·2
1·0
0·6
0·4
0·2
0
Load
fac
tor
0·8
0 100 200 300 400 500 600Displacement: mm
Figure 17. Pushdown curves of the eight-storey analysis model
with and without considering geometric non-linearityz
z
x
x
(a)
(b)
Figure 18. Member force at vertical displacement of 500 mm
without considering catenary action: (a) axial force; (b) bending
moment
308
Magazine of Concrete ResearchVolume 63 Issue 4
Progressive collapse-resisting capacity ofRC beam–column sub-assemblageChoi and Kim
Delivered by ICEVirtualLibrary.com to:
IP: 115.145.147.105
On: Wed, 13 Apr 2011 03:50:20
parameters and the parameters obtained from the experiment.
When the FEMA-356 parameters were used, the pushdown curve
started to decrease at a vertical displacement of approximately
130 mm. However, the pushdown curve obtained using the
experimental force–displacement relationship kept increasing,
similar to the experimental results of specimen 8S. When the
GSA-recommended limit state was applied, the strength started to
decrease at a vertical displacement of approximately 500 mm.
Therefore, based on the limited test results obtained in this study,
the limit states recommended in the GSA guidelines are consid-
ered to be more reasonable than the non-linear model based on
FEMA-356 in defining the progressive collapse-resisting capacity
of RC moment frames.
ConclusionsExperiments were carried out to investigate the progressive
collapse-resisting capacity of RC beam–column sub-assemblages
designed with and without seismic load. The two-span sub-
assemblages were designed as part of five- and eight-storey RC
moment-resisting frames. Based on the test results, the perform-
ance of an eight-storey RC moment frame with a missing column
was evaluated by pushdown analysis and the results were com-
pared with those obtained by using the limit states recommended
in FEMA-356 and the GSA guidelines.
According to the experimental results, the force–displacement
relationship of the specimen designed for seismic loading and
having adequate concrete strength kept increasing even after
fracture of the lower rebars due to the catenary action of the
upper rebars. However, the non-seismically designed specimens
(designed with wider-spaced stirrups/tie bars and with their lower
beam longitudinal rebars not anchored by standard hooks) failed
by pulling out of rebars and crushing of concrete at the exterior
column–girder joint before catenary action was activated. The
seismically designed specimen with low-strength concrete failed
by joint failure before catenary action was activated. Based on
the test results, it was concluded that RC moment-resisting
buildings designed with seismic detailing might have significant
resisting capacity against progressive collapse initiated by sudden
(a)
(b)
z
z
x
x
Figure 19. Member force at vertical displacement of 500 mm
considering catenary action: (a) axial force; (b) bending moment
1·6
1·4
1·2
1·0
0·8
0·6
0·4
0·2
00 100 200 300 400 500 600
Displacement: mm
Envelope of post-yieldstiffness
Plastic hinge modelling parameters
FEMA-356
GSATest result
Load
fac
tor
Figure 20. Pushdown curves of the beam–column
sub-assemblage structure using different plastic hinge modelling
parameters
309
Magazine of Concrete ResearchVolume 63 Issue 4
Progressive collapse-resisting capacity ofRC beam–column sub-assemblageChoi and Kim
Delivered by ICEVirtualLibrary.com to:
IP: 115.145.147.105
On: Wed, 13 Apr 2011 03:50:20
loss of a column; non-seismically designed structures or seismi-
cally designed structures with deteriorated concrete strength
might be vulnerable to progressive collapse. Finally, the non-
linear pushdown analysis of the prototype structure showed that
the limit states recommended in the GSA guidelines are more
reasonable than the FEMA-356-based non-linear model for
defining the progressive collapse-resisting capacity of RC mo-
ment frames.
AcknowledgementThis research was financially supported by the super-tall building
R&D project of the Korean Ministry of Land, Transport, and
Maritime Affairs (09CHUD-A053106-01-000000).
REFERENCES
ACI (American Concrete Institute) (2004) ACI Committee 315
Detailing Manual. ACI, Farmington Hills, MI, publication
SP-66(04).
ACI (2005) Committee 318 Building Code Requirements for
Structural Concrete and Commentary. ACI, Detroit, MI.
ASCE (American Society of Civil Engineers) (2005) ASCE7-05:
Minimum design loads for buildings and other structures.
ASCE, New York.
CEN (European Committee of Standardization) (2002) Eurocode
1, Actions on Structures. CEN, Brussels.
CSI (Computer and Structures, Inc.) (2004) SAP2000, Structural
Analysis Program. CSI, Berkeley, CA.
DoD (Department of Defense) (2005) Design of Buildings to
Resist Progressive Collapse. Unified Facilities Criteria (UFC)
4-023-03. DoD, Washington, DC.
Ellingwood BR (2006) Mitigating risk from abnormal loads and
progressive collapse. Journal of Performance of Constructed
Facilities 20(4): 315–323.
Ellingwood BR, Smilowitz R, Dusenberry DO, et al. (2007) Best
Practices for Reducing the Potential for Progressive Collapse
in Buildings. National Institute of Standards for Technology,
Gaithersburg, MD, Report NISTIR 7396.
FEMA (Federal Emergency Management Agency) (2000)
Prestandard and Commentary for the Seismic Rehabilitation
of Buildings. FEMA, Washington, DC, Report FEMA-356.
GSA (General Services Administration) (2003) Progressive
Collapse Analysis and Design Guidelines for New Federal
Office Buildings and Major Modernization Projects. GSA,
Washington, DC.
ICC (International Code Council) (2006) International Building
Code. ICC, Falls Church, VA.
Khandelwal K and El-Tawil S (2005) Progressive collapse of
moment resisting steel frame buildings. Proceedings of the
2005 Structures Congress and the 2005 Forensic Engineering
Symposium, New York.
Kim H, Kim J and An D (2009a) Development of integrated
system for progressive collapse analysis of building structures
considering dynamic effects. Advances in Engineering
Software Archive 40(1): 1–8.
Kim J and An D (2009) Evaluation of progressive collapse
potential of steel moment frames considering catenary action.
The Structural Design of Tall and Special Buildings 18(4):
455–465.
Kim J and Yu J (2011) Progressive collapse analysis of reinforced
concrete moment frames considering geometric nonlinearity.
Magazine of Concrete Research, in press.
Kim T and Kim J (2009) Collapse analysis of steel moment frames
with various seismic connections. Journal of Constructional
Steel Research 65(6): 1316–1322.
Kim T, Kim J and Park J (2009b) Investigation of progressive
collapse-resisting capability of steel moment frames using
push-down analysis. Journal of Performance of Constructed
Facilities 23(5): 327–335.
Milner D, Gran J, Lawver D, et al. (2007) FLEX analysis and
scaled testing for prediction of progressive collapse.
Proceedings of 1st International Workshop on Performance,
Protection and Strengthening of Structures under Extreme
Loading (Protect 2007), Whistler, Canada.
Panagiotakos TB and Fardis MN (2001) Deformations of
reinforced concrete members at yielding and ultimate. ACI
Structural Journal 98(2): 135–148.
Sasani M and Kropelnicki J (2008) Progressive collapse analysis
of an RC structure. The Structural Design of Tall and Special
Buildings 17(4): 757–771.
Starossek U (2007) Typology of progressive collapse. Engineering
Structures 29(9): 2302–2307.
Teran-Gilmore A and Bahena-Arredondo N (2008) Cumulative
ductility spectra for seismic design of ductile structures
subjected to long duration motions: concept and theoretical
background. Journal of Earthquake Engineering 12(1): 152–
172.
Tsai MH and Lin BH (2008) Investigation of progressive collapse
resistance and inelastic response for an earthquake-resistant
RC building subjected to column failure. Engineering
Structures 30(12): 3619–3628.
Yi WJ, He QF, Xiao Y and Kunnath SK (2008) Experimental study
on progressive collapse-resistant behavior of reinforced
concrete frame structures. ACI Structural Journal 105(4):
433–439.
WHAT DO YOU THINK?
To discuss this paper, please submit up to 500 words to
the editor at www.editorialmanager.com/macr by 1 Octo-
ber 2011. Your contribution will be forwarded to the
author(s) for a reply and, if considered appropriate by
the editorial panel, will be published as a discussion in a
future issue of the journal.
310
Magazine of Concrete ResearchVolume 63 Issue 4
Progressive collapse-resisting capacity ofRC beam–column sub-assemblageChoi and Kim