17
Progressive Taxation Progressive Taxation Mark Huggett 1 1 Georgetown March 22, 2018
| Date post: | 06-Jun-2018 |
| Category: |
Documents |
| Upload: | truongnhan |
| View: | 228 times |
| Download: | 0 times |

Progressive Taxation
Progressive Taxation
Mark Huggett1
1Georgetown
March 22, 2018

Progressive Taxation
In “The Case for a Progressive Tax: From Basic Research to PolicyRecommendations”, Diamond and Saez (2011) review the literature onoptimal taxation to distill a few policy recommendations:
I “Recommendation 1: Very high earners should be subject to risingmarginal tax rates and higher rates than current U.S. policy for topearners.”
I The formula τ∗ = 1/(1 + aε) specifies the top tax rate τ∗ thatmaximizes revenue from top earners.
I τ∗ = 1/(1 + aε) = 1/(1 + 1.5× 0.25) = .73, given their reading ofUS evidence (a = 1.5, ε = 0.25).
I These notes highlight the (i) theory, (ii) data and (iii) empiricalmethods behind this calculation.

Progressive Taxation
Theory: τ ∗ = 1/(1 + aε)
I Step 1: Define Revenue(τ) to be revenue (per person) from topearners for earnings above a threshold e:
Revenue(τ) = τE[e− e]
Comment:1. E[e− e] is a short-hand notation that expresses the calculation ofmean earnings in excess of the threshold e per agent, among themodel agents with earnings in excess of the threshold e.2. E[e− e] is a function of the tax rate τ on top earners.3. The theory ignores the possibility that tax revenue changes due tothe behavior of earners below e when the top tax rate τ changes.

Progressive Taxation
I Step 2: Maximum revenue: dRevenue(τ)dτ = dτE[e−e]
dτ = 0
E[e− e] + τdE[e− e]d(1− τ)
d(1− τ)
dτ= 0
E[e− e]− τ dE[e− e]d(1− τ)
= 0
E[e− e]− τ
(1− τ)
{dE[e]
d(1− τ)
(1− τ)
E[e]
}E[e] = 0
1− τ
(1− τ)
{dE[e]
d(1− τ)
(1− τ)
E[e]
}E[e]
E[e− e]= 0
Progressive Taxation
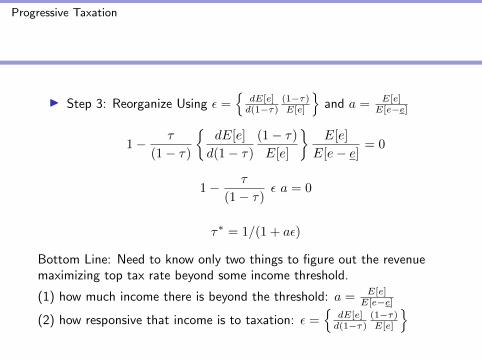
I Step 3: Reorganize Using ε ={
dE[e]d(1−τ)
(1−τ)E[e]
}and a = E[e]
E[e−e]
1− τ
(1− τ)
{dE[e]
d(1− τ)
(1− τ)
E[e]
}E[e]
E[e− e]= 0
1− τ
(1− τ)ε a = 0
τ∗ = 1/(1 + aε)
Bottom Line: Need to know only two things to figure out the revenuemaximizing top tax rate beyond some income threshold.
(1) how much income there is beyond the threshold: a = E[e]E[e−e]
(2) how responsive that income is to taxation: ε ={
dE[e]d(1−τ)
(1−τ)E[e]
}
Progressive Taxation
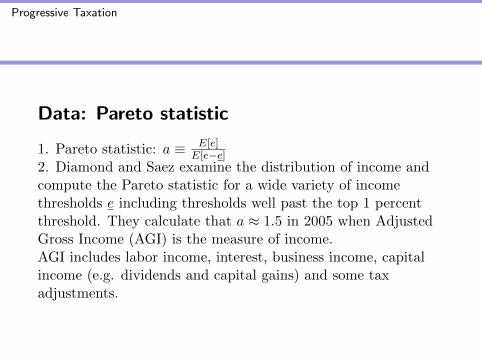
Data: Pareto statistic
1. Pareto statistic: a ≡ E[e]E[e−e]
2. Diamond and Saez examine the distribution of income andcompute the Pareto statistic for a wide variety of incomethresholds e including thresholds well past the top 1 percentthreshold. They calculate that a ≈ 1.5 in 2005 when AdjustedGross Income (AGI) is the measure of income.AGI includes labor income, interest, business income, capitalincome (e.g. dividends and capital gains) and some taxadjustments.

Progressive Taxation
Pareto Statistic: Adjusted Gross Income
The key remaining empirical ingredient to implement the formula for the optimal tax rate is the elasticity of top incomes with respect to the net-of-tax rate. With the Pareto parameter = 1.5 if = .25, a mid-range estimate from the empirical literature, then τ * = 1/(1 + 1.5 × .25) = 73 percent, substantially higher than the current 42.5 percent top U.S. marginal tax rate (combining all taxes).9
Figure 2Empirical Pareto Coeffi cients in the United States, 2005
Em
piri
cal P
aret
o co
effi
cien
t
1,000,000
1
1.5
2
2.5
800,000600,000400,000200,0000
z* = Adjusted gross income (current 2005 $)
a = zm/(zm – z*) with zm = E(z | z > z*)α = z*h/(z*)/(1 – H(z*))

Progressive Taxation
Pareto Statistic: Earnings, Income and Wage and Salary
0.00
0.50
1.00
1.50
2.00
2.50
3.00
3.50
1900 1920 1940 1960 1980 2000 2020
Pareto Statistic
Year
Pareto Statistic: US 1917‐2012
Male Earnings 99th Income 99th Wage and Salary 99th

Progressive Taxation
Evidence: Earnings or Income Elasticity
1. A Key Elasticity: ε ≡{
dE[e]d(1−τ)
(1−τ)E[e]
}2. Tax reforms alter marginal tax rates on some households to adifferent degree than others. Under Reagan in the 1980’s,marginal tax rates on high income households were lowered.One can use data on the percentage change in income orearnings (over a few years) to detemine how responsive orunresponsive income is to a percentage change in marginal taxrates.3. DS (2011) suggest ε = 0.25 is a “midrange estimate” and thatε = 0.57 is a “conservative upper bound” based on US data.

Progressive Taxation
Empirical Methods: Elasticity
1. Estimate the “elasticity” ε using reduced-form methods:
log(top 1% sharet) = α+ ε log(1−MTRt) + γt+ νt
logzit+1
zit= ε log(
1− τt+1(zit+1)
1− τt(zit)) + βf(zit) + αt + νit+1
2. Share regression US 1960-2000: ε = 0.85 (0.21) linear trendSaez (2004).
3. Share regression US 1960-2000: ε = 0.62 (0.12) quadratictrend Saez (2004).
4. Panel regression US 1991-97: ε ∈ [0.143− 0.564] with variousincome controls f(z): Saez, Slemrod and Giertz (2012).

Progressive Taxation
Top 1 Percent Average Marginal Tax RatesMertens (2015) calculates the average marginal tax rate onearnings (federal income tax and medicare tax) for those in the top1 percent. This rate fell after the Tax Reform Act of 1986.
0.00000
0.10000
0.20000
0.30000
0.40000
0.50000
0.60000
1940 1950 1960 1970 1980 1990 2000 2010 2020
Tax Ra
te
Year
US Ave. Marginal Tax Rate: Top 1%
Average Marginal Tax Rate: Source Mertens (2015)
Progressive Taxation
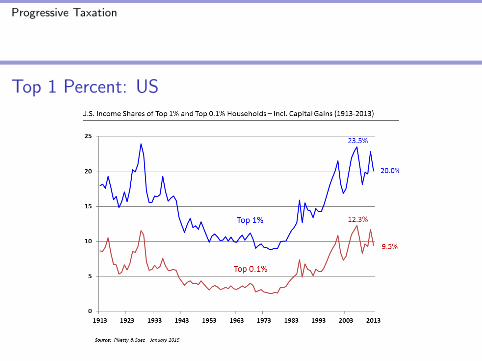
Top 1 Percent: US

Progressive Taxation
Top Tax Rates: US and Europe
Progressive Taxation
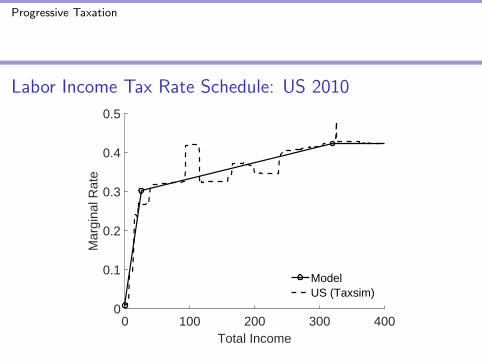
What Does the Labor Income Tax Rate Schedule in the USLook Like?
One answer: use a tax calculator called TAXSIM.
Plug income into TAXSIM in 1,000 dollar increments. TAXSIMcalculates a marginal tax rate for a two person household living ina specfic state in 2010. The marginal rate at a given income levelaccounts for federal and state income taxation and for socialsecurity and medicare taxation of earnings. Average the rateschedules (across states) to get the “US Rate Schedule” on thenext page.
Note: The schedule “jumps” at income levels where new taxbrackets begin or end. The schedule is somewhat flat beyound$250K.
Progressive Taxation
Labor Income Tax Rate Schedule: US 2010
0 100 200 300 400Total Income
0
0.1
0.2
0.3
0.4
0.5
Mar
gina
l Rat
e
ModelUS (Taxsim)

Progressive Taxation
Discussion:
1. Tax policy is not only concerned with maximizing revenue.Nevertheless, revenue maximization is useful.
Point 1: If raising tax rates beyond the top of the Laffer curveis not sensible, then knowing the top of the Laffer curve (i.e therevenue maximizing top rate) is useful.Point 2: A utilitarian social welfare function weights the utilityof different households with equal weights. If marginal utility ofconsumption declines, then the marginal utility of consumptionfor top earners is arguably small (not zero) in comparison tonon-top earners.

Progressive Taxation
Discussion:
2. Diamond and Saez argue that the marginal earnings tax rateon top earners in the US is about 42.5 percent in 2010 based onthe top federal tax rate for income taxes, 35 percent in 2010,and the fact that there are other taxes on top earners (e.g.state income taxes, medicare taxes and sales taxes).
3. As 73 > 42.5, there is substantial room for increasing themarginal tax rate on the top 1 percent of US households.
4. The top federal rate was 35 in 2010, was later increased to39.6 under Obama and is now 37 percent under Trump.


