4


2018-08-22SP-2
KMC
N
0'40'
160'80'
1840718PR
OJEC
TJO
B NU
MBER
BYDR
AWIN
GD
ATE
CLIEN
T4849 GR
EENVILLE AVE, STE 1375. D
ALLAS, TX 75206. 214-458-4808
THE PALISAD
ES5901 PEAC
HTR
EE DU
NW
OO
DY R
D.
BUILD
ING
A, SUITE 450
ATLANTA, G
A 30328

Demographic Source: Applied Geographic Solutions 04/2018, TIGER Geography page 1 of 1©2018, Sites USA, Chandler, Arizona, 480-491-1112
Th
is r
ep
ort
wa
s p
rod
uce
d u
sin
g d
ata
fro
m p
riva
te a
nd
go
vern
me
nt
sou
rce
s d
ee
me
d t
o b
e r
elia
ble
. T
he
info
rma
tio
n h
ere
in is
pro
vid
ed
with
ou
t re
pre
sen
tatio
n o
r w
arr
an
ty.
SUMMARY PROFILE2000-2010 Census, 2018 Estimates with 2023 Projections
Calculated using Weighted Block Centroid from Block Groups
Lat/Lon: 34.0921/-84.1673RS1
280 Bagley Dr1 mi radius 3 mi radius 5 mi radius
Suwanee, GA 30024
PO
PU
LA
TIO
N
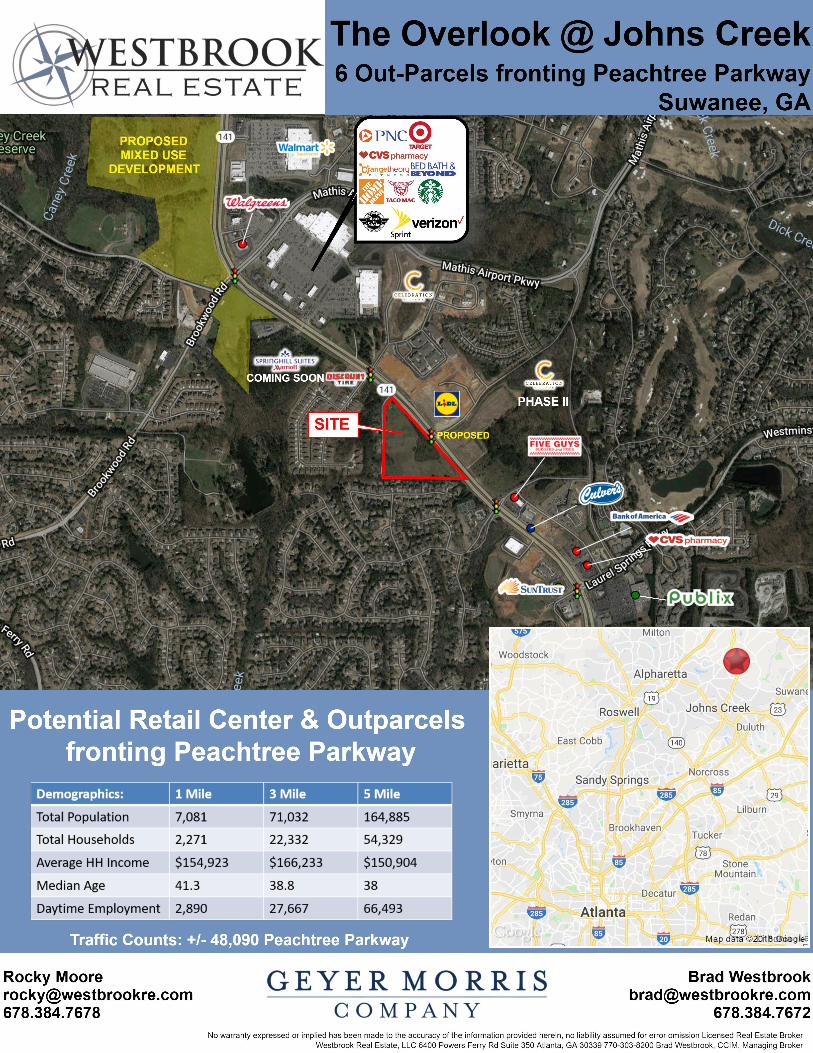
2018 Estimated Population 7,081 71,032 164,885
2023 Projected Population 8,482 81,974 186,736
2010 Census Population 5,344 54,690 128,925
2000 Census Population 3,479 35,169 80,545
Projected Annual Growth 2018 to 2023 4.0% 3.1% 2.7%
Historical Annual Growth 2000 to 2018 5.8% 5.7% 5.8%
2018 Median Age 41.3 38.8 38
HO
US
EH
OL
DS
2018 Estimated Households 2,271 22,332 54,329
2023 Projected Households 2,635 25,138 60,158
2010 Census Households 1,698 17,117 42,273
2000 Census Households 1,166 11,494 27,074
Projected Annual Growth 2018 to 2023 3.2% 2.5% 2.1%
Historical Annual Growth 2000 to 2018 5.3% 5.2% 5.6%
RA
CE
AN
DE
TH
NIC
ITY
2018 Estimated White 74.3% 66.8% 63.8%
2018 Estimated Black or African American 2.4% 5.6% 7.4%
2018 Estimated Asian or Pacific Islander 20.7% 24.9% 25.2%
2018 Estimated American Indian or Native Alaskan 0.2% 0.1% 0.2%
2018 Estimated Other Races 2.4% 2.6% 3.5%
2018 Estimated Hispanic 4.8% 4.5% 5.8%
INC
OM
E 2018 Estimated Average Household Income $154,923 $166,233 $150,904
2018 Estimated Median Household Income $140,787 $146,592 $132,343
2018 Estimated Per Capita Income $49,685 $52,264 $49,727
ED
UC
AT
ION
(AG
E 2
5+
)
2018 Estimated Elementary (Grade Level 0 to 8) 1.0% 1.3% 2.0%
2018 Estimated Some High School (Grade Level 9 to 11) 1.1% 2.3% 2.5%
2018 Estimated High School Graduate 9.9% 10.0% 11.1%
2018 Estimated Some College 15.0% 13.1% 13.5%
2018 Estimated Associates Degree Only 6.2% 6.4% 6.5%
2018 Estimated Bachelors Degree Only 41.4% 40.2% 39.0%
2018 Estimated Graduate Degree 25.4% 26.7% 25.3%
BU
SIN
ES
S 2018 Estimated Total Businesses 296 2,569 5,898
2018 Estimated Total Employees 2,890 27,667 66,493
2018 Estimated Employee Population per Business 9.7 10.8 11.3
2018 Estimated Residential Population per Business 23.9 27.7 28.0


