10

Demographic Source: Applied Geographic Solutions 04/2016, TIGER Geography page 1 of 5©2016, Sites USA, Chandler, Arizona, 480-491-1112
Th
is r
ep
ort
wa
s p
rod
uce
d u
sin
g d
ata
fro
m p
riva
te a
nd
go
vern
me
nt
sou
rce
s d
ee
me
d t
o b
e r
elia
ble
. T
he
info
rma
tio
n h
ere
in is
pro
vid
ed
with
ou
t re
pre
sen
tatio
n o
r w
arr
an
ty.
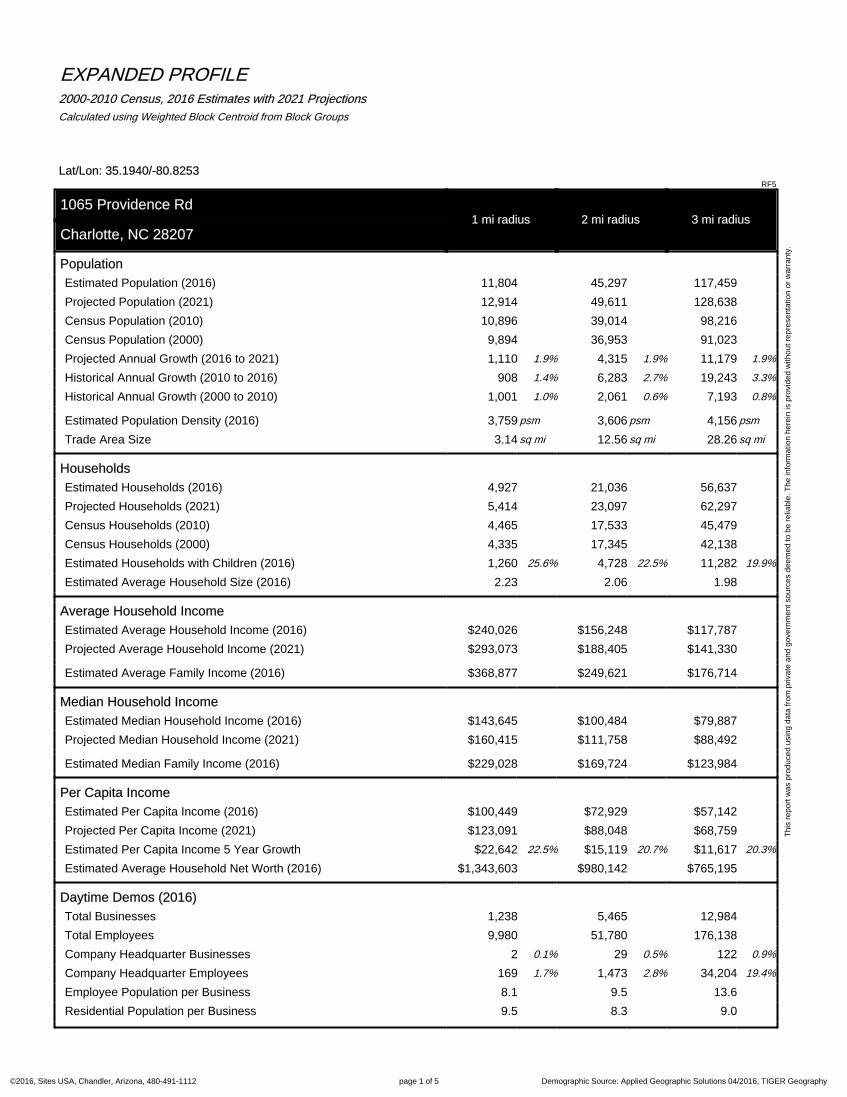
EXPANDED PROFILE2000-2010 Census, 2016 Estimates with 2021 Projections
Calculated using Weighted Block Centroid from Block Groups
Lat/Lon: 35.1940/-80.8253RF5
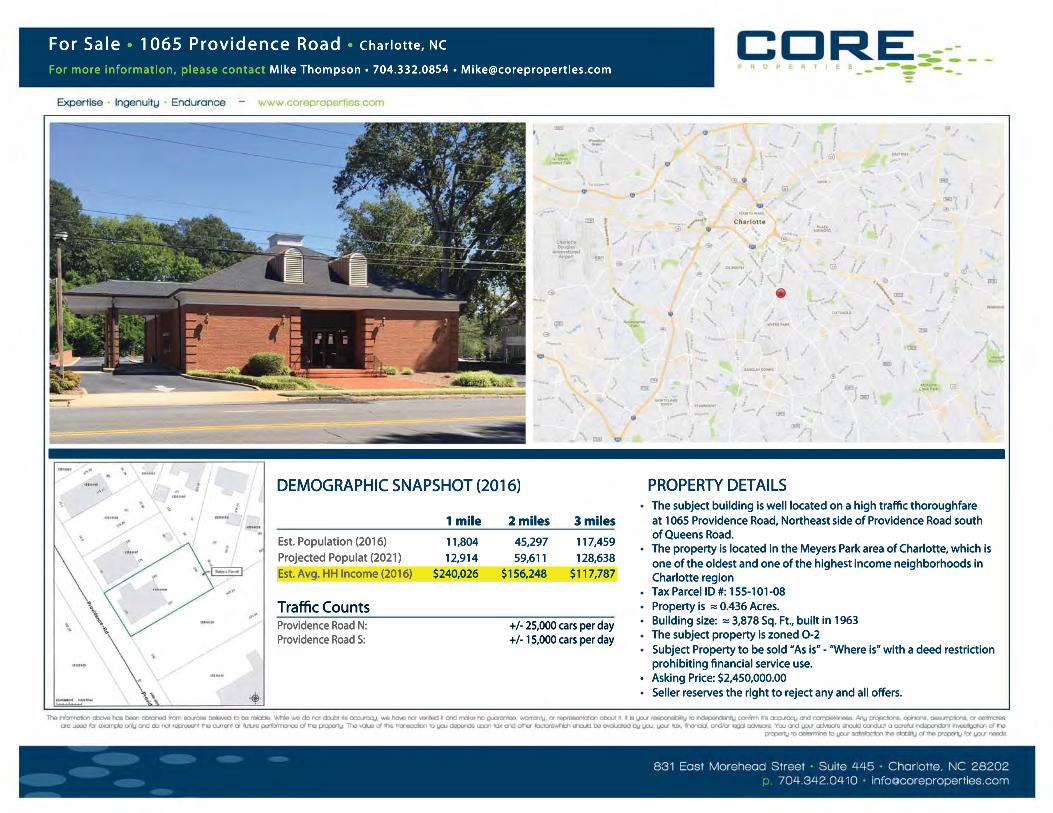
1065 Providence Rd1 mi radius 2 mi radius 3 mi radius
Charlotte, NC 28207
Population
Estimated Population (2016) 11,804 45,297 117,459
Projected Population (2021) 12,914 49,611 128,638
Census Population (2010) 10,896 39,014 98,216
Census Population (2000) 9,894 36,953 91,023
Projected Annual Growth (2016 to 2021) 1,110 1.9% 4,315 1.9% 11,179 1.9%
Historical Annual Growth (2010 to 2016) 908 1.4% 6,283 2.7% 19,243 3.3%
Historical Annual Growth (2000 to 2010) 1,001 1.0% 2,061 0.6% 7,193 0.8%
Estimated Population Density (2016) 3,759 psm 3,606 psm 4,156 psm
Trade Area Size 3.14 sq mi 12.56 sq mi 28.26 sq mi
Households
Estimated Households (2016) 4,927 21,036 56,637
Projected Households (2021) 5,414 23,097 62,297
Census Households (2010) 4,465 17,533 45,479
Census Households (2000) 4,335 17,345 42,138
Estimated Households with Children (2016) 1,260 25.6% 4,728 22.5% 11,282 19.9%
Estimated Average Household Size (2016) 2.23 2.06 1.98
Average Household Income
Estimated Average Household Income (2016) $240,026 $156,248 $117,787
Projected Average Household Income (2021) $293,073 $188,405 $141,330
Estimated Average Family Income (2016) $368,877 $249,621 $176,714
Median Household Income
Estimated Median Household Income (2016) $143,645 $100,484 $79,887
Projected Median Household Income (2021) $160,415 $111,758 $88,492
Estimated Median Family Income (2016) $229,028 $169,724 $123,984
Per Capita Income
Estimated Per Capita Income (2016) $100,449 $72,929 $57,142
Projected Per Capita Income (2021) $123,091 $88,048 $68,759
Estimated Per Capita Income 5 Year Growth $22,642 22.5% $15,119 20.7% $11,617 20.3%
Estimated Average Household Net Worth (2016) $1,343,603 $980,142 $765,195
Daytime Demos (2016)
Total Businesses 1,238 5,465 12,984
Total Employees 9,980 51,780 176,138
Company Headquarter Businesses 2 0.1% 29 0.5% 122 0.9%
Company Headquarter Employees 169 1.7% 1,473 2.8% 34,204 19.4%
Employee Population per Business 8.1 9.5 13.6
Residential Population per Business 9.5 8.3 9.0
Demographic Source: Applied Geographic Solutions 04/2016, TIGER Geography page 2 of 5©2016, Sites USA, Chandler, Arizona, 480-491-1112
Th
is r
ep
ort
wa
s p
rod
uce
d u
sin
g d
ata
fro
m p
riva
te a
nd
go
vern
me
nt
sou
rce
s d
ee
me
d t
o b
e r
elia
ble
. T
he
info
rma
tio
n h
ere
in is
pro
vid
ed
with
ou
t re
pre
sen
tatio
n o
r w
arr
an
ty.
EXPANDED PROFILE2000-2010 Census, 2016 Estimates with 2021 Projections
Calculated using Weighted Block Centroid from Block Groups
Lat/Lon: 35.1940/-80.8253RF5
1065 Providence Rd1 mi radius 2 mi radius 3 mi radius
Charlotte, NC 28207
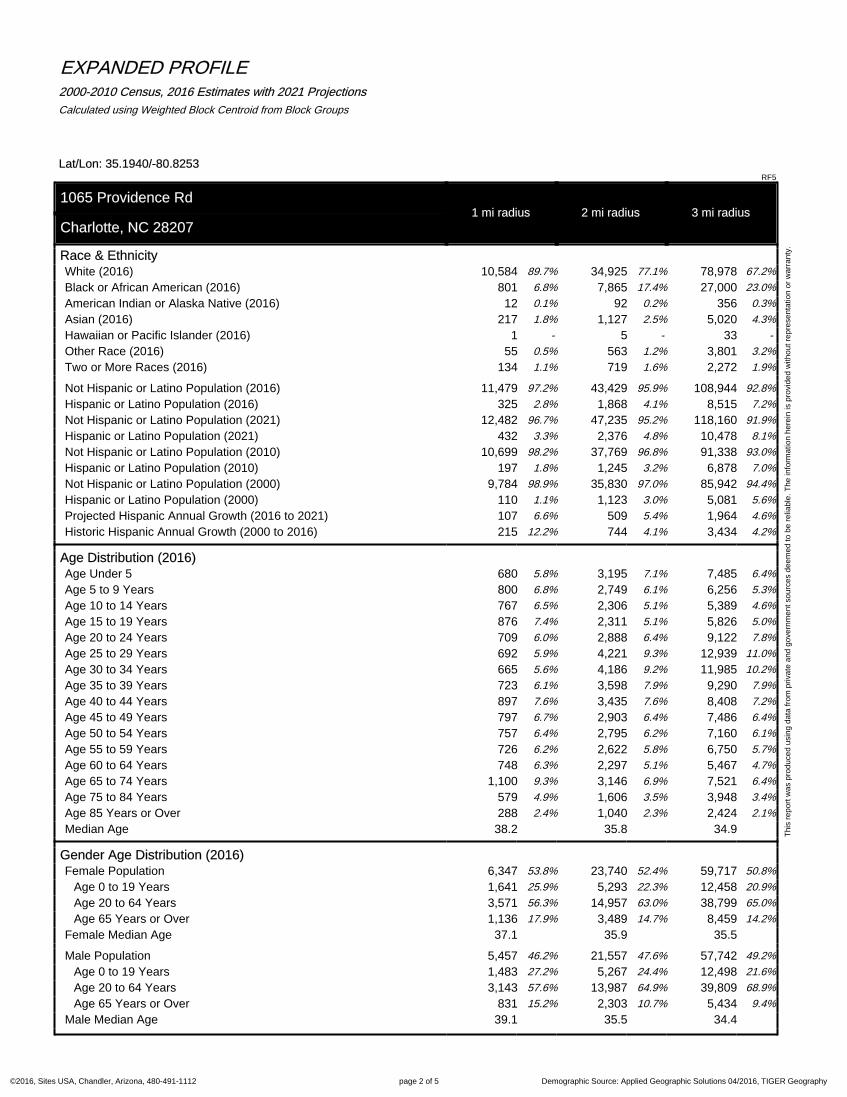
Race & EthnicityWhite (2016) 10,584 89.7% 34,925 77.1% 78,978 67.2%
Black or African American (2016) 801 6.8% 7,865 17.4% 27,000 23.0%
American Indian or Alaska Native (2016) 12 0.1% 92 0.2% 356 0.3%
Asian (2016) 217 1.8% 1,127 2.5% 5,020 4.3%
Hawaiian or Pacific Islander (2016) 1 - 5 - 33 -
Other Race (2016) 55 0.5% 563 1.2% 3,801 3.2%
Two or More Races (2016) 134 1.1% 719 1.6% 2,272 1.9%
Not Hispanic or Latino Population (2016) 11,479 97.2% 43,429 95.9% 108,944 92.8%
Hispanic or Latino Population (2016) 325 2.8% 1,868 4.1% 8,515 7.2%
Not Hispanic or Latino Population (2021) 12,482 96.7% 47,235 95.2% 118,160 91.9%
Hispanic or Latino Population (2021) 432 3.3% 2,376 4.8% 10,478 8.1%
Not Hispanic or Latino Population (2010) 10,699 98.2% 37,769 96.8% 91,338 93.0%
Hispanic or Latino Population (2010) 197 1.8% 1,245 3.2% 6,878 7.0%
Not Hispanic or Latino Population (2000) 9,784 98.9% 35,830 97.0% 85,942 94.4%
Hispanic or Latino Population (2000) 110 1.1% 1,123 3.0% 5,081 5.6%
Projected Hispanic Annual Growth (2016 to 2021) 107 6.6% 509 5.4% 1,964 4.6%
Historic Hispanic Annual Growth (2000 to 2016) 215 12.2% 744 4.1% 3,434 4.2%
Age Distribution (2016)Age Under 5 680 5.8% 3,195 7.1% 7,485 6.4%
Age 5 to 9 Years 800 6.8% 2,749 6.1% 6,256 5.3%
Age 10 to 14 Years 767 6.5% 2,306 5.1% 5,389 4.6%
Age 15 to 19 Years 876 7.4% 2,311 5.1% 5,826 5.0%
Age 20 to 24 Years 709 6.0% 2,888 6.4% 9,122 7.8%
Age 25 to 29 Years 692 5.9% 4,221 9.3% 12,939 11.0%
Age 30 to 34 Years 665 5.6% 4,186 9.2% 11,985 10.2%
Age 35 to 39 Years 723 6.1% 3,598 7.9% 9,290 7.9%
Age 40 to 44 Years 897 7.6% 3,435 7.6% 8,408 7.2%
Age 45 to 49 Years 797 6.7% 2,903 6.4% 7,486 6.4%
Age 50 to 54 Years 757 6.4% 2,795 6.2% 7,160 6.1%
Age 55 to 59 Years 726 6.2% 2,622 5.8% 6,750 5.7%
Age 60 to 64 Years 748 6.3% 2,297 5.1% 5,467 4.7%
Age 65 to 74 Years 1,100 9.3% 3,146 6.9% 7,521 6.4%
Age 75 to 84 Years 579 4.9% 1,606 3.5% 3,948 3.4%
Age 85 Years or Over 288 2.4% 1,040 2.3% 2,424 2.1%
Median Age 38.2 35.8 34.9
Gender Age Distribution (2016)Female Population 6,347 53.8% 23,740 52.4% 59,717 50.8%
Age 0 to 19 Years 1,641 25.9% 5,293 22.3% 12,458 20.9%
Age 20 to 64 Years 3,571 56.3% 14,957 63.0% 38,799 65.0%
Age 65 Years or Over 1,136 17.9% 3,489 14.7% 8,459 14.2%
Female Median Age 37.1 35.9 35.5
Male Population 5,457 46.2% 21,557 47.6% 57,742 49.2%
Age 0 to 19 Years 1,483 27.2% 5,267 24.4% 12,498 21.6%
Age 20 to 64 Years 3,143 57.6% 13,987 64.9% 39,809 68.9%
Age 65 Years or Over 831 15.2% 2,303 10.7% 5,434 9.4%
Male Median Age 39.1 35.5 34.4
Demographic Source: Applied Geographic Solutions 04/2016, TIGER Geography page 3 of 5©2016, Sites USA, Chandler, Arizona, 480-491-1112
Th
is r
ep
ort
wa
s p
rod
uce
d u
sin
g d
ata
fro
m p
riva
te a
nd
go
vern
me
nt
sou
rce
s d
ee
me
d t
o b
e r
elia
ble
. T
he
info
rma
tio
n h
ere
in is
pro
vid
ed
with
ou
t re
pre
sen
tatio
n o
r w
arr
an
ty.
EXPANDED PROFILE2000-2010 Census, 2016 Estimates with 2021 Projections
Calculated using Weighted Block Centroid from Block Groups
Lat/Lon: 35.1940/-80.8253RF5
1065 Providence Rd1 mi radius 2 mi radius 3 mi radius
Charlotte, NC 28207
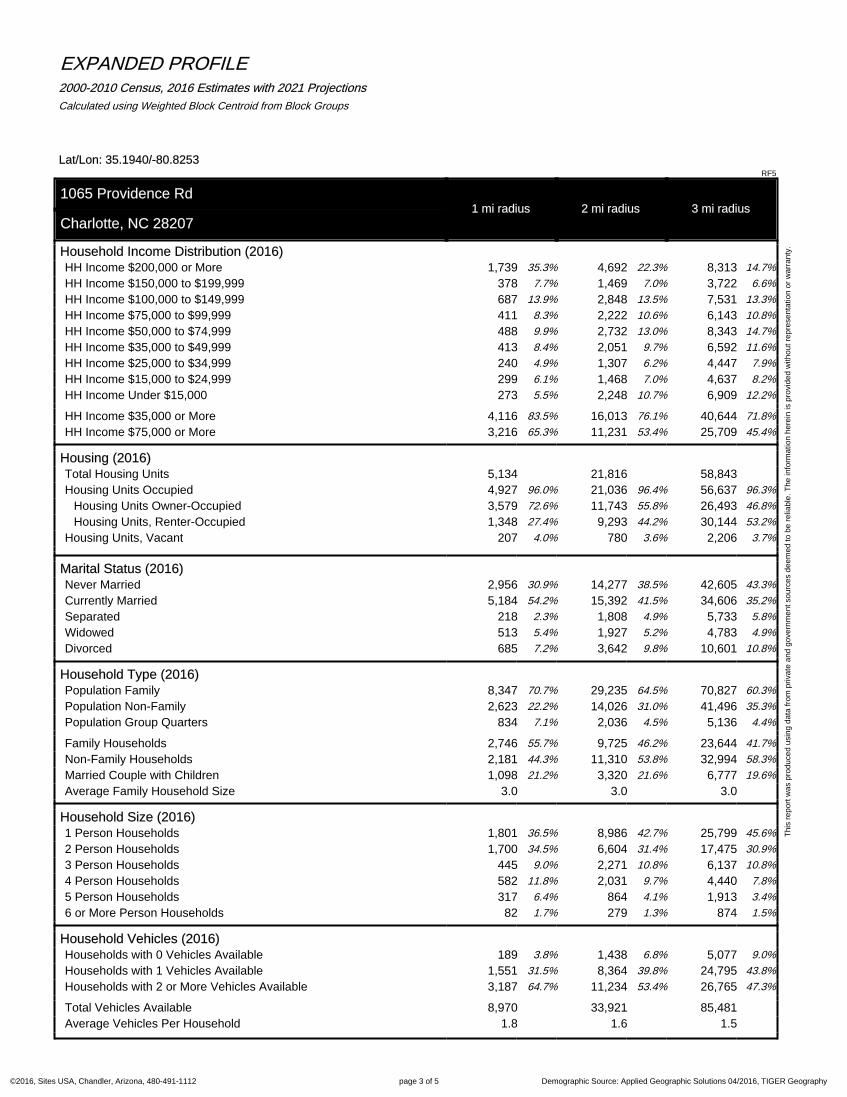
Household Income Distribution (2016)HH Income $200,000 or More 1,739 35.3% 4,692 22.3% 8,313 14.7%
HH Income $150,000 to $199,999 378 7.7% 1,469 7.0% 3,722 6.6%
HH Income $100,000 to $149,999 687 13.9% 2,848 13.5% 7,531 13.3%
HH Income $75,000 to $99,999 411 8.3% 2,222 10.6% 6,143 10.8%
HH Income $50,000 to $74,999 488 9.9% 2,732 13.0% 8,343 14.7%
HH Income $35,000 to $49,999 413 8.4% 2,051 9.7% 6,592 11.6%
HH Income $25,000 to $34,999 240 4.9% 1,307 6.2% 4,447 7.9%
HH Income $15,000 to $24,999 299 6.1% 1,468 7.0% 4,637 8.2%
HH Income Under $15,000 273 5.5% 2,248 10.7% 6,909 12.2%
HH Income $35,000 or More 4,116 83.5% 16,013 76.1% 40,644 71.8%
HH Income $75,000 or More 3,216 65.3% 11,231 53.4% 25,709 45.4%
Housing (2016)Total Housing Units 5,134 21,816 58,843
Housing Units Occupied 4,927 96.0% 21,036 96.4% 56,637 96.3%
Housing Units Owner-Occupied 3,579 72.6% 11,743 55.8% 26,493 46.8%
Housing Units, Renter-Occupied 1,348 27.4% 9,293 44.2% 30,144 53.2%
Housing Units, Vacant 207 4.0% 780 3.6% 2,206 3.7%
Marital Status (2016)Never Married 2,956 30.9% 14,277 38.5% 42,605 43.3%
Currently Married 5,184 54.2% 15,392 41.5% 34,606 35.2%
Separated 218 2.3% 1,808 4.9% 5,733 5.8%
Widowed 513 5.4% 1,927 5.2% 4,783 4.9%
Divorced 685 7.2% 3,642 9.8% 10,601 10.8%
Household Type (2016)Population Family 8,347 70.7% 29,235 64.5% 70,827 60.3%
Population Non-Family 2,623 22.2% 14,026 31.0% 41,496 35.3%
Population Group Quarters 834 7.1% 2,036 4.5% 5,136 4.4%
Family Households 2,746 55.7% 9,725 46.2% 23,644 41.7%
Non-Family Households 2,181 44.3% 11,310 53.8% 32,994 58.3%
Married Couple with Children 1,098 21.2% 3,320 21.6% 6,777 19.6%
Average Family Household Size 3.0 3.0 3.0
Household Size (2016)1 Person Households 1,801 36.5% 8,986 42.7% 25,799 45.6%
2 Person Households 1,700 34.5% 6,604 31.4% 17,475 30.9%
3 Person Households 445 9.0% 2,271 10.8% 6,137 10.8%
4 Person Households 582 11.8% 2,031 9.7% 4,440 7.8%
5 Person Households 317 6.4% 864 4.1% 1,913 3.4%
6 or More Person Households 82 1.7% 279 1.3% 874 1.5%
Household Vehicles (2016)Households with 0 Vehicles Available 189 3.8% 1,438 6.8% 5,077 9.0%
Households with 1 Vehicles Available 1,551 31.5% 8,364 39.8% 24,795 43.8%
Households with 2 or More Vehicles Available 3,187 64.7% 11,234 53.4% 26,765 47.3%
Total Vehicles Available 8,970 33,921 85,481
Average Vehicles Per Household 1.8 1.6 1.5

Demographic Source: Applied Geographic Solutions 04/2016, TIGER Geography page 4 of 5©2016, Sites USA, Chandler, Arizona, 480-491-1112
Th
is r
ep
ort
wa
s p
rod
uce
d u
sin
g d
ata
fro
m p
riva
te a
nd
go
vern
me
nt
sou
rce
s d
ee
me
d t
o b
e r
elia
ble
. T
he
info
rma
tio
n h
ere
in is
pro
vid
ed
with
ou
t re
pre
sen
tatio
n o
r w
arr
an
ty.
EXPANDED PROFILE2000-2010 Census, 2016 Estimates with 2021 Projections
Calculated using Weighted Block Centroid from Block Groups
Lat/Lon: 35.1940/-80.8253RF5
1065 Providence Rd1 mi radius 2 mi radius 3 mi radius
Charlotte, NC 28207
Labor Force (2016)Estimated Labor Population Age 16 Years or Over 9,441 36,680 97,451Estimated Civilian Employed 5,652 59.9% 25,095 68.4% 68,760 70.6%
Estimated Civilian Unemployed 149 1.6% 812 2.2% 2,671 2.7%
Estimated in Armed Forces 17 0.2% 35 0.1% 91 0.1%
Estimated Not in Labor Force 3,623 38.4% 10,739 29.3% 25,928 26.6%
Unemployment Rate 1.6% 2.2% 2.7%
Occupation (2010)Occupation: Population Age 16 Years or Over 5,092 19,082 50,973Management, Business, Financial Operations 1,498 29.4% 5,156 27.0% 11,749 23.0%
Professional, Related 1,439 28.3% 5,198 27.2% 12,809 25.1%
Service 490 9.6% 2,234 11.7% 7,102 13.9%
Sales, Office 1,363 26.8% 4,718 24.7% 12,795 25.1%
Farming, Fishing, Forestry 6 0.1% 28 0.1% 125 0.2%
Construct, Extraction, Maintenance 124 2.4% 720 3.8% 2,773 5.4%
Production, Transport Material Moving 171 3.4% 1,027 5.4% 3,621 7.1%
White Collar Workers 4,300 84.5% 15,072 79.0% 37,353 73.3%
Blue Collar Workers 792 15.5% 4,009 21.0% 13,621 26.7%
Consumer Expenditure (2016)Total Household Expenditure $692 M $2.06 B $4.46 B
Total Non-Retail Expenditure $381 M 55.0% $1.13 B 54.8% $2.43 B 54.5%
Total Retail Expenditure $312 M 45.0% $931 M 45.2% $2.03 B 45.5%
Apparel $24.7 M 3.6% $72.9 M 3.5% $157 M 3.5%
Contributions $41.1 M 5.9% $113 M 5.5% $227 M 5.1%
Education $33.0 M 4.8% $92.7 M 4.5% $190 M 4.3%
Entertainment $39.7 M 5.7% $117 M 5.7% $252 M 5.6%
Food and Beverages $94.4 M 13.6% $287 M 13.9% $632 M 14.2%
Furnishings and Equipment $25.3 M 3.7% $73.9 M 3.6% $157 M 3.5%
Gifts $21.0 M 3.0% $59.4 M 2.9% $123 M 2.8%
Health Care $49.6 M 7.2% $152 M 7.4% $340 M 7.6%
Household Operations $23.4 M 3.4% $66.4 M 3.2% $138 M 3.1%
Miscellaneous Expenses $9.48 M 1.4% $28.9 M 1.4% $63.9 M 1.4%
Personal Care $8.78 M 1.3% $26.3 M 1.3% $57.4 M 1.3%
Personal Insurance $6.32 M 0.9% $17.7 M 0.9% $36.5 M 0.8%
Reading $1.56 M 0.2% $4.64 M 0.2% $10.0 M 0.2%
Shelter $145 M 20.9% $429 M 20.8% $925 M 20.8%
Tobacco $3.10 M 0.4% $10.2 M 0.5% $23.9 M 0.5%
Transportation $120 M 17.3% $365 M 17.7% $805 M 18.1%
Utilities $46.0 M 6.6% $143 M 6.9% $319 M 7.2%
Educational Attainment (2016)Adult Population Age 25 Years or Over 7,971 31,848 83,380Elementary (Grade Level 0 to 8) 93 1.2% 573 1.8% 2,208 2.6%
Some High School (Grade Level 9 to 11) 98 1.2% 980 3.1% 4,049 4.9%
High School Graduate 419 5.3% 2,768 8.7% 9,682 11.6%
Some College 842 10.6% 4,269 13.4% 12,758 15.3%
Associate Degree Only 277 3.5% 1,705 5.4% 5,452 6.5%
Bachelor Degree Only 3,706 46.5% 12,513 39.3% 30,187 36.2%
Graduate Degree 2,536 31.8% 9,040 28.4% 19,043 22.8%
Demographic Source: Applied Geographic Solutions 04/2016, TIGER Geography page 5 of 5©2016, Sites USA, Chandler, Arizona, 480-491-1112
Th
is r
ep
ort
wa
s p
rod
uce
d u
sin
g d
ata
fro
m p
riva
te a
nd
go
vern
me
nt
sou
rce
s d
ee
me
d t
o b
e r
elia
ble
. T
he
info
rma
tio
n h
ere
in is
pro
vid
ed
with
ou
t re
pre
sen
tatio
n o
r w
arr
an
ty.
EXPANDED PROFILE2000-2010 Census, 2016 Estimates with 2021 Projections
Calculated using Weighted Block Centroid from Block Groups
Lat/Lon: 35.1940/-80.8253RF5
1065 Providence Rd1 mi radius 2 mi radius 3 mi radius
Charlotte, NC 28207
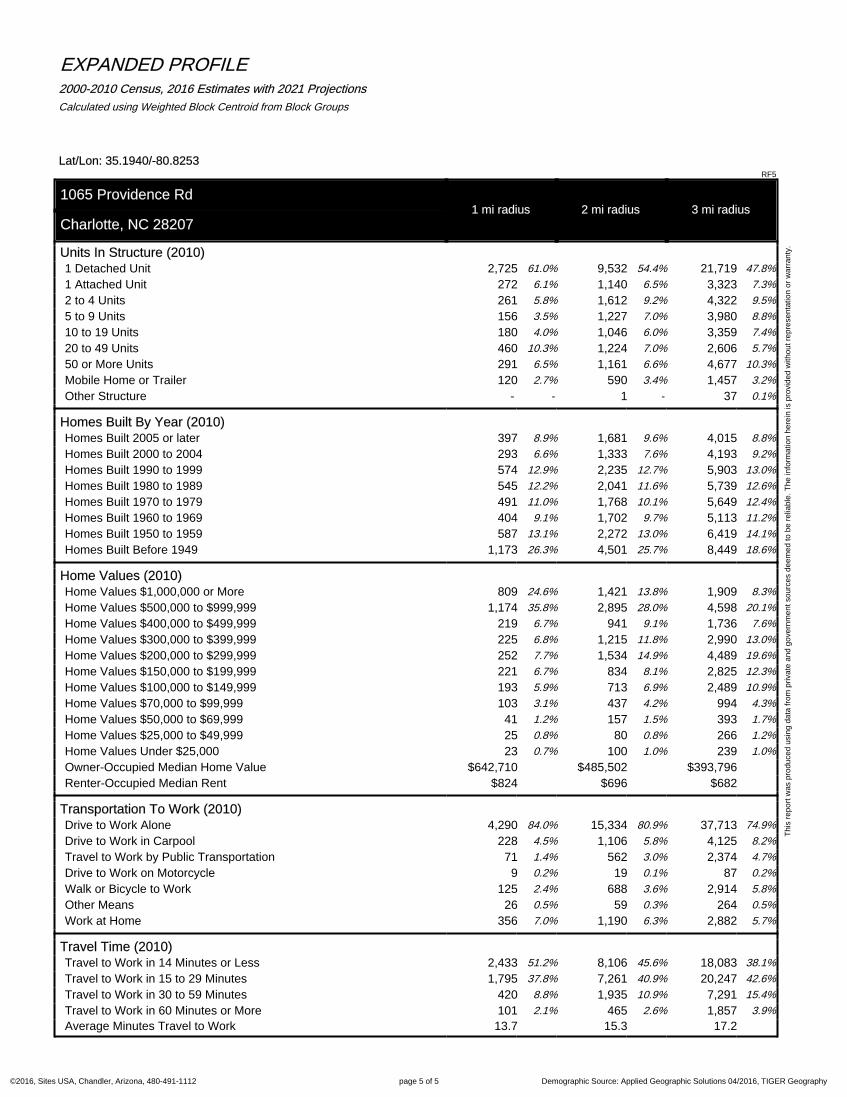
Units In Structure (2010)1 Detached Unit 2,725 61.0% 9,532 54.4% 21,719 47.8%
1 Attached Unit 272 6.1% 1,140 6.5% 3,323 7.3%
2 to 4 Units 261 5.8% 1,612 9.2% 4,322 9.5%
5 to 9 Units 156 3.5% 1,227 7.0% 3,980 8.8%
10 to 19 Units 180 4.0% 1,046 6.0% 3,359 7.4%
20 to 49 Units 460 10.3% 1,224 7.0% 2,606 5.7%
50 or More Units 291 6.5% 1,161 6.6% 4,677 10.3%
Mobile Home or Trailer 120 2.7% 590 3.4% 1,457 3.2%
Other Structure - - 1 - 37 0.1%
Homes Built By Year (2010)Homes Built 2005 or later 397 8.9% 1,681 9.6% 4,015 8.8%
Homes Built 2000 to 2004 293 6.6% 1,333 7.6% 4,193 9.2%
Homes Built 1990 to 1999 574 12.9% 2,235 12.7% 5,903 13.0%
Homes Built 1980 to 1989 545 12.2% 2,041 11.6% 5,739 12.6%
Homes Built 1970 to 1979 491 11.0% 1,768 10.1% 5,649 12.4%
Homes Built 1960 to 1969 404 9.1% 1,702 9.7% 5,113 11.2%
Homes Built 1950 to 1959 587 13.1% 2,272 13.0% 6,419 14.1%
Homes Built Before 1949 1,173 26.3% 4,501 25.7% 8,449 18.6%
Home Values (2010)Home Values $1,000,000 or More 809 24.6% 1,421 13.8% 1,909 8.3%
Home Values $500,000 to $999,999 1,174 35.8% 2,895 28.0% 4,598 20.1%
Home Values $400,000 to $499,999 219 6.7% 941 9.1% 1,736 7.6%
Home Values $300,000 to $399,999 225 6.8% 1,215 11.8% 2,990 13.0%
Home Values $200,000 to $299,999 252 7.7% 1,534 14.9% 4,489 19.6%
Home Values $150,000 to $199,999 221 6.7% 834 8.1% 2,825 12.3%
Home Values $100,000 to $149,999 193 5.9% 713 6.9% 2,489 10.9%
Home Values $70,000 to $99,999 103 3.1% 437 4.2% 994 4.3%
Home Values $50,000 to $69,999 41 1.2% 157 1.5% 393 1.7%
Home Values $25,000 to $49,999 25 0.8% 80 0.8% 266 1.2%
Home Values Under $25,000 23 0.7% 100 1.0% 239 1.0%
Owner-Occupied Median Home Value $642,710 $485,502 $393,796
Renter-Occupied Median Rent $824 $696 $682
Transportation To Work (2010)Drive to Work Alone 4,290 84.0% 15,334 80.9% 37,713 74.9%
Drive to Work in Carpool 228 4.5% 1,106 5.8% 4,125 8.2%
Travel to Work by Public Transportation 71 1.4% 562 3.0% 2,374 4.7%
Drive to Work on Motorcycle 9 0.2% 19 0.1% 87 0.2%
Walk or Bicycle to Work 125 2.4% 688 3.6% 2,914 5.8%
Other Means 26 0.5% 59 0.3% 264 0.5%
Work at Home 356 7.0% 1,190 6.3% 2,882 5.7%
Travel Time (2010)Travel to Work in 14 Minutes or Less 2,433 51.2% 8,106 45.6% 18,083 38.1%
Travel to Work in 15 to 29 Minutes 1,795 37.8% 7,261 40.9% 20,247 42.6%
Travel to Work in 30 to 59 Minutes 420 8.8% 1,935 10.9% 7,291 15.4%
Travel to Work in 60 Minutes or More 101 2.1% 465 2.6% 1,857 3.9%
Average Minutes Travel to Work 13.7 15.3 17.2


