Project LA 26 1 PROJECT LA 26: PROGRESS REPORT ABSTRACT The mean water level of the Rio de la Plata responds to mean sea level, wind field and discharge of its tributaries. Models HADCM3, ECHAM4/OPYC3, CSIRO-mk2 and GFDL-R30 represent adequately the mean annual SLP fields and most of their annual cycle. Therefore, SRS A2 scenarios of these models were used to develop SLP and wind scenarios until the year 2100. A regional trend in SLP and wind was detected in the observed fields (1950/2000) and in GCM SLP outputs 1960/2000). This trend can be summarized as a southward shift of the western border of the South Atlantic High that persists during the XXI century in the four models. Digitized information of geology and geomorphology of the coastal areas of the Argentine was completed, while topography is being improved using a GP system. Social vulnerability indicators were developed for the administrative units affected by future floods under an extreme climate change scenario. The future RP water level is being studied with two hydrodynamic. One of them is completely validated and ready for the development of future scenario. It continue the inter-consultation process with qualified stakeholders and a workshop was organized to present the Project and discuss with them the pertinence of the Project objectives to social and governmental demands. Report on the Tasks Scheduled for the July-December 2002 period Task numbers according to the working plan. 10. Photo interpretation of dry, normal and flood events The objective of this task was to contribute to the construction of topographic maps in the Samborobóm bay since available altitude information had a resolution of only 2.5-m. According to the IPCC (2001) predicted sea level rise, this value is not enough to precisely define areas that could be affected by future marine ingressions. This task was changed to an analysis of Landsat images to determine lines of equal height according to the boundary of water. As explained in the Second Report, this task will complement measures to be taken with a high resolution GPS. Results indicate that along the coast in most of the bay, the altitude of the land after the first one or two kilometers from the coast is about 50 to 100 cm over the actual river level. 11. Data bases construction in a GIS environment. Point 3 of the Joint Document with LA 32 This is a continuous activity in the Project including outputs of the tasks. This activity continued in two ARC VIEW systems. Social, economic, and geological information is being merged with basic cartography and satellite information 12. Topographic measurements and fieldwork will be carried out to produce detailed altitude level maps of coastal areas subject to possible floods During the previous six-month period, topographic maps of the coastal area and its zone of influence between the southern limit of the Rio de la Plata and the Paraná delta were digitized from 1:50.000 IGM maps. Interpolation was made when necessary using the geomorphology maps. In this period the same work was done with the San Antonio Cap area because is under the influence of the Río de la Plata being a transition zone with the marine environment.
Transcript
Project LA 26 1
PROJECT LA 26: PROGRESS REPORT
ABSTRACT The mean water level of the Rio de la Plata responds to mean sea level, wind field and discharge of its tributaries. Models HADCM3, ECHAM4/OPYC3, CSIRO-mk2 and GFDL-R30 represent adequately the mean annual SLP fields and most of their annual cycle. Therefore, SRS A2 scenarios of these models were used to develop SLP and wind scenarios until the year 2100. A regional trend in SLP and wind was detected in the observed fields (1950/2000) and in GCM SLP outputs 1960/2000). This trend can be summarized as a southward shift of the western border of the South Atlantic High that persists during the XXI century in the four models. Digitized information of geology and geomorphology of the coastal areas of the Argentine was completed, while topography is being improved using a GP system. Social vulnerability indicators were developed for the administrative units affected by future floods under an extreme climate change scenario. The future RP water level is being studied with two hydrodynamic. One of them is completely validated and ready for the development of future scenario. It continue the inter-consultation process with qualified stakeholders and a workshop was organized to present the Project and discuss with them the pertinence of the Project objectives to social and governmental demands.
Report on the Tasks Scheduled for the July-December 2002 period Task numbers according to the working plan. 10. Photo interpretation of dry, normal and flood events The objective of this task was to contribute to the construction of topographic maps in the Samborobóm bay since available altitude information had a resolution of only 2.5-m. According to the IPCC (2001) predicted sea level rise, this value is not enough to precisely define areas that could be affected by future marine ingressions. This task was changed to an analysis of Landsat images to determine lines of equal height according to the boundary of water. As explained in the Second Report, this task will complement measures to be taken with a high resolution GPS. Results indicate that along the coast in most of the bay, the altitude of the land after the first one or two kilometers from the coast is about 50 to 100 cm over the actual river level. 11. Data bases construction in a GIS environment. Point 3 of the Joint
Document with LA 32 This is a continuous activity in the Project including outputs of the tasks. This activity continued in two ARC VIEW systems. Social, economic, and geological information is being merged with basic cartography and satellite information 12. Topographic measurements and fieldwork will be carried out to produce
detailed altitude level maps of coastal areas subject to possible floods During the previous six-month period, topographic maps of the coastal area and its zone of influence between the southern limit of the Rio de la Plata and the Paraná delta were digitized from 1:50.000 IGM maps. Interpolation was made when necessary using the geomorphology maps. In this period the same work was done with the San Antonio Cap area because is under the influence of the Río de la Plata being a transition zone with the marine environment.
Project LA 26 2
These maps resolution are being upgraded with field measurements taken with a GPS system. The field activity in the northern part of the Great Buenos Aires City was completed. The GPS was acquired with collateral funds in last March. 13. Election of future climate scenarios in cooperation with Project LA32 Point 6 of the joined document As expressed in the first report, the mean water level of the Rio de la Plata (RP) estuary responds to the wind field and to the discharge of its tributaries. Therefore, the variables required from climate scenarios are surface mean winds over the RP and over the outer adjacent ocean and precipitation over the RP basin. Surface winds are not a standard output of the GCM scenarios. However, this variable is strongly coupled with sea surface pressure (SLP) fields. Consequently, wind scenarios are being developed through SLP scenarios. In the Second Report was described that four experiments (HADCM3, CSIRO-mk2, ECHAM4, GFDL-R30) simulate adequately the mean regional SLP field. Therefore, we elected these models for future scenarios. As a first step, we are using the SRS A2 scenarios up to the year 2100. Surface wind scenarios As explained in the Second Report, it is required daily data. While the daily data from GCM experiments are obtained, an alternative approach was undertaken that is based on downscaling from daily SLP using NCEP/NCAR data. Thus, a regression model for regional surface daily wind was constructed, and its results are being evaluated. Future wind scenarios will be constructed using a perturbation technique that accounts for the mean SLP GCM scenarios. Other direct approach is reported in the next-semester tasks. A regional trend in winds and SLP was detected both in data and in GCM outputs. A paper is being prepared in this subject. A resume is presented in Annex 1 Precipitation scenarios The ETA model is being run with high resolution over South America for the 1990-1999 period. The intention is assessing if the underestimation of precipitation is caused by the low resolution of the GCM models. This activity will take the whole year 2003. January results indicate a good mean precipitation over most of the Plata basin, except in the SACZ area. Other alternative for precipitation scenarios is being reported under next semester tasks. In the meantime, it was recommended to the AIACC Projects dealing with agriculture (La 27 and LA 29) to use the HADCM3 scenarios with some sort of correction accounting for systematic errors. 19. Writing of a paper manuscript on the study of weather storms over the region embracing the Rio de la Plata using NCAR/NCEP reanalysis for the period 1950-2000 A manuscript on this subject entitled: ¨ Surface level atmospheric conditions associated to extreme surge tides in the Rio de la Plata estuary ¨ was prepared by Gustavo Escobar, Walter M. Vargas and Susana A. Bischoff was submitted to the International Journal of Climatology. A copy was sent with the Second Report 21. Writing of a paper manuscript on extreme streamflow events in the Paraná and Uruguay rivers The paper ¨ The greatest discharge events in the Paraná River and their climate forcing¨ by Inés Camilloni and Vicente Barros was published by the Journal of Hydrology, 278 (2003) 94-106. It was submitted in the previous semester, and therefore its copy was sent with the Second Report The manuscript ¨ The largest floods in the Uruguay River and their climate forcing ¨ by Inés Camilloni and Ruben Caffera was submitted to the J. of Hydrometeorology in May 2003. Copy of the paper in Annex 2.
Project LA 26 3
22. Consultation about demands and communication of Project partial results with stakeholders through mail and email (March 2003) This task was almost completed in 2002 but continued with a consultation to a greater group of stakeholders. In March 5, 2003, a workshop was held to present the Project results to stakeholders and to receive from them suggestions and demands. There were about forty participants from 30 governmental and non-governmental organizations. In the same workshop, it was also presented results from the University of Buenos Aires Project on Floods on the Paraná and Uruguay Rivers that provide the collateral funds to this Project. The report of the workshop is in Spanish in the web page of the Project http://www-atmo.at.fcen.uba.ar/~lcr/proyectos/aiacc/. The English version of this document is being prepared and will be attached in the next report. 23. Geomorphology description and study of the evolution of the coastal area
and construction of geomorphology maps In the Second Report was reported the geological and geo-morphological maps of the coastal area of Samborombón Bay, which included the digitization of the different units and their lithological features represented in the same format as the topographic maps. In this semester, it was completed the respective two maps of the area Paraná Delta – Punta Piedras. Therefore, all the Argentine coast of the Rio de la Plata was completed. The geo-morphological maps in scale 1:40.000 were made base upon satellite images, airplane photography and field activities. This map interpretation allows identifying the areas affected by regular astronomical tides and storm tides and wetlands. The geological map was based upon previous bibliography and field tasks as well as with the use of airplane photography and Landsat 5TM (Thematic Mapper) images This map allows through its interpretation to extract the necessary data to estimate coastal erosion. 25. Develop of a Social Vulnerability Index to flooding in a GIS environment.
Point 3 of the Joint Document with LA 32 Number of people living in the area of possible affectation Last semester we arrive to a preliminary figure for the AMBA Sector (Census 1991). Now we complete the elaboration from the INDEC census with the number of inhabitants for the rest of the area, and a more detailed design for the 5 meters topographic line. The population that can be affected by a probable sea level rise for climatic change in the area of the Project is near 1.500.000 inhabitants. Social Vulnerability Index The social vulnerability index developed during 2002 was improved by the inclusion of indicators of production and consume. The indicators have been clustered into sub-indexes: demographic indicators, conditions of life indicators and work/ production/ consumption indicators The demographic sub index includes the following indicators: total population, population's density, index of potential dependence: the young, and index of potential dependence: the elderly. The administrative units that have a higher demographic vulnerability sub index are Buenos Aires City, General Sarmiento and Vicente López. The conditions of life sub index includes the following indicators: population’s percentage in homes with unsatisfied basic needs (NBI), percentage of homes with boss woman, total rate of infantile mortality, and population’s percentage without access to health services. The administrative units that have the higher conditions of life vulnerability sub index are San Fernando, Tigre, General Sarmiento and Castelli. The work, production, consumption sub index includes the following indicators: unemployment rate, Aggregated gross product, registered cars rate (inhabitants / car rate), and percentage of workers without provisional taxes. The administrative units that have the higher
Project LA 26 4
conditions of vulnerability according to this sub index are Partido de la Costa, General Sarmiento and Esteban Echeverría. The last steep in this task is to develop a comprehensive social vulnerability index and to apply it to the administrative units. 27. Selection of sea level scenarios according to TAR IPCC This task was started in this semester. It will be considered not only the mean sea global rise scenarios, but also the predicted regional increase in the South Atlantic. The main effort was in developing the mean sea level with respect to the reference geode in the domain of the hydrological models being used in the Project and for different seasons. These levels are being calculated from the TOPEX set of data for the 1990` decade. It was found substantial differences in height both in space and along the year. Once this task will be completed, it results will be used as baseline to add the regional increments as predicted by coupled GCMs. The outcome of this step will be the input for the hydrological model. 28. Validation of the ETA model and the hydrodynamic models The use of the ETA model to develop surface winds was abandoned, at least momentarily, since calibration from NCEP/NCAR surface winds were satisfactory. The calibration process of model RPP-2D, through successive stages (purely astronomical tide, normal tide condition, and storm tide condition), was explained in the previous Report. Preliminary, and encouraging, results were shown. The calibration is now completed. The following improvements were made:
i. Bathymetric information was rebuilt based on more accurate data sources.
ii. The astronomical tide boundary condition at the southern border was redefined by using results from a global tidal model.
iii. The adjustment of wind fields from NCEP/NCAR was refined through detailed experimentation.
Model RPP-2D was first exploited to analyze sensitivity of system response to probable changes in the forcings: sea level rise, change in predominant seasonal wind pattern and tributary discharge increase. More information on this task is in Annex 3.
31. Development of strong waves scenarios This task was completed in the past semester. In Annex 4 is attached a copy of the manuscript ¨ Impact of a possible regional wind change on the wave climate of the Rio de la Plata ¨ by Walter Dragani and Silvia Romero that is being prepared for submission to the Int. J. of Climatology. 35. Engineering implications and prospective of the evolution of coastal area. This includes both the new coastal geography arising from sea level rise and the advancement of the Paraná Delta front This task was initiated collecting data from different institutions, both public and private that have large infrastructure on the coast. In addition, soil uses, goods and infrastructure localized in the study area are been survey, in order to asses the impact of present floods and the future impact caused by climatic change.
Travel activities V. Barros made a short trip (one-day) to present the Project activities in a workshop held in Mar del Plata to discuss the future Argentine satellites. The Co-PI M. Caffera made one short trip to Buenos Aires to work with I. Camilloni and V. Barros on the extreme discharges of the Uruguay River.
Project LA 26 5
Dr Kokot and Dr. Codignotto made a short trip to the Samborombón bay area to make field- work. Dr Barros and Dr Kokot made a short trip to Santa Fe to discuss a cooperative agreement with the Faculty of Water Resources of the University of Litoral. This agreement will favor the Project with the help of experienced professionals on the use of GPS Madeleine Renom from Uruguay made two trips to Buenos Aires to work on climate scenarios with I. Camilloni and to attend a course on the South American Climate at the University of Buenos Aires. She was also funded by the LA 32 Project.
Description of Difficulties Encountered and Lessons Learned Task 12 Because of the lack of available high-resolution altitude maps, the topography was digitized with a resolution of 1.25 m. This is not enough for the Project requirements and therefore, field measurements are being taken with a GPS. Task 13 Other problem is the availability of daily data from GCM experiment scenarios. We are trying of get this data by ourselves, but help from AIACC would help.
Description of Tasks to be performed in the Next Eight-Month Period Tasks numbers as in the working plan. It is indicated when the task was already initiated as reported in part B.
11. Data base construction in a GIS environment. Point 3 of the Joint Document
LA 32 (Initiated). This will be a continuous activity during the Project duration, including outputs of the different tasks. 12. Topographic measurements and fieldwork will be carried out to produce
detailed altitude level maps of coastal areas subject to possible floods (Initiated).
Fieldwork with a GPS will be conducted to improve the actual topography resolution 13. Election of future climate scenarios in cooperation with Project L32
(Initiated) Wind: If available daily GCM outputs, it will be used to generate daily winds from daily SLP, to be used as input in the hydrodynamic model Precipitation: Sensitivity analysis indicates that only the greatest and exceptional discharges have some influence on the Rio de la Plata level. On top of that, Task 20 showed that these exceptional discharges are closely related to El Niño events. Therefore, a shortcut could be taken, to estimate the frequency of the exceptional discharges if the GCMs properly represent the ENSO phases. 16. Development of future scenarios for the Paraná delta growth (Initiated). The past evolution of the Delta during the last 300 years is being completed. Future evolution of the Delta will depend on many variables; one of the most important is the future level of waters
Project LA 26 6
in the inner estuary of the Rio de la Plata. Therefore, scenarios will be constructed after tasks 32 and 33 will be well completed. 25. Develop a Social Vulnerability Index to flooding in a GIS environment. Point 3 of the Joint Document (Initiated) The remained activity is to construct a comprehensive social vulnerability index and to apply it to the administrative units. 27. Selection of sea level scenarios according to TAR IPCC (Initiated) 32. Development of mean and extreme scenarios of water level with
hydrodynamic models 33. Development of extreme scenarios of water level with hydrodynamic models
under different storm weather scenarios 34. Writing a manuscript on the future mean and extreme scenarios of water
level 35. Engineering implications and prospective of the evolution of coastal area. This includes both the new coastal geography arising from sea level rise and the advancement of the Paraná Delta front (Initiated) 36. Identification of critical zones of social vulnerability to flooding 41. Joint workshop with Project LA 32 as explained in Point 11 of the joint document 43. Integrated analysis of the lower basin and mouth of the Santa Lucía using the Samborombóm experience as explained in point 8 of the joint document 45. Indicator analysis and social vulnerability diagnosis
Anticipated Difficulties in the Next Eight-Month Period Task 13 The use of daily data from GCM scenarios can be delayed because of the difficulty to get these data and because of the large consume of computer time involved
Connections with the National Communication The plans for the Second Communication are being made in the Foreign Affairs Ministry by Dr. Estrada Oyuela. Recently, it was also incorporated the Secretary of Environment. Vicente Barros and Walter Vargas participate of informative meetings at the Foreign Ministry were the first steps of the planning activity are reported to key experts. There is no yet a formal commitments, but we learnt in the informative meetings that it will be a selection of groups of national experts for each vulnerability activity based on their qualifications.
1
Annex 1 CLIMATE SCENARIOS Sea level pressure (SLP) fields trends were analyzed considering SRES-A2 GCM outputs and NCEP/NCAR reanalyzes. This analysis was performed considering only the four GCMs that best agree with the NCEP/NCAR reanalyzes for the region delimited by 20°S-47.5°S and 67.5°W-45°W. These models and the available periods are presented in Table 1.
Model Period HADCM3 (1) 1951-2099 CSIRO-Mk2 (2) 1951-2099 ECHAM4/OPYC3 (3) 1991-2099 GFDL-R30 (4) 1961-2099
Table 1. GCMs with best agreement with NCEP reanalysis in Southeastern South America. Available periods are included. Rotated principal component analysis (PCA) was applied to the mean seasonal SLP fields of the reanalyzes and GCMs outputs of models (1), (2) and (4) for 1961-2000. Model (3) was excluded from this analysis because data start in 1990. The two first PCs of the reanalyzes data (Figure 1) explain more than 90% of the total variance and represent correctly the seasonal variability. These components also show a shift to the south of the axis of maximum South Atlantic SLP. The principal modes of variability and the southward displacement of the South Atlantic high observed
Figure 1. Principal components of seasonal SLP NCEP reanalysis
in the reanalysis data are also observed in the PCs of the GCMs outputs. This is confirmed in Table 2 where the spatial correlation between the first two PCs derived from the reanalysis SLP data and the GCMs outputs are presented.
Table 2. Spatial correlation coefficients between the first two PCs obtained for the NCEP-NCAR SLP data and GCMs outputs. The PCA was also performed for the seasonal SLP outputs of the four models for the complete periods indicated in Table 1. The first two PCs for the four GCM SLP outputs are quite similar and show a future scenario with a positive trend in PC2 that represent a southward displacement of the South Atlantic high. As example, Figures 2 a and b show
Figure 2a. Principal components of SLP outputs for GFDL-R30 (1961-2099). the first two PCs for the SLP outputs of GFDL-R30 and the decadal explained variance by both PCs. The displacement of the South Atlantic high implies an increase in the frequency of easterly winds that could be responsible for the rise of the Río de la Plata level in Buenos Aires.
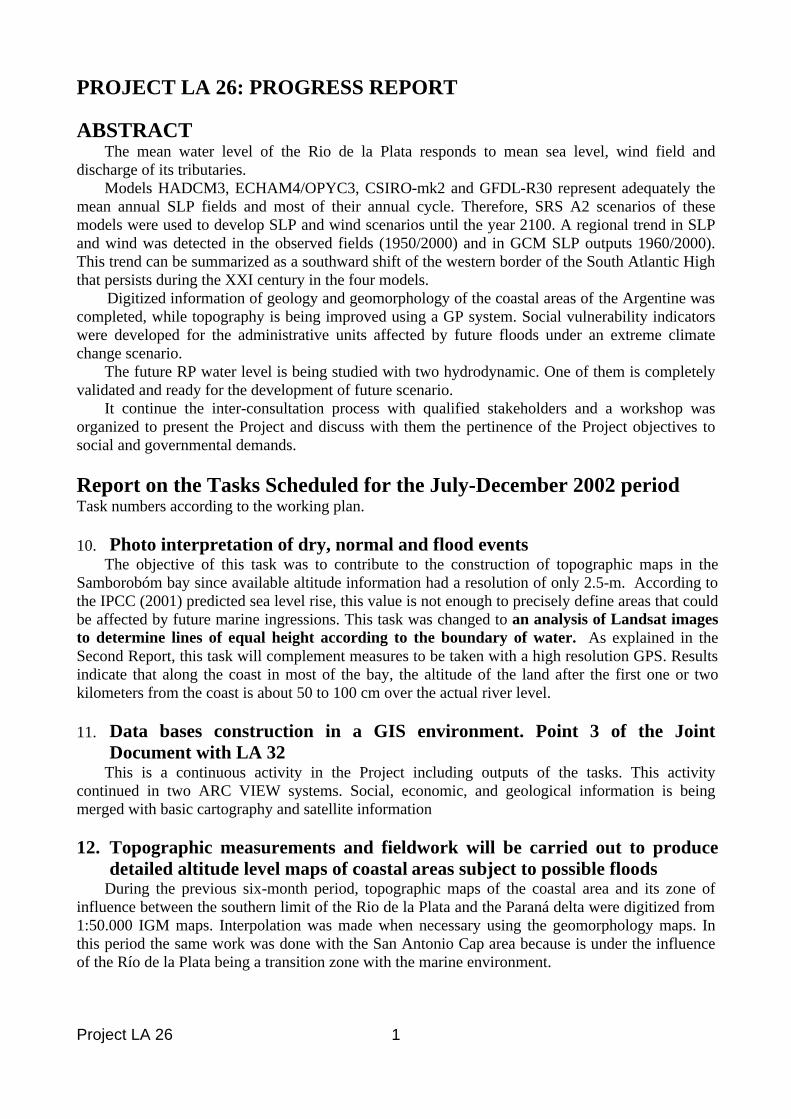
Figure 2b. Decadal explained variance by the two first principal components of SLP of GFDL-R30 outputs (1961-2099). M1 correspond to PC1 and M2 to PC2. Table 3 presents the historical and future scenarios of meridional SLP gradient over the Río de la Plata according to the NCEP-NCAR reanalysis and the GCMs indicated in Table 1. This variable is proportional to the wind intensity and results show that although there are discrepancies among the NCEP reanalysis and the different GCMs outputs, all of them agree with the fact that an increase in frequency of easterly winds will be also accompanied by an increase in their intensities.
Period 1950-59 1960-69 1970-79 1980-89 1990-99 2000-2050 2050-2099 NCEP 1.74 2.22 2.10 3.00 2.52 - - HADCM3 1.94 1.88 2.20 2.36 2.16 2.76 3.88 CSIRO-Mk2 - 0.74 0.42 0.74 0.72 1.02 1.34 ECHAM4 - - - - 4.18 4.78 5.26 GFDL-R30 - 0.62 0.82 1.10 1.00 1.28 1.76 Table 3. Meridional annual SLP gradients over the Río de la Plata according to NCEP-NCAR reanalysis and GCMs outputs.
Annex 3
HYDRODYNAMIC MODEL RPP-2D
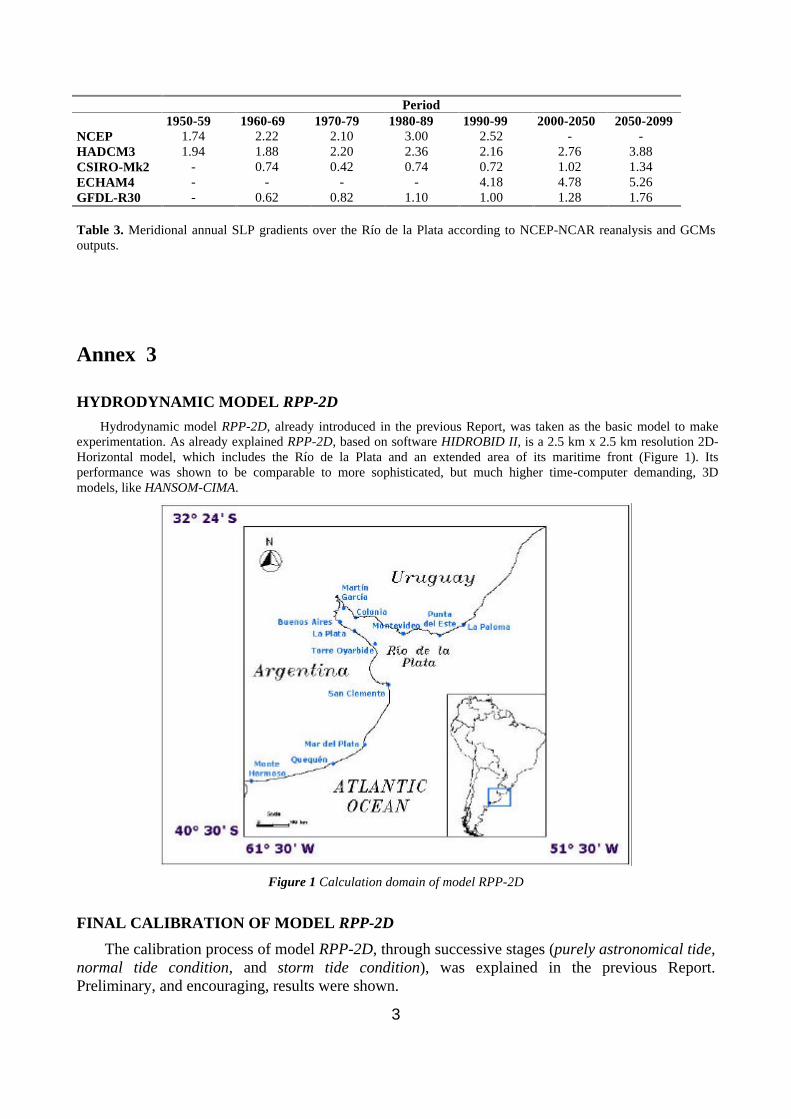
Hydrodynamic model RPP-2D, already introduced in the previous Report, was taken as the basic model to make experimentation. As already explained RPP-2D, based on software HIDROBID II, is a 2.5 km x 2.5 km resolution 2D-Horizontal model, which includes the Río de la Plata and an extended area of its maritime front (Figure 1). Its performance was shown to be comparable to more sophisticated, but much higher time-computer demanding, 3D models, like HANSOM-CIMA.
Figure 1 Calculation domain of model RPP-2D
FINAL CALIBRATION OF MODEL RPP-2D
The calibration process of model RPP-2D, through successive stages (purely astronomical tide, normal tide condition, and storm tide condition), was explained in the previous Report. Preliminary, and encouraging, results were shown.
4
The calibration is now completed. The following improvements were made:
1. Bathymetric information was rebuilt based on more accurate data sources.
2. The astronomical tide boundary condition at the southern border was redefined by using results from a global tidal model.
3. The adjustment of wind fields from NCEP/NCAR was refined through detailed experimentation.
As an illustration, Figure 2 shows the comparison between water level Tide Table data and model results for a pure astronomical tide scenario (only the oscillatory component is presented); the agreement is considered quite satisfactory. The comparison for a storm event is presented in Figure 3, showing a good agreement taking into account the relatively poor wind information. In Figure 4 velocity records and predictions are compared, showing an acceptable degree of agreement for such a sensitive quantity.
Figure 4 Comparison between recorded and calculated flow velocities, for a normal tide scenario. Component South-North Period 27/ Aug/ 96 –01/ Sep/ 96 (station 30-519)
PRELIMINARY MODEL EXPLOITATION
Model RPP-2D was first exploited to analyze sensitivity of system response to probable changes in the forcings: sea level rise, change in predominant seasonal wind pattern and tributary discharge increase. The results for Buenos Aires are summarized in Figure 5. It is observed that the system is practically blocked to sea level rise; the change in wind pattern could produce mean water
6
level increases up to about 10 cm; the discharge increase could lead to a mean level rise above 20 cm.
7
0.000.020.040.060.080.100.12
MG BA MO SC MP
leve
l (m
)
0.000.100.200.300.400.500.60
MG BA MO SC MP
leve
l (m
)
(a) (b)
0.00
0.20
0.40
0.60
0.80
MG BA MO SC MP
leve
l (m
)
0.00
0.02
0.04
0.06
0.08
MG BA MO SC MPle
vel (
m)
(c) (d)
50 cm + 30000 m3/s
75000 m3/s Wind (FUT-PRE)
Figure 5 Mean water level increase due to (a) wind pattern change, (b) sea level rise, (c) and (d) tributary discharge increase.
MG: Martín García; BA: Buenos Aires; MO: Montevideo; SC: San Clemente; MP: Mar del Plata.
The largest floods in the Uruguay river and
their climate forcing
Inés A. Camilloni 1 Departamento de Ciencias de la Atmósfera y los Océanos.
Universidad de Buenos Aires Centro de Investigaciones del Mar y la Atmósfera (CIMA/CONICET-UBA)
Buenos Aires, Argentina
and
Ruben M. Caffera Unidad Docente Meteorología. Facultad de Ciencias. Universidad de la República
Montevideo, Uruguay
Mayo 2003
1 Corresponding author address:
Inés A. Camilloni Departamento de Ciencias de la Atmósfera y los Océanos Ciudad Universitaria. Pabellón 2. Piso 2. (1428) Buenos Aires. Argentina. Tel. (5411) 4576-3398 Fax (5411) 4576-3356/3364 ext. 12 e-mail: [email protected]
2
Abstract
The Uruguay river is the second tributary in importance of the La Plata river with a basin that
includes a vast region of Southeastern South America. The objective of this article is to examine
the largest discharge events in the Uruguay river and to explore their atmospheric forcing.
Extreme daily Uruguay river levels registered during the austral warm season (October to
March) are related to intense rainfall in the upper basin particularly in the period -12 to -9 days
before the date of maximum level at the Salto Grande gauging station while those occurred
during the austral cold semester (April to September) are mostly due to large rainfall amounts
registered over and upstream Salto Grande in two separate periods before the flooding dates (-12
to -9 and -4 to -1 days).
The composites of the low-level wind fields for the warm season events show a northwestern
flow over Bolivia and Paraguay that converges with a weak northern component over the
Uruguay basin during the 12 days before the flooding date. The composites for the cold season
events show an intense northwesterly flow over the same region that continues over southeastern
South America and penetrates in the Atlantic ocean for the days -12 to -9 and -4 to -1 in
accordance with the two heavy rainfall periods identified over the Uruguay basin. The
circulation pattern during the -8 to -5 period shows northern flow and weak convergence over
the basin.
The enhanced precipitation due to moisture flux convergence in the South American low-level
jet (SALLJ) region could be responsible for almost half of the largest floods of the Uruguay
river at Salto Grande. For both the warm and cold seasons, the SALLJ occurrence largest
frequencies are observed during the periods -12 to -9 and -4 to -1 before the flooding dates with
a major decrease in the frequency during the intermediate period of the cold season events.
In most cases, the extreme daily Uruguay river levels induced extraordinary discharges at the
monthly scale. The largest monthly discharge anomalies at the Paso de los Libres gauging
3
station occurred mostly during warm ENSO phases explained by the large positive rainfall
anomalies observed in the region during these events.
4
1. Introduction
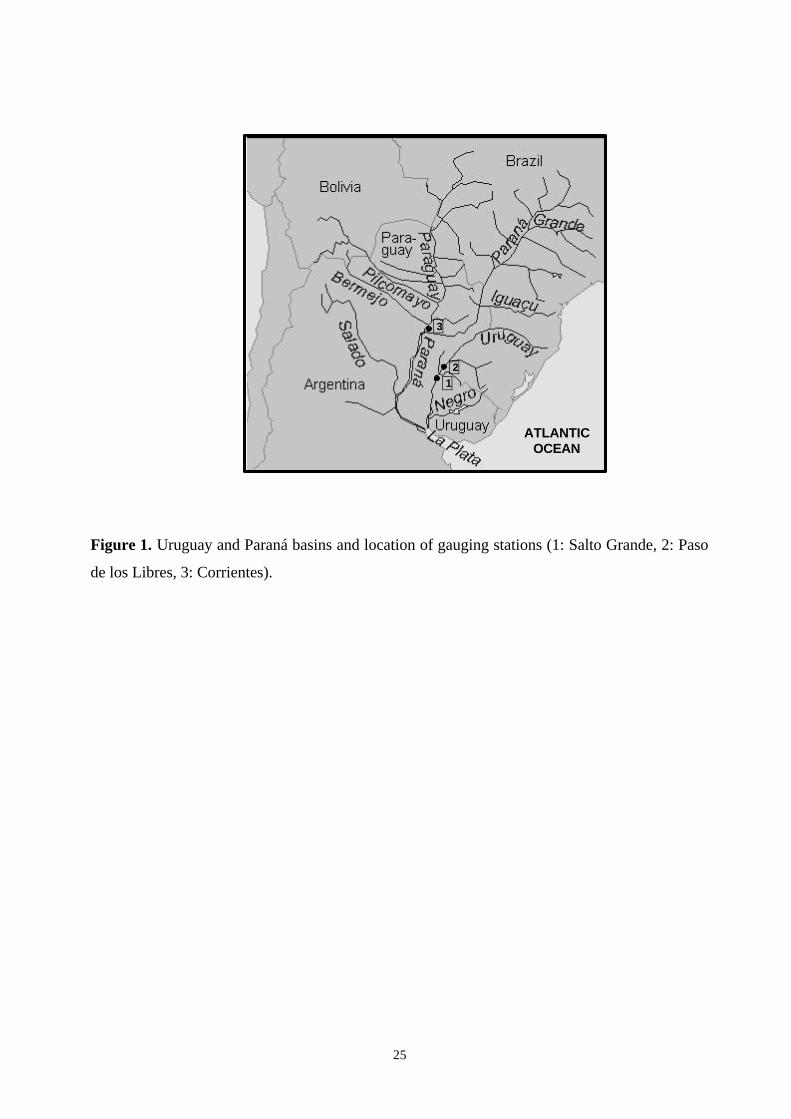
The Uruguay river is the second tributary in importance of the La Plata river with a basin of
365,000 km2 that includes parts of Brazil, Uruguay and Argentina and a mean flow of about
4500 m3/s. It begins near the Atlantic Ocean at a height of approximately 1800 m above sea
level and ends at the La Plata river (Figure 1). The major tributary of the Uruguay is the Negro
river, which originates in Brazil and crosses Uruguay with a northeast to west direction.
During recent years, many authors have explored different features of the hydrology of the
Uruguay basin. García and Vargas (1996, 1998) investigated the spatial variability of average
monthly and yearly flows at selected gauging stations in the river. They also searched for
significant changes in the streamflow trends, and found a positive trend since 1970 and changes
around the years 1917-1918 and 1943. Genta et al (1998) identified long-term trends in the
monthly streamflow records of four major rivers in Southeastern South America including the
Uruguay river that were consistent with a significant decrease in the amplitude of the seasonal
cycle. Robertson and Mechoso (1998) analyzed the interannual and decadal cycles in river flows
of Southern South America. They focused the analysis on annual mean streamflows and found
interannual cycles (at around 3.5, 6 and 9 years) and a nonlinear trend. Other studies were
focused on the relationship between river discharges and climatic forcing. For instance,
Mechoso and Perez Iribarren (1992) analyzed the relationship between the Southern Oscillation
(SO) and the Uruguay and Negro rivers. They found that streamflows in both rivers present a
tendency to be below average in years with high SO index and a tendency to be slightly above
average in El Niño-Southern Oscillation (ENSO) years. Robertson and Mechoso (1998)
demonstrated that the 3.5 years cycle in the Uruguay and Negro flow series is associated to an
ENSO-like pattern in the Pacific sea surface temperature anomalies with above-average
streamflow coinciding with a warm phase in the eastern equatorial Pacific. Bischoff et al. (2000)
studied the variability of the Uruguay river flows and the influence of the ENSO phenomenon.
5
They found significant differences in the river flow between warm and cold events in the
equatorial Pacific during November, December, July and August. Recently, Krepper et al.
(2003) analyzed the river flow and the precipitation in the Uruguay river basin and its
subcatchments in order to address how the signals of the subcatchments relate to the overall
basin signal. They found that the around 6-year and the 3.5-year ENSO signals are the two
statistically significant peaks for the river flow and that both signals are present only in the
precipitation of the upper two-thirds of the basin.
However, despite the aforementioned contributions, there is a lack of a description of the largest
floods of the Uruguay river and their causes. A better understanding of the climate forcing of
these events can help to prevent future disasters and huge economic loss. The aim of this paper
is to examine the extreme discharge events in the Uruguay river for the period 1950-2000 and to
explore their atmospheric forcing. The paper is structured as follows. Section 2 summarizes the
main regional climate features and the datasets are described in section 3. Section 4 discusses
the main hydrological features of the Uruguay river and the differences with the regime of the
Paraná river. Section 5 discusses the climatic forcing of the extreme discharge events in the
Uruguay river and the relation between these extreme events and the SALLJ. Finally, section 6
examines the relation between the largest monthly discharge anomalies and ENSO and section 7
summarizes results and conclusions.
2. Regional climate background
Northern Argentina, Paraguay, Uruguay and southern Brazil experience different types of
transient disturbances. Cold frontal passages are common transient weather events over the
continent and convective activity is triggered as they pass over northern Argentina, Paraguay,
Uruguay and southern Brazil. Oliveira (1986) performed monthly statistics of frontal
penetrations and their effect on the convective activity over subtropical South America. The
6
frontal passages are well spread over all seasons and although their convective activity is very
low during the winter months, they are responsible for a large part of the rainfall. Southeastern
South America also experiences the effects of sudden development of mesoscale convective
complexes (MCCs) especially in the period November-April (Velasco and Fritsch, 1987). These
complexes have a life cycle of less than a day (Satyamurty et al., 1998).
An important feature of the South American climate is that as the Atlantic subtropical high
migrates southward in early summer, convection develops along the South Atlantic
Convergence Zone (SACZ). This band of intense convective activity emanates from the
Amazon region extending from the tropical South America southeastward into the South
Atlantic Ocean (Kodama, 1992; Figueroa et al., 1995; Nogués-Paegle and Mo, 1997; Liebmann
et al., 1999; Barros et al., 2000). Nogués-Paegle and Mo (1997) found evidence of a seesaw
pattern in the convection over the SACZ with each phase lasting no more than 10 days. This
pattern indicates that the intensification (weakening) of the SACZ is associated with rainfall
deficit (abundance) over the subtropical plains of South America. Doyle and Barros (2002)
found that the midsummer interannual variability of the low-level tropospheric circulation and
of the precipitation field in subtropical South America is associated to the sea surface
temperature (SST) anomalies in the western subtropical South Atlantic Ocean. Composites
corresponding to extreme SSTs in the area 20ºS-30ºS and 30ºW-50ºW show two different low-
level circulation and precipitation patterns. The composite of cases with positive SST anomalies
shows two regional maximum in the precipitation field with one of them centered at about 30ºS
and 55ºW and the other one located along the continental extension of a southwardly displaced
SACZ.
Another of the key atmospheric features that contributes to the precipitation over Southern
South America is a northwesterly low-level jet that is situated east of the Andes mountains and
transports atmospheric moisture from the Amazon basin toward subtropical South America. The
7
South American low-level jet (SALLJ) is particularly pronounced over Bolivia, extending
southeastward to the La Plata basin comprising Paraguay, southeast Brazil, Uruguay and
northern Argentina. The low-level jet provides the moisture transport for the formation of clouds
(Berri and Inzunza, 1993) and precipitation in MCCs that generally moves eastward from their
source region in northern Argentina and Paraguay to affect southwestern Brazil and Uruguay
with intense rainfall (Satyamurty et al., 1998). The observational evidence of the SALLJ is
scarce because of the poor radiosonde coverage. Because of this, current understanding of the
SALLJ is founded on diverse basis, including operational analyses (Nogués-Paegle, 1981;
Sughara, 1994; Wang and Paegle, 1996), NCEP/NCAR reanalyses (Douglas et al., 1999;
Marengo and Soares, 2002), high resolution regional models (Douglas et al., 1999) or
considering special observation projects like the Pan American Climate Studies (PACS)
Sounding Network (SONET) during a two-months period of 1998 (Douglas et al., 1999) or the
Wet Season Atmospheric Mesoscale Campaign (WETAMC) of January-April 1999 conducted
in the southwest corner of the Amazon basin (Marengo et al., 2002). The SALLJ occurs all year
long but 75% of the cases during 1950-2000 were detected during the austral warm season
November-February at the core region near Santa Cruz (17.76ºS, 63.15ºW) while at the exit
region near Mariscal Estigarribia (22.02°S, 60.6ºW) the jet is more frequent during the austral
winter and spring seasons (Marengo and Soares, 2002). According to Berbery and Barros
(2002), the moisture flux over South America during the austral summer has a southward
maximum between 900 and 950 hPa and a somewhat higher maximum at 850 hPa during
winter. The winter SALLJ is probably the responsible for providing moisture and heat ahead of
frontal zones and cyclonic systems that produce much of the winter precipitation (Vera et al.,
2002).
During the austral summer, the meridional transport of tropical air into midlatitudes is linked to
the Chaco Low located approximately at 25ºS and 65ºW. During this season, this system
8
intensifies due to positive net radiation favoring the transport of tropical air masses to the south
and the presence of strong convection activity fed by moisture from tropical regions (Seluchi
and Marengo, 2000). The SALLJ displays a maximum near Santa Cruz and in some occasions a
secondary maximum is found in southern latitudes called Chaco jet events. During the Chaco
events the SALLJ penetrates downwind up to 30ºS and exhibits a strong moisture flux
convergence and enhanced precipitation over Paraguay, northeastern Argentina, southeastern
Brazil and Uruguay (Nicolini and Saulo, 2000, Nicolini et al, 2002). Likewise, Nicolini and
Saulo (2000) showed that in those cases the composite fields of the 850 hPa wind and sea level
pressure show an intensification of the Chaco thermal-orographic low extending farther south up
to Uruguay.
3. Data
Daily Uruguay river levels at the Salto Grande monitoring station (see Figure 1) were obtained
from the National Direction of Hydrology of Uruguay for the period 1950-2000. In order to
evaluate the possible effect of anthropogenic management of the river flows immediately
upstream from Salto Grande, daily Uruguay river levels at the Argentine gauging station Paso de
los Libres (Figure 1) were also considered for the available period (1997-98). Monthly
streamflows at Paso de los Libres for 1909-2000 were analyzed to explore the relation between
the largest monthly discharges of the Uruguay river and ENSO events. The Argentine
Department of Water Resources provided these data.
The data used to examine the atmospheric conditions during the major discharge events of the
Uruguay river were the 0000, 0600, 1200 and 1800 UTC and daily averaged gridded reanalyses
from the National Centers for Environmental Prediction-National Center for Atmospheric
Research (NCEP-NCAR) (Kalnay et al., 1996) with a horizontal resolution of 2.5º latitude by
2.5º longitude. Daily averages of the National Oceanic and Atmospheric Administration
9
(NOAA) satellite outgoing longwave radiation (OLR) were used as a precipitation proxy to
validate with independent data results obtained with the NCEP-NCAR precipitation reanalyses.
4. Major discharge events
The Paraná and Uruguay rivers are the main tributaries of the La Plata river. Therefore the
comparison between their regimes is important due to the different time scales associated to
their extreme events. The greatest discharge events in the Paraná river present a longer time
scale than in the Uruguay and consequently they have been studied on a monthly basis
(Camilloni and Barros, 2003). The time scale of the greatest discharge events in the Uruguay
river have approximately the same duration of the atmospheric perturbations (3-10 days) that
induce the associated extreme rainfall events. This is due to the steep slope (~0.086 m/km for
the Uruguay river around Salto Grande in comparison to ~0.036 m/km of the Paraná river in the
proximity of Corrientes) and the narrow transverse section that favor the runoff (Tossini, 1959).
The differences between the daily regimes of both rivers can be visualized in Figure 2 where the
daily river level values for 1997-98 at Corrientes in the Paraná river (Figure 1) and Paso de los
Libres in the Uruguay River are presented. Although both rivers exhibit the same low frequency
modulation, the Paraná river presents lower interdiurnal variability. Figure 3 also provides an
insight of the differences between both rivers as presents the spectral densities of the monthly
discharge anomalies at Corrientes and Paso de los Libres for 1946-2000. The largest spectral
densities of the Paraná river are found for periods of 4.5 months or longer and are almost null
for periods shorter than 3 months. In the case of the Uruguay river, large spectral densities are
also observed for the shortest periods. Figures 2 and 3 indicate that the greatest discharge events
in the Uruguay river are mainly noticeable in a daily scale and eventually in a monthly scale as
it will be discussed in section 6.
10
The critical Uruguay river level for flooding at the Salto Grande monitoring station established
by the National Direction of Hydrology of Uruguay is 8 meters. Table 1 lists all the events
during 1950-2000 with the eighteen highest river levels that in all cases were higher than 14
meters. The dates presented in this table were selected as the ones during the flood event with
maximum height. Most of the extreme events presented in the table lasted for less than a week
with the exception of the events occurred in 1983 and 1998 simultaneously with the strongest El
Niño events of the century.
The monitoring station Salto Grande is located downstream the Salto Grande dam shared by
Uruguay and Argentina. In order to identify the possible effect of anthropogenic regulation of
the discharges by the dam after 1980 when Salto Grande started to operate, Figure 4 presents a
comparison between the daily river levels at the monitoring station Paso de los Libres upstream
the Salto Grande dam and the Salto Grande values for a flooding period of 1997-98. Although it
is possible to appreciate a slight modulation in the river flows at Salto Grande, the regulation
activities at the dam are relatively small and do not hide the flood tide. Figure 4 also allows
identifying that the lags between the beginning of the increase of the river level at Paso de los
Libres and the date of maximum level at Salto Grande were of no more than 12 days.
Therefore, to analyze the largest river levels of the Uruguay at Salto Grande, only the daily
atmospheric fields of different variables up to 12 days before the flooding date will be studied.
Table 1 shows that although the number of extreme events occurred during the warm semester
(nine) is the same than during the cold season, the highest river level values are mostly observed
during the cold semester. In fact, 8 out of the 10 highest river levels occurred between April and
September.
11
5. Climate forcing of the major discharge events
a. Rainfall, OLR and low-level atmospheric circulation
In order to explore the climatic forcing of the flood events included in Table 1, they were
divided in two groups of nine events each according to the month of occurrence, in warm
season events (occurred during the austral spring and summer from October to March) and cold
season events (occurred during the austral autumn and winter from April to September). Figures
5 to 7 present the composites for the warm and cold seasons events of the values of different
meteorological variables for the averages of three four-day periods comprising the days -12 to
-9, -8 to -5 and -4 to -1 prior the selected flooding dates presented in Table 1.
Figure 5 presents the daily mean accumulated precipitation for the composites defined
previously. Rainfall patterns show a quite different spatial distribution between the warm and
cold season events. For the events occurred during the austral spring and summer, daily rainfall
values are between 6 and 12 mm day-1 upstream Paso de los Libres in the period between -12 to
-5 days before the maximum river level at Salto Grande with a maximum in the period -12 to -9.
The four days immediately before the flooding date of the warm season events show lower daily
rainfall values in the basin than the previous eight days although a high precipitation rate
continues to the north outside the Uruguay basin. During the cold events, the largest
precipitation values are observed in a southernmost position than during the warm events
although they show a similar intensity during the -12 to -9 and -4 to -1 days. The rainfall
amounts are quite small during the period -8 to -5 indicating that the extreme discharge events in
Salto Grande could be caused by two wet periods with an intermediate one probably associated
to a cold frontal passage. This is confirmed when inspecting individual cases (not shown).
These results are consistent with the OLR composites presented in Figure 6. Considering that
OLR values less than 240 Wm-2 are indicative of convective activity in the region (Kousky,
1988; Barros et al., 2000), the figure shows that the main convective centers over the Uruguay
12
basin are located in a southernmost position and are more intense during the cold events than
during the warm ones. Figures 5 and 6 show a different temporal and spatial distribution of
convection and rainfall over the Uruguay basin between the warm and cold events during the
days previous to the flooding date. Consequently, floods registered during the warm semester
(October to March) are due to intense rainfall in the upper basin particularly in the period -12 to
-9 days before the flood date while those occurred during the cold one (April to September) are
mostly due to the large rainfall amounts registered over and near upstream Salto Grande in two
separate periods (-12 to -9 and -4 to -1).
Figure 7 shows the four-day composites of the 925 and 850 hPa wind fields for the warm and
cold events respectively. The different tropospheric levels considered for both periods were
selected according to the results of Berbery and Barros (2002) showing that the maximum
moisture flux over South America during the austral summer has a maximum between 900 and
950 hPa and a higher maximum at 850 hPa during winter. The composite for the warm season
events show a northwestern flow over Bolivia and Paraguay that converges with a weak
northern component over the Uruguay basin during the first two four-day periods. The
composites for the cold events show an intense northwesterly flow over Bolivia and Paraguay
that continues over northern Argentina and southern Brazil and penetrates in the Atlantic ocean
for the periods -12 to -9 and -4 to -1. This circulation pattern is probably associated to warm and
humid advection and it is in accordance with the two heavy rainfall periods over the Uruguay
basin identified in Figure 5. The circulation pattern during the -8 to -5 period is somewhat
different with a predominantly northern flow and weak convergence over the Uruguay basin.
b. Relation between extreme discharge events and the SALLJ
The SALLJ has been identified as a key factor in the water vapor transport and the triggering of
organized convection associated to enhanced precipitation over Southeastern South America.
13
This section explores the occurrence of SALLJ events up to 12 days before the flooding dates
indicated in Table 1.
Although Bonner's (1968) criterion for low-level jet identification is based on observations, his
methodology was adapted to NCEP reanalyses for studies to identify the SALLJ (Marengo et al,
2002). In this study, the conditions that must be satisfied to identify a day with SALLJ are: (a)
meridional winds must be more predominant than zonal winds (v>u) immediately east of the
Andes, (b) the meridional component must be southward (v<0), (c) wind speed must exceed
12m/s in some pressure level between surface and 850 hPa, and (d) vertical wind shear between
850 and 700 hPa (for the austral autumn and winter cases) or between 925 and 700 hPa (for the
austral spring and summer cases) must be at least 6 m/s. These conditions must be observed at
least at one of the four daily individual reanalysis data (0000, 0600, 1200 and 1800 UTC).
The SALLJ was identified in 42.6% of the days among the 12 days before the flooding dates
occurred during the austral autumn and winter. This percentage is slightly higher than the 40.7%
obtained for the spring and summer cases. Consequently, almost half of the largest discharge
events of the Uruguay river at Salto Grande could be related to enhanced precipitation due to
moisture flux convergence in the SALLJ exit region. Table 2 summarizes the occurrence of
SALLJ during the warm and cold seasons for three four-day periods before the extreme
discharge dates at Salto Grande indicated in Table 1. Both seasons show the largest frequencies
of occurrence of SALLJ during the periods -12 to -9 and -4 to -1. During the cold season events,
these frequencies are more than twice the frequency of the intermediate period in accordance
with the two heavy rainfall periods identified in Figure 5.
6. Relations between the largest monthly discharge events and ENSO
The largest monthly discharge anomalies of the Uuruguay river for 1909-2000 at Paso de los
Libres the gauging station were selected following the criterion that the discharge anomalies
14
were larger than at least three times the monthly standard deviation for the respective month.
The eighteen events that satisfied this condition are listed in Table 3. The magnitude of these
extraordinary discharges minimizes the possible impact of water management by upstream
dams.
Comparison between the maximum daily Uruguay river level at Salto Grande (Table 1) and the
extreme monthly discharge anomalies at Paso de los Libres (Table 3) indicates that 10 out of the
18 extreme daily values resulted in extraordinary discharges at the monthly scale. Out of the
other 8 extreme daily cases, six occurred during months that rank among the thirty-five largest
monthly discharge anomalies of the period with values higher than twice the corresponding
standard deviation for that month while the two remaining daily cases also show positive
anomalies at the monthly scale.
The cases listed in Table 3 constitute events that must necessarily have been caused by
considerable precipitation anomalies. The Uruguay basin is part of a region that has a strong
precipitation signal during ENSO events (Kousky et al., 1984; Ropelewski and Halpert, 1987,
1996; Kiladis and Díaz, 1989, Pisciottano et al., 1994) and therefore it can be expected a
hydrological response to ENSO. To facilitate the discussion of this aspect, Table 3 includes a
classification of the events according to the season and ENSO phase and the SST anomalies in
the El Niño-3 region. The starting and end months of ENSO events that occurred after 1950
were defined according to Trenberth (1997) and the ENSO years before 1950 were taken from
Kiladis and Diaz (1989). There is a clear relationship between ENSO phases and the major
discharge anomalies in the Uruguay river. In Paso de los Libres, 13 out of 18 occurred during El
Niño events. In addition, none of them occurred during La Niña phase. Table 3 shows that
although the largest monthly discharge anomalies at Paso de los Libres occurred mostly during a
warm ENSO phase, there is not a dominant season since there are 5 cases during the austral
autumn (March to May) of the year following the onset of an El Niño event (autumn +), 4
15
during the austral spring 0 (September to November), 3 during the austral summer + (December
to February) and only 1 during the austral winter+ (June to August). This result shows a
different response to ENSO events between the Uruguay and the Paraná basins as the analysis of
the largest monthly discharge anomalies of the Paraná river at Corrientes shows that the top
discharges occurred during the austral autumn + (Camilloni and Barros, 2003).
Figure 8 presents the seasonal rainfall anomalies in Southeastern South America for the El Niño
phases with monthly extreme discharge events in the Uruguay basin considering all the El Niño
events occurred after 1950. All seasons show positive rainfall anomalies over the Uruguay basin
which are statistically significant at the 95% level for three of the four analyzed phases. The
largest significant anomalies occurred during autumn + in the upper part of the basin at about
25ºS. During spring 0 and summer +, the largest anomalies occurred to the north of 30ºS
upstream from Salto Grande. This figure suggests that the extreme monthly discharges at Paso
de los Libres are a consequence of large rainfall anomalies to the north of that station with a
relatively small contribution of local rainfall events.
7. Concluding remarks
The Uruguay basin is part of a region in Southeastern South America that has a strong
precipitation signal during ENSO events. The hydrological response to ENSO is evident as most
of the largest monthly discharge events of the Uruguay river at Paso de los Libres gauging
station occurred during the El Niño phase. Nevertheless, the analysis of the individual extreme
discharge events on daily basis show that these floods last between 3 and 10 days and
consequently it is necessary to study their climate features in the synoptic scale.
The number of extreme events occurred at the Salto Grande gauging station at the daily scale
during the warm semester (October to March) are the same than during the cold season (April to
September). However, the highest river levels are mostly observed during the cold semester.
16
Floods registered during the warm season are due to intense rainfall in the upper basin
particularly in the period -12 to -9 days before the flooding date, consequently the hydrological
forecast of these events is possible many days in advance. The largest discharges occurred
during the cold semester are mostly due to the large rainfall amounts registered over and
upstream from Salto Grande in two separate periods (-12 to -9 and -4 to -1 days before the
flooding date) and the hydrological prediction must necessarily depend on an appropriated
weather forecast.
Almost half of the largest discharge events of the Uruguay river at Salto Grande could be related
to enhanced precipitation due to moisture flux convergence in the SALLJ region. The frequency
of occurrence of SALLJ during the 12 days before the flooding date of the cold season extreme
events is slightly larger than during the warm semester. This result shows the relevance of the
cold season SALLJ in the contribution to moisture transport and atmospheric convection and
also indicates a departure from the behavior of the North American LLJ that is only present and
exhibits large moisture fluxes during the warm season (Berbery and Barros 2002).
Acknowledgements
This paper was funded by the University of Buenos Aires under its Program of Strategic
Projects; by the AIACC, a Project of the GEF implemented by the UNEP and co-executed by
START and the TWAS and by IAI CRN-55 (PROSUR).
References
Barros, V.R., M.H. Gonzalez, B. Liebmann and I.A.Camilloni. 2000. Influence of the South
Atlantic Convergence Zone and South Atlantic Sea Surface Temperature on interannual summer
rainfall variability in Southeastern South America. Theor. and Appl. Meteor. 67, 123-133.
17
Berbery, E.H. and V.R. Barros. 2002. The hydrological cycle of the La Plata basin in South
America. J. Hydromet. 3, 630-645.
Berri, G.J. and B.J. Inzunza. 1993. The effect of the low-level jet on the poleward water vapor
transport in the central region of South America. Atmos.Envirnom.27A, 335-341.
Bischoff, S.A., N.O. García, W.M. Vargas, P.D. Jones, and D. Conway. 2000. Climatic
variability and Uruguay river flows. Water International 25, 446-456.
Camilloni, I. and V.R. Barros. 2003. Extreme discharge events in the Paraná River and their
climate forcing. Journal of Hydrology (in press).
Doyle, M.E. and V.R. Barros. 2002. Midsummer low-level circulation and precipitation in
subtropical South America and related sea surface temperature anomalies in the South Atlantic.
J. Climate 15, 3394-3410.
Figueroa, S., P. Satyamurty and P.L. Silva Dias. 1995. Simulation of the summer circulation
over the South American region with Eta coordinate model. J. Atmos. Sci. 52, 573-584.
García N.O. and W.M. Vargas. 1996. The spatial variability of runoff and precipitation in the
Río de la Plata basin. Hydrological Science Journal 41, 279-299.
García N.O. and W.M. Vargas. 1998. The temporal climatic variability in the Rio de la Plata
basin displayed by the river discharges. Climatic Change 38, 359-379.
Genta, J.L., G. Pérez Iribarren and C.R. Mechoso. 1998. A recent increasing trend in the streamflow of
rivers in Southeastern South America. J. Climate 11, 2858-2862.
Kalnay, E and coauthors. 1996. The NCEP/NCAR Reanalysis 40 years- project. Bull. Amer.
Meteor. Soc. 77, 437-471.
Kiladis, G.N. and H.F.Diaz. 1989. Global climatic anomalies associated with extremes in the
Southern Oscillation. J.Climate 2, 1069-1090.
18
Kodama, Y.M. 1992. Large scale common features of subtropical precipitation zones (the Baiu frontal
zone, the SPCZ and the SACZ). Part I: Characteristics of subtropical frontal zones. J.Meteor.Soc.Japan
70, 813-836.
Krepper, C.M., N.O. García and P.D. Jones. 2003. Interannual variability in the Uruguay river
basin. Int. J. of Climatology 23, 103-115.
Liebmann, B., G. Kiladis, J. Marengo, T. Ambrizzi. and J. Glick. 1999. Submonthly convective
variability over South America and South Atlantic Convergence Zone. J. Climate 12, 1877-
1891.
Mechoso, C.R. and G. Pérez Iribarren. 1992. Streamflow in Southeastern America and the
Southern Oscillation. J. Climate 5, 1535-1539.
Nicolini, M. and A.C. Saulo. 2000. ETA characterization of the 1997-98 warm season Chaco jet
cases. Preprints of Sixth International Conference on Southern Hemisphere Meteorology &
Oceanography. Santiago, Chile, 336-337.
Nicolini, M.; Saulo, A.C.; Torres, J.C. and P.Salio. 2002. Enhanced precipitation over
Southeastern South America related to strong low-level jet events during austral warm season.
Meteorologica 27, 59-69.
Nogués-Paegle, J. and K. Mo. 1997. Alternating wet and dry conditions over South America
during summer. Mon. Wea. Rev. 125, 279-291.
Oliveira, A.S. 1986. Interacões entre sistemas frontais na América do Sul e a conveccão da
Amazônia (Interactions between the South American frontal systems and the Amazonian
convection) INOE-4008-TDL/239, Instituto Nacional de Pesquisas Espaciais, 115 pp.
Pisciottano, G.; A.Diaz; G.Cazes and C.R.Mechoso. 1994. El Niño-Southern Oscillation impact
on rainfall in Uruguay. J. Climate 7, 1286-1302.
Robertson, A.W. and C.R. Mechoso. 1998. Interannual and decadal cycles in river flows of
Southeastern South America. J. Climate 11, 2570-2581.
19
Satyamurty, P., C.Nobre and P.L. Silva Dias. 1998. South America. Meteorology of the
Southern Hemisphere. D. Karoly and D. Vincent (eds.). American Meteorological Society, 410
pp.
Seluchi, M. and J. Marengo. 2000. Tropical-midlatitude exchange of air masses during summer
and winter in South America: climatic aspects and examples of intense events. Int. J. of
Climatology 20, 1167-1190.
Tossini, L. 1959. Sistema hidrográfico y Cuenca del Río de la Plata. Contribución al estudio de
su régimen hidrológico. (Hydrogrphic system and Río de la Plata basin. Contribution to the
study of the hydrologic regime). Anales de la Sociedad Científica Argentina. Marzo-Abril 1959,
III y IV, Tomo CLXVII, 41-64.
Trenberth, K.E. 1997. The definition of El Niño. Bull. Amer. Meteor. Soc. 78, 2771-2777.
Velasco, I. and J.M. Fritsch. 1987. Mesoscale convective complexes in the Americas.
J.Geophys.Res. 92, 9591-9613.
Vera, C.S., P.K. Vigliarolo and E.H. Berbery. 2002. Cold season synoptic-scale waves over
Subtropical South America. Mon.Wea.Rev. 130, 684-699.
20
Captions
Figure 1. Uruguay and Paraná basins and location of gauging stations (1: Salto Grande, 2: Paso
de los Libres, 3: Corrientes).
Figure 2. Daily river levels at Corrientes (Paraná river) and Paso de los Libres (Uruguay river)
for 1997-98.
Figure 3. Spectral densities of the monthly discharge anomalies at Corrientes (Paraná river) and
Paso de los Libres (Uruguay river) for 1946-2000.
Figure 4. Daily Uruguay river levels at Salto Grande and Paso de los Libres for a period
between December 1997 and June 1998.
Figure 5. Composites of daily mean accumulated precipitation for the averages of three four-
day periods comprising the days -12 to -9, -8 to -5 and -4 to -1 prior the selected flooding dates
for the warm (left)and cold (right) season events.
Figure 6. As fig. 5, for OLR.
Figure 7. As fig. 5, for 925 hPa wind (left) and 850 hPa wind (right).
Figure 8. Rainfall anomalies in Southeastern South America during El Niño phases with
extreme monthly discharges at Paso de los Libres (significant anomalies at the 95% level are
shaded).
21
Table 1. Largest Uruguay river daily levels at Salto Grande during 1950-2000.
Table 2. Relative frequency (%) of occurrence of SALLJ for three four-day periods before the
flooding dates indicated in Table 1.
Table 3. Extreme monthly discharge anomalies of the Uruguay river at Paso de los Libres.
ENSO phase and El Niño-3 SST anomalies are also included.
22
Date Height (m)
16 April 1959 20.18
25 July 1983 17.85
16 April 1986 17.71
7 June 1992 17.71
19 June 1972 17.16
8 May 1983 16.91
10 January 1998 16.70
8 September 1972 16.43
26 April 1998 16.26
20 October 1997 16.01
17 November 1982 16.01
25 April 1987 15.91
13 November 1997 15.76
9 March 1998 15.59
18 October 1979 15.46
13 February 1998 15.33
9 November 1979 15.04
30 October 1954 14.63
Table 1. Largest Uruguay river daily levels at Salto Grande during 1950-2000.
23
period before the flooding date
-12 to -9 days -8 to -5 days -4 to -1 days
Warm season events 41.7 33.3 47.2
Cold season events 50.0 22.2 55.6
Table 2. Relative frequency (%) of occurrence of SALLJ for three four-day periods before the
flooding dates indicated in Table 1.
24
Date of maximum monthly
discharge anomaly
Discharge anomaly (m3/s) SST Niño 3 anomaly (ºC)
May 1941 (Autumn +) 17338 1.88
July 1983 (Winter +) 15838 1.04
November 1997 (Spring 0) 15592 3.59
May 1983 (Autumn +) 15196 1.91
October 1929 (Neutral) 15129 0.53
November 1982 (Spring 0) 14689 2.66
February 1998 (Summer +) 13615 2.57
October 1997 (Spring 0) 12946 3.29
June 1990 (Neutral) 12633 0.08
April 1998 (Autumn +) 11932 1.68
September 1928 (Neutral) 11591 0.07
September 1972 (Spring 0) 11301 1.52
April 1932 (Neutral) 9926 0.50
March 1998 (Autumn +) 9410 2.05
March 1983 (Autumn +) 9267 2.01
August 1983 (Neutral) 8894 0.92
January 1998 (Summer +) 8703 3.32
January 1912 (Summer +) 7692 1.39
Table 3. Extreme monthly discharge anomalies of the Uruguay river at Paso de los Libres.
ENSO phase and El Niño-3 SST anomalies are also included.
25
Figure 1. Uruguay and Paraná basins and location of gauging stations (1: Salto Grande, 2: Paso
de los Libres, 3: Corrientes).
ATLANTIC OCEAN
1
2
3
26
Figure 2. Daily river levels at Corrientes (Paraná river) and Paso de los Libres (Uruguay river)
for 1997-98.
0
2
4
6
8
10
12
14
01/0
1/97
01/0
2/97
01/0
3/97
01/0
4/97
01/0
5/97
01/0
6/97
01/0
7/97
01/0
8/97
01/0
9/97
01/1
0/97
01/1
1/97
01/1
2/97
01/0
1/98
01/0
2/98
01/0
3/98
01/0
4/98
01/0
5/98
01/0
6/98
01/0
7/98
01/0
8/98
01/0
9/98
01/1
0/98
01/1
1/98
01/1
2/98
leve
l (m
)
Corrientes (Paraná River) Paso de los Libres (Uruguay River)
27
Figure 3. Spectral densities of the monthly discharge anomalies at Corrientes (Paraná river) and
Paso de los Libres (Uruguay river) for 1946-2000.
period (months)
Spe
ctra
l den
sity
0
1
2
3
4
5
6
7
2 3 4 5 6 7 8 9 10 11 12
Corrientes (Paraná River)Paso de los Libres (Uruguay River)
period (months)
0
1
2
3
4
5
2.0 2.5 3.0 3.5 4.0 4.5 5.0
28
Figure 4. Daily Uruguay river levels at Salto Grande and Paso de los Libres for a period
between December 1997 and June 1998.
leve
l (m
)
0
2
4
6
8
10
12
14
16
18
20
19-D
ec97
24-D
ec97
29-D
ec97
3-Ja
n98
8-Ja
n98
13-J
an98
18-J
an98
23-J
an98
28-J
an98
3-F
eb98
8-F
eb98
13-F
eb98
18-F
eb98
23-F
eb98
28-F
eb98
5-M
ar98
9-M
ar98
14-M
ar98
19-M
ar98
24-M
ar98
29-M
ar98
3-A
pr98
8-A
pr98
13-A
pr98
18-A
pr98
23-A
pr98
28-A
pr98
3-M
ay98
8-M
ay98
13-M
ay98
18-M
ay98
23-M
ay98
28-M
ay98
2-Ju
n98
Paso de los LibresSalto Grande
29
Figure 5. Composites of daily mean accumulated precipitation for the averages of three four-day periods comprising the days -12 to -9, -8 to -5 and -4 to -1 prior the selected flooding dates for the warm (left)and cold (right) season events.
30
Figure 6. As fig. 5, for OLR.
31
Figure 7. As fig. 5, for 925 hPa wind (left) and 850 hPa wind (right).
32
Figure 8. Rainfall anomalies in Southeastern South America during El Niño phases with
extreme monthly discharges at Paso de los Libres (significant anomalies at the 95% level are
shaded).
ANNEX 4
Title: Impact of a possible local wind change on the wave climate in the upper Río de
la Plata.
Walter C. Dragani1,2,3 and Silvia I. Romero1,2
1Departamento Oceanografía, Servicio de Hidrografía Naval and ESCM-INUN, Av. Montes de Oca 2124 (C1270ABV) Ciudad Autónoma de Buenos Aires, Argentina. 2Departamento Ciencias de la Atmósfera y los Océanos, Facultad de Ciencias Exactas y Naturales, Universidad de Buenos Aires, (1428) Ciudad Universitaria, Pabellón II, 2do. piso. Ciudad Autónoma de Buenos Aires, Argentina. 3CONICET, Consejo Nacional de Investigaciones Científicas y Técnicas. Corresponding author: Walter César Dragani Depto. Oceanografía Servicio de Hidrografía Naval Av. Montes de Oca 2124 (C1270ABV) Ciudad Autónoma de Buenos Aires Argentina. e-mail: [email protected] TE: 54 11 4301 0061/67 int. 4050 Fax: 54 11 4301 0061/67 int. 4046
1
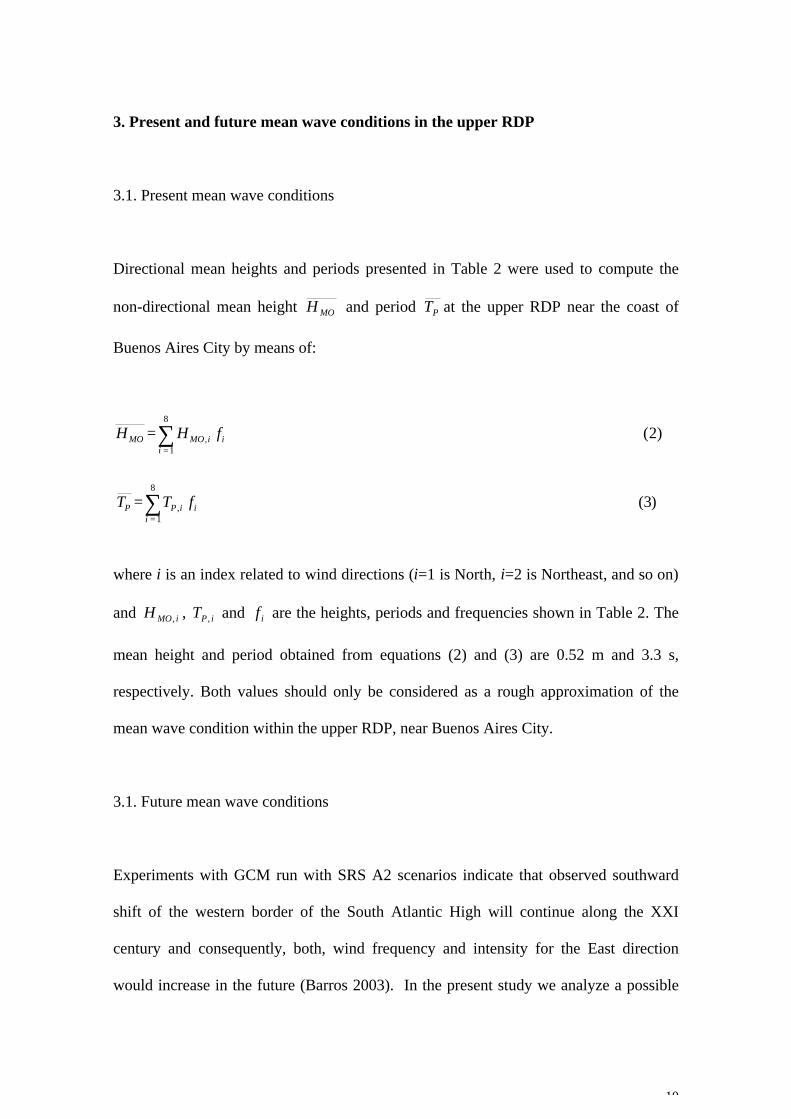
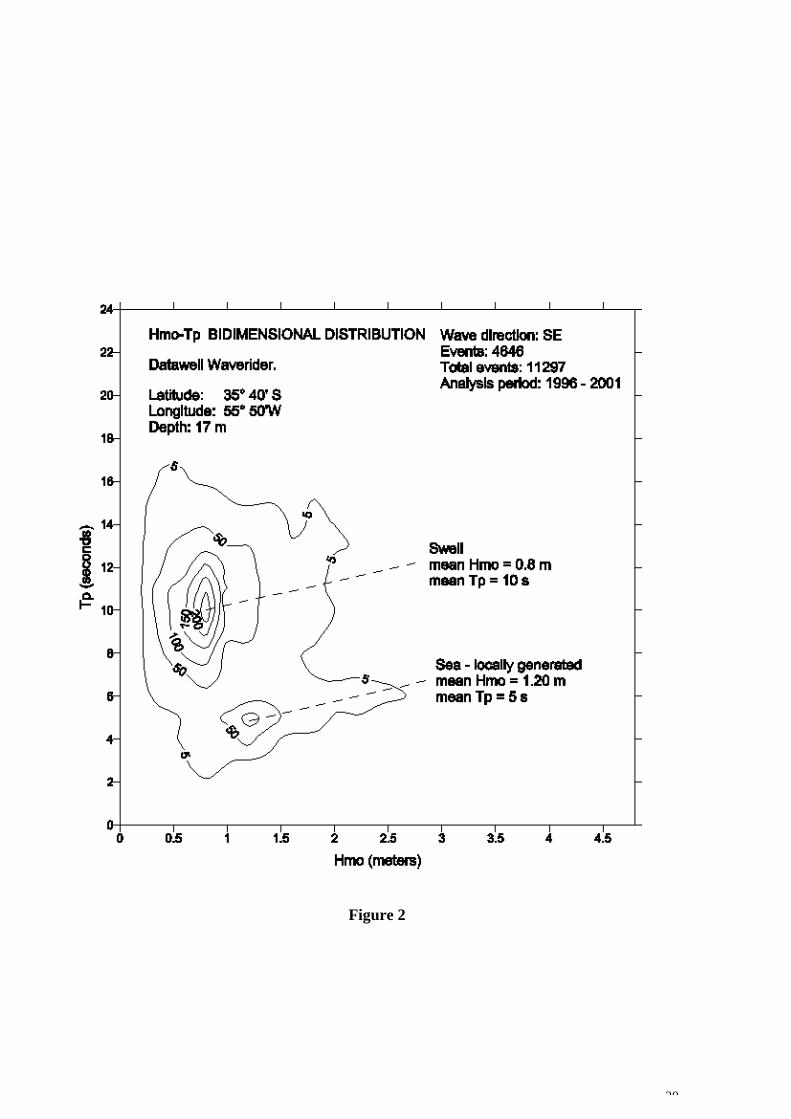
ABSTRACT The aim of the present work is to give a quantitative approximation of the changes in the
wave climate in the upper Río de la Plata (RDP) considering a possible future change in
local winds. First, sea and swell climate in the outer RDP were statistically analysed from
direct observations obtained at the outer RDP. Secondly, propagation and transformation
of sea and sewll, from the outer RDP throughout the intermediate and upper regions, were
computed and analysed. It was obtained that heights of waves propagating from the outer
to the upper RDP were attenuated 94.9% by refraction, shoaling and friction effects.
Consequently, it was shown that predominant wave climate in the upper RDP can only be
described considering wind waves locally generated (sea). Present wave climate
(directional wave heights and periods) was estimated by hindcasting methodology based
on ten-year statistics of winds measured at “Aeroparque Jorge Newery” meteorological
station. Then, a possible future scenario was sketched for which wind frequencies and
intensities for the East directions were 30% and 10% higher than the present values,
respectively. Our results show that mean East wave height and mean total wave height will
increase within the upper RDP. Present mean East wave heights (0.90 m) will increase by
0.12 m (13%) and their frequencies will increase by 30% (from 18.4 to 23.9%).
Consequently, the coast of Buenos Aires City will be more frequently exposed to wave
effects, therefore giving rise to intensified associated littoral processes. The mean period
for East waves will not change significantly (less than 4%, from 5.3 to 5.5 s). Results
obtained in this paper are a first approximation to the problem suggesting that wave
climate within the upper RDP is very sensitive to a slight change in the wind field.
2
1. INTRODUCTION
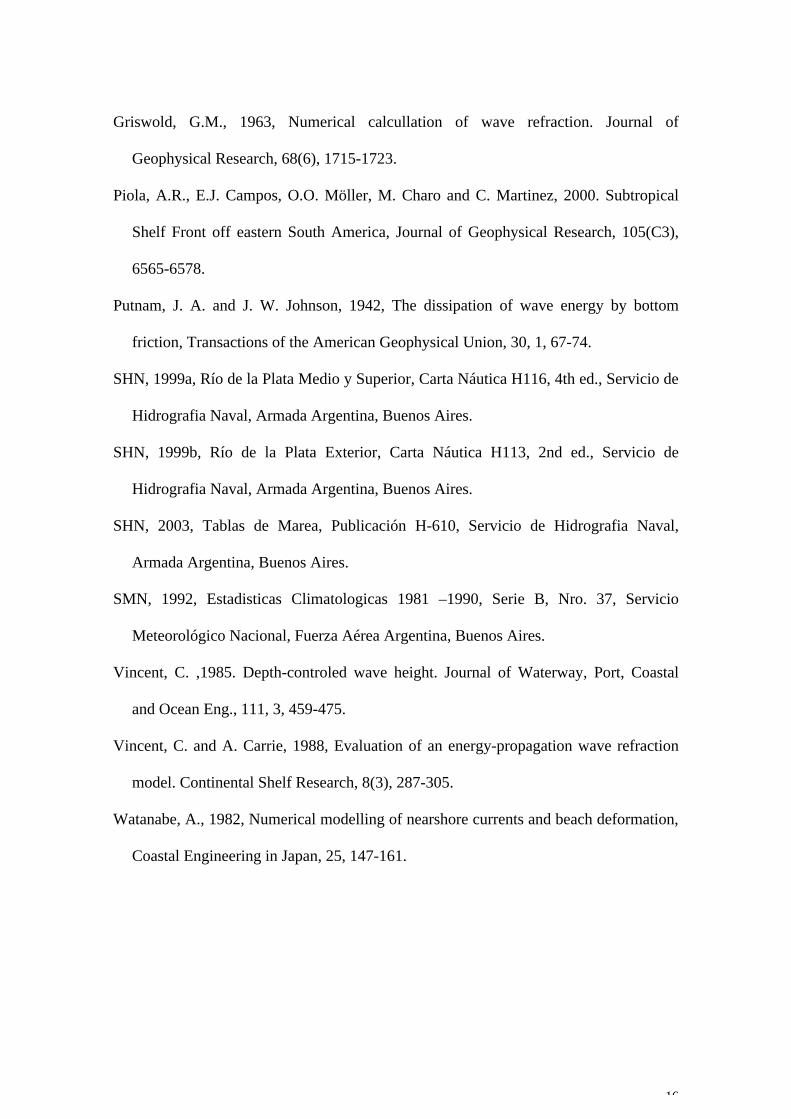
The Río de la Plata (RDP) is a shallow and extensive estuary located on the eastern coast
of South America at approximately 35º S (Figure 1). It has a NW—SE general orientation
and it is formed by the confluence of two of the most important rivers of South America:
the Paraná and Uruguay rivers. The estuary has a funnel shape approximately 300 Km long
that narrows from 220 Km at its mouth to 40 Km at its upper end. The RDP can be divided
into three regions: upper, with an averaged depth of less than 5 m; intermediate, 5-10 m
deep, occupied by several shallow sand banks, and an outer region with depths ranging
from 10 to 20m. The main characteristics of this estuary are its shallowness and its
increasing width (Balay, 1961). The RDP substantially contributes to the nutrient,
sediment, carbon and fresh water budgets of the South Atlantic Ocean (Framiñan et al.,
1999). It affects the hydrography of the adjacent continental shelf, impacts on important
coastal fisheries, and influences coastal dynamics up to more than 400 Km north on the
Brazilian shelf (Campos et al., 1999; Piola et al., 2000). The Río de la Plata has huge social
and economical importance for the countries on its shores, Argentina and Uruguay. The
most important cities and harbors, including both capitals (Buenos Aires and Montevideo
respectively) and many of the industrial centers and resorts of these countries are placed on
its margins. The estuary is also the most important source of fresh water for million of
inhabitants and it is an area of spawning and nursery for many coastal species (Cousseau,
1985; Boschi, 1988).
Water level fluctuations in the RDP are the sum of three main constituents: tides, storm
surges and wind waves. Tides in the RDP are mixed with both semi-diurnal and diurnal
constituents present. They have a maximum range of 1.08 m in the upper RDP, on the
3
coast of Buenos Aires and they are somewhat smaller to the north, along the Uruguayan
coast being minimum in Punta del Este (0.33 m) (SHN, 2003). D’Onofrio et al. (1999)
estimated return periods of extreme water levels for some vulnerable low-lying areas of
Buenos Aires. Their analysis combines the probability density functions of tides and
surges. They obtained for example that the last 89-yr. maximum (4.44 m) has a recurrence
of approximately 265 yr. Fiore, et al. (2001) carried out a statistical analysis of surges in
Buenos Aires based on hourly residuals for the period 1905-2000. They obtained positive
trends for positive and negative surges and explained them as a consequence of a mean sea
level rise rather than an increase in the intensity of the storm surges.
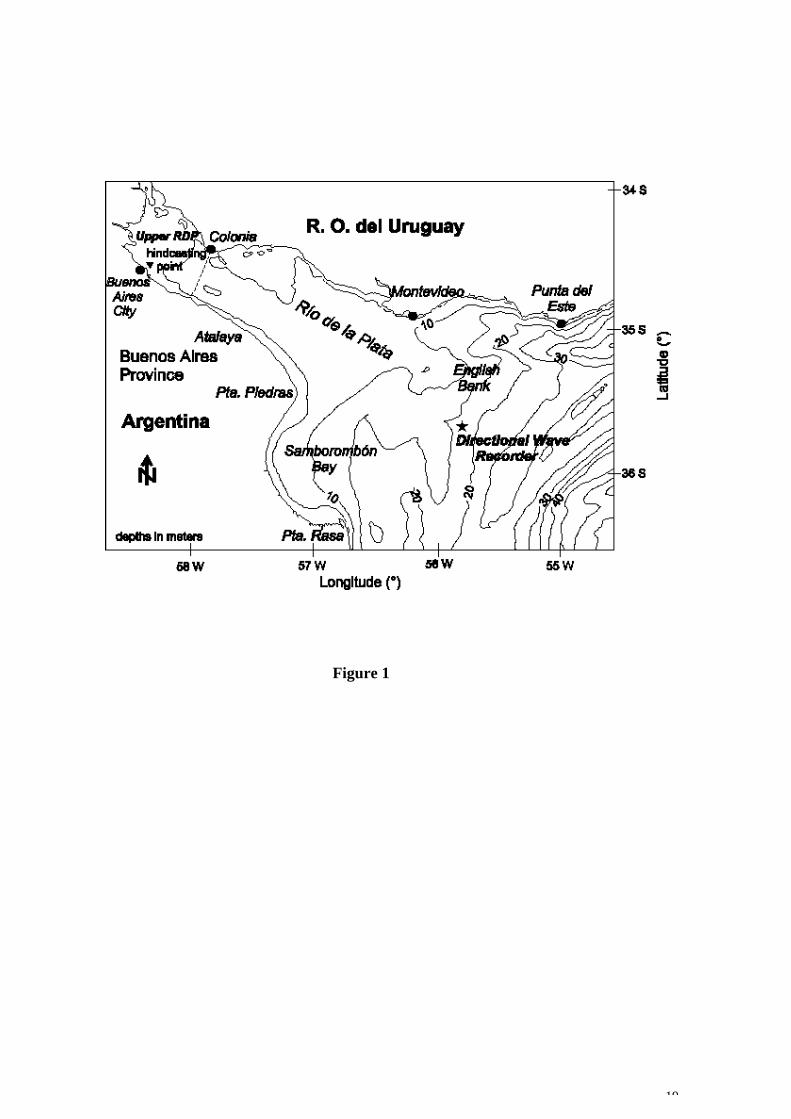
There are no direct measurements of waves in the RDP except for a single 5-year record of
wave data gathered in the outer RDP by means of a directional wave recorder Datawell
Waverider. Based on these data, Anschütz (2000) showed that wave climate in the outer
RDP is a combination of swell (wave generated far away, not related to local wind) and sea
(wave generated by local wind).
The analysis of the waverider data revealed predominant heights between 0.5 to 1.5 m.
When sea prevailed, periods were between 4 and 6 s, when swell prevailed they were
between 10 to 12 s. In the upper RDP, wind waves have never been neither measured nor
modelled, consequently, a realistic wind wave climate in this area is not available at the
present.
Escobar et al (2003) showed that the western border of the South Atlantic High is slowly
moving southward. They applied Principal Component’s methodology to a set of monthly
mean sea level pressure data from NCEP-NCAR reanalysis (1951/2000) in a domain
limited by 25° and 45° S and 67.5° and 45°W. For the last decades their results show a
slight trend in the western border of the South Atlantic semi-permanent high-pressure
4
system to move toward the south. This displacement has produced increased frequencies in
east winds over the RDP Estuary.
The aim of the present work is to give a quantitative approximation of the changes in the
wave climate in the upper RDP considering a possible future change in local winds. The
first step was to analyse if waves observed in the outer RDP, could propagate toward the
Northwest and reach the upper region. When waves did not reach this zone, wave climate
in the upper RDP could only be represented by sea. Our hypothesis is that in this case,
slight changes both in frequency and intensity of local winds, as the ones Escobar et al ’s
results suggest, should affect the wave climate within the upper RDP. This fact has not
been addressed up to the present. In this paper, present and future mean directional wave
heights are estimated and compared for the upper RDP. Finally, changes in mean height,
period and some energetic considerations are studied and possible impacts on littoral
processes and sediment transport are briefly discussed.
2. WAVE CLIMATE IN THE UPPER RDP
Under this section, the wave climate in the upper region of the RDP, estimated from
climatic wind data (Section 2.3), is presented. First, sea and swell climate in the outer
RDP are statistically analysed from direct observations (Section 2.1). Secondly, we
studied the propagation and transformation of sea and swell from the outer RDP
throughout the intermediate and upper regions (Section 2.2) in order to assess if outer
waves can reach the upper RDP.
5
2.1. Sea and swell climate in the outer RDP
A single series of 11,297 records, gathered from June 1996 to November 2001 was
obtained with a directional wave recorder Datawell Waverider in the outer RDP at
latitude 35° 40’ S and longitude 55° 50’ W (Figure 1). The instrument was programmed
to measure 20-minute sea level records, every 2 hours 40 minutes, with a 0.5 s sampling
interval. The wave parameters analyzed in this paper are the energy-based wave height
HMO (computed as four times the squared root of the 20-minute record total variance)
and the peak spectral period TP. Directional bi-dimensional distributions (HMO - Tp)
were made using the waverider data. Table 1 shows the number of occurrences for the
eight directions analysed. SE direction, followed by E and S are the main directions of
propagation with 41%, 28% and 14% of occurrences, respectively. Frequencies for the
rest of the directions are equal or lower than 5%. The bi-dimensional distribution for the
direction with largest number of occurrences, i. e. SE, is shown in Figure 2. Two areas
with very high number of events around periods of 10 s and heights of 0.8 m (swell)
and periods of 5 s and heights of 1.25 m (sea) can be clearly identified.
Considering the general orientation (NW-SE) of the RDP and its very shallow waters,
only those waves propagating from the Southeast could reach the upper RDP. Thus,
swell and sea propagating from the outer to the upper RDP would be the long and short
swell, respectively, within the intermediate and upper regions. Refraction, shoaling and
bottom friction transformations of long and short waves propagating throughout the
intermediate and upper RDP are considered in the next section.
6
2.2. Swell climate in the upper RDP
Wave propagation and transformation from the outer RDP towards the coast of Buenos
Aires were analyzed by means of a numerical model of wave transformation (Dragani
and Mazio, 1991). The wave number, a parameter which must satisfy the modified
dispersion relation at any point (Watanabe, 1982), was computed considering realistic
bathymetry and stationary but spatially variable current field corresponding to flood and
ebb conditions. Refraction, shoaling and friction effects along the wave ray were
computed based on a bathymetric grid of 1 Km spatial resolution obtained from the
nautical charts SHN (1999a) and SHN (1999b). In our model the refraction coefficient
was computed by means of the classical methodology given by Griswold (1963). The
shoaling coefficient was based on wave celerity at any point by applying the linear
wave-theory. Bottom friction removes energy from waves by interaction between
oscillatory wave-induced currents on the seabed, and the sediment and bed forms.
Friction effects always diminish the wave height along the ray. In order to obtain the
rate at which energy was removed from waves we adopted the formulation given by
Putnam and Johnson (1942). The friction coefficient adopted was 0.005 suggested by
CARP (1992) as the most adequate value for the RDP. Energy dissipation was
computed along the ray using an integral expression given by Vincent and Carrie
(1988).
We herein assumed that waves propagate as swell from the outer RDP towards the
upper RDP under non-locally generated wave conditions. Two different swell
conditions were analysed: short swell, associated to sea in the outer RDP (T < 6 sec)
and long swell, associated to swell in the outer RDP (T > 6 sec). Refraction diagrams
7
were built using initial heights of 1.25m in all cases, though similar conclusions can be
obtained using different heights within the observed range. Results show that shallow
water effects (especially refraction) are less evident over short swell, thus being the
most likely one to reach the intermediate and upper RDP. Outputs from our
transformation model corresponding to short swell coming from the Southeast are
shown in Figure 3. The figure depicts a refraction diagram for twenty rays directed
towards the NW from the outer RDP. An initial separation of 3 km was adopted
between rays.
Shallow waters and banks were identified as areas where wave braking (crossing rays:
caustics) occurred. Caustics seem to have an important role in wave propagation and
transformation towards the upper RDP thus producing the consequent wave attenuation.
Figure 3 also shows that rays strongly divert at the intermediate RDP producing two
areas of caustics: one located between Punta Piedras and Atalaya, (near the coast of
Buenos Aires) and another Southeast of Colonia (near the coast of Uruguay). In order to
analyse the wave transformation between the outer and upper regions, an additional ray
able to reach the upper RDP was computed (dashed line in Figure 3). The refraction
(KR), shoaling (KS) and friction (KF) coefficients computed for the end point of the ray,
within the upper RDP were 0.057, 1.034 and 0.859, respectively. The transformation
coefficient, computed as the product of the three aforementioned coefficients, was
0.051. Therefore, heights of waves propagating from the outer to the upper RDP were
attenuated 94.9% by refraction, shoaling and friction effects. Consequently,
predominant wave climate in the upper RDP can only be described considering wind
waves locally generated (sea).
8
2.3. Sea climate in the upper RDP
The Wave Hindcasting Method (CERC, 1984) and the improvements given by CERC,
(2002) were applied at a coastal point near Buenos Aires City (Figure 1). The
methodology was applied in shallow waters, off the surf zone, where local depth is of
approximately 2 m. Monthly wind statistics (SMN, 1992) were obtained from hourly
data gathered at “Aeroparque Jorge Newery” meteorological station, located on the
coast of Buenos Aires City (Figure 1). Based on these data we estimated mean wave
heights within the upper RDP. For the SE and NW directions (approximately parallel to
the coastline) wave parameters might have been slightly overestimated because narrow
fetch conditions were not considered. Directional mean winds used in the wave
hindcasting are presented in Table 2. Table 2 shows that the East direction presents the
highest frequency (18.4% of cases), N, NE, SE and S directions present similar
frequencies (ranging from 11.5 to 15.8%) and SW, W, NW directions and calms are the
least frequent ones, with values ranging from 6.5 to 7.8%. Directional mean wind
intensity (from 4.6 to 6.1 ms-1) is quite uniform for all directions.
Fetch-limited conditions have been considered herein given the nature of the
meteorological data available and considering the geographical characteristics of the
upper RDP. Under these conditions, the supposition is made that winds have been
blowing long enough for wave heights to reach equilibrium at the end of the fetch. The
parameters required for hindcasting are fetch and wind speed, the latter being
representative of the average value over the fetch. The wave parameters computed are
the energy-based wave height and the peak spectral period.
9
In shallow waters the deep-water methodology is applicable CERC (2002). Shallow-
water formulae are quite close to the ones of deep-water wave growth for the same wind
speeds, up to a point where an asymptotic depth-dependent wave height is attained. In
light of this evidence it is convenient to disregard bottom friction effects on wave
growth in shallow waters (CERC, 2002). Evidence from Bouws et al. (1985) also
indicates that wave spectra for shallow waters do not seem to have a noticeable
dependence on variations in bottom sediments. Consequently, it is recommended that
deep-water wave growth formulae be used for all depths, with the constraint that no
peak spectral period can grow past a limiting value TP,MAX as shown by Vincent (1985)
given by:
where h is the mean depth and g is the acceleration due to gravity.
Table 2 presents mean wind intensity, frequency, and fetch for the eight analysed
directions and the heights (HMO) and periods (TP) estimated by hindcasting. For each
analysed direction, the fetch was measured as the distance from the hindcasting point to
the coast (Figure 1), except for the case of the Southeast direction where a 150 Km-
fetch was adopted beginning at the imaginary line that joins Punta Piedras and
Montevideo. The largest heights and the longest periods resulted for the Southeast 1.22
m and 5.5 s and for the East 0.9 m and 5.3 s, respectively. The shortest heights and
periods resulted for the West with 0.12 m and 1.4 s, for the Southwest with 0.13 m and
1.4 s and for the South with 0.15 m and 1.4 s.
)1(78.9, gh
T MAXP =
10
3. Present and future mean wave conditions in the upper RDP
3.1. Present mean wave conditions
Directional mean heights and periods presented in Table 2 were used to compute the
non-directional mean height MOH and period PT at the upper RDP near the coast of
Buenos Aires City by means of:
where i is an index related to wind directions (i=1 is North, i=2 is Northeast, and so on)
and iMOH , , iPT , and if are the heights, periods and frequencies shown in Table 2. The
mean height and period obtained from equations (2) and (3) are 0.52 m and 3.3 s,
respectively. Both values should only be considered as a rough approximation of the
mean wave condition within the upper RDP, near Buenos Aires City.
3.1. Future mean wave conditions
Experiments with GCM run with SRS A2 scenarios indicate that observed southward
shift of the western border of the South Atlantic High will continue along the XXI
century and consequently, both, wind frequency and intensity for the East direction
would increase in the future (Barros 2003). In the present study we analyze a possible
)2(8
1,∑
=
=i
iiMOMO fHH
)3(8
1,∑
=
=i
iiPP fTT
11
scenario with an increase of 30% and 10% respectively in the east wind frequency and
intensity. Likewise, in this hypothetical scenario it is assumed a decrease of the same
magnitude would occur in frequency for the West direction. In order to assess the wave
climate sensitivity under a slight but probable wind climatic change the aforementioned
suggested values were adopted and a hypothetical future scenario was sketched.
Considering these changes, future East wind frequencies and mean intensity for the East
direction would increase by 5.5% and 0.49 ms-1, becoming 23.9% and 5.4 ms-1,
respectively. The total decrease in frequencies for the West directions (NW, W and SW)
would be 5.5%, compensating the predicted increase in the East directions. Mean height
and period for the East direction resulted 1.02 m and 5.5 s, computed by the
methodology explained in Section 2.3 based on the suggested future intensity.
Replacing the estimated future figures for the East direction in equations (2) and (3), the
future mean wave condition would be described by a mean height of 0.59 m and a mean
period of 3.6 s.
4. Summary and Discussion
It was shown in section 2.2 that both short and long swell coming from the outer RDP
are strongly attenuated by refraction and bottom friction within the intermediate RDP
and hence the predominant wave climate in the upper RDP can only be described
Table 2. Directional mean wind and probability of occurrence obtained from data gathered at “Aeroparque Jorge Newery” Meteorological Station located on the coast of Buenos Aires City. Also included are directional fetch, heights and periods obtained by
hindcasting.
19
Figure 1
20
Figure 2
21
Figure 3
22
23
24
UBATEC S.A. 1991-2003
La empresa de prestación de servicios y transferencia de tecnología de la Universidad de Buenos Aires, el Gobierno de la Ciudad de Buenos Aires, la Unión Industrial Argentina y la Confederación General de la Industria.
Arenales 1371 2° piso – C1061AAM Ciudad de Buenos Aires, Argentina – Teléfonos: 4815-6473/4938/6667
JULY 14 TH, 2003 TO WHOM IT CONCERNS: UBATEC INFORMS THAT SINCE JUNE 5TH THE PRESIDENT OF UBATEC IS DR. JORGE H. MEDINA. DR. LAURA BOVERIS LEGAL DEPARTMENT