Water Management Advisory Committee June 17, 2021 Michael Thompson, P.E. DRBC Water Resource Planning Section Water Resource Engineer Projections of self-supplied industrial sector water withdrawals in the Delaware River Basin 1 Presented to an advisory committee of the DRBC on June 17, 2021. Contents should not be published or re-posted in whole or in part without permission of the DRBC.
Transcript
Water Management Advisory Committee
June 17, 2021
Michael Thompson, P.E.DRBC Water Resource Planning SectionWater Resource Engineer
Projections of self-supplied industrial sector water withdrawals in the Delaware River Basin
1
Presented to an advisory committee of the DRBC on June 17, 2021. Contents should not be published or re-posted in whole or in part without permission of the DRBC.
Outline
2Plan of the operations of General Washington against the King's troops in New Jersey, from the 26th of
December to the 3d of January 1777. [1777] Map. https://www.loc.gov/item/gm71000654/.
1. Projection methodology recap1
2. Industrial sector water withdrawals & projection3. Industrial sector consumptive use & projection4. Next Steps
1 “Projections of the Public Water Supply Sector in the Delaware River Basin” WMAC Presentation (10/21/2020) https://www.state.nj.us/drbc/library/documents/WMAC/102120/thompson_DRB_PWSprojections.pdf
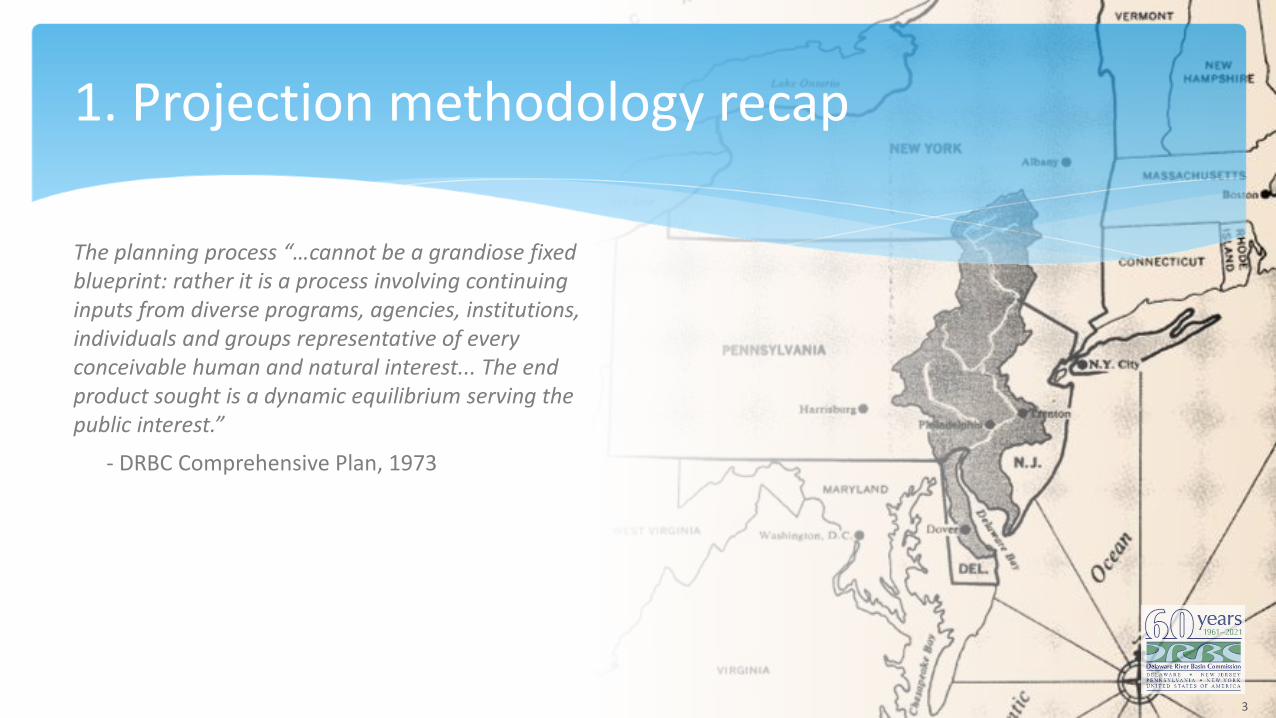
The planning process “…cannot be a grandiose fixed blueprint: rather it is a process involving continuing inputs from diverse programs, agencies, institutions, individuals and groups representative of every conceivable human and natural interest... The end product sought is a dynamic equilibrium serving the public interest.”
- DRBC Comprehensive Plan, 1973
Represent each water withdrawal sectorat the Basin-wide scale.
1. Recap: What are the planning objectives?
Provide projections of future average
annual water withdrawals in the Delaware
River Basin, through the year 2060, to be used in future planning assessments.
Apply SW results at the sourcelevel for future availability analyses.
Apply GW results to the 147 sub-watersheds (Sloto & Buxton, 2006) and the 76 sub-watersheds of SEPA-GWPA.
• Linear ordinary least-squares (OLS)• Linear and non-linear transformations
(i.e. LOG and EXP regressions)• Mean value (zero-slope linear)• Top-down equations• Structural break / offset equations
QAQC of data
• Outlier – removal of individual point• Start date – alter start of projection• Algorithm checks annual completeness • Verifying sources (in basin, duplicate…)• Best professional judgement (BPJ) to
check for capture of trends, metadata, outliers missed in algorithm
Prediction interval
ො𝑦 ± 𝑡𝛼,𝑣 ∗ ො𝜎𝑒 1 +1
𝑛+
𝑥 − ҧ𝑥 2
(𝑛 − 1)𝑠𝑥2
“Metadata”
2. Industrial sector water withdrawals & projection
7
“Today's 50-year projections are not the ones which will be used 10 to 40 years hence. The planning process is continuously building on the best information obtainable.”
- DRBC Comprehensive Plan, 1973
Photograph of Bethlehem Steel plant in Bethlehem, PAhttps://www.steelstacks.org/about/what-is-steelstacks/
RemediationGenerally, very small quantities but often related to current/former industrial facilities• Groundwater pump and treat• Controlling plume migrations• Extraction & re-injection
9
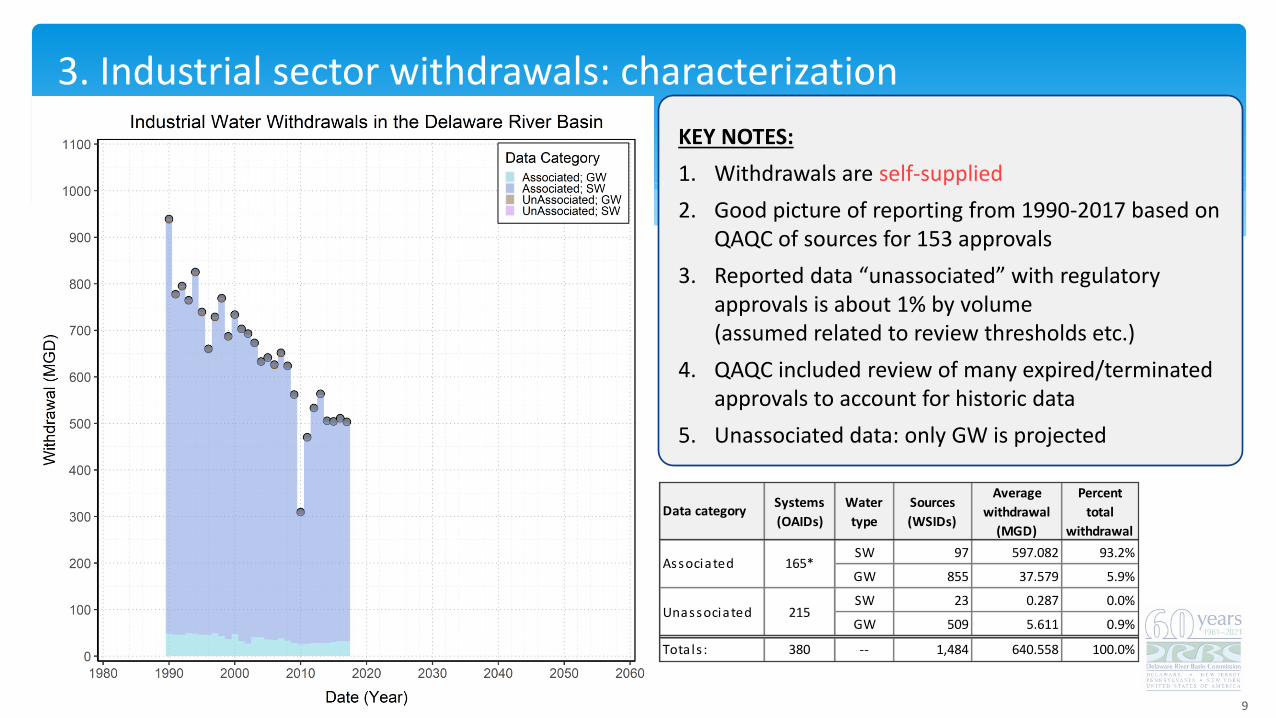
Systems
(OAIDs)
Water
type
Sources
(WSIDs)
Average
withdrawal
(MGD)
Percent
total
withdrawal
SW 97 597.082 93.2%
GW 855 37.579 5.9%
SW 23 0.287 0.0%
GW 509 5.611 0.9%
Tota ls : 380 -- 1,484 640.558 100.0%
Data category
Associated 165*
Unassociated 215
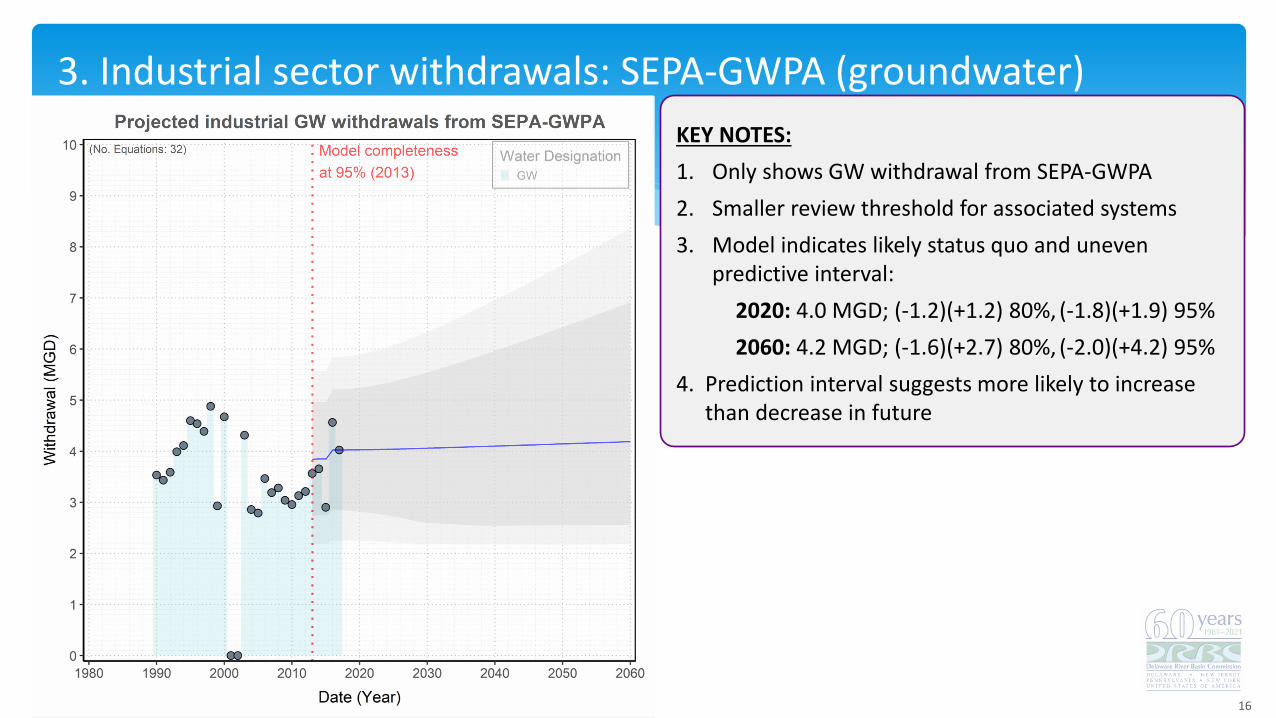
KEY NOTES:
1. Withdrawals are self-supplied
2. Good picture of reporting from 1990-2017 based on QAQC of sources for 153 approvals
3. Reported data “unassociated” with regulatory approvals is about 1% by volume(assumed related to review thresholds etc.)
4. QAQC included review of many expired/terminated approvals to account for historic data
Three primary categories of withdrawal based on facility:
• Refinery: Withdrawals of water by facilities which are involved with the refining of petroleum products.
• Industrial: Includes withdrawals for industrial processes such as fabrication, processing, washing, canning and cooling.
• Remediation: An example is remediation of groundwater contamination which includes pump and treat or gradient control. Often associated with active or former industry.
The data does not include:• Non-self-supplied industrial facilities (covered under PWS)
• Mining withdrawals (covered under mining sector)
• Commercial withdrawals (covered under “other” sector)
• Thermoelectric withdrawals* (covered under power gen.)
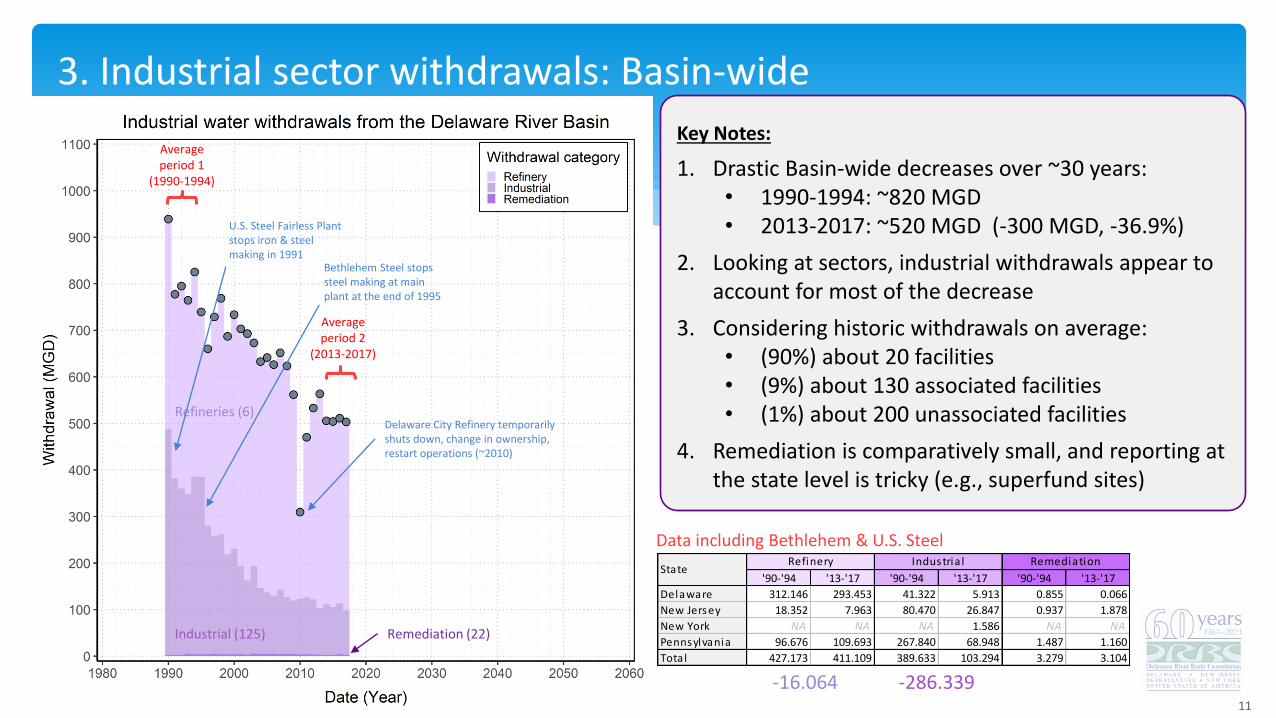
1. Remove the two largest permanent facility shutdowns in the time-series
2. Adjust the first averaging period to 1996-2000
3. Refinery withdrawals decrease a little more, ~50 MGD
4. Industrial withdrawals decrease less, ~115 MGDAverage period 2
(2013-2017)
What this analysis is not doing:Not attempting to correlate withdrawal volumes with economics of the region. Economic value of DRB is complex (e.g., Kauffman, 2011)
3. Model does not account for future structural changes (i.e., facility shutdown like Bethlehem Steel)
PaperWorks Mill in Manayunk, PAhttps://www.inquirer.com/philly/business/real_estate/residential/after-historic-paper-mill-shuts-down-could-there-be-new-life-for-manayunks-venice-island-20170530.html
14
3. Industrial sector withdrawals: States
KEY NOTES:
1. Large facilities can have substantial effects:• (PA-1991) US Steel stops steel prod.• (PA-1995) Bethlehem Steel stops steel prod.• (DE-2010) Refinery temporary shutdown,
change ownership, restart
2. Other self-supplied industries:• (-75 MGD) 4 chemical/manufacturing facilities• (-8 MGD) 9 retirements of paper facilities
*MGDs are difference between 1990-1994 and 2013-2017 averages
15
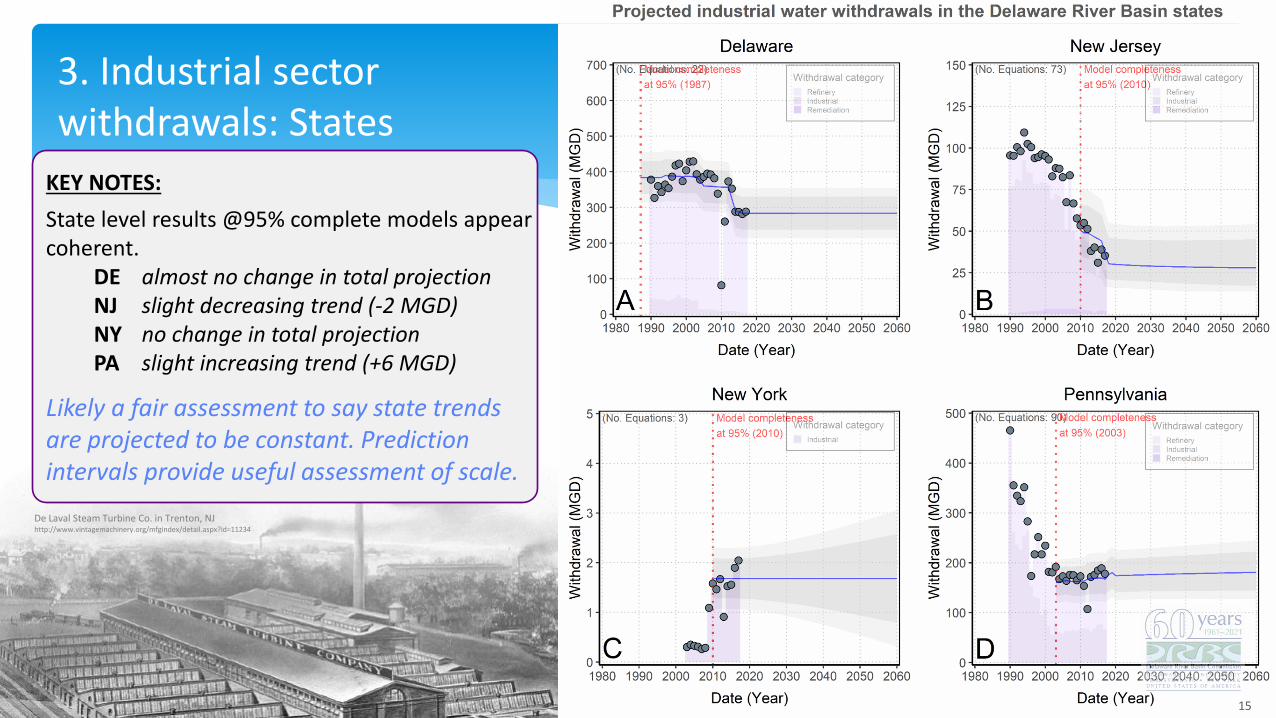
3. Industrial sector withdrawals: States
KEY NOTES:
State level results @95% complete models appear coherent.
DE almost no change in total projectionNJ slight decreasing trend (-2 MGD)NY no change in total projectionPA slight increasing trend (+6 MGD)
Likely a fair assessment to say state trends are projected to be constant. Prediction intervals provide useful assessment of scale.
De Laval Steam Turbine Co. in Trenton, NJhttp://www.vintagemachinery.org/mfgindex/detail.aspx?id=11234
1. Notable drop around 2019 is the closure of Philadelphia Energy Solutions (PES). Beyond general scope of study, known major withdrawer in the Basin (10-15 MGD) and operated about 40% consumptive
2. Very similar results to the total withdrawal, with predictive interval suggesting more likely to increase than decrease in future
Van Reed Paper Mill c. 1875, recently owned by Federal Paperboard (Reading Paperboard)Cacoosing Creek diversion, Leesport, PA
23
4. Next steps in withdrawal projections
• Public water supply• Power generation sector analysis• Industrial & Refinery sector analysis• Discussions with docket holders• Self-supplied domestic• Mining sector• Irrigation sector• Other sectors analysis• Unassociated data projections• Final report