International Journal of Child, Youth and Family Studies (2011) 1 & 2: 119-141 119 PROMOTIVE FACTORS DURING ADOLESCENCE: ARE THERE CHANGES IN IMPACT AND PREVALENCE DURING ADOLESCENCE AND HOW DOES THIS RELATE TO RISK FACTORS? Claudia Van der Put, Peter Van der Laan, Geert-Jan Stams, Maja Deković, and Machteld Hoeve Abstract: In this study we compared the impact of promotive and risk factors on 18- month recidivism during adolescence. We measured bipolar factors (factors with risk and promotive effects being the ends of the same continuum) for 13,613 American juveniles who had committed a criminal offense. For most of the factors no significant differences were found between the impact of the promotive and risk ends. Interventions aimed at increasing promotive factors may therefore be potentially just as effective as interventions aimed at decreasing risks. The importance of both promotive and risk factors was found to be significantly higher for younger than for older adolescents in almost every domain, which emphasizes the importance of early intervention. Furthermore, age and sex differences were found in the impact and prevalence of promotive and risk factors. The discussion focuses on implications for clinical practice. Key Words: promotive factors, protective factors, dynamic risk factors, recidivism, early intervention, juvenile delinquency Claudia Van der Put, MSc is a Ph.D. student, Forensic Child and Youth Care Sciences, Research Institute Child Development and Education, University of Amsterdam, The Netherlands. Peter Van der Laan, Ph. D. is Full Professor, Faculty of Law, Free University of Amsterdam, The Netherlands. Geert-Jan Stams, Ph.D. is Full Professor, Forensic Child and Youth Care Sciences, Research Institute Child Development and Education, University of Amsterdam, The Netherlands. Maja Deković, Ph.D. is Full Professor, Department of Child and Adolescent Studies, Utrecht University, Utrecht, The Netherlands. Machteld Hoeve, Ph.D. is Assistant Professor, Forensic Child and Youth Care Sciences, Research Institute Child Development and Education, University of Amsterdam, The Netherlands.
Transcript
International Journal of Child, Youth and Family Studies (2011) 1 & 2: 119-141
119
PROMOTIVE FACTORS DURING ADOLESCENCE: ARE THERE CHANGES IN IMPACT AND PREVALENCE DURING
ADOLESCENCE AND HOW DOES THIS RELATE TO RISK FACTORS?
Claudia Van der Put, Peter Van der Laan, Geert-Jan Stams, Maja Deković, and Machteld Hoeve
Abstract: In this study we compared the impact of promotive and risk factors on 18-month recidivism during adolescence. We measured bipolar factors (factors with risk and promotive effects being the ends of the same continuum) for 13,613 American juveniles who had committed a criminal offense. For most of the factors no significant differences were found between the impact of the promotive and risk ends. Interventions aimed at increasing promotive factors may therefore be potentially just as effective as interventions aimed at decreasing risks. The importance of both promotive and risk factors was found to be significantly higher for younger than for older adolescents in almost every domain, which emphasizes the importance of early intervention. Furthermore, age and sex differences were found in the impact and prevalence of promotive and risk factors. The discussion focuses on implications for clinical practice. Key Words: promotive factors, protective factors, dynamic risk factors, recidivism,
early intervention, juvenile delinquency
Claudia Van der Put, MSc is a Ph.D. student, Forensic Child and Youth Care Sciences, Research Institute Child Development and Education, University of Amsterdam, The Netherlands.
Peter Van der Laan, Ph. D. is Full Professor, Faculty of Law, Free University of Amsterdam, The Netherlands. Geert-Jan Stams, Ph.D. is Full Professor, Forensic Child and Youth Care Sciences, Research Institute Child Development and Education, University of Amsterdam, The Netherlands. Maja Deković, Ph.D. is Full Professor, Department of Child and Adolescent Studies, Utrecht University, Utrecht, The Netherlands.
Machteld Hoeve, Ph.D. is Assistant Professor, Forensic Child and Youth Care Sciences, Research Institute Child Development and Education, University of Amsterdam, The Netherlands.
International Journal of Child, Youth and Family Studies (2011) 1 & 2: 119-141
120
It is generally recognised that delinquent behavior can be seen as the result of complex interactions between risk factors and protective factors (Deković & Prinzie, 2008; Prinzie, Hoeve, & Stams, 2008). Risk factors are those factors that increase the chances of delinquent behavior, while protective factors are associated with a smaller probability of delinquent behavior. Risk and protective factors comprise on the one hand, personal characteristics of the individual juvenile, and on the other hand, factors in the social environment, including the “family”, “peers”, “school” and “community” domain (Howell, 2003; Loeber, DeLamatre, Keenan, & Zhang, 1998; Stouthamer-Loeber, Loeber, Wei, Farrington, & Wikström, 2002; Loeber, Slot, & Stouthamer-Loeber, 2008). These risk and protective factors have been conceptualized as static or dynamic. Static factors are historic and cannot be changed, such as age at first offense, temperament, and IQ. Dynamic risk factors can potentially be changed, such as the youth’s friends or school performance. Investigating the impact of dynamic risk and protective factors is considered important not only for the development of evidence-based interventions, but also for the purpose of adequate risk assessment of recidivism and successful referral to behavioral interventions targeting desistance from crime (see Andrews & Bonta, 2010).
Whereas a large body of research exists regarding risk factors (e.g., Farrington, 2003; Lipsey & Derzon 1998; Loeber, Slot et al., 2008), far less is known about protective factors. When studying risk factors, researchers have often dichotomized variables and added the neutral middle part of the distribution to the protective side, thereby masking information about the protective effect (Stouthamer-Loeber et al., 1993). Stouthamer-Loeber and colleagues (1993, 2002, 2004) advanced the investigation of promotive factors first as main effects, similar to the search for the main effects of risk factors, and then they investigated the interaction effects between promotive and risk factors. Still we know much more about risk factors than protective factors (Loeber, Slot et al., 2008). Besides this, there is much discussion in the literature on the definition of protective factors (Deković, 1999). This discussion focuses primarily on the question of whether factors are unipolar or bipolar, that is, whether risk factors and protective factors really are two different groups of factors or the same factors, with a risk effect at one extreme and a protective effect at the other. An example of bipolar conceptualization is the factor “school achievement”, for which “poor grades” is considered a risk factor and “good grades” a protective factor. However, there may be a difference in the strength of the risk effect and the strength of the protective effect: “Poor grades” might be a relatively strong predictor of recidivism, whereas “good grades” might offer only small protection against recidivism (Stouthamer-Loeber et al., 1993). In the second place, there is a debate regarding the effect of protective factors. Some researchers define protective factors as factors that moderate the effects of risks on delinquency (Fergusson & Lynskey, 1996; Pollard, Hawkins, & Arthur, 1999; Rutter 1987, 2003). According to this definition, the presence of the risks is required. Protective factors only have an indirect effect on problem behavior by attenuating the effect of the risks. Other researchers assume that there are direct effects on problem behavior and use the term promotive factors to express this. So promotive factors are considered as factors that have a direct effect on reducing problem behavior, even where there are no risks present (Farrington, Loeber, Jolliffe, & Pardini, 2008; Loeber, Slot et al., 2008; Sameroff, Bartko, A. Baldwin, C. Baldwin, & Seifer, 1998; Stouthamer-Loeber et al., 2002).
Loeber, Slot, and Stouthamer-Loeber (2008) provide an overview of the promotive factors mentioned in the research literature. Examples of this include: good social skills, good academic achievement, high school motivation, mentoring by adults, consistent discipline,
International Journal of Child, Youth and Family Studies (2011) 1 & 2: 119-141
121
and a high family income. For risk factors it is the accumulation of risks in several domains that leads to problem behavior (Deković & Prinzie, 2008; Loeber, Slot et al., 2008; Stouthamer-Loeber et al., 2002). It seems that, similarly, an accumulation of protective factors in several domains reduces the likelihood of problem behavior (e.g., Deković, 1999; Farrington et al., 2008; Sameroff et al., 1998).
Thus, it appears that delinquent behavior can best be tackled by focusing on reducing
the number of risk factors as well as increasing and/or strengthening protective factors in several domains (Van der Laan, Veenstra, Bogaerts, Verhulst, & Ormel, 2010; Veenstra, Lindenberg, Verhulst, & Ormel, 2009). In order to be able to do this effectively, it is important to know which dynamic protective factors are most strongly linked to delinquent behavior and recidivism. This is because the effect of an intervention to prevent recidivism is greatest when it is aimed at those dynamic risk factors and protective factors that are linked to recidivism (Andrews, Bonta, & Wormith, 2006; Bonta, 2002; Farmer, Compton, Burns, & Robertson, 2002; Lipsey & Derzon, 1998). The stronger the link to recidivism, the greater the potential effect of an intervention aimed at these factors. Because of the paucity of knowledge available on this subject, the goal of the present study was to investigate the impact of dynamic protective factors from various domains on recidivism and to compare the impact of dynamic protective factors to the impact of dynamic risk factors.
Because recent studies only found support for promotive factors and not for protective
factors (Deković, 1999; Farrington et al., 2008; Van der Laan et al., 2010), this article investigated only the direct effects of promotive factors. Various studies also show that by far the majority of factors have both promotive and risk effects (Farrington et al., 2008; Stouthamer-Loeber et al., 1993). For this reason this study concentrated solely upon bipolar variables.
Previous research on risk factors of recidivism showed that the impact of these factors
is dependent on juveniles’ age (Van der Put et al., 2010b; Van der Put et al., in press). These studies demonstrated that the importance of almost all dynamic risk factors decreases with age. For this reason, the current study investigated the (relative) importance of dynamic promotive factors from various domains at various ages during adolescence. We also compared the impact of the promotive aspect to the impact of the risk aspect of the measured factors. This knowledge is important when considering whether to focus an intervention on reducing risks or on strengthening promotive factors. As previous research on risk factors of recidivism also showed that the impact of these factors is dependent on a juvenile’s sex (Funk, 1999; Schwalbe, Fraser, Day, & Cooley, 2006; Van der Put et al., 2010a), we also examined sex differences. To summarise, this study focused on the following research questions:
1. What is the prevalence of promotive and risk factors? 2. What is the impact of promotive and risk factors on recidivism? 3. Are there age differences and sex differences in the prevalence of promotive and
risk factors? 4. Are there age differences and sex differences in the impact of promotive and risk
factors? 5. Which factors are the best unique predictors for recidivism at different ages and
for male and female juvenile offenders? 6. Do the promotive factors uniquely contribute to the prediction of recidivism?
International Journal of Child, Youth and Family Studies (2011) 1 & 2: 119-141
122
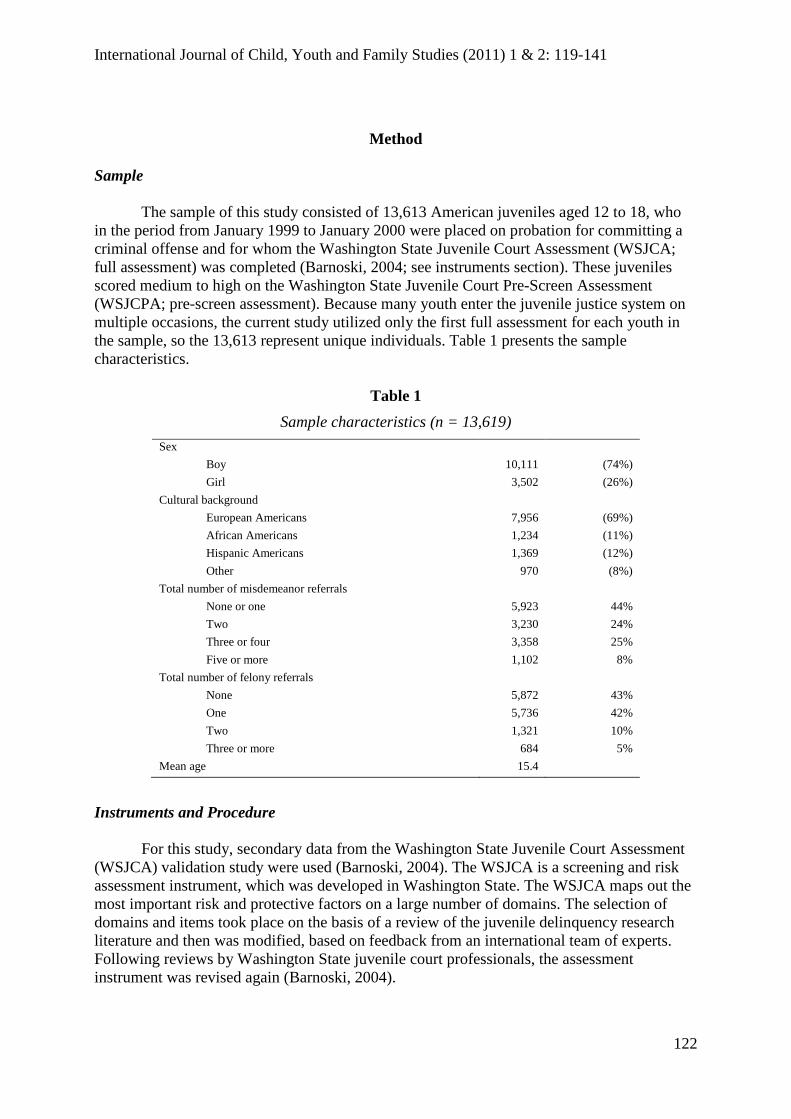
Method Sample The sample of this study consisted of 13,613 American juveniles aged 12 to 18, who in the period from January 1999 to January 2000 were placed on probation for committing a criminal offense and for whom the Washington State Juvenile Court Assessment (WSJCA; full assessment) was completed (Barnoski, 2004; see instruments section). These juveniles scored medium to high on the Washington State Juvenile Court Pre-Screen Assessment (WSJCPA; pre-screen assessment). Because many youth enter the juvenile justice system on multiple occasions, the current study utilized only the first full assessment for each youth in the sample, so the 13,613 represent unique individuals. Table 1 presents the sample characteristics.
Table 1 Sample characteristics (n = 13,619)
Sex Boy 10,111 (74%) Girl 3,502 (26%)
Cultural background European Americans 7,956 (69%) African Americans 1,234 (11%) Hispanic Americans 1,369 (12%) Other 970 (8%)
Total number of misdemeanor referrals None or one 5,923 44% Two 3,230 24% Three or four 3,358 25% Five or more 1,102 8%
Total number of felony referrals None 5,872 43% One 5,736 42% Two 1,321 10% Three or more 684 5%
Mean age 15.4
Instruments and Procedure
For this study, secondary data from the Washington State Juvenile Court Assessment (WSJCA) validation study were used (Barnoski, 2004). The WSJCA is a screening and risk assessment instrument, which was developed in Washington State. The WSJCA maps out the most important risk and protective factors on a large number of domains. The selection of domains and items took place on the basis of a review of the juvenile delinquency research literature and then was modified, based on feedback from an international team of experts. Following reviews by Washington State juvenile court professionals, the assessment instrument was revised again (Barnoski, 2004).
International Journal of Child, Youth and Family Studies (2011) 1 & 2: 119-141
123
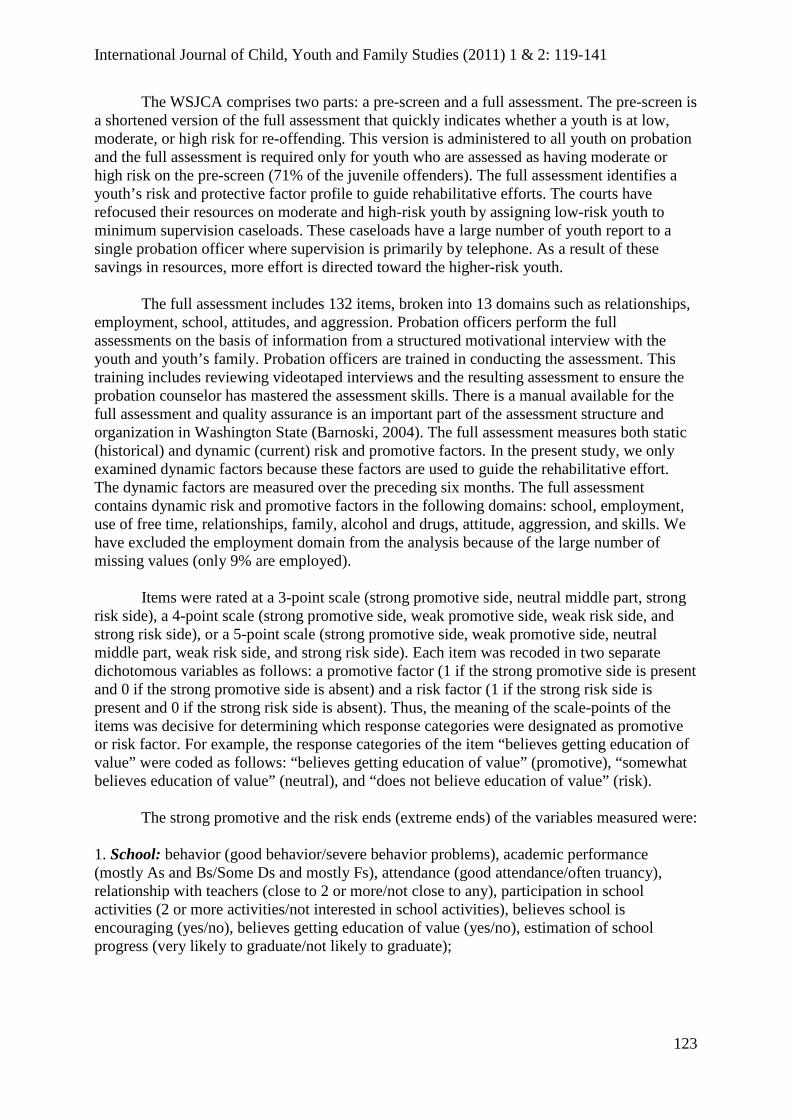
The WSJCA comprises two parts: a pre-screen and a full assessment. The pre-screen is a shortened version of the full assessment that quickly indicates whether a youth is at low, moderate, or high risk for re-offending. This version is administered to all youth on probation and the full assessment is required only for youth who are assessed as having moderate or high risk on the pre-screen (71% of the juvenile offenders). The full assessment identifies a youth’s risk and protective factor profile to guide rehabilitative efforts. The courts have refocused their resources on moderate and high-risk youth by assigning low-risk youth to minimum supervision caseloads. These caseloads have a large number of youth report to a single probation officer where supervision is primarily by telephone. As a result of these savings in resources, more effort is directed toward the higher-risk youth.
The full assessment includes 132 items, broken into 13 domains such as relationships, employment, school, attitudes, and aggression. Probation officers perform the full assessments on the basis of information from a structured motivational interview with the youth and youth’s family. Probation officers are trained in conducting the assessment. This training includes reviewing videotaped interviews and the resulting assessment to ensure the probation counselor has mastered the assessment skills. There is a manual available for the full assessment and quality assurance is an important part of the assessment structure and organization in Washington State (Barnoski, 2004). The full assessment measures both static (historical) and dynamic (current) risk and promotive factors. In the present study, we only examined dynamic factors because these factors are used to guide the rehabilitative effort. The dynamic factors are measured over the preceding six months. The full assessment contains dynamic risk and promotive factors in the following domains: school, employment, use of free time, relationships, family, alcohol and drugs, attitude, aggression, and skills. We have excluded the employment domain from the analysis because of the large number of missing values (only 9% are employed).
Items were rated at a 3-point scale (strong promotive side, neutral middle part, strong
risk side), a 4-point scale (strong promotive side, weak promotive side, weak risk side, and strong risk side), or a 5-point scale (strong promotive side, weak promotive side, neutral middle part, weak risk side, and strong risk side). Each item was recoded in two separate dichotomous variables as follows: a promotive factor (1 if the strong promotive side is present and 0 if the strong promotive side is absent) and a risk factor (1 if the strong risk side is present and 0 if the strong risk side is absent). Thus, the meaning of the scale-points of the items was decisive for determining which response categories were designated as promotive or risk factor. For example, the response categories of the item “believes getting education of value” were coded as follows: “believes getting education of value” (promotive), “somewhat believes education of value” (neutral), and “does not believe education of value” (risk). The strong promotive and the risk ends (extreme ends) of the variables measured were: 1. School: behavior (good behavior/severe behavior problems), academic performance (mostly As and Bs/Some Ds and mostly Fs), attendance (good attendance/often truancy), relationship with teachers (close to 2 or more/not close to any), participation in school activities (2 or more activities/not interested in school activities), believes school is encouraging (yes/no), believes getting education of value (yes/no), estimation of school progress (very likely to graduate/not likely to graduate);
International Journal of Child, Youth and Family Studies (2011) 1 & 2: 119-141
124
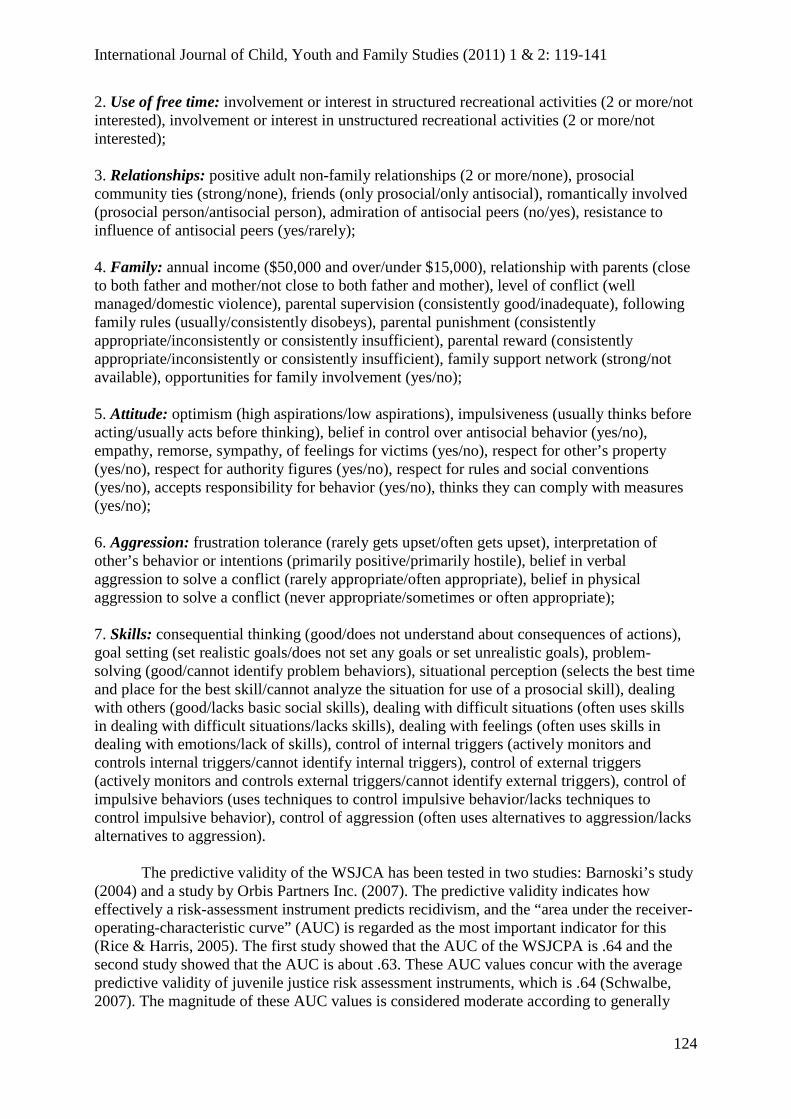
2. Use of free time: involvement or interest in structured recreational activities (2 or more/not interested), involvement or interest in unstructured recreational activities (2 or more/not interested); 3. Relationships: positive adult non-family relationships (2 or more/none), prosocial community ties (strong/none), friends (only prosocial/only antisocial), romantically involved (prosocial person/antisocial person), admiration of antisocial peers (no/yes), resistance to influence of antisocial peers (yes/rarely); 4. Family: annual income ($50,000 and over/under $15,000), relationship with parents (close to both father and mother/not close to both father and mother), level of conflict (well managed/domestic violence), parental supervision (consistently good/inadequate), following family rules (usually/consistently disobeys), parental punishment (consistently appropriate/inconsistently or consistently insufficient), parental reward (consistently appropriate/inconsistently or consistently insufficient), family support network (strong/not available), opportunities for family involvement (yes/no); 5. Attitude: optimism (high aspirations/low aspirations), impulsiveness (usually thinks before acting/usually acts before thinking), belief in control over antisocial behavior (yes/no), empathy, remorse, sympathy, of feelings for victims (yes/no), respect for other’s property (yes/no), respect for authority figures (yes/no), respect for rules and social conventions (yes/no), accepts responsibility for behavior (yes/no), thinks they can comply with measures (yes/no); 6. Aggression: frustration tolerance (rarely gets upset/often gets upset), interpretation of other’s behavior or intentions (primarily positive/primarily hostile), belief in verbal aggression to solve a conflict (rarely appropriate/often appropriate), belief in physical aggression to solve a conflict (never appropriate/sometimes or often appropriate); 7. Skills: consequential thinking (good/does not understand about consequences of actions), goal setting (set realistic goals/does not set any goals or set unrealistic goals), problem-solving (good/cannot identify problem behaviors), situational perception (selects the best time and place for the best skill/cannot analyze the situation for use of a prosocial skill), dealing with others (good/lacks basic social skills), dealing with difficult situations (often uses skills in dealing with difficult situations/lacks skills), dealing with feelings (often uses skills in dealing with emotions/lack of skills), control of internal triggers (actively monitors and controls internal triggers/cannot identify internal triggers), control of external triggers (actively monitors and controls external triggers/cannot identify external triggers), control of impulsive behaviors (uses techniques to control impulsive behavior/lacks techniques to control impulsive behavior), control of aggression (often uses alternatives to aggression/lacks alternatives to aggression).
The predictive validity of the WSJCA has been tested in two studies: Barnoski’s study (2004) and a study by Orbis Partners Inc. (2007). The predictive validity indicates how effectively a risk-assessment instrument predicts recidivism, and the “area under the receiver-operating-characteristic curve” (AUC) is regarded as the most important indicator for this (Rice & Harris, 2005). The first study showed that the AUC of the WSJCPA is .64 and the second study showed that the AUC is about .63. These AUC values concur with the average predictive validity of juvenile justice risk assessment instruments, which is .64 (Schwalbe, 2007). The magnitude of these AUC values is considered moderate according to generally
International Journal of Child, Youth and Family Studies (2011) 1 & 2: 119-141
125
accepted criteria, whereas AUC values of .70 and higher are considered “acceptable” (Dolan & Doyle, 2000; Hosmer & Lemeshow, 1989; Shapiro, 1999). Outcome Measure
Recidivism was defined as the occurrence of one or multiple new convictions within 18 months after completing the full screen. Data on recidivism were based on official records, both juvenile and adult records, from Washington State. Recidivism was treated as a dichotomous variable (whether or not convicted for any new offense).
Analyses
In this study, 12- and 13-year-olds were considered separately, because of the many changes that occur during this period, such as the transition from primary to secondary school. The study by Van der Put et al. (2010b) showed a strong decrease in the importance of risk factors in the social domain for this age group.
A total score was calculated for the risk factors as well as the promotive factors per
domain by adding the number of risk factors and the number of promotive factors respectively. We used analysis of variance (ANOVA) to determine whether there are differences between the age groups and between boys and girls in the prevalence of promotive and risk factors.
Pearson correlation coefficients were calculated to determine the strength of the
relation between the promotive factors and recidivism, and between the risk factors and recidivism. Fisher’s z tests were used to examine whether the correlations differed significantly between boys and girls in between the youngest and oldest age groups. Multiple logistic regression analyses were used in order to identify the best unique predictors of recidivism for boys and girls and for the different age groups. Separate multivariate prediction models were conducted for boys and girls and for the different age groups, based on only risk factors and based on only promotive factors. Subsequently, hierarchical multiple logistic regression analysis was used in order to analyse the unique contribution of the promotive factors.
Results Age and Sex Differences in the Level of Recidivism
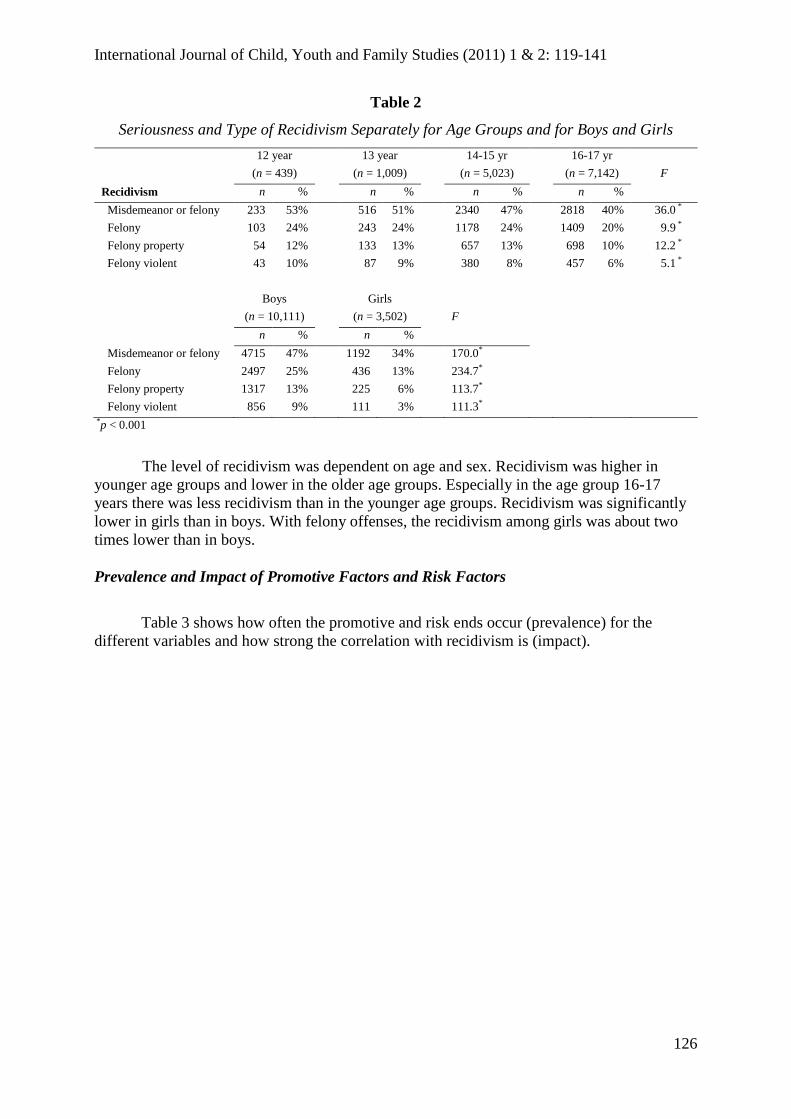
Table 2 shows the seriousness and nature of the repeated offense for each age group and for boys and girls.
International Journal of Child, Youth and Family Studies (2011) 1 & 2: 119-141
126
Table 2
Seriousness and Type of Recidivism Separately for Age Groups and for Boys and Girls 12 year
(n = 439) 13 year
(n = 1,009) 14-15 yr
(n = 5,023) 16-17 yr
(n = 7,142)
F Recidivism n % n % n % n % Misdemeanor or felony 233 53% 516 51% 2340 47% 2818 40% 36.0 * Felony 103 24% 243 24% 1178 24% 1409 20% 9.9 * Felony property 54 12% 133 13% 657 13% 698 10% 12.2 * Felony violent 43 10% 87 9% 380 8% 457 6% 5.1 *
The level of recidivism was dependent on age and sex. Recidivism was higher in
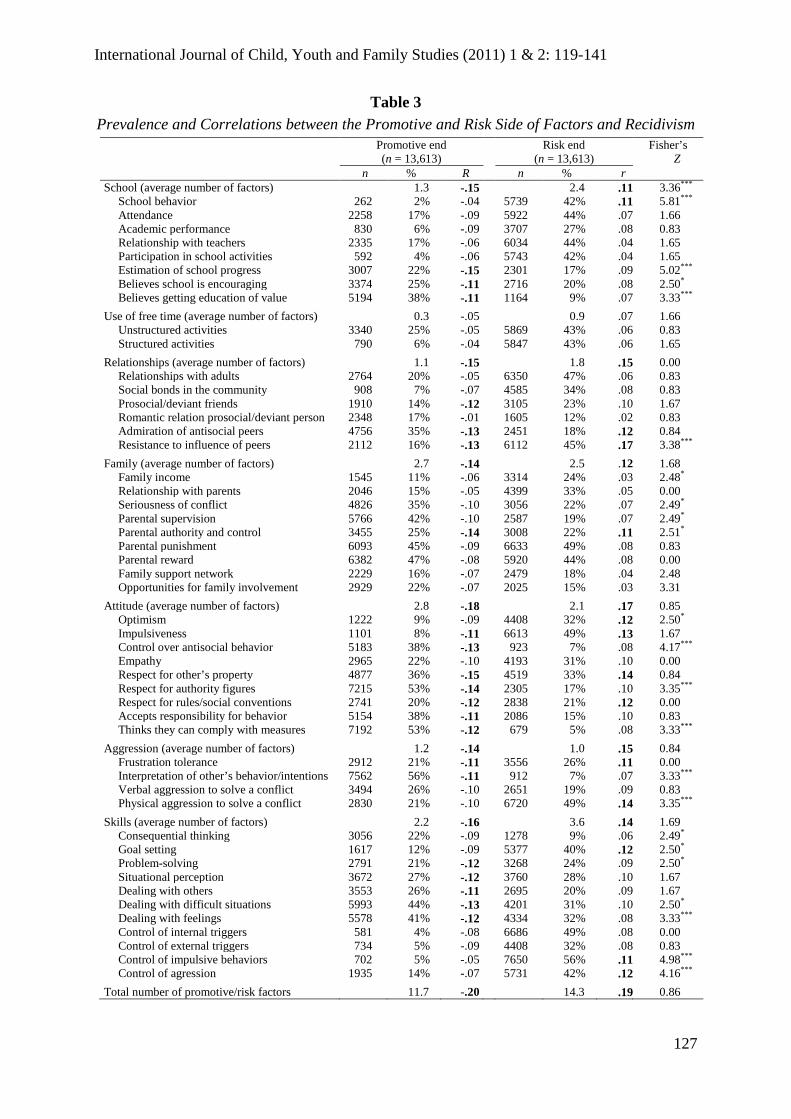
younger age groups and lower in the older age groups. Especially in the age group 16-17 years there was less recidivism than in the younger age groups. Recidivism was significantly lower in girls than in boys. With felony offenses, the recidivism among girls was about two times lower than in boys. Prevalence and Impact of Promotive Factors and Risk Factors Table 3 shows how often the promotive and risk ends occur (prevalence) for the different variables and how strong the correlation with recidivism is (impact).
International Journal of Child, Youth and Family Studies (2011) 1 & 2: 119-141
127
Table 3 Prevalence and Correlations between the Promotive and Risk Side of Factors and Recidivism
Promotive end (n = 13,613)
Risk end (n = 13,613)
Fisher’s Z
n % R n % r School (average number of factors) 1.3 -.15 2.4 .11 3.36***
School behavior 262 2% -.04 5739 42% .11 5.81*** Attendance 2258 17% -.09 5922 44% .07 1.66 Academic performance 830 6% -.09 3707 27% .08 0.83 Relationship with teachers 2335 17% -.06 6034 44% .04 1.65 Participation in school activities 592 4% -.06 5743 42% .04 1.65 Estimation of school progress 3007 22% -.15 2301 17% .09 5.02*** Believes school is encouraging 3374 25% -.11 2716 20% .08 2.50* Believes getting education of value 5194 38% -.11 1164 9% .07 3.33***
Use of free time (average number of factors) 0.3 -.05 0.9 .07 1.66 Unstructured activities 3340 25% -.05 5869 43% .06 0.83 Structured activities 790 6% -.04 5847 43% .06 1.65
Relationships (average number of factors) 1.1 -.15 1.8 .15 0.00 Relationships with adults 2764 20% -.05 6350 47% .06 0.83 Social bonds in the community 908 7% -.07 4585 34% .08 0.83 Prosocial/deviant friends 1910 14% -.12 3105 23% .10 1.67 Romantic relation prosocial/deviant person 2348 17% -.01 1605 12% .02 0.83 Admiration of antisocial peers 4756 35% -.13 2451 18% .12 0.84 Resistance to influence of peers 2112 16% -.13 6112 45% .17 3.38***
Family (average number of factors) 2.7 -.14 2.5 .12 1.68 Family income 1545 11% -.06 3314 24% .03 2.48* Relationship with parents 2046 15% -.05 4399 33% .05 0.00 Seriousness of conflict 4826 35% -.10 3056 22% .07 2.49* Parental supervision 5766 42% -.10 2587 19% .07 2.49* Parental authority and control 3455 25% -.14 3008 22% .11 2.51* Parental punishment 6093 45% -.09 6633 49% .08 0.83 Parental reward 6382 47% -.08 5920 44% .08 0.00 Family support network 2229 16% -.07 2479 18% .04 2.48 Opportunities for family involvement 2929 22% -.07 2025 15% .03 3.31
Attitude (average number of factors) 2.8 -.18 2.1 .17 0.85 Optimism 1222 9% -.09 4408 32% .12 2.50* Impulsiveness 1101 8% -.11 6613 49% .13 1.67 Control over antisocial behavior 5183 38% -.13 923 7% .08 4.17*** Empathy 2965 22% -.10 4193 31% .10 0.00 Respect for other’s property 4877 36% -.15 4519 33% .14 0.84 Respect for authority figures 7215 53% -.14 2305 17% .10 3.35*** Respect for rules/social conventions 2741 20% -.12 2838 21% .12 0.00 Accepts responsibility for behavior 5154 38% -.11 2086 15% .10 0.83 Thinks they can comply with measures 7192 53% -.12 679 5% .08 3.33***
Aggression (average number of factors) 1.2 -.14 1.0 .15 0.84 Frustration tolerance 2912 21% -.11 3556 26% .11 0.00 Interpretation of other’s behavior/intentions 7562 56% -.11 912 7% .07 3.33*** Verbal aggression to solve a conflict 3494 26% -.10 2651 19% .09 0.83 Physical aggression to solve a conflict 2830 21% -.10 6720 49% .14 3.35***
Skills (average number of factors) 2.2 -.16 3.6 .14 1.69 Consequential thinking 3056 22% -.09 1278 9% .06 2.49* Goal setting 1617 12% -.09 5377 40% .12 2.50* Problem-solving 2791 21% -.12 3268 24% .09 2.50* Situational perception 3672 27% -.12 3760 28% .10 1.67 Dealing with others 3553 26% -.11 2695 20% .09 1.67 Dealing with difficult situations 5993 44% -.13 4201 31% .10 2.50* Dealing with feelings 5578 41% -.12 4334 32% .08 3.33*** Control of internal triggers 581 4% -.08 6686 49% .08 0.00 Control of external triggers 734 5% -.09 4408 32% .08 0.83 Control of impulsive behaviors 702 5% -.05 7650 56% .11 4.98*** Control of agression 1935 14% -.07 5731 42% .12 4.16***
Total number of promotive/risk factors 11.7 -.20 14.3 .19 0.86
International Journal of Child, Youth and Family Studies (2011) 1 & 2: 119-141
128
Note. All correlations are statistically significant (p < .001), except the correlation between recidivism and romantic relation pro social/deviant person. Correlations above .10 are in bold. *p < .05. **p < .01. *** p < .001 For the juveniles in the sample, there were, on average, more risk factors than promotive factors: The average number of risk factors was 14.3, and the average number of promotive factors was 11.7. In most individual domains, on average, more risk factors than promotive factors were present, except in the domains attitude, family, and aggression. The differences between the average number of promotive factors and risk factors were significant in almost every domain (p < .001).
Besides differences in prevalence, we found some differences in the impact of promotive factors and risk factors. For a number of factors, the impact of the promotive end was greater than the impact of the risk end, in particular concerning a number of factors from the domains school (estimation of school progress, believes school is encouraging, and believes getting education is of value), family (family income, seriousness of conflict, parental supervision, parental authority and control), attitude (control over antisocial behavior, respect for authority figures, and thinks they can comply with measures), aggression (interpretation of other’s behavior or intentions), and skills (goal setting, problem-solving, dealing with difficult situations, dealing with feelings). In contrast, for a number of other factors the impact of the risk end was greater than the impact of the promotive end, including factors from the following domains: school (school behavior), friends (resistance to influence of peers), attitude (optimism), aggression (physical aggression to solve a conflict), and skills (goal setting, control of impulsive behaviors, control of aggression).
For most of the individual factors (55%) there was no significant difference between
the impact of the promotive and risk ends. Also, for most of the total scores per domain no significant differences between the promotive end and the risk end were found, except for the total score for the school domain, in which the impact of the promotive end was significantly greater than the impact of the risk end. Age Differences in the Prevalence of Promotive Factors and Risk Factors
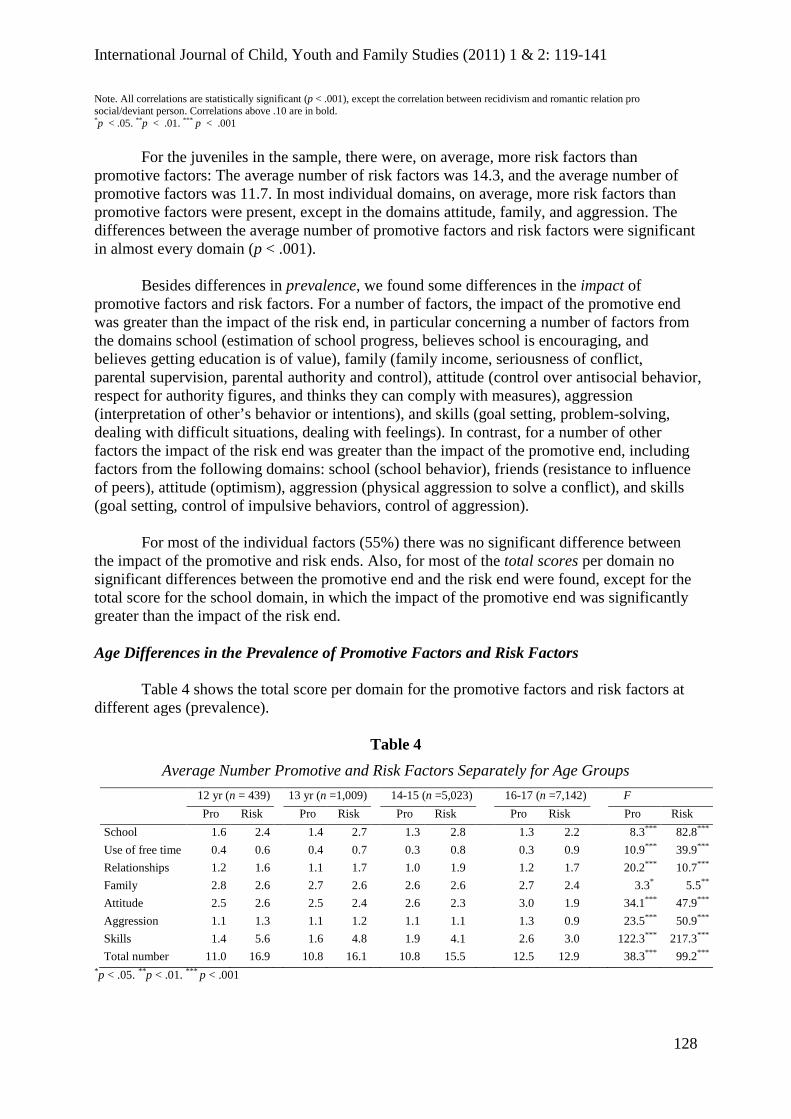
Table 4 shows the total score per domain for the promotive factors and risk factors at different ages (prevalence).
Table 4 Average Number Promotive and Risk Factors Separately for Age Groups
12 yr (n = 439) 13 yr (n =1,009) 14-15 (n =5,023) 16-17 (n =7,142) F Pro Risk Pro Risk Pro Risk Pro Risk Pro Risk School 1.6 2.4 1.4 2.7 1.3 2.8 1.3 2.2 8.3*** 82.8*** Use of free time 0.4 0.6 0.4 0.7 0.3 0.8 0.3 0.9 10.9*** 39.9*** Relationships 1.2 1.6 1.1 1.7 1.0 1.9 1.2 1.7 20.2*** 10.7*** Family 2.8 2.6 2.7 2.6 2.6 2.6 2.7 2.4 3.3* 5.5** Attitude 2.5 2.6 2.5 2.4 2.6 2.3 3.0 1.9 34.1*** 47.9*** Aggression 1.1 1.3 1.1 1.2 1.1 1.1 1.3 0.9 23.5*** 50.9*** Skills 1.4 5.6 1.6 4.8 1.9 4.1 2.6 3.0 122.3*** 217.3*** Total number 11.0 16.9 10.8 16.1 10.8 15.5 12.5 12.9 38.3*** 99.2***
*p < .05. **p < .01. *** p < .001
International Journal of Child, Youth and Family Studies (2011) 1 & 2: 119-141
129
It can be derived from Table 4 that the prevalence of promotive factors was significantly higher in late adolescence, whereas the prevalence of risk factors was significantly lower in late adolescence. The number of risk factors was about equal to the number of promotive factors in late adolescence.
Younger adolescents had fewer promotive factors and more risk factors than older
adolescents. In order to examine whether this can be explained by the early age of onset of the younger group, we reran the analysis on the subsample of adolescents who have committed their first offense before their 12th year (n = 3,386). Older adolescents still had significantly (F = 18.8, p < .001) fewer risk factors (14.0) than younger adolescents (16.9), but the difference was smaller than for the total sample. The number of promotive factors was roughly equal (11.2 and 11.0). So, the differences between younger and older adolescents in the prevalence of risk and promotive factors can indeed be partially explained by the early age of onset of the younger age group.
The results varied per domain: The prevalence of promotive factors in the individual
domain (in particular skills, but also attitude and aggression) is higher in late adolescence than in early adolescence; the prevalence of promotive factors in the domain, use of free time, is lower in late adolescence than in early adolescence; for the domain family, the prevalence is about the same and for the domains school and relationships, prevalence decreased until age 15, after which it showed an increase. For the total number of risk factors, the prevalence of risk factors was significantly lower in older adolescents. Similarly, within several domains the prevalence of risk factors differed between age groups. The prevalence of risk factors in the individual domains (in particular skills, but also attitude and aggression) is lower in older adolescents; risk factors in the free time domain is higher in older adolescents, for the domain family, the prevalence is about the same, and for the domains school and relationships prevalence increased until age 15, after which a decrease was seen. Sex Differences in the Prevalence of Promotive Factors and Risk Factors Table 5 shows the total score per domain for the promotive factors and risk factors separately for boys and girls.
Table 5 Average Number Promotive and Risk Factors Separately for Boys and Girls
Boys (n = 10,111) Girls (n = 3,502) F Pro Risk Pro Risk Pro Risk School 1.3 2.5 1.4 2.4 2.2 .4 Use of free time 0.3 0.8 0.2 1.0 63.8*** 59.6*** Relationships 1.1 1.7 1.0 2.0 50.2*** 72.8*** Family 2.8 2.4 2.3 2.9 129.8*** 159.8*** Attitude 2.8 2.1 2.8 2.0 .7 3.6 Aggression 1.3 1.0 1.1 1.2 63.4*** 67.2*** Skills 2.2 3.7 2.3 3.5 2.9 12.4*** Total number 11.9 14.1 11.1 14.8 17.8*** 15.2*** *p < .05. **p < .01. ***p < .001 The number of promotive factors was higher among boys in the following domains: use of free time, relationships, family, and aggression. In girls, the number of risk factors was
International Journal of Child, Youth and Family Studies (2011) 1 & 2: 119-141
130
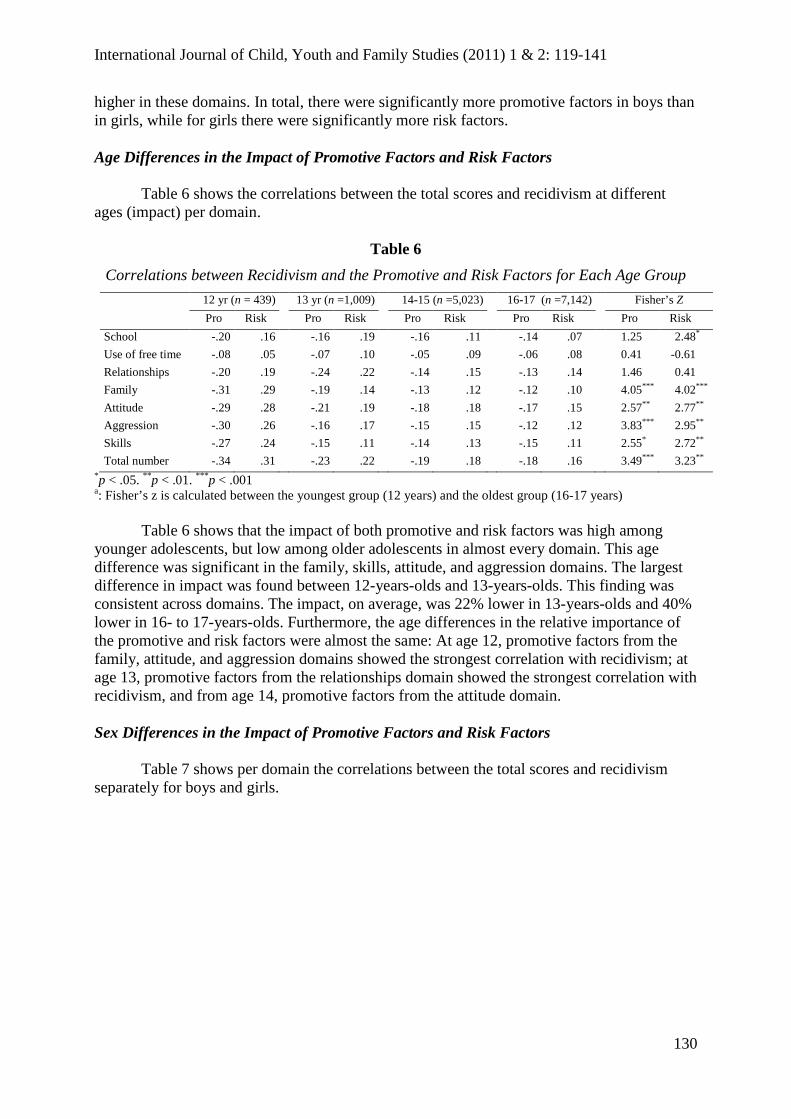
higher in these domains. In total, there were significantly more promotive factors in boys than in girls, while for girls there were significantly more risk factors. Age Differences in the Impact of Promotive Factors and Risk Factors Table 6 shows the correlations between the total scores and recidivism at different ages (impact) per domain.
Table 6
Correlations between Recidivism and the Promotive and Risk Factors for Each Age Group 12 yr (n = 439) 13 yr (n =1,009) 14-15 (n =5,023) 16-17 (n =7,142) Fisher’s Z
Pro Risk Pro Risk Pro Risk Pro Risk Pro Risk School -.20 .16 -.16 .19 -.16 .11 -.14 .07 1.25 2.48* Use of free time -.08 .05 -.07 .10 -.05 .09 -.06 .08 0.41 -0.61 Relationships -.20 .19 -.24 .22 -.14 .15 -.13 .14 1.46 0.41 Family -.31 .29 -.19 .14 -.13 .12 -.12 .10 4.05*** 4.02*** Attitude -.29 .28 -.21 .19 -.18 .18 -.17 .15 2.57** 2.77** Aggression -.30 .26 -.16 .17 -.15 .15 -.12 .12 3.83*** 2.95** Skills -.27 .24 -.15 .11 -.14 .13 -.15 .11 2.55* 2.72** Total number -.34 .31 -.23 .22 -.19 .18 -.18 .16 3.49*** 3.23**
*p < .05. **p < .01. ***p < .001 a: Fisher’s z is calculated between the youngest group (12 years) and the oldest group (16-17 years)
Table 6 shows that the impact of both promotive and risk factors was high among
younger adolescents, but low among older adolescents in almost every domain. This age difference was significant in the family, skills, attitude, and aggression domains. The largest difference in impact was found between 12-years-olds and 13-years-olds. This finding was consistent across domains. The impact, on average, was 22% lower in 13-years-olds and 40% lower in 16- to 17-years-olds. Furthermore, the age differences in the relative importance of the promotive and risk factors were almost the same: At age 12, promotive factors from the family, attitude, and aggression domains showed the strongest correlation with recidivism; at age 13, promotive factors from the relationships domain showed the strongest correlation with recidivism, and from age 14, promotive factors from the attitude domain. Sex Differences in the Impact of Promotive Factors and Risk Factors Table 7 shows per domain the correlations between the total scores and recidivism separately for boys and girls.
International Journal of Child, Youth and Family Studies (2011) 1 & 2: 119-141
131
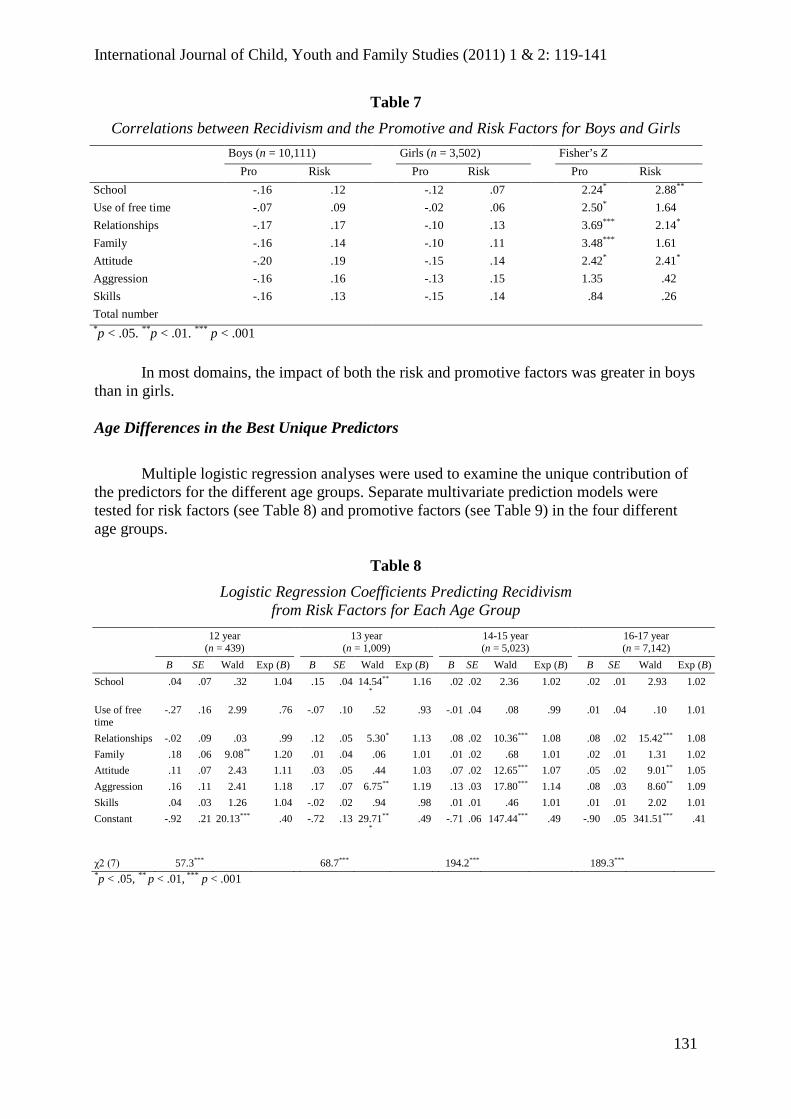
Table 7 Correlations between Recidivism and the Promotive and Risk Factors for Boys and Girls
Boys (n = 10,111) Girls (n = 3,502) Fisher’s Z Pro Risk Pro Risk Pro Risk School -.16 .12 -.12 .07 2.24* 2.88** Use of free time -.07 .09 -.02 .06 2.50* 1.64 Relationships -.17 .17 -.10 .13 3.69*** 2.14* Family -.16 .14 -.10 .11 3.48*** 1.61 Attitude -.20 .19 -.15 .14 2.42* 2.41* Aggression -.16 .16 -.13 .15 1.35 .42 Skills -.16 .13 -.15 .14 .84 .26 Total number *p < .05. **p < .01. *** p < .001 In most domains, the impact of both the risk and promotive factors was greater in boys than in girls. Age Differences in the Best Unique Predictors
Multiple logistic regression analyses were used to examine the unique contribution of the predictors for the different age groups. Separate multivariate prediction models were tested for risk factors (see Table 8) and promotive factors (see Table 9) in the four different age groups.
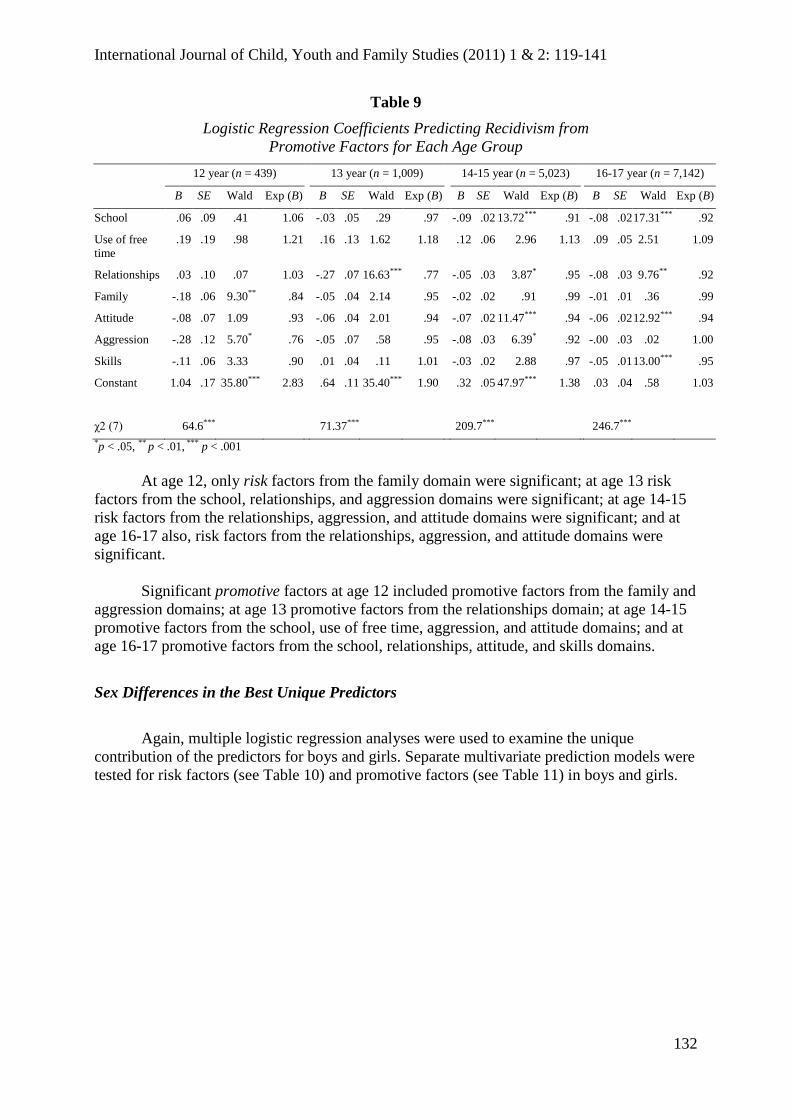
χ2 (7) 64.6*** 71.37*** 209.7*** 246.7*** *p < .05, ** p < .01, *** p < .001 At age 12, only risk factors from the family domain were significant; at age 13 risk factors from the school, relationships, and aggression domains were significant; at age 14-15 risk factors from the relationships, aggression, and attitude domains were significant; and at age 16-17 also, risk factors from the relationships, aggression, and attitude domains were significant. Significant promotive factors at age 12 included promotive factors from the family and aggression domains; at age 13 promotive factors from the relationships domain; at age 14-15 promotive factors from the school, use of free time, aggression, and attitude domains; and at age 16-17 promotive factors from the school, relationships, attitude, and skills domains. Sex Differences in the Best Unique Predictors
Again, multiple logistic regression analyses were used to examine the unique contribution of the predictors for boys and girls. Separate multivariate prediction models were tested for risk factors (see Table 10) and promotive factors (see Table 11) in boys and girls.
International Journal of Child, Youth and Family Studies (2011) 1 & 2: 119-141
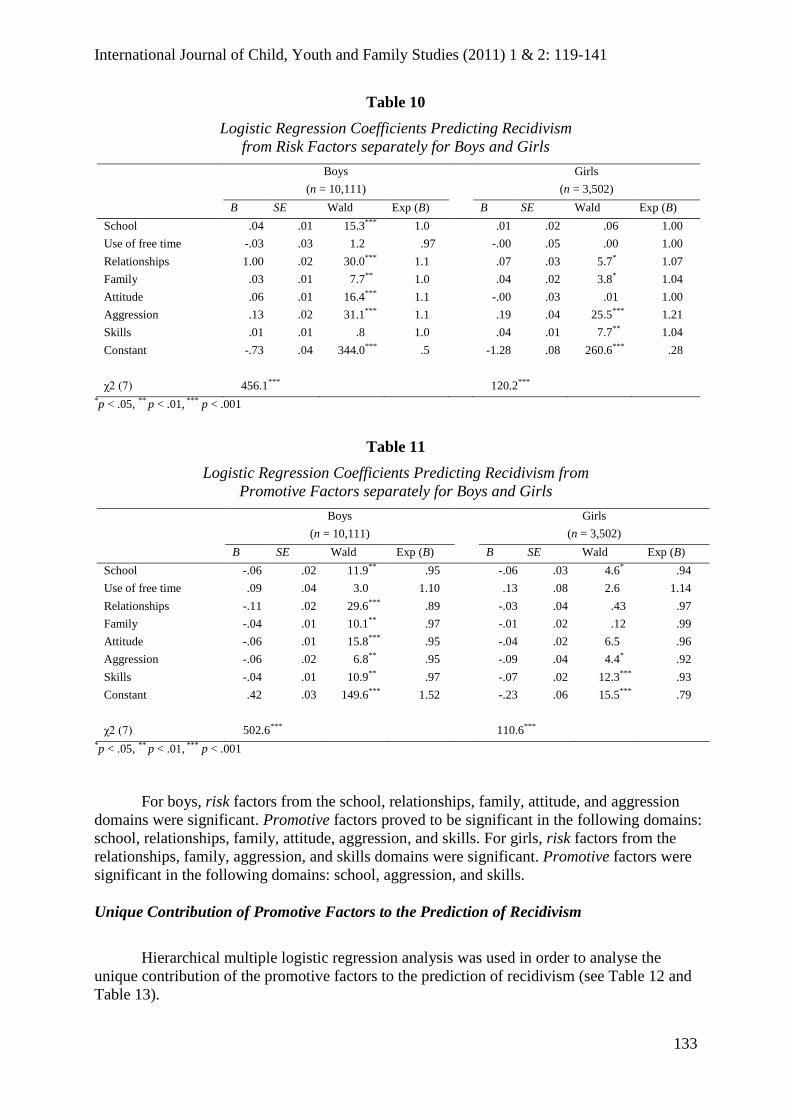
For boys, risk factors from the school, relationships, family, attitude, and aggression
domains were significant. Promotive factors proved to be significant in the following domains: school, relationships, family, attitude, aggression, and skills. For girls, risk factors from the relationships, family, aggression, and skills domains were significant. Promotive factors were significant in the following domains: school, aggression, and skills. Unique Contribution of Promotive Factors to the Prediction of Recidivism
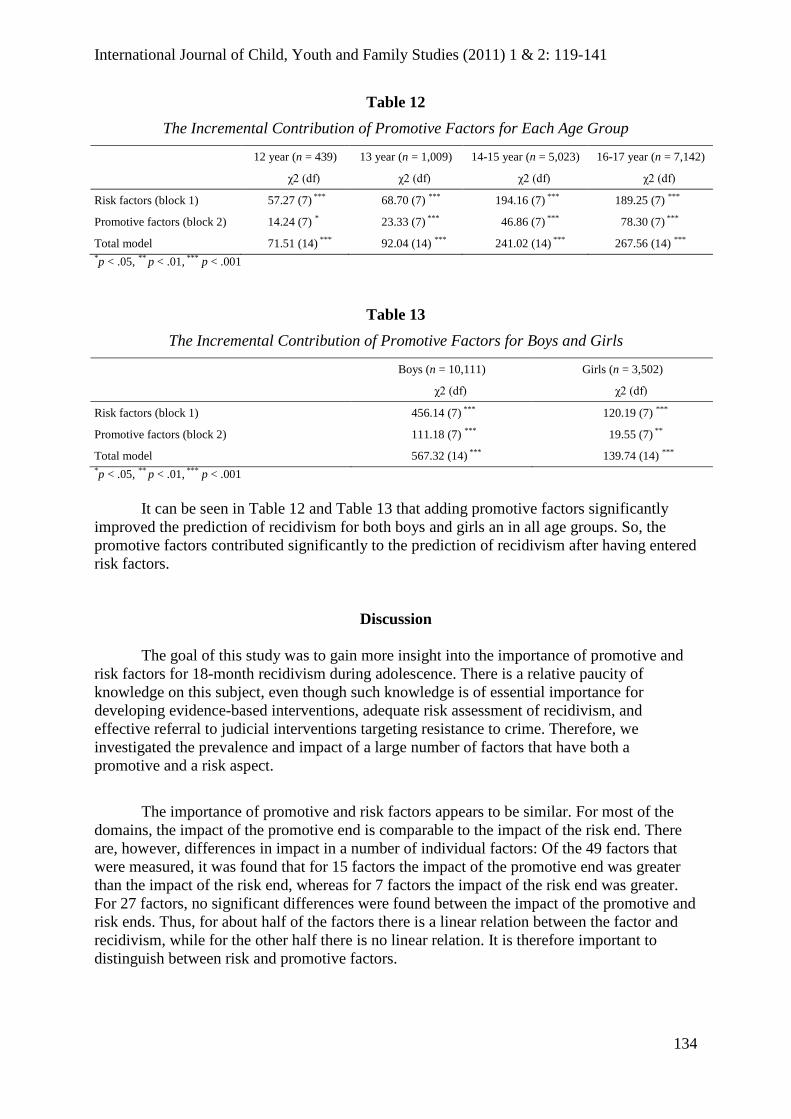
Hierarchical multiple logistic regression analysis was used in order to analyse the unique contribution of the promotive factors to the prediction of recidivism (see Table 12 and Table 13).
International Journal of Child, Youth and Family Studies (2011) 1 & 2: 119-141
134
Table 12 The Incremental Contribution of Promotive Factors for Each Age Group
12 year (n = 439) 13 year (n = 1,009) 14-15 year (n = 5,023) 16-17 year (n = 7,142)
Total model 567.32 (14) *** 139.74 (14) *** *p < .05, ** p < .01, *** p < .001 It can be seen in Table 12 and Table 13 that adding promotive factors significantly improved the prediction of recidivism for both boys and girls an in all age groups. So, the promotive factors contributed significantly to the prediction of recidivism after having entered risk factors.
Discussion The goal of this study was to gain more insight into the importance of promotive and
risk factors for 18-month recidivism during adolescence. There is a relative paucity of knowledge on this subject, even though such knowledge is of essential importance for developing evidence-based interventions, adequate risk assessment of recidivism, and effective referral to judicial interventions targeting resistance to crime. Therefore, we investigated the prevalence and impact of a large number of factors that have both a promotive and a risk aspect.
The importance of promotive and risk factors appears to be similar. For most of the
domains, the impact of the promotive end is comparable to the impact of the risk end. There are, however, differences in impact in a number of individual factors: Of the 49 factors that were measured, it was found that for 15 factors the impact of the promotive end was greater than the impact of the risk end, whereas for 7 factors the impact of the risk end was greater. For 27 factors, no significant differences were found between the impact of the promotive and risk ends. Thus, for about half of the factors there is a linear relation between the factor and recidivism, while for the other half there is no linear relation. It is therefore important to distinguish between risk and promotive factors.
International Journal of Child, Youth and Family Studies (2011) 1 & 2: 119-141
135
Risk factors appear to be more common than promotive factors. This seems consistent with the fact that the sample consists of medium- to high-risk youth. Other studies, with samples including low-risk youth, also show that during adolescence risk factors are more common than promotive factors (Loeber, Farrington, Stouthamer-Loeber, & White, 2008; Van der Laan & Blom, 2006). However, very few studies have questioned whether the proportion of promotive and risk factors is more or less constant across development (Loeber, Farrington et al., 2008). The present study shows that the prevalence of promotive factors was higher in older adolescents, whereas the prevalence of risk factors was higher in younger adolescents. In 16- and 17-year-olds, the number of risk factors was about equal to the number of promotive factors. This can partly be explained by the fact that the group of younger adolescents included more adolescents who started offending at earlier ages. Research has shown that the behavior of early starters is more strongly determined by individual and/or social risk factors than the behavior of late starters, whose behavior is more often determined by situational factors (Moffit, 1993).
Especially for the factors in the individual domains (attitude, aggression, and skills)
the prevalence of promotive factors is higher in older adolescents, while the prevalence of risk factors is higher in younger adolescents. A possible explanation for this is that adolescence is characterised by social, emotional, and moral growth (M. Cole, S. Cole, & Lightfoot, 2005), which means that juveniles develop more promotive factors in an individual domain over time. Recent research on adolescent brain development also shows that the maturation of the brain ensures that adolescents increasingly master a variety of skills (Crone, Bullens, Van der Plas, Kijkuit, & Zelazo, 2008). For example, it appears that by the activity of certain brain areas, younger adolescents make more risky choices for themselves and are more sensitive for rewards than older adolescents (Van Leijenhorst et al., 2010).
The impact of promotive factors as well as risk factors on recidivism is high among
young adolescents, but low in older adolescents in almost every domain. The difference in impact is greatest between 12-years-olds and 13-year-olds: The impact is on average 22% lower in 13-year-olds than in 12-year-olds. So, the influence of both risk factors and promotive factors on recidivism is greatest at the beginning of adolescence. A possible explanation for this is the increasing level of autonomy attained by juveniles during adolescence (Oudshoorn, Brans, Duyx, & Eussen, 2002). This increasing autonomy may result in juveniles who become increasingly less sensitive to external stimuli, and who therefore are less likely to be influenced by, for example, friends or family. Another possible explanation is the rising heritability with age: genetic influences become more important as children grow older. According to work by Plomin and colleagues (2001), heritability estimates calculated on infant samples are as low as 20%, rising to around 40% in middle childhood, and ultimately as high as 80% in adult samples in the United States. This suggests that the underlying genes actually express themselves by affecting a person’s predisposition to build, learn, and develop mental abilities throughout the lifespan (Plomin, DeFries, McClearn, & McGuffin, 2001).
Finally, age differences were found in the unique contribution of promotive and risk
factors to the prediction of recidivism. At age 12, promotive factors in the family and aggression domains were the best independent predictors, at age 13 promotive factors in the relationships domain, and from age 14 promotive factors in the school, relationships, and attitude domains. At age 12, risk factors in the family domain were the best independent predictors, at age 13 risk factors in the school, relationships, and aggression domains, and from age 14 risk factors in the relationships, attitude, and aggression domains.
International Journal of Child, Youth and Family Studies (2011) 1 & 2: 119-141
136
Some limitations of this study need to be mentioned. First, The WSCJA was not
designed to provide an in-depth examination of promotive and risk factors. Instead, it is a risk assessment tool that is designed to be used by juvenile justice professionals and clinicians to summarize youth’s risks and needs, classify their overall risk level, and plan treatment and supervision strategies. Second, the sample predominately consisted of moderate- and high-risk youth. Therefore, the results cannot be generalized to juvenile delinquents with a low risk of criminal offense recidivism. Third, there are no research results available regarding the interrater reliability of the WSJCA. However, given that quality assurance is an important part of the assessment structure and organization in Washington State and probation officers receive intensive training to adequately administer and reliably score the WSJCA (Barnoski, 2004), we have no reason to assume that reliability of the WSJCA would be low.
The results of this study have a number of important implications for policy and
practice. In the first place, this study shows that the dynamic promotive and risk factors were most strongly related to recidivism in different domains. Examples of important promotive factors are: “very likely to graduate”, “believes getting education of value”, “prosocial friends”, “usually following family rules”, “respect for authority figures”, and “skills in dealing with difficult situations”. Examples of important risk factors are: “severe behavior problems at school”, “admiration of antisocial peers”, “no resistance to influence of antisocial peers”, “no respect for other’s property”, “believes physical aggression is appropriate to solve a conflict”, and “lacks techniques to control impulsive behavior”. This knowledge is essential for practices and policies used to prevent recidivism, because the effect of an intervention to prevent recidivism is greatest when it is aimed at those dynamic risk factors and promotive factors that are most strongly linked to recidivism (Andrews et al., 2006; Bonta, 2002; Farmer et al., 2002; Lipsey & Derzon, 1998). The stronger the link to recidivism, the greater the potential effect of an intervention aimed at these factors.
Second, the results show the importance of early intervention within the juvenile
justice system. Because both the importance of the promotive factors and the importance of the risk factors are greatest at the beginning of adolescence, the potential effect of an intervention aimed at these factors is also greatest in early adolescence. The large difference in impact of promotive and risk factors immediately after age 12 implies that at age 12 relatively good progress can be achieved in all domains, while at age 13 this may well require a good deal more effort. The low influence of dynamic risk and promotive factors in 16- and 17-year-olds illustrates the importance of further research on predictors of recidivism in late adolescence. Knowledge of the most important risk and promotive factors for recidivism for 16- and 17-year-olds especially is needed to develop adequate treatment (aimed at those dynamic factors that relate to recidivism most strongly) for this age group.
In the third place, the results show that the focus of an intervention needs to be geared to the age of a juvenile to maximize the potential effect on recidivism. The first step in determining what should be treated comprises a screening to investigate which problems are present in which domains. Given that delinquency and recidivism are the results of complex interactions between risk and promotive factors (Deković & Prinzie, 2008; Prinzie et al., 2008) and the detrimental effect of cumulative risk (Loeber, Slot et al., 2008), it is probable that changes in multiple risk and promotive factors are required to reduce recidivism. When determining treatment goal priorities, it should be kept in mind that the potential effect of an intervention aimed at reducing recidivism at age 12 will probably be the greatest when attention is paid to the family domain, because the family domain is the most important
International Journal of Child, Youth and Family Studies (2011) 1 & 2: 119-141
137
independent predictor at age 12. At age 13, attention should be especially paid to promotive and risk factors in the relationships domain, and from age 14 promotive and risk factors in the attitude domain deserve special attention. These findings emphasize the need for developmentally appropriate interventions.
Fourth, both risk and promotive factors from the attitude domain, such as lack of empathy and having no respect for other’s property, authority, and social conventions, are strongly related to recidivism at any age. Previous research has shown that youth with more antisocial attitudes are also those with more risk factors in the other domains, which indicates that problematic or antisocial attitudes play a central role (Van der Put et. al., 2010b). These findings suggest that the attitude domain should be taken into account during any intervention, because if a change can be brought about in the attitude domain this may work its way through other domains. Fifth, the results are important for risk assessment. The results show that the prediction of recidivism based solely on promotive factors is about as accurate as the prediction based solely on risk factors. It also appears that the prediction of recidivism significantly improved by adding promotive factors to risk factors. Therefore, the combination of risk and promotive factors provides the best prediction of recidivism. Most of the fourth-generation instruments contain promotive factors, but they are usually not included in calculating the overall risk of recidivism score. Promotive factors are measured in order to assess the needs of juveniles and get insight into the possibilities for reducing the risk of recidivism. The predictive value of the overall risk score is likely to improve if promotive factors are also included in the calculation of this score. Finally, the results show that a decrease in recidivism can be achieved by focusing on both an increase and/or strengthening of promotive factors and a decrease in the number of risk factors. For most factors, the impact of the promotive aspect is comparable to the impact of the risk aspect. Interventions aimed at increasing promotive factors are therefore potentially just as effective as interventions aimed at decreasing risk factors, which is important when considering what the focus of an intervention should be. In addition, this knowledge is important because it may be easier to foster treatment motivation by targeting promotive factors instead of targeting risk factors.
International Journal of Child, Youth and Family Studies (2011) 1 & 2: 119-141
138
References
Andrews, D. A., & Bonta, J. (2010). Rehabilitating criminal justice policy and practice. Psychology, Public Policy, and Law, 16(1), 39-55.
Andrews, D. A., Bonta, J., & Wormith, S. J. (2006). The recent past and near future of risk
and/or need assessment. Crime & Delinquency, 52(1), 7-27. Barnoski, R. (2004). Assessing risk for re-offense: Validating the Washington State juvenile
court assessment. Olympia: Washington State Institute for Public Policy, 2004. Bonta, J. (2002). Offender risk assessment: Guidelines for selection and use. Criminal Justice
and Behavior, 29(4), 355-379. Cole, M., Cole, S. R., & Lightfoot, C. (2005). Development of children (5th ed.). New York:
Worth Publishers Inc. Crone, E. A., Bullens, L., Van der Plas, E. A. A., Kijkuit, E. J., & Zelazo, P. D. (2008).
Developmental changes and individual differences in risk and perspective taking in adolescence. Development and Psychopathology, 20(4), 1213-1229.
Deković, M. (1999). Risk and protective factors in the development of problem behavior
during adolescence. Journal of Youth and Adolescence, 28(6), 667-685. Deković, M., & Prinzie, P. (2008). De rol van het gezin in de ontwikkeling van antisociaal
gedrag [The role of the family in the development of antisocial behavior]. In I. Weijers & C. Eliaerts (Eds.), Jeugdcriminologie. Achtergronden van Jeugdcriminaliteit (pp. 143-161). Den Haag, The Netherlands: Boom Juridische Uitgevers.
Dolan, M., & Doyle, M. (2000). Violence risk prediction: Clinical and actuarial measures and the role of psychopathy checklist. British Journal of Psychiatry, 177(4), 303-311. Farmer, E. M. Z., Compton, S. M., Burns, B. J., & Robertson, E. (2002). Review of the
evidence base for treatment of childhood psychotherapy: Externalizing disorders. Journal of Consulting and Clinical Psychology, 70(6), 1267-1302.
Farrington, D. P. (2003). Developmental and life-course criminology: Key theoretical and
empirical issues. Criminology, 41(2), 221-256. Farrington, D. P., Loeber, R., Jolliffe, D., & Pardini, D. A. (2008). Promotive and risk
processes at different life stages. In R. Loeber, D. P. Farrington, M. Stouthamer-Loeber, & H. Raskin White (Eds.), Violence and serious theft. Development and prediction from childhood to adulthood (pp. 169-230). New York: Routledge.
Fergusson, D. M., & Lynskey, M. T. (1996). Adolescent resiliency to family adversity.
Journal of Child Psychology and Psychiatry, 37(3), 281-292. Funk, S. J. (1999). Risk assessment for juveniles on probation: A focus on gender, Criminal
Justice and Behavior, 26(1), 44-68.
International Journal of Child, Youth and Family Studies (2011) 1 & 2: 119-141
139
Hosmer, D., & Lemeshow, S. (1980). Goodness of fit tests for the multiple logistic regression model. Communications in Statistics Part A – Theory and Methods, 9(10), 1043-1069.
Howell, J. C. (2003). Diffusing research into practice using the comprehensive strategy for
serious, violent, and chronic juvenile offenders. Youth Violence and Juvenile Justice, 1(3), 219-245.
Lipsey, M. W., & Derzon, J. H. (1998). Predictors of violent or serious delinquency in
adolescence and early adulthood: A synthesis of longitudinal research. In R. Loeber & D. P. Farrington (Eds.), Serious and violent juvenile offenders. Risk factors and successful interventions (pp. 86-106). London: Sage.
Loeber, R., DeLamatre, M., Keenan, K., & Zhang, Q. (1998). A prospective replication of
developmental pathways in disruptive and delinquent behavior. In R. Cairns, L. Bergman, & J. Kagan (Eds.), Methods and models for studying the individual (pp. 185-215). Thousand Oaks, CA: Sage.
Loeber, R., Slot, W., & Stouthamer-Loeber, M. (2008). A cumulative developmental model
of risk and promotive factors. In R. Loeber, H. M. Koot, N. W. Slot, P. H. Van der Laan, & M. Hoeve (Eds.), Tomorrow’s criminals: The development of child delinquency and effective interventions (pp. 133-161). Hampshire, UK: Ashgate Publishing Ltd.
Loeber, R., Farrington, D. P., Stouthamer-Loeber, M., & White, H. R. (2008). Violence and
serious theft: Development and prediction from childhood to adulthood. New York: Routledge.
Moffitt, T. E. (1993). Adolescence-limited and life-course-persistent antisocial behavior: A
developmental taxonomy. Psychological Review, 100, 674-701. Orbis Partners Inc. (2007). Long-term validation of the Youth Assessment and Screening
Instrument (YASI) in New York State juvenile probation. Ottawa, ON: Author. Oudshoorn, D. N., Brans, H. C. M., Duyx, J. H. M., & Eussen M. L. J. M. (2002). Kinder-en
adolescenten psychiatrie [Child and adolescent psychiatry]. Houten, The Netherlands: Bohn Stafleu Van Loghum.
Plomin, R., DeFries, J. C., McClearn, G. E., & McGuffin, P. (2001). Behavioral genetics.
New York: Worth Publishers. Pollard, J. A., Hawkins, J. D., & Arthur, M. W. (1999). Risk and protection: Are both
necessary to understand diverse behavioral outcomes in adolescence? Social Work Research, 23(3), 145-159.
Prinzie, P., Hoeve, M., & Stams, G. J. J. M. (2008). Family processes, parent and child
personality characteristics. In R. Loeber, H. M. Koot, N. W. Slot, P. H. Van der Laan, & M. Hoeve (Eds.), Tomorrow's criminals: The development of child delinquency and effective interventions (pp. 91-102). Hampshire, UK: Ashgate Publishing Ltd.
International Journal of Child, Youth and Family Studies (2011) 1 & 2: 119-141
140
Rice, M. E., & Harris, G. T. (2005). Comparing effect sizes in follow-up studies: ROC area, Cohen’s d and r. Law and Human Behavior, 29(5), 615-620.
Rutter, M. (1987). Psychosocial resilience and protective mechanisms. American Journal of
Orthopsychiatry, 57(3), 316-331. Rutter, M. (2003). Crucial paths from risk indicator to causal mechanism. In B. B. Lahey, T.
E. Moffitt, & A. Caspi (Eds.), Causes of conduct disorder and juvenile delinquency (pp. 3-26). New York: The Guilford.
Sameroff, A. J., Bartko, W. T., Baldwin, A., Baldwin, C., & Seifer, R. (1998). Family and
social influences on the development of child competence. In M. Lewis & C. Feiring (Eds.), Families, risk, and competence (pp. 161-186). Mahwah, NJ: Erlbaum.
Schwalbe, C. S. (2007). Risk assessment for juvenile justice: A meta-analysis. Law and
Human Behavior, 31(5), 449-462. Schwalbe, C. S., Fraser, M. W., Day, S. H., & Cooley, V. (2006). Classifying juvenile
offenders according to risk of recidivism: Predictive validity, race/ethnicity, and gender. Criminal Justice and Behavior, 33(3), 305-324.
Shapiro, D. E. (1999). The interpretation of diagnostics tests. Statistical Methods in Medical
Research, 8(2), 113-134.
Stouthamer-Loeber, M., Loeber, R., Farrington, D. P., Zhang, Q., Van Kammen, W. B., & Maguin, E. (1993). The double edge of protective and risk factors for delinquency: Interrelations and developmental patterns. Development and Psychopathology, 5(4), 683-701.
Stouthamer-Loeber, M., Loeber, R., Wei, E., Farrington, D. P., & Wikström, P-O. H. (2002).
Risk and promotive effects in the explanation of persistent serious delinquency in boys. Journal of Consulting and Clinical Psychology, 70, 11-23.
Stouthamer-Loeber, M., Wei, E., Loeber, R., & Masten, A. F. (2004). Desistance from
persistent serious delinquency in the transition to adulthood. Development and Psychopathology, 16(4), 897-918.
Van der Laan, A. M., & Blom, M. (2006). Jeugddelinquentie: Risico’s en bescherming
[Juvenile delinquency: Risk and protection]. Den Haag, The Netherlands: Boom Juridische Uitgevers/WODC.
Van der Laan, A. M., Veenstra, R., Bogaerts, S., Verhulst, F. C., & Ormel, J. (2010). Serious,
minor, and non-delinquents in early adolescence: The impact of cumulative risk and promotive factors. The TRAILS study. Journal of Abnormal Child Psychology, 38(3), 339-351.
Van der Put, C. E., Deković, M., Hoeve, M., Stams, G. J. J. M., Van der Laan, P. H., &
Langewouters, F. (2010a). Risk assessment of girls: Are there any sex differences in risk factors for re-offending and in risk profiles? Crime & Delinquency. Advance online publication. doi: 10.1177/0011128710384776
International Journal of Child, Youth and Family Studies (2011) 1 & 2: 119-141
141
Van der Put, C. E., Deković, M., Stams, G. J. J. M., Van der Laan, P. H., Hoeve, M., & Van Amelsfort, L. (2010b). Changes in risk factors during adolescence: Implications for risk assessment. Criminal Justice and Behavior. Advance online publication. doi: 10.1177/0093854810391757
Van der Put, C. E., Stams, G. J. J. M., Deković, M., Hoeve, M., Van der Laan, P. H.,
Spanjaard, H., & Barnoski, R. (in press). Criminogenic needs during adolescence: Changes in the relative importance of dynamic risk factors for recidivism during adolescence. International Journal of Offender Therapy and Comparative Criminology.
Van Leijenhorst, L., Zanolie, K., Van Meel, C. S., Westenberg, P. M., Rombouts, S. A. R. B.,
& Crone, E. A. (2010). What motivates the adolescent? Brain regions mediating reward sensitivity across adolescence. Cerebral Cortex, 20(1), 61-69.
Veenstra, R., Lindenberg, S., Verhulst, F. C., & Ormel, J. (2009). Childhood-limited versus
persistent antisocial behavior: Why do some recover and others do not? The TRAILS study. Journal of Early Adolescence, 29(5), 718-742.