28
c07ActivityAnalysis 224 4 May 2017 1:41 PM UNCORRECTED PAGE PROOFS

c07ActivityAnalysis 224 4 May 2017 1:41 PM
UNCORRECTED PAGE P
ROOFS
PROOFS
PROOFS

Training to improve performance
OUTCOME 1
Analyse data from an activity analysis and fitness tests to determine and assess the fitness components and energy system requirements of the activity
OUTCOME 2
Participate in a variety of training methods, and design and evaluate training programs to enhance specific fitness components
c07ActivityAnalysis 225 4 May 2017 1:41 PM
Unit 4
UNCORRECTED PAGE
PAGE PROOFS
PROOFS
PROOFSTraining to
PROOFSTraining to improve
PROOFSimprove performance
PROOFSperformance
OUTCOME 1
PROOFSOUTCOME 1
Analyse data from an activity PROOFS
Analyse data from an activity analysis and fitness tests to PROOFS
analysis and fitness tests to PROOFS
determine and assess the fitness PROOFS
determine and assess the fitness PROOFS
PROOFS

INQUIRY QUESTION What is the most important step in developing a successful training program? Why is this step so important?
c07ActivityAnalysis 226 4 May 2017 1:41 PM
UNCORRECTED PAGE P
ROOFS
PROOFS
PROOFS

The more information you know about the requirements of the activity you are training for, the more specific and therefore effective your training can be.
KEY KNOWLEDGE � Activity analysis, including skill frequencies, movement patterns, heart rates and work-to-rest ratios
KEY SKILLS � Analyse data to determine the major � tness components and the factors that affect them, and energy systems used in a variety of sporting events and physical activities
CHAPTER PREVIEW
Activityanalysis
Skillfrequency
Work-to-restratios
Heart ratesMovementpatterns
Activity analysis
c07ActivityAnalysis 227 4 May 2017 1:41 PM
7 CHAPTER
UNCORRECTED
UNCORRECTED
UNCORRECTED
UNCORRECTED PAGE
PAGE
PAGE
PAGE
PAGE
PAGE Activity
PAGE Activityanalysis
PAGE analysis
PAGE
MovementPAGE
MovementpatternsPAGE
patterns
PROOFSThe more information you know about the requirements of the activity you are
PROOFSThe more information you know about the requirements of the activity you are training for, the more specific and therefore effective your training can be.
PROOFStraining for, the more specific and therefore effective your training can be.
Activity analysis, including skill frequencies, movement patterns, heart rates and
PROOFSActivity analysis, including skill frequencies, movement patterns, heart rates and
Analyse data to determine the major � tness components and the factors that affect
PROOFSAnalyse data to determine the major � tness components and the factors that affect them, and energy systems used in a variety of sporting events and physical activities
PROOFS
them, and energy systems used in a variety of sporting events and physical activities
PROOFS
PROOFS

c07ActivityAnalysis 228 4 May 2017 1:41 PM
Activity analysis enables coaches and performers to make the important link between training and the actual performance of an activity. It involves recording and illustrating the physical demands on the performer in the competitive setting. Elite athletes are often the ideal subjects for activity analysis as they will exhibit the movements and skills that are most likely to lead to optimal performance. These physical demands can then be translated to the training situation. The key to successful activity analysis centres on the training principle of specifi city (see topic 11); that is, quality activity analysis helps coaches and performers gain specifi c knowledge that can be used to design tailored training programs.
This knowledge can include: � skill requirements � work-to-rest patterns and ratios � distances travelled at various speeds � movement patterns, type and direction � energy system requirements � the intensity of movement and the actions performed � muscle groups and muscle action � team strategies � opponents’ strengths and weaknesses � biomechanical techniques.
FIGURE 7.1 Coaches working with elite athletes gain speci� c knowledge and then design training programs that will enhance the athlete’s performance.
Activity analysis is the recording and analysis of movement and skill data from a game, sport or activity.
7.1What is activity analysis?
KEY CONCEPT Activity analysis is a vital component of creating a training program. It should be the very first step of all training programs.
228 UNIT 4 • Training to improve performance
UNCORRECTED muscle groups and muscle action
UNCORRECTED muscle groups and muscle action
opponents’ strengths and weaknesses
UNCORRECTED opponents’ strengths and weaknessesbiomechanical techniques.
UNCORRECTED biomechanical techniques.
UNCORRECTED PAGE
distances travelled at various speeds
PAGE distances travelled at various speedsmovement patterns, type and direction
PAGE movement patterns, type and direction
the intensity of movement and the actions performedPAGE the intensity of movement and the actions performedmuscle groups and muscle actionPAGE muscle groups and muscle action
PROOFS enables coaches and performers to make the important link between
PROOFS enables coaches and performers to make the important link between training and the actual performance of an activity. It involves recording and illustrating
PROOFStraining and the actual performance of an activity. It involves recording and illustrating the physical demands on the performer in the competitive setting. Elite athletes are
PROOFSthe physical demands on the performer in the competitive setting. Elite athletes are often the ideal subjects for activity analysis as they will exhibit the movements and
PROOFSoften the ideal subjects for activity analysis as they will exhibit the movements and skills that are most likely to lead to optimal performance. These physical demands
PROOFSskills that are most likely to lead to optimal performance. These physical demands can then be translated to the training situation. The key to successful activity analysis
PROOFScan then be translated to the training situation. The key to successful activity analysis centres on the training principle of specifi city (see topic 11); that is, quality activity
PROOFScentres on the training principle of specifi city (see topic 11); that is, quality activity analysis helps coaches and performers gain specifi c knowledge that can be used to PROOFS
analysis helps coaches and performers gain specifi c knowledge that can be used to

c07ActivityAnalysis 229 4 May 2017 1:41 PM
Team sports and individual sports of an intermittent nature are most suited to activity analysis. For example:
� netball � volleyball � hockey � squash � water polo � golf � archery � surfi ng.
Analysis of continuous activities such as middle-distance and long-distance running, road cycling, rowing and swimming is more limited to the measurement of heart rates and intensities.
It is important that where possible the highest level of performance is observed; for example, elite. This allows for greater accuracy in data collection as it should provide information about how to achieve optimal performance.
FIGURE 7.2 Netball and sur� ng are intermittent sports where activity analysis, such as skill frequency tables, can provide much insight into the physiological requirements of the sports.
Data collectionData collection is the process of gathering information. This is the fi rst step of activity analysis. Once the data is collected, it can be analysed.
The most common way to gather data is through observation. Observation is a practical method of data collection but has low accuracy. Digital recording can be less practical but has higher accuracy.
Simple direct observationThe coach or interested party views the player or team from the sideline. All gathered information is subjective and may include:
� how the athlete moves around the playing area � where they move to � the intensity of their sprint or playing � the frequency of particular skill movements, such as backhand tennis shots � the muscle groups that need strengthening � the team plays that are in use.
There are no supportive data for observed information, as this information is simply one person’s or a group’s point of view.
Data collection is the process of gathering information.
CHAPTER 7 • Activity analysis 229
UNCORRECTED
UNCORRECTED
UNCORRECTED
UNCORRECTED
Netball and sur� ng are intermittent sports where activity analysis, such as skill frequency tables, can provide much
UNCORRECTED
Netball and sur� ng are intermittent sports where activity analysis, such as skill frequency tables, can provide much insight into the physiological requirements of the sports.
UNCORRECTED
insight into the physiological requirements of the sports.
Data collection
UNCORRECTED
Data collectionis the process of gathering information. This is the fi rst step of activity
UNCORRECTED
is the process of gathering information. This is the fi rst step of activity analysis. Once the data is collected, it can be analysed.
UNCORRECTED
analysis. Once the data is collected, it can be analysed. The most common way to gather data is through observation. Observation is a
UNCORRECTED
The most common way to gather data is through observation. Observation is a practical method of data collection but has low accuracy. Digital recording can be less
UNCORRECTED
practical method of data collection but has low accuracy. Digital recording can be less practical but has higher accuracy.
UNCORRECTED
practical but has higher accuracy.
UNCORRECTED
Simple direct observationUNCORRECTED
Simple direct observationThe coach or interested party views the player or team from the sideline. All gathered UNCORRECTED
The coach or interested party views the player or team from the sideline. All gathered information is subjective and may include:UNCORRECTED
information is subjective and may include:
PAGE
PAGE
PAGE PROOFS
example, elite. This allows for greater accuracy in data collection as it should provide
PROOFS
example, elite. This allows for greater accuracy in data collection as it should provide
PROOFS
PROOFS

c07ActivityAnalysis 230 4 May 2017 1:41 PM
What is activity analysis?7.1
Digital recordingStatistical data can be recorded live and analysed immediately, or gathered and analysed after the event. The use of video is the preferred method to record data, because the coach and athlete can replay, slow down and freeze-frame the images. This method of activity analysis is commonly used in all top sporting teams.
Many elite teams now have access to programs that allow for immediate analysis of digital recording, reducing the burden of data collection and making the collection and analysis of data incredibly effi cient.
TEST your understanding 1 De� ne the term activity analysis. 2 Identify methods of activity analysis that are best used for team sports. 3 Identify methods of activity analysis that are best suited to individual sports. 4 Outline the difference between data collection and activity analysis.
APPLY your understanding 5 Consider the AFL recording methods weblinks found in your eBookPLUS.
(a) Make a list of the types of recording methods that are used in AFL.(b) What information is gained by these methods?(c) How is the information gained used by coaching staff and players?(d) What are the advantages and some limitations of activity analysis?
EXAM practice 6 Explain why activity analysis is the � rst and most important step in developing
any training program. 2 marks
WeblinkAFL recording methods
Unit 4 Activity analysis and data collectionSummary screen and practice questions
AOS 1
Topic 1
Concept 1
230 UNIT 4 • Training to improve performance
UNCORRECTED
UNCORRECTED PAGE AFL recording methods
PAGE AFL recording methods weblinks found in your eBookPLUS.
PAGE weblinks found in your eBookPLUS. (a) Make a list of the types of recording methods that are used in AFL.
PAGE (a) Make a list of the types of recording methods that are used in AFL.(b) What information is gained by these methods?
PAGE (b) What information is gained by these methods?(c) How is the information gained used by coaching staff and players?
PAGE (c) How is the information gained used by coaching staff and players?
PAGE
PAGE (d) What are the advantages and some limitations of activity analysis?
PAGE (d) What are the advantages and some limitations of activity analysis?
Explain why activity analysis is the � rst and most important step in developing PAGE Explain why activity analysis is the � rst and most important step in developing any training program. PAGE any training program.
PROOFSMany elite teams now have access to programs that allow for immediate analysis
PROOFSMany elite teams now have access to programs that allow for immediate analysis of digital recording, reducing the burden of data collection and making the collection
PROOFSof digital recording, reducing the burden of data collection and making the collection
PROOFS
PROOFSIdentify methods of activity analysis that are best used for team sports.
PROOFSIdentify methods of activity analysis that are best used for team sports.Identify methods of activity analysis that are best suited to individual sports.
PROOFSIdentify methods of activity analysis that are best suited to individual sports.Outline the difference between data collection and activity analysis.
PROOFS
Outline the difference between data collection and activity analysis.
weblinks found in your eBookPLUS. PROOFS
weblinks found in your eBookPLUS.

c07ActivityAnalysis 231 4 May 2017 1:41 PM
KEY CONCEPT Skill frequencies provide insight into the predominant fitness components and muscles and muscle groups used in a sport. This can help ensure specific tests and training activities are included in a training program.
Skill frequency tables can be easily completed using direct observation but can also be collated using different technologies. Skill frequency tables are generally referred to as ‘stats’. Tables outline the frequency, and in many cases the effectiveness, of skill execution.
The following skill frequency tables were taken over a 5-minute period during a Year 12 practical class.
TABLE 7.1 Skill frequency tables record the number of times common skills are executed during a set time frame.
Volleyball
Skill Frequency
Block 3
Serve 6
Spike 3
Dig 4
Set 7
Netball — Centre
Skill Frequency
Pass 18
Catch 12
Dodge 9
Sprint 11
Defend 6
Jump 4
Rebound 0
Running backwards 3
AFL
Skill Frequency
Kick 6
Mark 3
Handball 4
Baulk 4
Sprint 7
Tackle 3
Football/soccer
Skill Frequency
Kick 12
Dribble 8
Sprint 4
Tackle 2
Badminton
Skill Frequency
Overhead 9
Serve 6
Forehand 5
Backhand 4
Lunge 13
Tennis
Skill Frequency
Overhead 3
Serve 6
Forehand 13
Backhand 8
Lunge 5
Digital documentActivity analysisSearchlight ID: doc-22226
Methods of activity analysis: skill frequency7.2
CHAPTER 7 • Activity analysis 231
UNCORRECTED
UNCORRECTED
UNCORRECTED
UNCORRECTED
UNCORRECTED
UNCORRECTED
UNCORRECTED
UNCORRECTED
UNCORRECTED
UNCORRECTED
UNCORRECTED
UNCORRECTED
9
UNCORRECTED
9
11
UNCORRECTED
11
6
UNCORRECTED
6
4
UNCORRECTED
4
Running backwards
UNCORRECTED
Running backwards
UNCORRECTED
UNCORRECTED
Skill
UNCORRECTED
Skill
KickUNCORRECTED
Kick
MarkUNCORRECTED
MarkUNCORRECTED Badminton
UNCORRECTED Badminton
UNCORRECTED
UNCORRECTED
UNCORRECTED
UNCORRECTED Skill
UNCORRECTED Skill
Overhead
UNCORRECTED Overhead
Serve
UNCORRECTED Serve
Forehand
UNCORRECTED Forehand
PAGE
PAGE
PAGE
PAGE
PAGE
PAGE
PAGE
PAGE
PAGE Frequency
PAGE Frequency
12
PAGE 12
8
PAGE 8
PROOFS
PROOFS
PROOFS
PROOFS
PROOFS
PROOFS

c07ActivityAnalysis 232 4 May 2017 1:41 PM
Methods of activity analysis: skill frequency7.2
Skill frequency tables give an indication of the predominant fi tness components and muscles/muscle groups; for example, a skill frequency table that shows a high percentage of leaps or jumps would suggest the fi tness component of muscular power.
To enable training programs to be specifi c, the analysis also needs to identify the muscle groups and movements used in performing each skill. For example, if the skill frequency table shows a high percentage of leaps or jumps, the major muscle groups would be the hamstrings, quadriceps and gluteals.
Muscle-use analysis is often neglected. It must be done in isolation from data gathering because it relies on subjective observation. In muscle-use analysis, the player is observed and notes are made about:
� the major muscles or muscle groups are most used � which main muscle groups are used early in the match, and whether they are different from those used later in the match
� whether the muscle contraction is powerful and fast, or slow and repeated � whether muscle strength or muscle endurance is most important � what range of motion and fl exibility is exhibited.This can then help enhance the specifi city of training. For example:
1. The skill frequency table (data collection) shows a number of chest passes for a basketballer.
2. Analysis identifi es the biceps and triceps are used in an explosive manner.3. Resistance training could be used, targeting the bicep power.4. This could include bicep curls with a low–medium weight, fast speed and a work-
to-rest ratio of 1:5.
TEST your understanding 1 List � ve skills that you would include in a skill frequency
table for each of the following sports.– Hockey– Basketball– Rugby
2 For each of the following skills, outline what major muscles/muscle groups are involved.(a) Vertical jump(b) Change of direction(c) Shoulder pass(d) Kick
APPLY your understanding 3 Learning activity: skill frequency table Develop a skill frequency table for a sport or activity of
your choice, preferably using the highest level athlete possible. Use this table to record data for an individual athlete. You may undertake the analysis at school or outside school on the weekend, and you may record the data while watching the game or make a digital recording of the game. If making a digital recording, keep the focus athlete in view at all times.
Using the results of your skill frequency table, answer the following questions.(a) What were the most important � tness components
for the athlete in this sport? Use data to support your choice.
(b) What role do each of the energy systems play for the athlete in this sport? Use data to support your choice.
(c) How should the information gathered affect the training program for this athlete?
EXAM practice 4 The following skill frequency table was taken from a
Year 12 student during a 15-minute basketball game.
Skill frequency table
Movement Frequency
Changing direction 90
Rebounds 8
Shooting 7
Passing 31
Defending with arms up 22
(a) Suggest an advantage of using elite athletes compared to Year 12 students for activity analysis.
(b) List the � tness components associated with each movement recorded in the table above.
(c) Based on the data, suggest the most important � tness component for basketball.
Unit 4 Skill frequenciesSummary screen and practice questions
AOS 1
Topic 1
Concept 2
232 UNIT 4 • Training to improve performance
UNCORRECTED
UNCORRECTED
UNCORRECTED List � ve skills that you would include in a skill frequency
UNCORRECTED List � ve skills that you would include in a skill frequency
For each of the following skills, outline what major
UNCORRECTED For each of the following skills, outline what major muscles/muscle groups are involved.
UNCORRECTED
muscles/muscle groups are involved.
(b) Change of direction
UNCORRECTED
(b) Change of direction(c) Shoulder pass
UNCORRECTED
(c) Shoulder pass
your understanding
UNCORRECTED
your understanding Learning activity: skill frequency table
UNCORRECTED
Learning activity: skill frequency tableDevelop a skill frequency table for a sport or activity of
UNCORRECTED
Develop a skill frequency table for a sport or activity of
UNCORRECTED
UNCORRECTED
your choice, preferably using the highest level athlete
UNCORRECTED
your choice, preferably using the highest level athlete possible. Use this table to record data for an individual
UNCORRECTED
possible. Use this table to record data for an individual athlete. You may undertake the analysis at school or
UNCORRECTED
athlete. You may undertake the analysis at school or outside school on the weekend, and you may record
UNCORRECTED
outside school on the weekend, and you may record the data while watching the game or make a digital
UNCORRECTED
the data while watching the game or make a digital recording of the game. If making a digital recording, UNCORRECTED
recording of the game. If making a digital recording,
PAGE This can then help enhance the specifi city of training.
PAGE This can then help enhance the specifi city of training.
1. The skill frequency table (data collection) shows a number of chest passes for a
PAGE 1. The skill frequency table (data collection) shows a number of chest passes for a
2. Analysis identifi es the biceps and triceps are used in an explosive manner.
PAGE 2. Analysis identifi es the biceps and triceps are used in an explosive manner.3. Resistance training could be used, targeting the bicep power.
PAGE 3. Resistance training could be used, targeting the bicep power.4. This could include bicep curls with a low–medium weight, fast speed and a work-
PAGE 4. This could include bicep curls with a low–medium weight, fast speed and a work-
PAGE PROOFS
muscle groups and movements used in performing each skill. For example, if the skill
PROOFSmuscle groups and movements used in performing each skill. For example, if the skill frequency table shows a high percentage of leaps or jumps, the major muscle groups
PROOFSfrequency table shows a high percentage of leaps or jumps, the major muscle groups
Muscle-use analysis is often neglected. It must be done in isolation from data
PROOFSMuscle-use analysis is often neglected. It must be done in isolation from data gathering because it relies on subjective observation. In muscle-use analysis, the
PROOFSgathering because it relies on subjective observation. In muscle-use analysis, the
which main muscle groups are used early in the match, and whether they are
PROOFSwhich main muscle groups are used early in the match, and whether they are
whether the muscle contraction is powerful and fast, or slow and repeated
PROOFSwhether the muscle contraction is powerful and fast, or slow and repeatedwhether muscle strength or muscle endurance is most important
PROOFS
whether muscle strength or muscle endurance is most importantwhat range of motion and fl exibility is exhibited. PROOFS
what range of motion and fl exibility is exhibited.This can then help enhance the specifi city of training. PROOFS
This can then help enhance the specifi city of training.

c07ActivityAnalysis 233 4 May 2017 1:41 PM
Movement patterns reveal typical activities completed by a performer during a game or an activity. They enable the coach or athlete to determine the fi tness components and energy systems that are used, and they provide (along with work-to-rest ratios and skill analysis) specifi c information required to develop training programs relevant to the athlete or team.
Movement patterns can be very important in helping determine the distance of efforts. Knowing the distance of sprints can determine which fi tness component (aerobic power, speed or anaerobic capacity) and which energy system are predominant. Shorter sprints with recovery suggest ATP–CP system, whereas longer lower-intensity efforts suggest aerobic power.
Equipment needed to record movement patterns of a player in a competitive setting includes:
� a diagram of the playing area, either on a piece of paper or a computer screen � a stopwatch or other device for recording time (the period of time for the movement is recorded and extrapolated to the full game or performance time period)
� a method of recording player movement; this can be a manual recording method or an electronic method (e.g. GPS tracking device)
� a list of skills to be recorded (and a code for each) that are pertinent to the activity (see fi gure 7.3 for an example).
Movement Code Movement Code
Sprinting — — — Cruising = = = = =
Mark M Tackle T
Shepherd S Guarding G
Backward movement B Sideway movement SI
Running ............ Walking ~~~~~~
Kick K Punch P
Jumping J Shuf� ing SH
Rebound R Jump shot JS
FIGURE 7.3 Example codes for various sports movements
Movement patterns are the typical movements completed by a performer during a game or an activity.
Unit 4 Movement patternsSummary screen and practice questions
AOS 1
Topic 1
Concept 3
InteractivityMovement analysisSearchlight ID: int-6805
KEY CONCEPT Movement patterns, most commonly recorded through the use of GPS technology, provide highly accurate information that can help determine the predominant energy systems and fitness components required in a sport or activity.
Methods of activity analysis: movement patterns7.3
CHAPTER 7 • Activity analysis 233
UNCORRECTED a method of recording player movement; this can be a manual recording method
UNCORRECTED a method of recording player movement; this can be a manual recording method
a list of skills to be recorded (and a code for each) that are pertinent to the activity
UNCORRECTED a list of skills to be recorded (and a code for each) that are pertinent to the activity
UNCORRECTED
UNCORRECTED
UNCORRECTED
UNCORRECTED
UNCORRECTED
UNCORRECTED
UNCORRECTED
UNCORRECTED
UNCORRECTED
UNCORRECTED
UNCORRECTED
UNCORRECTED
UNCORRECTED Movement
UNCORRECTED Movement
Cruising
UNCORRECTED Cruising
Tackle
UNCORRECTED Tackle
S
UNCORRECTED
S
B
UNCORRECTED
B
............
UNCORRECTED
............
Rebound
UNCORRECTED
Rebound
FIGURE 7.3
UNCORRECTED
FIGURE 7.3 Example codes for various sports movements
UNCORRECTED
Example codes for various sports movements
PAGE predominant. Shorter sprints with recovery suggest ATP–CP system, whereas longer
PAGE predominant. Shorter sprints with recovery suggest ATP–CP system, whereas longer
Equipment needed to record movement patterns of a player in a competitive setting
PAGE Equipment needed to record movement patterns of a player in a competitive setting
a diagram of the playing area, either on a piece of paper or a computer screen
PAGE a diagram of the playing area, either on a piece of paper or a computer screena stopwatch or other device for recording time (the period of time for the
PAGE a stopwatch or other device for recording time (the period of time for the movement is recorded and extrapolated to the full game or performance time
PAGE movement is recorded and extrapolated to the full game or performance time
a method of recording player movement; this can be a manual recording method PAGE a method of recording player movement; this can be a manual recording method
PROOFS
PROOFS
PROOFSMovement patterns
PROOFSMovement patterns are
PROOFSare the typical movements
PROOFSthe typical movements completed by a performer
PROOFScompleted by a performer
PROOFSefforts. Knowing the distance of sprints can determine which fi tness component
PROOFSefforts. Knowing the distance of sprints can determine which fi tness component (aerobic power, speed or anaerobic capacity) and which energy system are PROOFS
(aerobic power, speed or anaerobic capacity) and which energy system are predominant. Shorter sprints with recovery suggest ATP–CP system, whereas longer PROOFS
predominant. Shorter sprints with recovery suggest ATP–CP system, whereas longer
during a game or an activity.
PROOFSduring a game or an activity.
PROOFS
c07ActivityAnalysis 234 4 May 2017 1:41 PM
Methods of activity analysis: movement patterns7.3
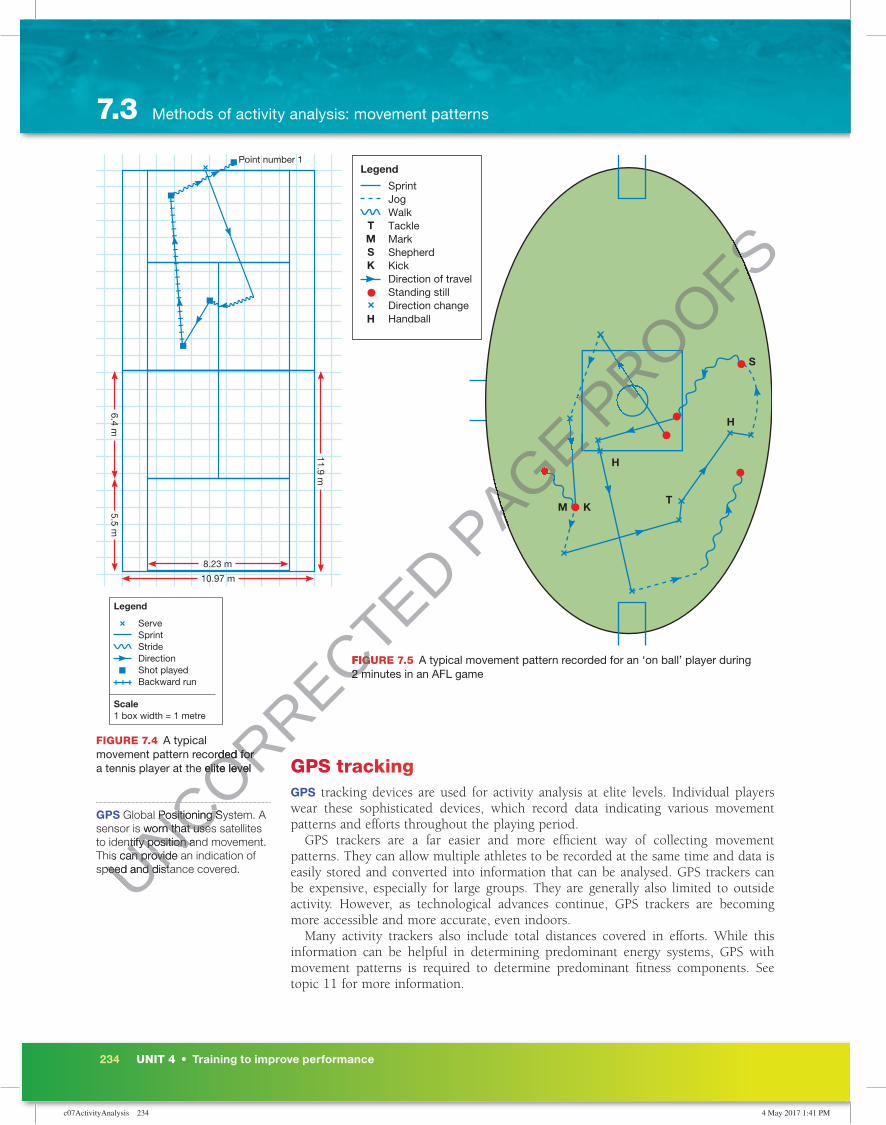
GPS trackingGPS tracking devices are used for activity analysis at elite levels. Individual players wear these sophisticated devices, which record data indicating various movement patterns and efforts throughout the playing period.
GPS trackers are a far easier and more effi cient way of collecting movement patterns. They can allow multiple athletes to be recorded at the same time and data is easily stored and converted into information that can be analysed. GPS trackers can be expensive, especially for large groups. They are generally also limited to outside activity. However, as technological advances continue, GPS trackers are becoming more accessible and more accurate, even indoors.
Many activity trackers also include total distances covered in efforts. While this information can be helpful in determining predominant energy systems, GPS with movement patterns is required to determine predominant fi tness components. See topic 11 for more information.
GPS Global Positioning System. A sensor is worn that uses satellites to identify position and movement. This can provide an indication of speed and distance covered.
Scale1 box width = 1 metre
Legend
ServeSprintStrideDirectionShot playedBackward run
11.9 m
10.97 m
5.5 m
8.23 m
6.4 m
Point number 1
FIGURE 7.4 A typical movement pattern recorded for a tennis player at the elite level
T
H
KM
H
S
Legend
SprintJogWalkTackleMarkShepherdKickDirection of travelStanding stillDirection changeHandball
TMSK
H
FIGURE 7.5 A typical movement pattern recorded for an ‘on ball’ player during 2 minutes in an AFL game
234 UNIT 4 • Training to improve performance
UNCORRECTED
UNCORRECTED
UNCORRECTED
Global Positioning System. A
UNCORRECTED
Global Positioning System. A sensor is worn that uses satellites
UNCORRECTED
sensor is worn that uses satellites to identify position and movement.
UNCORRECTED
to identify position and movement. This can provide an indication of
UNCORRECTED
This can provide an indication of speed and distance covered.UNCORRECTED
speed and distance covered.
movement pattern recorded for
UNCORRECTED
movement pattern recorded for a tennis player at the elite level
UNCORRECTED
a tennis player at the elite level
FIGURE 7.5
UNCORRECTED FIGURE 7.5 2 minutes in an AFL game
UNCORRECTED
2 minutes in an AFL game
PAGE
PAGE
PAGE
PAGE
PAGE
PAGE
PAGE
PAGE
PAGE
PAGE PROOFS
PROOFS
PROOFS
PROOFS
PROOFS
PROOFS
PROOFS
PROOFS
PROOFS
c07ActivityAnalysis 235 4 May 2017 1:41 PM
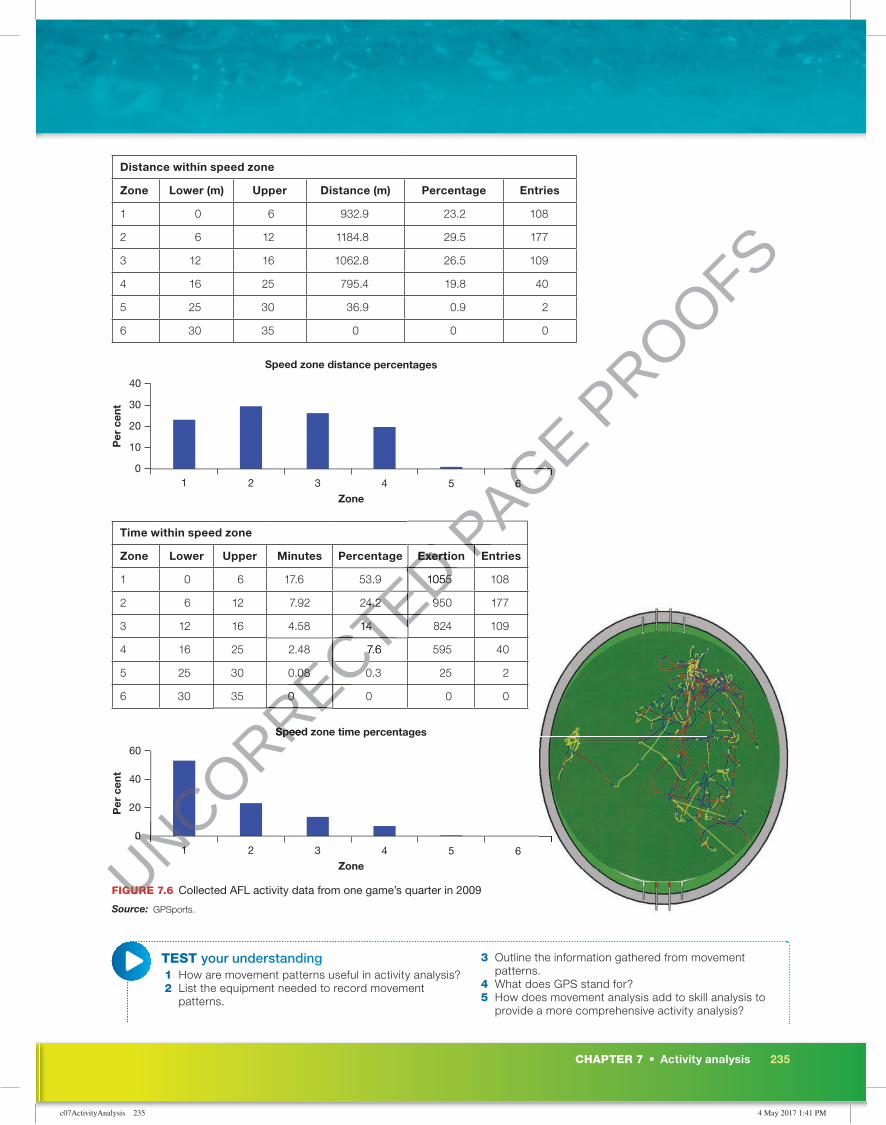
Distance within speed zone
Zone Lower (m) Upper Distance (m) Percentage Entries
1 0 6 932.9 23.2 108
2 6 12 1184.8 29.5 177
3 12 16 1062.8 26.5 109
4 16 25 795.4 19.8 40
5 25 30 36.9 0.9 2
6 30 35 0 0 0
Per
cen
t
Zone2 3 54 61
Speed zone distance percentages
0
10
20
30
40
Time within speed zone
Zone Lower Upper Minutes Percentage Exertion Entries
1 0 6 17.6 53.9 1055 108
2 6 12 7.92 24.2 950 177
3 12 16 4.58 14 824 109
4 16 25 2.48 7.6 595 40
5 25 30 0.08 0.3 25 2
6 30 35 0 0 0 0
Per
cen
t
Zone2 3 54 61
Speed zone time percentages
0
20
40
60
FIGURE 7.6 Collected AFL activity data from one game’s quarter in 2009
Source: GPSports.
TEST your understanding 1 How are movement patterns useful in activity analysis? 2 List the equipment needed to record movement
patterns.
3 Outline the information gathered from movement patterns.
4 What does GPS stand for? 5 How does movement analysis add to skill analysis to
provide a more comprehensive activity analysis?
CHAPTER 7 • Activity analysis 235
UNCORRECTED
UNCORRECTED
UNCORRECTED
UNCORRECTED
UNCORRECTED
UNCORRECTED
UNCORRECTED
UNCORRECTED
UNCORRECTED
UNCORRECTED
UNCORRECTED
UNCORRECTED
UNCORRECTED
UNCORRECTED
UNCORRECTED
UNCORRECTED
UNCORRECTED
UNCORRECTED
UNCORRECTED
UNCORRECTED
UNCORRECTED
UNCORRECTED
UNCORRECTED
UNCORRECTED
UNCORRECTED Exertion
UNCORRECTED Exertion
1055 108
UNCORRECTED 1055 108
24.2
UNCORRECTED 24.2 950
UNCORRECTED 950
14
UNCORRECTED 14
7.6
UNCORRECTED 7.6
0.08
UNCORRECTED
0.08 0.3
UNCORRECTED
0.3
0
UNCORRECTED
0
UNCORRECTED
1
UNCORRECTED
1
Speed zone time percentages
UNCORRECTED
Speed zone time percentages
0
UNCORRECTED
0
UNCORRECTED
UNCORRECTED
UNCORRECTED
UNCORRECTED
UNCORRECTED
UNCORRECTED
UNCORRECTED
UNCORRECTED
UNCORRECTED
UNCORRECTED
UNCORRECTED
UNCORRECTED
FIGURE 7.6 UNCORRECTED
FIGURE 7.6
PAGE 6
PAGE 6
PAGE
PAGE
PAGE
PAGE
PAGE
PAGE
PAGE
PAGE
PAGE
PAGE
EntriesPAGE
Entries
PROOFS

c07ActivityAnalysis 236 4 May 2017 1:41 PM
Methods of activity analysis: movement patterns7.3
APPLY your understanding 6
<LABEL FOR TABLE TO COME FROM AUTHOR AT REVISED PP>
Game time
Game time% Distance m/min.
HIPL/min PL/min
Low dist (%)
>8 km/hr
Mod dist (%)
>13 km/hr
High dist (%)
>18 km/hrTE(no.)
>26.5 km/hrTE dist
(m)
Max speed (km/hr)
Player A 47.8 75% 2612 46.5 0.4 7.0 75% 22% 0% 0 0 18.8
Player B 55.1 89% 4018 72.9 0.0 8.8 60% 37% 0% 0 0 19.9
Player C 62.8 100% 3160 50.9 0.1 6.8 68% 29% 0% 0 0 16.6
Player D 62.8 100% 3178 50.8 0.1 7.6 70% 28% 0% 0 0 17.9
Team ave 57 91% 3242 55 0.2 7.6 68% 29% 0% 0 0 18.3
* RED numbers are 1 standard deviation BELOW the average for that measure.* BLUE numbers are 1 standard deviation ABOVE the average for that measure.* Metres/min (m/min) – describes locomotor load. A measure of the metres covered per minute.* High intensity player load instances/min (HIPL/min) – describes player physicality. A measure of the number of rapid movements/high impact incidents (jumping, bodying, tackling) a player is involved in per minute. Ruckmen, inside mids and explosive/impact players expected to have high numbers (above group mean).* High metabolic power instances/min (HMP/min) – describes high energy cost activity. A measure of the number of high energy cost instances (hard acceleration/deceleration) per minute.* Player load/min (PL/min) – a summation of movement in all three planes per minute. Correlates highly to total distance as it includes the forces associated with foot strike during running.
The above information was gathered from four netballers. The positions played were Goal Keeper, Wing Defence, Goal Attack and Centre.(a) Based on the data collected, suggest which player played Centre.(b) Based on the data, suggest which player is most likely to need to include
the following in their training program: • longer runs • speed work • high impact activities.(c) Using players A and B, discuss how this information could be used to individualise training.
TABLE 7.2 GPS data of VFL game, North Ballarat Roosters Football Club
Player Time Game time % Odometer Meterage/
min Low %
<8 km/hModerate %
<13 km/h High %
<18 km/hMax. velocity
(km/h)
A 101.8 83% 12991 128.7 32% 55% 13% 28.2
B 93.9 77% 13734 146.2 29% 58% 13% 25.9
C 73.8 61% 10171 137.4 22% 62% 15% 25.2
D 95.8 78% 11331 118.2 40% 46% 13% 29.0
E 96.9 79% 12122 125.6 26% 57% 16% 26.2
F 114.3 93% 12251 107.5 34% 54% 12% 28.9
G 103.2 85% 13307 129.3 34% 50% 16% 27.9
H 114.3 93% 13155 114.9 46% 44% 8% 27.6
I 84.5 69% 10518 124.5 28% 57% 14% 27.6
J 91.2 74% 12180 133.2 34% 45% 21% 27.6
K 110.6 91% 14071 127.4 38% 48% 13% 27.2
L 88.4 72% 12705 143.7 26% 57% 17% 29.1
M 101.2 83% 13278 131.3 32% 52% 15% 30.2
N 100.9 83% 13215 131.5 33% 56% 11% 29.3
O 102.6 84% 12571 123.0 37% 48% 14% 28.2
P 100.4 82% 12070 121.7 21% 62% 17% 27.8
EXAM PRACTICE 7 Using the data in table 7.2, answer the following questions.
(a) Identify and justify what method of activity analysis has been used. 2 marks(b) Outline one example of physiological information that can be gained from this type of data. 1 mark(c) Describe how the information could be used by a coach to plan training. 3 marks
WeblinkAIS netball tracking technology
236 UNIT 4 • Training to improve performance
UNCORRECTED (c) Using players A and B, discuss how this information could be used to individualise training.
UNCORRECTED (c) Using players A and B, discuss how this information could be used to individualise training.
UNCORRECTED
UNCORRECTED
UNCORRECTED
UNCORRECTED
UNCORRECTED
UNCORRECTED
UNCORRECTED
UNCORRECTED
UNCORRECTED
UNCORRECTED
UNCORRECTED
UNCORRECTED
UNCORRECTED
UNCORRECTED
UNCORRECTED
UNCORRECTED
UNCORRECTED
UNCORRECTED
UNCORRECTED
UNCORRECTED
UNCORRECTED
UNCORRECTED
UNCORRECTED
UNCORRECTED
UNCORRECTED
UNCORRECTED
UNCORRECTED
UNCORRECTED
UNCORRECTED GPS data of VFL game, North Ballarat Roosters Football Club
UNCORRECTED GPS data of VFL game, North Ballarat Roosters Football Club
Player Time Game time % Odometer
UNCORRECTED Player Time Game time % Odometer
Meterage/
UNCORRECTED Meterage/
12991 128.7
UNCORRECTED 12991 128.7
13734
UNCORRECTED
13734
61%
UNCORRECTED
61% 10171
UNCORRECTED
10171
78%
UNCORRECTED
78%
79%
UNCORRECTED
79%
93%
UNCORRECTED
93%
103.2
UNCORRECTED
103.2 85%
UNCORRECTED
85%
114.3
UNCORRECTED
114.3 93%
UNCORRECTED
93%
84.5
UNCORRECTED
84.5
J
UNCORRECTED
J 91.2
UNCORRECTED
91.2
K
UNCORRECTED
K 110.6
UNCORRECTED
110.6
L
UNCORRECTED
L 88.4
UNCORRECTED
88.4
MUNCORRECTED
M
NUNCORRECTED
N
PAGE – describes high energy cost activity. A measure of the number of high energy cost instances (hard
PAGE – describes high energy cost activity. A measure of the number of high energy cost instances (hard
– a summation of movement in all three planes per minute. Correlates highly to total distance as it includes the forces associated with
PAGE – a summation of movement in all three planes per minute. Correlates highly to total distance as it includes the forces associated with
The above information was gathered from four netballers. The positions played were Goal Keeper, Wing Defence,
PAGE The above information was gathered from four netballers. The positions played were Goal Keeper, Wing Defence,
(a) Based on the data collected, suggest which player played Centre.
PAGE (a) Based on the data collected, suggest which player played Centre.(b) Based on the data, suggest which player is most likely to need to include
PAGE (b) Based on the data, suggest which player is most likely to need to include
PROOFS
PROOFS
PROOFS
PROOFS
PROOFS
PROOFS
PROOFS
PROOFS
PROOFS
PROOFS
PROOFS
PROOFS
PROOFS
PROOFS
PROOFS
PROOFSMax
PROOFSMax
speed
PROOFSspeed (km/hr)
PROOFS(km/hr)
0 0
PROOFS0 0 18.8
PROOFS18.8
0 0
PROOFS0 0 19.9
PROOFS19.9
0 0
PROOFS0 0 16.6
PROOFS16.6
0 0
PROOFS0 0
0 0
PROOFS0 0
– describes player physicality. A measure of the number of rapid movements/high impact incidents (jumping, PROOFS
– describes player physicality. A measure of the number of rapid movements/high impact incidents (jumping, bodying, tackling) a player is involved in per minute. Ruckmen, inside mids and explosive/impact players expected to have high numbers (above group mean).PROOFS
bodying, tackling) a player is involved in per minute. Ruckmen, inside mids and explosive/impact players expected to have high numbers (above group mean). – describes high energy cost activity. A measure of the number of high energy cost instances (hard PROOFS
– describes high energy cost activity. A measure of the number of high energy cost instances (hard

c07ActivityAnalysis 237 4 May 2017 1:41 PM
KEY CONCEPT Heart rate has long been associated with measuring efforts in physical activity. Heart rate monitors provide important information about the intensity at which an athlete is working.
Methods of activity analysis: heart rates7.4
A heart rate telemeter is a device (usually a watch) that provides data on a participant’s heart-rate response to physical activity. Heart rate is typically used to estimate physical activity as energy expenditure (oxygen uptake), based on the assumption of a linear association between heart rate and energy expenditure. Heart rate monitors therefore provide important information about the role of the energy systems; for example, intensity over 85% max heart rate would suggest the predominance of the anaerobic systems. Heart rate monitors involve reasonably low participant burden, especially now many monitors do not even require a chest strap, and can be used for most activities.
FIGURE 7.7 There is a huge range of � tness tracking devices and heart rate monitors on the market at present, a response to demand from consumers who are conscious about their health and � tness.
One major disadvantage of heart-rate monitoring is the need to calibrate the device to each individual. Another limitation is that during low-intensity exercise, the relationship between exercise intensity and heart rate is frequently not linear. At a low level of intensity, factors that affect heart rate such as stress, fear, excitement and changes in body temperature need to be considered as they may cause a false reading.
Unit 4 Heart ratesSummary screen and practice questions
AOS 1
Topic 1
Concept 4
Heart rate is usually measured in BPM (beats per minute).
CHAPTER 7 • Activity analysis 237
UNCORRECTED
UNCORRECTED
There is a huge range of � tness tracking devices and heart rate monitors on the
UNCORRECTED
There is a huge range of � tness tracking devices and heart rate monitors on the market at present, a response to demand from consumers who are conscious about their
UNCORRECTED
market at present, a response to demand from consumers who are conscious about their health and � tness.
UNCORRECTED
health and � tness.
One major disadvantage of heart-rate monitoring is the need to calibrate the
UNCORRECTED
One major disadvantage of heart-rate monitoring is the need to calibrate the
UNCORRECTED
device to each individual. Another limitation is that during low-intensity exercise,
UNCORRECTED
device to each individual. Another limitation is that during low-intensity exercise, the relationship between exercise intensity and heart rate is frequently not linear. At
UNCORRECTED
the relationship between exercise intensity and heart rate is frequently not linear. At a low level of intensity, factors that affect heart rate such as stress, fear, excitement UNCORRECTED
a low level of intensity, factors that affect heart rate such as stress, fear, excitement and changes in body temperature need to be considered as they may cause a false UNCORRECTED
and changes in body temperature need to be considered as they may cause a false reading.UNCORRECTED
reading.
PAGE
PAGE PROOFS
systems. Heart rate monitors involve reasonably low participant burden, especially
PROOFSsystems. Heart rate monitors involve reasonably low participant burden, especially now many monitors do not even require a chest strap, and can be used for most PROOFS
now many monitors do not even require a chest strap, and can be used for most

c07ActivityAnalysis 238 4 May 2017 1:41 PM
TEST your understanding 1 Describe the information that can be gathered from a heart rate monitor. 2 Provide two limitations of using heart rate monitors. 3 Suggest two activities to which heart rate monitoring would be best suited.
APPLY your understanding 4 Learning Activity: Tennis analysis
(a) What information does the following graph show about the game of tennis?(b) What conclusions can be made about tennis based on the heart rate?(c) What is most likely to have occurred between 6 minutes 30 seconds and
7 minutes 30 seconds?
190
180
170
160
150
140
130
120
Hea
rt r
ate
(bea
ts p
er m
inut
e)
Activity time (minutes)1 2 3 4 5 6 7 8 9 10
0
Pratical Activity Complete the following activities while wearing a heart rate monitor:
� 800 m jog � team game � body weight circuit, 1 minute work and 30 seconds rest
– situps – jumping lunges – push ups – plank – squats – tricep dips.
Compare your heart rate data for each of the activities. (a) When was your heart rate highest? Why?(b) When was your heart rate lowest? Why?(c) Compare your heart rate data to that of other students in your class. How would
a coach use this information?
Methods of activity analysis: heart rates7.4
238 UNIT 4 • Training to improve performance
UNCORRECTED
UNCORRECTED 130
UNCORRECTED 130
120
UNCORRECTED 120
UNCORRECTED
UNCORRECTED
UNCORRECTED
5
UNCORRECTED
5 Pratical Activity
UNCORRECTED
Pratical Activity
UNCORRECTED
PAGE
PAGE
PAGE
PAGE
PAGE PROOFS
PROOFS
PROOFS(a) What information does the following graph show about the game of tennis?
PROOFS(a) What information does the following graph show about the game of tennis?(b) What conclusions can be made about tennis based on the heart rate?
PROOFS(b) What conclusions can be made about tennis based on the heart rate?(c) What is most likely to have occurred between 6 minutes 30 seconds and
PROOFS(c) What is most likely to have occurred between 6 minutes 30 seconds and
PROOFS
PROOFS

c07ActivityAnalysis 239 4 May 2017 1:41 PM
EXAM practice 6 (ACHPER Trial Exam 2015, question 13c)
Sharon and Katherine decided that the Cooper 12-minute run test was a speci� c test to assess their aerobic capacity before undertaking their training program. They both completed the test to the best of their ability. During the Cooper 12-minute run test, the students’ heart rate data (measured in beats per minute) were collected and are presented in the table below.
Refer to the table below to answer questions 6(a) and (b).
Heart rate: Sharon
Heart rate: Katherine
Resting heart rate 72 61
Immediately before run 96 98
At the conclusion of 1st minute 160 170
At the conclusion of 2nd minute 170 171
At the conclusion of 3rd minute 171 170
At the conclusion of 4th minute 170 171
At the conclusion of 5th minute 170 172
At the conclusion of 6th minute 171 171
At the conclusion of 7th minute 172 172
At the conclusion of 8th minute 172 172
At the conclusion of 9th minute 172 172
At the conclusion of 10th minute 172 171
At the conclusion of 11th minute 185 188
At the conclusion of 12 minute 200 198
1 minute following run 185 172
2 minutes following run 171 161
3 minutes following run 165 133
(a) Which energy pathways are likely to be used during the � rst minute of the test by both girls? Justify your selection. 2 marks
(b) Discuss two limitations of using heart rate monitors as the only method of data collection. 2 marks
(c) Identify and justify, using the data, if steady state was reached for Sharon. 2 marks
CHAPTER 7 • Activity analysis 239
UNCORRECTED
UNCORRECTED
UNCORRECTED
UNCORRECTED
UNCORRECTED
UNCORRECTED
UNCORRECTED
UNCORRECTED
UNCORRECTED
UNCORRECTED
UNCORRECTED
UNCORRECTED
UNCORRECTED
UNCORRECTED
UNCORRECTED
UNCORRECTED
UNCORRECTED
UNCORRECTED
UNCORRECTED
UNCORRECTED 172
UNCORRECTED 172
172
UNCORRECTED 172
172
UNCORRECTED 172
185
UNCORRECTED 185
At the conclusion of 12 minute
UNCORRECTED At the conclusion of 12 minute
2 minutes following run
UNCORRECTED
2 minutes following run
3 minutes following run
UNCORRECTED
3 minutes following run
(a) Which energy pathways are likely to be used during the � rst minute of the test by
UNCORRECTED
(a) Which energy pathways are likely to be used during the � rst minute of the test by both girls? Justify your selection.
UNCORRECTED
both girls? Justify your selection. (b) Discuss two limitations of using heart rate monitors as the only method of data
UNCORRECTED
(b) Discuss two limitations of using heart rate monitors as the only method of data collection.
UNCORRECTED
collection. (c) Identify and justify, using the data, if steady state was reached for
UNCORRECTED
(c) Identify and justify, using the data, if steady state was reached for Sharon.
UNCORRECTED
Sharon.
UNCORRECTED PAGE
PAGE
PAGE
PAGE
PAGE
PAGE
PAGE
PAGE
PAGE
PAGE
PAGE
PAGE
PAGE
PAGE 171
PAGE 171
172
PAGE 172
171
PAGE 171
172PAGE 172
PROOFS
PROOFS

c07ActivityAnalysis 240 4 May 2017 1:41 PM
The work-to-rest ratio is used to assess, during competition, the time spent physically working compared to the time spent resting or recovering. Data about work and rest periods are vital in determining an athlete’s energy systems and intensity of effort. Activity analysis calculates work-to-rest ratios (also known as work–rest ratios), which provide information that should underpin decisions about methods of training, work intervals and rest intervals.
To determine work-to-rest ratios, standing still, walking and slow jogging may be classifi ed as rest, while all other movements are classifi ed as work. To record work-to-rest ratios manually, record all work efforts on one stopwatch and all rest periods on another. Once the activity is complete, you have a work-to-rest ratio; for example, for 5 minutes’ total work and 20 minutes’ total rest, the ratio is 5:20 or 1:4. The intensity of the work efforts should also be noted because this information is important in determining energy system requirements. Ideally, you could use a heartrate monitor to determine the intensity of each effort or work period, expressing the recorded heart rate as a percentage of the athlete’s maximum heart rate.
When analysing work and rest data, determine the following information: � total work time and total rest time � average work time per effort and average rest time � longest work time and longest rest time � the work-to-rest ratio.
TABLE 7.3 Work-to-rest ratios associated with each energy system
Work-to-rest ratio Energy system
1:5 and above (rest signi� cantly higher than work) ATP–CP
1:3–1:4 (rest higher than work) Anaerobic glycolysis
1:1–1:2 or 2:1 or above (work similar to rest OR work higher than work) rest
Aerobic
Work-to-rest ratios can be very useful for intermittent sports such as team games.It can, however, be very time consuming and diffi cult to collect and analyse the
information. Many computer programs and apps are making this easier. While they only provide information about the role of the energy systems, this can be vital information to replicate during training to ensure specifi city for all athletes.
TABLE 7.4 Work-to-rest ratio throughout a 2-minute time sample during a game of basketball
W R W R W R W R
10 21 5 10 6 10 4 9
The above W:R ratio was manually calculated using observation and a stopwatch during a Year 12 PE class of basketball. The W:R above is equal to 25:50 which can be simplifi ed to 1:2. This suggests that, for this passage of play for this player, the aerobic energy system was predominant.
Work-to-rest ratio is a summary of the time an athlete spends physically working compared to the time spent resting or recovering.
KEY CONCEPT All sporting events include times when the performer is resting and times in which they are working. The ratios between each state and the relative exertion levels between each are essential parts of activity analysis.
Methods of activity analysis: work-to-rest ratios7.5
240 UNIT 4 • Training to improve performance
UNCORRECTED average work time per effort and average rest time
UNCORRECTED average work time per effort and average rest timelongest work time and longest rest time
UNCORRECTED longest work time and longest rest timethe work-to-rest ratio.
UNCORRECTED the work-to-rest ratio.
Work-to-rest ratios associated with each energy system
UNCORRECTED Work-to-rest ratios associated with each energy system
UNCORRECTED
UNCORRECTED
UNCORRECTED
UNCORRECTED Work-to-rest ratio
UNCORRECTED Work-to-rest ratio
1:5 and above (rest signi� cantly higher than work)
UNCORRECTED 1:5 and above (rest signi� cantly higher than work)
1:3–1:4 (rest higher than work)
UNCORRECTED
1:3–1:4 (rest higher than work)
1:1–1:2 or 2:1 or above (work similar to rest OR work higher than
UNCORRECTED
1:1–1:2 or 2:1 or above (work similar to rest OR work higher than work) rest
UNCORRECTED
work) rest
PAGE rest ratios manually, record all work efforts on one stopwatch and all rest periods on
PAGE rest ratios manually, record all work efforts on one stopwatch and all rest periods on another. Once the activity is complete, you have a work-to-rest ratio; for example, for
PAGE another. Once the activity is complete, you have a work-to-rest ratio; for example, for 5 minutes’ total work and 20 minutes’ total rest, the ratio is 5:20 or 1:4. The intensity
PAGE 5 minutes’ total work and 20 minutes’ total rest, the ratio is 5:20 or 1:4. The intensity of the work efforts should also be noted because this information is important in
PAGE of the work efforts should also be noted because this information is important in determining energy system requirements. Ideally, you could use a heartrate monitor
PAGE determining energy system requirements. Ideally, you could use a heartrate monitor to determine the intensity of each effort or work period, expressing the recorded heart
PAGE to determine the intensity of each effort or work period, expressing the recorded heart rate as a percentage of the athlete’s maximum heart rate.
PAGE rate as a percentage of the athlete’s maximum heart rate.
When analysing work and rest data, determine the following information:PAGE When analysing work and rest data, determine the following information:total work time and total rest timePAGE total work time and total rest timeaverage work time per effort and average rest timePAGE
average work time per effort and average rest time
PROOFS is used to assess, during competition, the time spent physically
PROOFS is used to assess, during competition, the time spent physically working compared to the time spent resting or recovering. Data about work and rest
PROOFSworking compared to the time spent resting or recovering. Data about work and rest periods are vital in determining an athlete’s energy systems and intensity of effort.
PROOFSperiods are vital in determining an athlete’s energy systems and intensity of effort.
(also known as work–rest ratios), which
PROOFS(also known as work–rest ratios), which
provide information that should underpin decisions about methods of training, work
PROOFSprovide information that should underpin decisions about methods of training, work
To determine work-to-rest ratios, standing still, walking and slow jogging may be
PROOFSTo determine work-to-rest ratios, standing still, walking and slow jogging may be
classifi ed as rest, while all other movements are classifi ed as work. To record work-to-PROOFS
classifi ed as rest, while all other movements are classifi ed as work. To record work-to-rest ratios manually, record all work efforts on one stopwatch and all rest periods on PROOFS
rest ratios manually, record all work efforts on one stopwatch and all rest periods on another. Once the activity is complete, you have a work-to-rest ratio; for example, for PROOFS
another. Once the activity is complete, you have a work-to-rest ratio; for example, for

c07ActivityAnalysis 241 4 May 2017 1:41 PM
TEST your understanding 1 De� ne the term work-to-rest ratio. 2 Outline two limitations of using the work-to-rest ratio. 3 Identify what energy system is associated with the following work-to-rest ratios:
1:41:63:1
APPLY your understanding 4 Observe (directly or digitally) a sport of your choice for three two-minute blocks.
(a) Record the work-to-rest ratio for each two-minute block.(b) Calculate the W:R.(c) Which energy system does this W:R suggest is predominant?(d) Are the W:R and energy system the same for each two-minute block? Why or
why not?
EXAM practice 5 A recent analysis of a game of grass-court tennis played between two
competitors provided the following data: � average rally time — 5.3 seconds � average rest between rallies — 17.5 seconds � length of the match in total — 3.5 hours � length of time the ball was in play — 19 minutes, 20 seconds � time spent changing ends and between games — 73 minutes.
(a) Explain why is it important to undertake an analysis before developing a � tness program for an athlete. 2 marks
(b) Justify the role of each energy system in tennis using the data above. 3 marks(c) Calculate the work-to-rest ratio from this data set. 1 mark
Unit 4 Work to rest ratiosSummary screen and practice questions
AOS 1
Topic 1
Concept 5
CHAPTER 7 • Activity analysis 241
UNCORRECTED
UNCORRECTED (b) Justify the role of each energy system in tennis using the data above.
UNCORRECTED (b) Justify the role of each energy system in tennis using the data above. (c) Calculate the work-to-rest ratio from this data set.
UNCORRECTED (c) Calculate the work-to-rest ratio from this data set. PAGE length of time the ball was in play — 19 minutes, 20 seconds
PAGE length of time the ball was in play — 19 minutes, 20 secondstime spent changing ends and between games — 73 minutes.
PAGE time spent changing ends and between games — 73 minutes.
(a) Explain why is it important to undertake an analysis before developing a � tness PAGE (a) Explain why is it important to undertake an analysis before developing a � tness
(b) Justify the role of each energy system in tennis using the data above. PAGE
(b) Justify the role of each energy system in tennis using the data above.
PROOFS
PROOFS

c07ActivityAnalysis 242 4 May 2017 1:41 PM
KEY CONCEPT Netball is a team sport that has seven very different positions. Each position requires significantly different physiological requirements. Completing activity analysis can help a coach ensure that each player, no matter the position, can achieve optimal results from training.
Netball case study7.6
Data collectionThe fi rst step of activity analysis is data collection.
The following data was collected during an A-grade netball game from a 20 year old playing Centre. GPS and heart rate were recorded using digital recording (stored in electronic devices). Movement patterns, work-to-rest ratios and skill frequency table were collected using direct observation.
GPS data
FIGURE 7.8 The movement patterns of the Centre during a game of netball.
TABLE 7.5 GPS data for netball Centre
Game time
Game time% Distance m/min.
HIPL/min PL/min
Low dist (%)
>8 km/hr
Mod dist (%)
>13 km/hr
High dist (%)
>18 km/hrTE (no.)
>26.5 km/hrTE dist
(m)
Max speed (km/hr)
Centre 55.1 89% 4018 72.9 0.0 8.8 60% 37% 0% 0 0 19.9
Red numbers are 1 standard deviation BELOW the average for that measure.Blue numbers are 1 standard deviation ABOVE the average for that measure.Metres/min (m/min) describes locomotor load. A measure of the metres covered per minute.High intensity player load instances/min (HIPL/min) describes player physicality. A measure of the number of rapid movements/high impact incidents (jumping, bodying, tackling) a player is involved in per minute. Ruckmen, inside mids and explosive/impact players expected to have high numbers (above group mean).High metabolic power instances/min (HMP/min) describes high energy cost activity. A measure of the number of high energy cost instances (hard acceleration/deceleration) per minute.Player load/min (PL/min) is a summation of movement in all three planes per minute. Correlates highly to total distance as it includes the forces associated with foot strike during running.
242 UNIT 4 • Training to improve performance
UNCORRECTED
UNCORRECTED
GPS data for netball Centre
UNCORRECTED
GPS data for netball Centre
UNCORRECTED
UNCORRECTED
UNCORRECTED
Game
UNCORRECTED
Game timeUNCORRECTED
time
Game
UNCORRECTED
Game
CentreUNCORRECTED
Centre
PAGE
PAGE PROOFS
The following data was collected during an A-grade netball game from a 20 year old
PROOFSThe following data was collected during an A-grade netball game from a 20 year old
playing Centre. GPS and heart rate were recorded using digital recording (stored in
PROOFSplaying Centre. GPS and heart rate were recorded using digital recording (stored in electronic devices). Movement patterns, work-to-rest ratios and skill frequency table
PROOFSelectronic devices). Movement patterns, work-to-rest ratios and skill frequency table

c07ActivityAnalysis 243 4 May 2017 1:41 PM
Heart rate with GPS12
:50:
00
12:5
5:00
13:0
0:00
13:0
5:00
13:1
0:00
13:1
5:00
13:2
0:00
13:2
5:00
13:3
0:00
13:3
5:00
13:4
0:00
13:4
5:00
13:5
0:00
13:5
5:00
14:0
0:00
14:0
5:00
14:1
0:00
14:1
5:00
14:2
0:00
14:2
5:00
14:3
0:00
14:3
5:00
Sp
eed
(km
/h)
HR
(bp
m)
0
2
4
6
8
10
12
14
16
18
20
406080100120140160180200220240
14:4
0:00
Speed (km/h)HR (bpm) Multi select Series bottom quarter
Work-to-rest ratioTaken from second quarter.
Work: anything above walking pace.Rest: walking and standing still.
TABLE 7.6 Work-to-rest ratio for netball Centre
Mean work
period (seconds)
Mean rest
period (seconds)
Mean work–rest
ratio
Max. work
duration (seconds)
Max. rest duration
(seconds)
Max work-to- rest ratio
Centre 2 4 1:2 9 69 1:8
Skill frequency tableTaken from the fi rst quarter (15 minutes).
TABLE 7.7
Skill Frequency
Pass 45
Catch 34
Dodge 23
Sprint 28
Defend 10
Jump 14
Walk 24
Run backwards 17
Data analysisAfter the data has been collected, it needs to be analysed. The more data you can collect, the more accurate your analysis is likely to be.
� Total distance covered (4018 m) suggests aerobic power and aerobic energy system are important.
� Max speed was 19.9 km/hr, which suggests speed is important.
CHAPTER 7 • Activity analysis 243
UNCORRECTED
UNCORRECTED
UNCORRECTED
UNCORRECTED work
UNCORRECTED work duration
UNCORRECTED duration (seconds)
UNCORRECTED (seconds)
9
UNCORRECTED 9
Taken from the fi rst quarter (15 minutes).
UNCORRECTED Taken from the fi rst quarter (15 minutes).
UNCORRECTED
UNCORRECTED
UNCORRECTED
UNCORRECTED
UNCORRECTED
UNCORRECTED
UNCORRECTED
UNCORRECTED
UNCORRECTED
UNCORRECTED
UNCORRECTED
Frequency
UNCORRECTED
Frequency
45
UNCORRECTED
45
34
UNCORRECTED
34
Defend
UNCORRECTED
Defend
Jump
UNCORRECTED
Jump
WalkUNCORRECTED
Walk
Run backwardsUNCORRECTED
Run backwards
PAGE
PAGE
Max. rest PAGE
Max. rest duration PAGE
duration
PROOFS
c07ActivityAnalysis 244 4 May 2017 1:41 PM
� GPS movement patterns show that the total distance is made up of many shorter and repeated efforts suggesting anaerobic capacity is important.
� Much of the game time is spent in the aerobic training zone (70–85% MHR) suggesting aerobic power is important.
� LIP is important as the athlete works a signifi cant amount of time around 85% MHR.
� Speed varies greatly and suggests repeated high-intensity efforts with little recovery, therefore anaerobic capacity is important.
� The duration of the match suggests aerobic power is important. � Mean W:R ratio suggests aerobic energy system is important. � The high number of passes in the skill frequency table suggests upper body muscular power is important.
� The high number of catches in the skill frequency table suggests hand–eye coordination is important.
� The high number of dodges in the skill frequency table suggests agility is important. � The high number of sprints in the skill frequency table suggests speed is important.
Planning a training programOnce the analysis is completed, the information can be used to help plan a specifi c training program. It is important to note that the above process should be completed for all positions in a sport. While there may be similarities within sports, different positions often require different fi tness components, energy systems and muscle movements.
Based on the data provided, the following should be considered when planning a program for a netball Centre.
Fitness componentsBased on the data analysis, the important fi tness components for a netball Centre are:
� aerobic power � anaerobic capacity � speed � agility � upper body power � hand–eye coordination.
Energy systemsBased on the data analysis, the most important energy system for a netball Centre is the aerobic energy system. The ATP–CP system would assist in allowing the athlete to sprint and pass. Given that there is a lot of opportunity for recovery, the anaerobic glycolysis system is only likely to be predominant if the sprints and passes are repeated with insuffi cient recovery.
Muscles and muscle groups � Upper body (deltoid, pectorals, bicep, tricep, fl exors and extensors) � Lower body (quadriceps, hamstrings, gastrocnemius, soleus, gluteals) � Core muscles to allow effi ciency in running and changing direction (abdominals, obliques)
Fitness testing (see topic 9 for more details)The following tests would be best used as they replicate the requirements (muscles and movements) of netball.
� Aerobic power: a test that mimics the change of intensity, stop and start nature, e.g. yYo-yo test
Netball case study7.6
244 UNIT 4 • Training to improve performance
UNCORRECTED Based on the data provided, the following should be considered when planning a
UNCORRECTED Based on the data provided, the following should be considered when planning a program for a netball Centre.
UNCORRECTED program for a netball Centre.
Fitness components
UNCORRECTED Fitness componentsBased on the data analysis, the important fi tness components for a netball Centre are:
UNCORRECTED Based on the data analysis, the important fi tness components for a netball Centre are:
aerobic power
UNCORRECTED aerobic power
UNCORRECTED anaerobic capacity
UNCORRECTED anaerobic capacityspeed
UNCORRECTED speed
�
UNCORRECTED
� agility
UNCORRECTED
agility�
UNCORRECTED
� upper body power
UNCORRECTED
upper body power�
UNCORRECTED
� hand–eye coordination.
UNCORRECTED
hand–eye coordination.
Energy systems
UNCORRECTED
Energy systems
PAGE Planning a training program
PAGE Planning a training programOnce the analysis is completed, the information can be used to help plan a specifi c
PAGE Once the analysis is completed, the information can be used to help plan a specifi c training program. It is important to note that the above process should be completed
PAGE training program. It is important to note that the above process should be completed for all positions in a sport. While there may be similarities within sports, different
PAGE for all positions in a sport. While there may be similarities within sports, different positions often require different fi tness components, energy systems and muscle
PAGE positions often require different fi tness components, energy systems and muscle
Based on the data provided, the following should be considered when planning a PAGE
Based on the data provided, the following should be considered when planning a
PROOFSLIP is important as the athlete works a signifi cant amount of time around 85%
PROOFSLIP is important as the athlete works a signifi cant amount of time around 85%
Speed varies greatly and suggests repeated high-intensity efforts with little
PROOFSSpeed varies greatly and suggests repeated high-intensity efforts with little
The high number of passes in the skill frequency table suggests upper body
PROOFSThe high number of passes in the skill frequency table suggests upper body
The high number of catches in the skill frequency table suggests hand–eye
PROOFSThe high number of catches in the skill frequency table suggests hand–eye
The high number of dodges in the skill frequency table suggests agility is important.
PROOFS
The high number of dodges in the skill frequency table suggests agility is important.The high number of sprints in the skill frequency table suggests speed is important.PROOFS
The high number of sprints in the skill frequency table suggests speed is important.
c07ActivityAnalysis 245 4 May 2017 1:41 PM
� Anaerobic capacity: a test that has repeated sprint efforts, e.g. Phosphate recovery test � Speed: a test that is not longer than 20 m, e.g. 20 m sprint � Agility: tests that either involve ‘weaving’ or short sharp changes of direction, e.g. Illinois agility test or 5-0-5 agility test
� Upper body power: tests that involve the upper body muscles, e.g. basketball throw
Training methods (see topic 11 for more details) � Aerobic power: fartlek or long-interval training to replicate the change in intensity and stop and start nature
� Anaerobic capacity: short interval to replicate the distances typically covered (no more than 20 m)
� Speed: short interval to replicate the distances typically covered (no more than 20 m) � Agility: short interval with changes of direction, e.g. shuttle runs, to replicate the movements and distances covered
� Upper body power: upper body plyometrics, e.g. medicine ball slams, to replicate the muscles and muscle groups used in passing
TEST your understanding 1 List the different types of activity analysis used in the netball case study. 2 For each method of activity analysis listed in question 1 to be consistent, outline
what information can be gained from this method. 3 Identify an advantage and a disadvantage of using digital recording.
APPLY your understanding 4 Watch a game of netball (preferably elite netball).
(a) Discuss whether the same � tness tests and training methods would be used for a Goal Keeper (GK) and Goal Attack (GA). Use speci� c examples to justify your response.
5 Complete an activity analysis for a sport of your choice.(a) Collect at least three pieces of data.(b) Analyse the data to identify and justify the predominant � tness components,
energy systems and muscles.
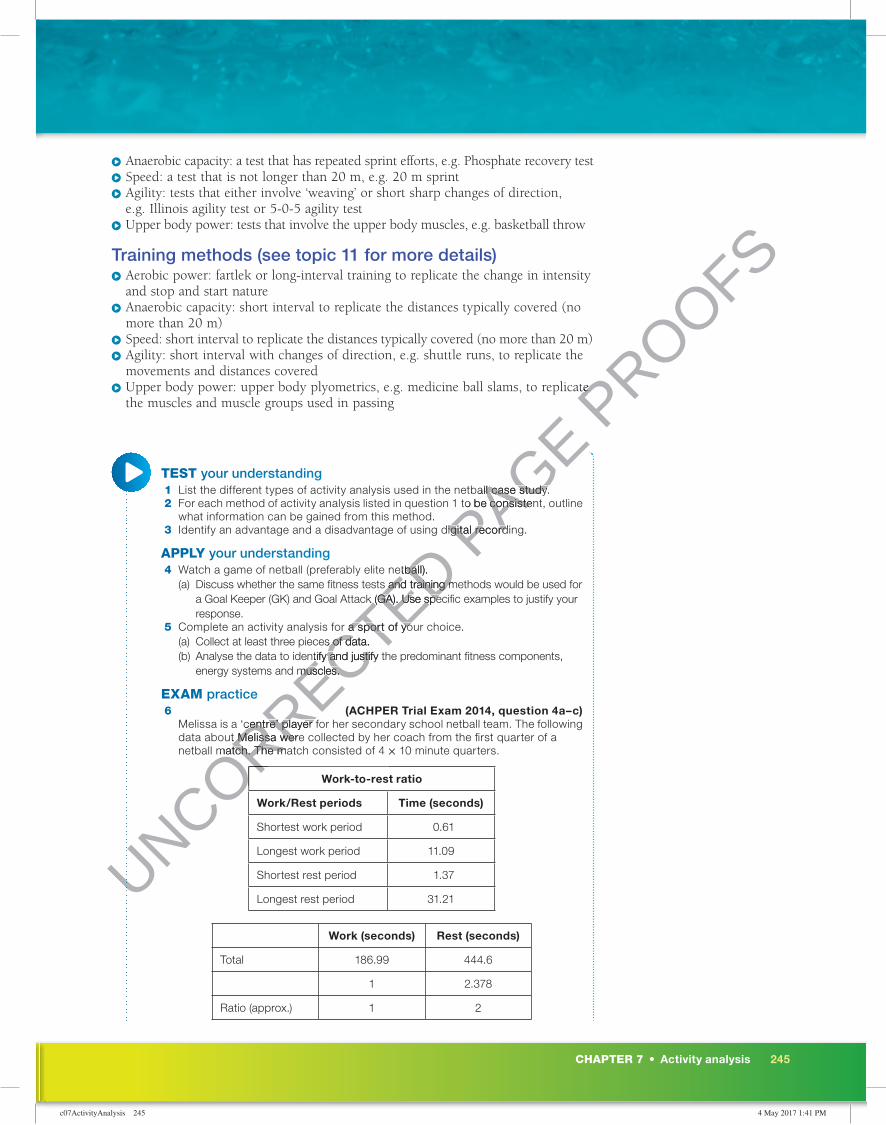
EXAM practice 6 (ACHPER Trial Exam 2014, question 4a–c) Melissa is a ‘centre’ player for her secondary school netball team. The following
data about Melissa were collected by her coach from the � rst quarter of a netball match. The match consisted of 4 × 10 minute quarters.
Work-to-rest ratio
Work/Rest periods Time (seconds)
Shortest work period 0.61
Longest work period 11.09
Shortest rest period 1.37
Longest rest period 31.21
Work (seconds) Rest (seconds)
Total 186.99 444.6
1 2.378
Ratio (approx.) 1 2
CHAPTER 7 • Activity analysis 245
UNCORRECTED
UNCORRECTED
UNCORRECTED Watch a game of netball (preferably elite netball).
UNCORRECTED Watch a game of netball (preferably elite netball).(a) Discuss whether the same � tness tests and training methods would be used for
UNCORRECTED (a) Discuss whether the same � tness tests and training methods would be used for
a Goal Keeper (GK) and Goal Attack (GA). Use speci� c examples to justify your
UNCORRECTED a Goal Keeper (GK) and Goal Attack (GA). Use speci� c examples to justify your
Complete an activity analysis for a sport of your choice.
UNCORRECTED Complete an activity analysis for a sport of your choice.(a) Collect at least three pieces of data.
UNCORRECTED (a) Collect at least three pieces of data.(b) Analyse the data to identify and justify the predominant � tness components,
UNCORRECTED (b) Analyse the data to identify and justify the predominant � tness components,
energy systems and muscles.
UNCORRECTED
energy systems and muscles.
Melissa is a ‘centre’ player for her secondary school netball team. The following
UNCORRECTED
Melissa is a ‘centre’ player for her secondary school netball team. The following data about Melissa were collected by her coach from the � rst quarter of a
UNCORRECTED
data about Melissa were collected by her coach from the � rst quarter of a netball match. The match consisted of 4
UNCORRECTED
netball match. The match consisted of 4
UNCORRECTED
UNCORRECTED PAGE
PAGE
PAGE List the different types of activity analysis used in the netball case study.
PAGE List the different types of activity analysis used in the netball case study.For each method of activity analysis listed in question 1 to be consistent, outline
PAGE For each method of activity analysis listed in question 1 to be consistent, outline
Identify an advantage and a disadvantage of using digital recording.PAGE Identify an advantage and a disadvantage of using digital recording.
PROOFS
Upper body power: upper body plyometrics, e.g. medicine ball slams, to replicate PROOFS
Upper body power: upper body plyometrics, e.g. medicine ball slams, to replicate

c07ActivityAnalysis 246 4 May 2017 1:41 PM
Netball case study7.6
Skills and their frequency
Skill Frequency
Chest pass 9
Overhead pass 15
Catch 18
Jump 13
Guard 8
Defend 13
Leap forwards 15
Leap sideways 7
Change of direction 55
Centre pass 5
Loco-motion Intensity
0–5 metres
6–10 metres
11–15 metres
16+ metres
Total (count)
Distance metres
% Total
Average metres
Walk Low 12 7 3 2 24 111 26 4.6
Jog Low-medium
12 7 1 1 21 147 35 7.0
Sprint High 11 9 1 0 21 127 30 4.8
Shuf� e Very high 18 4 0 0 22 36 9 1.6
Totals 53 27 5 3 421 100%
(a) Data were collected by the coach to ensure accurate application of which training principle? 1 mark
(b) Identify two � tness components that Melissa would require to be a successful centre player. 2 marks
(c) Using the data provided, justify your choices in part b above. 4 marks
Locomotor patterns
246 UNIT 4 • Training to improve performance
UNCORRECTED
UNCORRECTED
UNCORRECTED
UNCORRECTED
UNCORRECTED
UNCORRECTED
UNCORRECTED
UNCORRECTED
UNCORRECTED
UNCORRECTED
UNCORRECTED
UNCORRECTED
UNCORRECTED
UNCORRECTED
UNCORRECTED
UNCORRECTED
UNCORRECTED
UNCORRECTED
UNCORRECTED
UNCORRECTED 12
UNCORRECTED 12
11
UNCORRECTED 11 9
UNCORRECTED 9
Very high
UNCORRECTED Very high 18
UNCORRECTED 18
53
UNCORRECTED 53
(a) Data were collected by the coach to ensure accurate application of which training
UNCORRECTED (a) Data were collected by the coach to ensure accurate application of which training
principle?
UNCORRECTED principle?
(b) Identify two � tness components that Melissa would require to be a successful
UNCORRECTED
(b) Identify two � tness components that Melissa would require to be a successful
PAGE
PAGE
PAGE
PAGE
PAGE
PAGE
PAGE
PAGE
PAGE
PAGE
PAGE
PAGE
PAGE
PAGE
PAGE
PAGE
PAGE
PAGE
PAGE
PAGE
PAGE
PAGE
PAGE 6–10
PAGE 6–10
metres
PAGE metres
11–15
PAGE 11–15
metres
PAGE metres
7PAGE 7 3 2PAGE
3 2
7PAGE
7
PROOFS
PROOFS
PROOFS
PROOFS
PROOFS
PROOFS
PROOFS
PROOFS
PROOFS
PROOFS13
PROOFS13
15
PROOFS
15
7PROOFS
7

c07ActivityAnalysis 247 4 May 2017 1:41 PM
KEY SKILLS ACTIVITY ANALYSIS
KEY SKILLS
� Analyse data to determine the major � tness components and the factors that affect them, and energy systems used in a variety of sporting events and physical activities
UNDERSTANDING THE KEY SKILLS
To address these key skills, it is important to remember the following: � The purpose of activity analysis is to determine the predominant energy systems, � tness
components and muscle groups to ensure speci� city in the training programs (tests and methods used, as well as the individual sessions)
� Characteristics of the energy systems including duration and intensity
PRACTICE QUESTION
1 (ACHPER Trial Exam 2013, question 10)The following data were collected from a 15-minute quarter of a Netball game for a Centre player.
Table 1Skill frequency
Skill Frequency
Lob pass 0
Bounce pass 1
Chest pass 23
Receive ball 9
Defend 22
Table 2Average percentage of game time for
each activity during the quarter
Standing 14.3
Walk forward 24.5
Walk backwards 8.8
Shuf� e 4.0
Jog 18.3
Stride 24.8
Sprint 9.3
(a) Identify one way in which this data could have been collected. 1 mark(b) Outline two reasons for the collection of data. 2 marks
SAMPLE RESPONSE
a. Direct observation (skill) OR GPS (movement patterns) b. This would be collected to help determine the predominant � tness components and energy
systems required for successful performance. This can then help develop a speci� c training program.
� yellow identify the action word
� pink key terminology � blue key concepts � light grey marks/marking scheme
STRATEGIES TO DECODE THE QUESTION
� Identify the action words:Identify — determine the key characteristics or featuresOutline — general description but not in detail
� Key terminology:One way — only one required, pick best oneReasons — why collect data, role in training program
� Key concepts:Data collection — data collection plays a very important role in ensuring the training program is speci� c
� Marking scheme:3 marks — always check marking scheme for the depth of response required, linking to key information highlighted in the question
HOW THE MARKS ARE AWARDED
a. � 1 mark: for identifying GPS or direct observation as the method of data collection
b. � 1 mark: for each of two reasons for the collection of data. Two different reasons required to receive full marks.
Possible answers include:To establish the major muscle groups involved in the activity.ORTo determine energy system usage.ORTo determine the major � tness components of the activity.ORTo establish the major skills required in the activity.ORTo develop a more speci� c training program based on the information collected.
CHAPTER 7 • Activity analysis 247
UNCORRECTED
UNCORRECTED
UNCORRECTED
UNCORRECTED
UNCORRECTED Jog
UNCORRECTED Jog
Stride
UNCORRECTED Stride
Sprint
UNCORRECTED Sprint
UNCORRECTED
UNCORRECTED
UNCORRECTED
UNCORRECTED
UNCORRECTED
UNCORRECTED data
UNCORRECTED data could have been
UNCORRECTED could have been
for the collection of data
UNCORRECTED
for the collection of data
a. Direct observation (skill) OR GPS (movement patterns)
UNCORRECTED
a. Direct observation (skill) OR GPS (movement patterns) b. This would be collected to help determine the predominant � tness components and energy
UNCORRECTED
b. This would be collected to help determine the predominant � tness components and energy systems required for successful performance. This can then help develop a speci� c training
UNCORRECTED
systems required for successful performance. This can then help develop a speci� c training
PAGE
PAGE
PAGE
PAGE
PAGE
PAGE
PAGE Average percentage of game time for
PAGE Average percentage of game time for each activity during the quarter
PAGE each activity during the quarter
14.3
PAGE 14.3
24.5
PAGE 24.5
Walk backwards PAGE Walk backwards
PROOFS
PROOFS
PROOFS
PROOFS marks/marking
PROOFS marks/marking
PROOFS
PROOFS
PROOFS
PROOFS
PROOFS
PROOFS(ACHPER Trial Exam 2013, question 10)
PROOFS(ACHPER Trial Exam 2013, question 10)
The following data were collected from a 15-minute quarter of a Netball game for a Centre PROOFS
The following data were collected from a 15-minute quarter of a Netball game for a Centre PROOFS
PROOFS
PROOFS
PROOFS
PROOFSSTRATEGIES TO DECODE
PROOFSSTRATEGIES TO DECODE THE QUESTION
PROOFSTHE QUESTION
Identify the action words:
PROOFSIdentify the action words:Identify
PROOFSIdentify — determine the key
PROOFS — determine the key Identify — determine the key Identify
PROOFSIdentify — determine the key Identifycharacteristics or features
PROOFScharacteristics or featuresOutline
PROOFSOutlinenot in detail
PROOFS
not in detail�PROOFS
�

c07ActivityAnalysis 248 4 May 2017 1:41 PM
CHAPTER REVIEW ACTIVITY ANALYSIS
CHAPTER SUMMARY
� Activity analysis is a key technique that can be used to determine the physiological requirements of a sport. It uses movement patterns, heart rates, GPS, skill frequency tables and work-to-rest ratios to determine the predominant energy systems, � tness components and muscles.
� Observation is a practical method of data collection but has low accuracy. Digital recording can be less practical but has higher accuracy.
� Data collection is the � rst step of activity analysis. This is followed by activity analysis. The � ndings of this analysis should then shape the � tness testing that is prescribed.
� A player’s training methods and activities should always be based on the � ndings of such analysis.
TABLE 7.8 The what, who and how of the different methods of activity analysis
Method of activity analysis
What sports/activities it is best used for
What information can be determined How it can be used
Skill frequency table
Intermittent activities (e.g. tennis, gymnastics)
Major muscle groups
Major � tness components
To ensure that training replicates the requirements (energy system/� tness components/major muscle groups)
Movement patterns, including GPS data
Team sports on larger playing areas (e.g. AFL, hockey)
Continuous activities (average speed, e.g. Tour de France, triathlon)
Predominant energy systems
Fitness components (aerobic power vs anaerobic capacity)
Example: A high percentage of long duration lower speed/intensity in GPS/movement patterns data suggests aerobic energy system is predominant, therefore this system should be a focus in training.
Heart rate Continuous activities (e.g. 1500 m running, 3 km cycling)
Predominant energy systems
Example: A high percentage of jumps in volleyball skill frequency table suggests gluteus, quads and gastrocnemius muscles are important, therefore the coach would create a program that focuses on the power of these muscles.
W:R ratio (intensity charts)
Intermittent activities (e.g. rugby, badminton)
Predominant energy systems
248 UNIT 4 • Training to improve performance
UNCORRECTED
UNCORRECTED
UNCORRECTED
UNCORRECTED Continuous
UNCORRECTED Continuous activities (average
UNCORRECTED activities (average speed, e.g. Tour de
UNCORRECTED speed, e.g. Tour de France, triathlon)
UNCORRECTED France, triathlon)
Continuous
UNCORRECTED Continuous activities
UNCORRECTED activities (e.g. 1500 m running,
UNCORRECTED (e.g. 1500 m running,
W:R ratio
UNCORRECTED
W:R ratio
PAGE
PAGE
PAGE
PAGE Major muscle
PAGE Major muscle groups
PAGE groups
Major � tness
PAGE Major � tness components
PAGE components
Team sports on
PAGE Team sports on larger playing areas
PAGE larger playing areas (e.g. AFL, hockey)PAGE (e.g. AFL, hockey)
Predominant
PAGE Predominant energy systems
PAGE energy systems
Fitness PAGE Fitness
PROOFSand work-to-rest ratios to determine the predominant energy systems, � tness components
PROOFSand work-to-rest ratios to determine the predominant energy systems, � tness components
Observation is a practical method of data collection but has low accuracy. Digital recording
PROOFSObservation is a practical method of data collection but has low accuracy. Digital recording
Data collection is the � rst step of activity analysis. This is followed by activity analysis. The
PROOFSData collection is the � rst step of activity analysis. This is followed by activity analysis. The � ndings of this analysis should then shape the � tness testing that is prescribed.
PROOFS� ndings of this analysis should then shape the � tness testing that is prescribed. A player’s training methods and activities should always be based on the � ndings of such
PROOFSA player’s training methods and activities should always be based on the � ndings of such
PROOFSThe what, who and how of the different methods of activity analysis
PROOFSThe what, who and how of the different methods of activity analysis
information can
PROOFS
information can be determined How it can be usedPROOFS
be determined How it can be used
To ensure that training PROOFS
To ensure that training
c07ActivityAnalysis 249 4 May 2017 1:41 PM
EXAM PREPARATION
MULTIPLE CHOICE QUESTIONS
1 Which of the following is not a purpose of activity analysis?(A) To determine predominant strengths and weaknesses(B) To determine predominant � tness components(C) To determine predominant energy systems(D) To determine predominant muscles and muscle groups
2 A very short high-intensity effort on GPS data is most likely to require which � tness component?(A) Power(B) Strength(C) Aerobic power(D) Muscular endurance
3 A high percentage of time spent under 85% MHR suggests which energy system is important?(A) ATP–CP(B) Anaerobic glycolysis(C) Anaerobic system(D) Aerobic
4 Recording a large number of changes in direction in a skill frequency table suggests which � tness component is important?(A) Power(B) Speed(C) Agility(D) Balance
5 Which form of activity analysis can best determine important muscles and muscle groups?(A) Heart rate telemetry(B) GPS(C) Movement patterns(D) Skill frequency table
6 A work-to-rest ratio that shows the anaerobic glycolysis system being predominant is (A) 1:4(B) 1:6(C) 2:1(D) 6:1
7 The most important muscle groups required to complete a pass are(A) abdominals and hamstrings.(B) � exors, extensors.(C) bicep and tricep.(D) abdominals and pectorals.
8 Which of the following is not a limitation of heart rate telemetry? (A) It can be affected by nerves(B) It can be affected by body temperature(C) It provides information about energy systems and some � tness components(D) Heart rate monitors can be expensive
9 In order to gather information about � tness components and energy systems, the best forms of activity analysis to use would be (A) skill frequency table and GPS.(B) heart rate telemetry and work-to-rest ratio.(C) GPS and movement patterns.(D) movement patterns and heart rate telemetry.
10 The best method of activity analysis for a triathlete would be(A) movement patterns.(B) skill frequency table.(C) heart rate telemetry.(D) work-to-rest ratio.
InteractivityActivity analysis quizSearchlight ID: int-6804
CHAPTER 7 • Activity analysis 249
UNCORRECTED A work-to-rest ratio that shows the anaerobic glycolysis system being predominant is
UNCORRECTED A work-to-rest ratio that shows the anaerobic glycolysis system being predominant is
The most important muscle groups required to complete a pass are
UNCORRECTED
The most important muscle groups required to complete a pass are(A) abdominals and hamstrings.
UNCORRECTED
(A) abdominals and hamstrings.
(D) abdominals and pectorals.
UNCORRECTED
(D) abdominals and pectorals.Which of the following is not a limitation of heart rate telemetry?
UNCORRECTED
Which of the following is not a limitation of heart rate telemetry? (A) It can be affected by nerves
UNCORRECTED
(A) It can be affected by nerves(B) It can be affected by body temperature
UNCORRECTED
(B) It can be affected by body temperature(C) It provides information about energy systems and some � tness components
UNCORRECTED
(C) It provides information about energy systems and some � tness components(D) Heart rate monitors can be expensive
UNCORRECTED
(D) Heart rate monitors can be expensiveIn order to gather information about � tness components and energy systems, the best
UNCORRECTED
In order to gather information about � tness components and energy systems, the best forms of activity analysis to use would be
UNCORRECTED
forms of activity analysis to use would be (A) skill frequency table and GPS.
UNCORRECTED
(A) skill frequency table and GPS.(B) heart rate telemetry and work-to-rest ratio.
UNCORRECTED
(B) heart rate telemetry and work-to-rest ratio.(C) GPS and movement patterns.UNCORRECTED
(C) GPS and movement patterns.(D) movement patterns and heart rate telemetry.UNCORRECTED
(D) movement patterns and heart rate telemetry.The best method of activity analysis for a triathlete would beUNCORRECTED
The best method of activity analysis for a triathlete would be
PAGE Recording a large number of changes in direction in a skill frequency table suggests which
PAGE Recording a large number of changes in direction in a skill frequency table suggests which
Which form of activity analysis can best determine important muscles and muscle groups?PAGE Which form of activity analysis can best determine important muscles and muscle groups?
PROOFS
PROOFS
PROOFSSearchlight ID: int-6804
PROOFSSearchlight ID: int-6804

c07ActivityAnalysis 250 4 May 2017 1:41 PM
CHAPTER REVIEW ACTIVITY ANALYSIS
TRIAL EXAM QUESTIONS During the race the following data were collected via a heart rate monitor and GPS:
DistanceTime
(minutes)Average
heart rate
1 km 4:09 166 bpm
2 km 4:13 172 bpm
3 km 4:26 173 bpm
4 km 4:23 173 bpm
5 km 4:38 175 bpm
6 km 4:37 175 bpm
7 km 4:38 176 bpm
8 km 4:13 180 bpm
a. What was the predominant energy system that Daniel would have utilised during this event? 1 mark
b. Complete the table below. 2 marks
Method of data collection Data collected
GPS
Heart rate monitor
Question 1TABLE 1 Korfball games analysis taken from Player 1 throughout the � rst half
Passes 99
Catches 67
Dodges 103
Side steps 87
Intercepts 8
Shots 16
Lunges 110
Balancing on one foot 23
Defending stance 88
Holding position 45
TABLE 2 Work-to-rest ratio from Player 1 throughout the second half (2 minute time sample)
W R W R W R W R W R
17 20 15 10 8 10 13 9 9 9
a. Using data from above, justify an important � tness component required to be successful in Korfball. 2 marks
b. Using the data above, justify the most important energy system. 2 marks
Question 2 (ACHPER Trial Exam 2015, question 13)
Two Year 12 students, Katherine and Sharon, undertook an activity analysis in order to assess the requirements of training for, and then competing in, a 10 km Fun Run event. The girls also analysed the heart rate data of an elite 10 km runner as part of their data collection to determine the requirements of successfully completing the event.
a. Why is it important to analyse the performance data of an elite 10 km athlete rather than that of a novice runner? 2 marks
b. Other than using a heart rate monitor, state one form of data collection that could be used as part of an activity analysis for a 10 km Fun Run event. 1 mark
Question 3 (ACHPER Trial Exam 2014, question 7)
Daniel is a Year 12 student who trained to compete in an 8 km Fun Run. The race was held on a � at course that comprised 2 × 4 km laps. On the night of the race the air temperature was 33 degrees Celsius.
250 UNIT 4 • Training to improve performance
UNCORRECTED
UNCORRECTED
UNCORRECTED
UNCORRECTED
UNCORRECTED
UNCORRECTED W R W R W R W R W R
UNCORRECTED W R W R W R W R W R
15
UNCORRECTED 15
Using data from above, justify an important � tness component required to be
UNCORRECTED Using data from above, justify an important � tness component required to be successful in Korfball.
UNCORRECTED successful in Korfball.
Using the data above, justify the most important energy system.
UNCORRECTED Using the data above, justify the most important energy system.
UNCORRECTED Question 2
UNCORRECTED Question 2
Two Year 12 students, Katherine and Sharon, undertook an activity analysis in
UNCORRECTED
Two Year 12 students, Katherine and Sharon, undertook an activity analysis in order to assess the requirements of training for, and then competing in, a 10 km
UNCORRECTED
order to assess the requirements of training for, and then competing in, a 10 km Fun Run event. The girls also analysed the heart rate data of an elite 10 km runner
UNCORRECTED
Fun Run event. The girls also analysed the heart rate data of an elite 10 km runner
UNCORRECTED
UNCORRECTED
UNCORRECTED
UNCORRECTED PAGE
PAGE
PAGE 45
PAGE 45
Work-to-rest ratio from Player 1 throughout the second half (2 minute time
PAGE Work-to-rest ratio from Player 1 throughout the second half (2 minute time
PAGE
PAGE
PAGE
W R W R W R W R W RPAGE
W R W R W R W R W R
PROOFS
PROOFS
PROOFS
PROOFS

c07ActivityAnalysis 251 4 May 2017 1:41 PM
TRIAL EXAM QUESTIONS During the race the following data were collected via a heart rate monitor and GPS:
DistanceTime
(minutes)Average
heart rate
1 km 4:09 166 bpm
2 km 4:13 172 bpm
3 km 4:26 173 bpm
4 km 4:23 173 bpm
5 km 4:38 175 bpm
6 km 4:37 175 bpm
7 km 4:38 176 bpm
8 km 4:13 180 bpm
a. What was the predominant energy system that Daniel would have utilised during this event? 1 mark
b. Complete the table below. 2 marks
Method of data collection Data collected
GPS
Heart rate monitor
Question 1TABLE 1 Korfball games analysis taken from Player 1 throughout the � rst half
Passes 99
Catches 67
Dodges 103
Side steps 87
Intercepts 8
Shots 16
Lunges 110
Balancing on one foot 23
Defending stance 88
Holding position 45
TABLE 2 Work-to-rest ratio from Player 1 throughout the second half (2 minute time sample)
W R W R W R W R W R
17 20 15 10 8 10 13 9 9 9
a. Using data from above, justify an important � tness component required to be successful in Korfball. 2 marks
b. Using the data above, justify the most important energy system. 2 marks
Question 2 (ACHPER Trial Exam 2015, question 13)
Two Year 12 students, Katherine and Sharon, undertook an activity analysis in order to assess the requirements of training for, and then competing in, a 10 km Fun Run event. The girls also analysed the heart rate data of an elite 10 km runner as part of their data collection to determine the requirements of successfully completing the event.
a. Why is it important to analyse the performance data of an elite 10 km athlete rather than that of a novice runner? 2 marks
b. Other than using a heart rate monitor, state one form of data collection that could be used as part of an activity analysis for a 10 km Fun Run event. 1 mark
Question 3 (ACHPER Trial Exam 2014, question 7)
Daniel is a Year 12 student who trained to compete in an 8 km Fun Run. The race was held on a � at course that comprised 2 × 4 km laps. On the night of the race the air temperature was 33 degrees Celsius.
CHAPTER 7 • Activity analysis 251
UNCORRECTED
UNCORRECTED
UNCORRECTED
UNCORRECTED
UNCORRECTED
UNCORRECTED
UNCORRECTED
UNCORRECTED PAGE 1 mark
PAGE 1 mark
2 marks
PAGE 2 marks
PAGE
PAGE
PAGE
PAGE Data collected
PAGE Data collected
PROOFS
PROOFS
PROOFS
PROOFS
PROOFS


