Page 1
162revenue.mt.gov
PROPERTY TAXES
Property Tax Background ..................................................................163Classes of Property ...........................................................................165Determining Taxes Paid .....................................................................167Tax Increment Financing ...................................................................169Taxes Levied......................................................................................175Property Taxes Paid by Class ............................................................176Property Taxes Paid by Taxing Jurisdiction Type...............................178Property Tax and Property Value Summaries ....................................181Property Taxes Paid by County .........................................................193
Page 2
163revenue.mt.gov
Property Tax Background
The Montana State Constitution states that all property in the state must be equalized for tax purposes. It is the Department of Revenue’s role to ensure uniform valuation of similar properties throughout the state. The department was given this responsibility in the 1972 Constitution.
Article 8, Sections 3 and 4 of the Montana Constitution state:
Section 3. Property tax administration. The state shall appraise, assess, and equalize the valuation of all property which is to be taxed in the manner provided by law.
Section 4. Equal valuation. All taxing jurisdictions shall use the assessed valuation of property established by the state.
Although the Department of Revenue is responsible for administering taxes and equalizing property throughout the state, it is the combination of the department, the Legislature, and local governments and schools that set the level of taxes. The department determines the value of property throughout the state; the Legislature sets the distribution of taxes by designating classes of property, establishing the tax rates and exemptions, and setting the basis of valuation; and local governments and other taxing jurisdictions set the level of taxes by their budgeting decisions and maximum mill levy limitations. Local governments also establish local special fees and assessment charges separate from ad valorem property taxes.
It is this interaction of the assessed value, tax rates, exemptions, mill rates, and special fees and charges that determine the property taxes paid by individual taxpayers.
Property taxes are not like other taxes in the state. Property taxes are an ad valorem tax, meaning the tax is levied in proportion to the value of each property relative to the total value within each taxing jurisdiction. Therefore, reducing a tax rate or exempting a certain type of property from the tax base does not reduce the amount of taxes collected, but instead shifts the tax liability to other taxpayers in the affected jurisdiction.
Revenue collected from property taxes is statutorily limited. The legislature has placed limitations on the amount of property tax that can be collected. Local governments are subject to a maximum mill levy as set forth in 15-10-420, MCA. Property taxes levied by schools are limited by school budgeting laws. The state’s mills are also subject to 15-10-420, MCA but may not exceed the mill levy limitations set out in law. Because of this, state mills have been fixed and property revenue can only grow as new value is added to the tax base.
The first part of the property tax section explains these underlying concepts of Montana’s property tax in more detail. The second part focuses on the distribution of the tax burden and total revenue collected.
Selected Sections of Property Law
Primary Section of Montana Code Annotated
(MCA)
Selected Sections of Property Law
Primary Section of Montana Code Annotated
(MCA)General Provisions of Entitlement Share Payment Title 15, Chapter 1 Department to Equalize Valuations Title 15, Chapter 9
Administration of Revenue Laws Title 15, Chapter 1, Part 2 Property Tax Levies Title 15, Chapter 10Investigations by the Department Title 15, Chapter 1, Part 3 Certification of Taxable Values 15-10-202, MCA
Protested Payments Title 15, Chapter 1, Part 4 County Clerk and Recorder to Report Mill Levy 15-10-305, MCA
State Tax Appeal Board Title 15, Chapter 2 Department to Compute and Enter Taxes 15-10-305, MCA
Property Subject to Taxation and Tax Rates Title 15, Chapter 6, Part 1 Taxing Authority Budget Limitation 15-10-420, MCA
Tax-Exempt Property Title 15, Chapter 6, Part 2 Property Tax Appeals Title 15, Chapter 15
Appraisal Methods Title 15, Chapter7, Part 1 Collection of Property Taxes by Treasurer Title 15, Chapter 16
Appraisal Methods for Agriculture Title 15, Chapter 7, Part 2 Tax Lien Sales Title 15, Chapter 17
Realty Transfer Act and Non-Disclosure Title 15, Chapter 7, Part 3 Properties that are Centrally
Assessed Title 15, Chapter 23
Assessment Procedure Title 15, Chapter 8 Special Property Tax Applications Title 15, Chapter 24
Page 3
164revenue.mt.gov
Property Tax Background
Property is Appraised at its Market Value by the Department of RevenueIn general, taxable property in the state is appraised by the Department of Revenue at 100 percent of its market value. This is the value at which property would change hands between a willing buyer and a willing seller when both have reasonable knowledge of the relevant facts and neither is under any compulsion to buy or sell (15-8-111, MCA).
For residential property, this means using the sale price of comparable properties to establish the value of properties that must be appraised. For commercial property, the appraised market value is determined by capitalizing the income from the property into a market value. In some cases, when there is not enough market information, values will be determined by estimating the cost of the property, minus depreciation for both residential and commercial properties.
Personal property and the value of gross proceeds and net proceeds of mines are reported annually by the taxpayer to the Department of Revenue.
Centrally assessed properties primarily consist of properties that cross county lines such as large utility companies and railroads. The department values the entire company and apportions the value among the counties and local jurisdictions by mileage or other basis that is judged to be reasonable and proper (15-23-105, MCA).
Forest and agricultural land are valued using productivity value of the land rather than market value. Forest productivity is determined by the College of Forestry at the University of Montana in Missoula. Agricultural productivity is determined by using the soil quality data from the Natural Resource Conservation Service (NRCS), historical productivity measures, and a commodity price and capitalization rate set by the legislature.
The department has 28 offices that cover Montana’s 56 counties. These county offices are responsible for the valuation of property with the exception of centrally assessed and large industrial properties. The county offices work with county treasurers, local officials, and the public to provide property tax information.
If a taxpayer disagrees with the valuation of property, the taxpayer can challenge that value by requesting an informal review (Form AB-26) with the department, or filling an appeal directly with the County Tax Appeal Board (CTAB). If the taxpayer files an AB-26 and is not satisfied with the outcome of the informal review, he or she can appeal to the CTAB. A taxpayer can challenge the ruling of the CTAB by appealing it to the Montana Tax Appeal Board. If the taxpayer is still not satisfied, he or she can bring it to district court and then to the Supreme Court.
Property is Taxed at its Taxable Value as Determined by the LegislatureTaxable value is the portion of the property’s value subject to mill levies. It is calculated by applying the tax rate and any relevant exemptions to the market value. Therefore, taxable value is typically a fraction of the property’s market value. For example, telecommunication property has a tax rate of 6 percent. If the telecommunication property’s value is $100,000, then its taxable value is $6,000.
Taxable value is calculated differently for different types of property because all taxable property is classified into one of the 14 classes of property that have been determined by the Legislature. While each property within a class is valued in the same manner, not all classes of property are treated the same. Tax rates, exemptions, and valuations methods differ among classes of property as determined by the Legislature.
The next table summarizes the differences in valuation by class. The following pages summarize the classes of property in more detail.
Page 4
165revenue.mt.gov
Classes of Property
Class 1 – Net proceeds of mines and mining claims except for coal, bentonite, and metal mines. Class 1 property is reported to the department each year by the taxpayer. Taxable value is 100 percent of the market value.
Class 2 – Gross proceeds of metal mines. New gross values are reported to the department each year by the taxpayer. The tax rate for Class 2 properties is 3 percent.
Class 3 – Agricultural land, nonproductive patented mining claims, and nonqualified agricultural land. Class 3 property is reappraised on a 2-year cycle.
Agricultural land is valued based on the productivity of the land. There are four main sub-classes of agricultural land: grazing land; tillable irrigated land; non-irrigated land used for grain or other crops; and non-irrigated land used for continuous hay production. Each of these four types of property has different productivities and certain parcels of property may be more or less productive than the average property in the class. The tax rate is 2.16 percent for 2018.
Non-qualified agricultural land includes parcels of land that are between 20 and 160 acres and are not used primarily for agricultural purposes. These parcels are appraised as if they were used for grazing and are taxed at seven times the Class 3 tax rate, or 15.12 percent for 2018.
Class 4 – Residential, commercial, and industrial land and improvements. Class 4 property is the largest class as measured in both market value and the number of parcels.
Beginning in Tax Year 2015, Class 4 property is appraised on a biennial basis. The new appraisal values determined by the department are applied beginning in odd-numbered tax years. If a property does not change in a substantial way, then the prior year’s reappraisal value is also used in the even-numbered tax years.
The tax rate for residential property is 1.35 percent in 2018. The tax rate for commercial and industrial property is 1.4 times the residential property tax rate, or 1.89 percent in 2018.
The legislature provides three programs to assist taxpayers with property taxes: the Property Tax Assistance Program, the Disabled American Veterans Program, and the Elderly Homeowner/Renter Credit. These programs are discussed in more detail in the tax expenditure section of the Biennial Report.
Class 5 – Pollution control equipment, independent and rural electric and telephone cooperatives, machinery and equipment used in electrolytic reduction facilities, real and personal property of research
Class Description Valuation Standard
Valuation Cycle
Class 1 Net Proceeds of Mines Net Proceeds AnnualClass 2 Gross Proceeds of Metal Mines Gross Proceeds AnnualClass 3 Agricultural Land Productivity Value 2 YearClass 4 Residential, Commercial, and Industrial (land and improvements) Market Value 2 Year
Class 5Pollution Control Equipment, Independent and Rural Electric and Telephone Coopreratives, New and Expanding Industry, Electrolytic Reduction Facilities, Research and Development Firms, and Gasohol Production Property
Market Value Annual
Class 7 Noncentrally Assessed Utilities Market Value AnnualClass 8 Business Equipment Market Value AnnualClass 9 Pipelines and Nonelectric Generating Property of Electric Utilities Market Value AnnualClass 10 Forest Land Productivity Value 6 YearClass 12 Airlines and Railroads Market Value Annual
Class 13 Telecommunication Utilities and Electric Generating Property of Electric Utilities Market Value Annual
Class 14 Renewable Energy Production and Transmission Property Market Value AnnualClass 15 Carbon Dioxide and Liquid Pipeline Property Market Value AnnualClass 16 High Voltage DC Converter Property Market Value Annual
Page 5
166revenue.mt.gov
Classes of Property
and development firms, and real and personal property used in production of gasohol. The market value of Class 5 property is assessed each year by the department’s industrial appraisers. The tax rate is 3 percent.
Class 7 – Non-centrally assessed utilities. The market value is determined on an annual basis by the department’s industrial appraisers. The tax rate is 8 percent.
Class 8 – Personal property used for business purposes. Class 8 property is reported to the department annually. The total market value owned or controlled by a business or entity is taxed as follows: The first $100,000 in market value is tax exempt; the next $6 million of market value is taxed at 1.5 percent; and any property above $6.1 million has a tax rate of 3 percent.
Class 9 – Pipelines and the non-electric generating property of electric utilities. The market value of property in local jurisdictions is determined by the portion of property that is located in the local jurisdictions. The tax rate is 12 percent.
Class 10 – Forest land. Forest land is reassessed every 6 years and is valued based on the productivity of each parcel of land. Productivity of each acre is determined by the University of Montana, College of Forestry and Conservation with input from the timber industry. There are four grades of forest property that are determined by the cubic feet of lumber produced on each acre per year. Standing timber on the property is not taxed. The 2018 tax rate is 0.37 percent.
Class 12 – All property owned by airlines and railroads. It is valued each year and the tax rate varies depending on the effective tax rate of all industrial property in the state. In 2018 the tax rate is 3.04 percent.
Class 13 – All property of telecommunication utilities and the electric generating property of electric utilities. The market value is determined on an annual basis by the appraisers in the department’s Centrally Assessed and Industrial Properties Division. The tax rate is 6 percent.
Class 14 – Renewable energy production and transmission property. This includes commercial wind generation, biodiesel production, biomass gasification, coal gasification ethanol production, and geothermal energy property. The tax rate is 3 percent.
Class 15 – Qualifying carbon dioxide and liquid pipeline property. This property includes pipelines used to transport carbon dioxide for sequestration or having 90 percent of capacity dedicated to transporting fuels produced by coal gasification, biodiesel, biogas, or ethanol facilities; carbon sequestration equipment; closed-loop enhanced oil recovery equipment; and pipelines connecting a Class 14 fuel production facility to an existing pipeline. The tax rate is 3 percent.
Class 16 – High-voltage DC converter station property located in a manner that the power can be directed to two different regional grids. The tax rate is 2.25 percent. Currently there is no Class 16 property in the state.
Page 6
167revenue.mt.gov
Determining Taxes Paid
Determining Taxes PaidThe total amount of annual taxes paid by a taxpayer is equal to the taxable value of the property multiplied by the cumulative mills from all taxing jurisdictions in which the property resides.
The rate applied to taxable value to determine taxes paid is denoted as a mill. One mill is equal to 1/1000 of a dollar or 0.1 percent.
The total amount of mills that may be levied differs between the state and local governments. The state’s mills are statutorily fixed while local governments set their mills based on the budgets of the individual taxing jurisdictions and their tax base.
State Mill RateThe state levies 95 mills for school equalizations and 6 mills for the university system. There are also 1.5 mills levied for vocational and technical schools that are applied to property in Silver Bow, Cascade, Yellowstone, Missoula, and Lewis and Clark counties only. These mills generate revenue to fund part of the state’s obligation to support local schools, universities, and technical colleges.
Prior to 1989, the elementary school equalization mills were set at 17 mills and the high school equalization mills were set at 28 mills. In 1989, the Montana Supreme Court found Montana schools were not adequately funded. In response, the Legislature increased these levies by 5 mills each and created a new state equalization levy of 40 mills. For Fiscal Year 2019, it is estimated that these 95 mills will generate approximately $273 million in property taxes for the state general fund.
Local Government Mill RateLocal governments set their mills based on the budgets of individual taxing jurisdictions and their tax base. A taxing jurisdiction is a governmental entity authorized to impose tax on property. The tax base is the total amount of taxable value contained within the physical boundary of the taxing jurisdiction as of January 1 of the current tax year.
15-10-420, MCA explains the law that local governments must follow for determining the maximum millage authority. This authority is limited to the number of mills required to generate the amount of property tax actually assessed in the governmental unit in the prior year based on the current tax base less the current year’s value of newly taxable property plus one-half the average rate of inflation for the prior 3 years.
A taxing jurisdiction’s newly taxable property includes property changes from the previous year, property annexed into the jurisdiction, increases in value due to subdivisions of real property, and the transfer of property from tax exempt to a taxable status.
For example, if a taxing entity assessed $49,500 in taxes last year and half the rate of inflation is equal to 1.01 percent, then the inflationary adjustment would be an increase of $500. This year’s inflation adjusted levy authority would increase to $50,000.
Property Tax = Taxable Value x Cumulative Millage Rates
Millage Rate x $1,000 = Mills0.005 x $1,000 = 5.0
Legislative Millage Rates Assessed by the State Primary Section of Montana Code Annotated (MCA)
Tax Levy for Elementary Equalization (33 Mills) 20-9-331, MCATax Levy for High School Equalization (22 Mills) 20-9-333, MCATax Levy for State Equalization (40 Mills) 20-9-360, MCATax Levy for Vocational and Technical Education (1.5 Mills) 20-25-439, MCATax Levy for University System (6 Mills) 15-10-108, MCA
Page 7
168revenue.mt.gov
Determining Taxes Paid
If the same taxing entity has a current tax base of $10,200,000 but $200,000 is newly taxable property, then the adjusted tax base used for setting mills would be $10,000,000.
Taxing jurisdictions generally do this calculation in terms of taxable value per mill. A tax base of $10,200,000 would equate to $10,200 taxable value per mill ($10,200,000 / $1,000), $200,000 in newly taxable property is $200 newly taxable property per mill ($200,000 / $1,000), and the adjusted tax base of $10,000,000 is $10,000 taxable value per mill ($10,000,000 / $1,000).
Therefore, when the adjusted levy authority of $50,000 is divided into the adjusted taxable value per mill of $10,000, the maximum millage authority afforded by the legislature to the taxing jurisdiction would be 5 mills.
Once the level of property taxes is set, the taxing jurisdictions set their budgets at levels that may or may not provide the same level of services as the prior year. Instances when the cost of providing service increases faster than allowable property tax levels increase, a reduction in services takes place or the governing body can ask voters to approve an additional mill levy. On the other hand, if the allowable property tax revenue increases faster than the cost of providing services, property taxes are reduced.
Taxes Assessed by the Example Taxing Jurisdiction on the Example ResidenceThe amount of annual taxes paid on property is equal to the taxable value of the property multiplied by the cumulative mills from all taxing jurisdictions that contain the property. The amount of annual taxes that would be assessed by the example taxing authority on an example residence valued at $ 100,000 would be equal to the taxable value of the residence, $1,350 (100,000 x 1.35 percent) multiplied by the millage rate of the taxing jurisdiction in (0.005). This is $6.75 in total taxes.
Levy DistrictsLocal taxing jurisdictions are allowed to levy mills to fund the services that they provide. Schools, cities and towns, miscellaneous districts, and the state all generate revenue from the property tax system by levying mills against property within that jurisdiction. Each taxing jurisdiction’s mills are added together to determine the total mills that apply to a property. All properties that are a part of the same combination of taxing jurisdictions make up a taxing levy district. By definition, each property in a taxing district will have the same mills applied to their taxable values. An example levy district is below.
Last Year's Taxes Assessed = $49,500Half the Rate of Inflation x 1.01%Inflationary Adjustment = $500Adjusted Budget Authority = $50,000
Current Taxable Value per Mill = $10,200Newly Taxable Value per Mill - $200Adjusted Taxable Value per Mill = $10,000
Adjusted Budget Authority $50,000Adjusted Tax Base $10,000= = Authorized Mill Levy = 5.000
Elementary School 100.00High School 125.25Town 75.50County 115.00State School Equalization 95.00University 6.00Total Mills 516.75
Example of a Taxing District
Page 8
169revenue.mt.gov
Tax Increment Financing
For a given tax year, residential property taxes are assessed on the taxable value as of January 1 of the given tax year. Tax payments are made to the applicable county treasurer and are due in the November and May following the January 1 assessment date. The treasurer distributes the funds to the appropriate taxing jurisdiction.
Tax Increment FinancingTax increment financing (TIF) is authorized by 7-15-4282, MCA, and is an opportunity for qualifying districts to use property tax revenue to fund new development. It works by separating taxable value into base and increment values so that revenue from the base value continues to go to the regular taxing jurisdiction but taxes on the increment go to the TIF to pay for development activities within the TIF.
As of July 1, 2013, qualifying districts include targeted economic development districts and urban renewal districts. Qualifying districts prior to this date included industrial districts, technology districts, and aerospace transportation and technology districts. The 2013 Legislature eliminated the option to create any of those three districts, but districts that were already in existence may remain in existence.
Tax increment financing may be used to pay for a variety of development activities within the TIF including land acquisition, demolition and removal of structures, relocation of occupants, infrastructure costs, construction of publicly owned buildings and improvements, administration of urban renewal activities, and paying bonds that were issued to fund appropriate costs (7-15-4288, MCA).
Upon expiration of the TIF, the increment is released back to the local governments and the state. State and local governments use the released increment as newly taxable property for 15-10-420, MCA purposes. Schools treat the released increment as an increase in their tax base and adjust their mill levies accordingly.
TIF districts expire on the latter of the fifteenth year following the TIFs adoption or the full payment of all bonds for which tax increment revenue have been pledged. TIFs may extend their expiration date by securing bonds that pledge increment after the fifteenth anniversary as repayment. No term extensions are allowed for bonds secured after the fifteenth anniversary of tax increment provisions. For example, if a TIF was authorized January 1, 2000, it has until January 1, 2015 (its fifteenth anniversary) to pass bonds secured by future increment to extend the expiration date. Additional bonds may be passed after the fifteenth anniversary but these would not extend the life of a TIF.
TIF districts are allowed to collect the incremental tax revenue from all of the local and state mills except the statewide 6-mill levy that is used to fund the university system. In 2018, TIFs collected $39.411 million in revenue over an increment taxable value base of $54.927 million. Therefore, the average mills for TIFs was 717.52.
An Example: TIF Increment Base taxable value is the total taxable value in the TIF district in the year prior to the TIF’s existence. Incremental taxable value is the taxable value that exceeds the base taxable value for the district at any year. For example, if in the year a TIF is created, the base year and current year taxable value are equal to $1 million, there would be no incremental value and no TIF revenue.
Years 1 2 3 4 5 6 7 8 9 10 11 12 13 14 15 16 17 18 19 20 21 22 23 24 25 26 27 28 29Initial TermTerm Extended by Bond IssuanceAdditional Bond Issuance Term Limitation
Years From TIF Authorization
15 Years Following AdoptionBond Issuance Before 15th Year Anniversary
Additional Extensions Limited
TIF Taxable Value Base YearCurrent Year Taxable Value $1,000,000Base Taxable Value - $1,000,000Increment Taxable Value $0Millage Rate x 0.500TIF Revenue $0
Page 9
170revenue.mt.gov
Tax Increment Financing
If in the second year of a TIF increment’s existence its taxable value grew by $100,000, the incremental value in that year would be $100,000. If the total millage rate in the district was .500, the taxes generated from the increment (TIF revenue) would be $50,000.
When a TIF district’s incremental value is less than zero, no revenue is provided to the district. For example, if in the TIF district’s third year the taxable value shrinks to $800,000 for reasons such as property devaluation, demolition or removal of structures, the incremental value would be negative (-$200,000), meaning there would be no incremental value in that third year.
If in the fourth year the taxable value of the TIF district grows from $800,000 to $1,200,000, due to redevelopment, or other reasons, the increment would increase to $200,000. If the millage rate was 0.500, the TIF district’s revenue would be $100,000 in that year.
The following pages show a summary of the existing TIF districts.
TIF Taxable Value Base Year Year 2Current Year Taxable Value $1,000,000 $1,100,000Base Taxable Value - $1,000,000 - $1,000,000Increment Taxable Value $0 $100,000Millage Rate x 0.500 x 0.500TIF Revenue $0 $50,000
TIF Taxable Value Base Year Year 2 Year 3Current Year Taxable Value $1,000,000 $1,100,000 $800,000Base Taxable Value - $1,000,000 - $1,000,000 - $1,000,000Increment Taxable Value $0 $100,000 -$200,000Millage Rate x 0.500 x 0.500 x 0.500TIF Revenue $0 $50,000 $0
TIF Taxable Value Base Year Year 2 Year 3 Year 4Current Year Taxable Value $1,000,000 $1,100,000 $800,000 $1,200,000Base Taxable Value - $1,000,000 - $1,000,000 - $1,000,000 - $1,000,000Increment Taxable Value $0 $100,000 -$200,000 $200,000Millage Rate x 0.500 x 0.500 x 0.500 x 0.500TIF Revenue $0 $50,000 $0 $100,000
Page 10
171revenue.mt.gov
Tax Increment Financing
County District2017 Total Taxable
ValueTaxable Value
of BaseIncremental
Taxable Value
Big Horn Hardin Industrial 1,776,290 465,144 1,311,146Cascade East Industrial Park 321,895 2,322 319,573Cascade Airport TID 155,016 107,149 47,867Cascade Int'l Malting TID 745,973 362,124 383,849Cascade Manchester Exit 66,428 3,217 63,211Cascade Montana Milling 42,568 381 42,187Deer Lodge Mill Creek 8,394,371 909,339 7,485,032Flathead Kalispell H 18,877 126 18,751Gallatin Mandeville Farm 99,692 12,059 87,633Hill Hill Co Industrial 1,070 912 158Jefferson North Jefferson Co Industrial 90,576 18,590 71,986Jefferson Sunlight Industrial (4FT) 1,371,465 737,334 634,131Missoula Airport Industrial 2,889,101 176,605 2,712,496Missoula Bonner Mill Industrial 411,489 121,676 289,813Park West End Industrial 151,160 128 151,032Ravalli Hamilton Airport 125,162 107,624 17,538Ravalli N Stevensville Industrial 124,526 109,850 14,676Ravalli Stevensville Airport 60,956 49,132 11,824Silver Bow Ramsey TIFID 5,952,858 1,721,230 4,231,628Toole Shelby Industrial 305,388 75,464 229,924
Flathead Kalispell G 107,277 390 106,887Gallatin S Bozeman Tech District 305 305 0Missoula Technology District 298,444 0 298,444
Cascade GF DT Urban Renewal 3,896,307 3,643,698 252,609Cascade GF West Bank 946,789 292,536 654,253Chouteau 1TID 218,255 160,843 57,412Chouteau 2TID 75,147 17,494 57,653Custer Miles City Downtown 1,612,100 1,556,649 55,451Deer Lodge Ana - Downtown 1,027,130 856,215 170,915Fergus Lewistown Urban 1,548,568 1,482,192 66,376Flathead Columbia Falls URD 64,973 62,035 2,938Flathead Kalispell B 1,191,058 453,612 737,446Flathead Kalispell C - amended 2011 8,211,209 7,932,918 278,291Flathead Whitefish A 14,358,289 4,185,352 10,172,937Gallatin Bozeman Downtown 5,098,612 1,328,695 3,769,917Gallatin Bozeman Midtown URD 4,456,439 3,507,723 948,716Gallatin NE Urban Renewal 646,819 423,054 223,765Jefferson Whitehall Urban Renewal 883,433 736,527 146,906Lake Polson 1,706,868 1,436,002 270,866Lewis & Clark Railroad District Urban Renewal 2,498,061 2,338,125 159,936Lincoln Riverside 470,092 347,928 122,164Missoula Hellgate URD 1,164,829 1,025,448 139,381Missoula N. Reserve Scott St. URD 520,300 295,864 224,436Missoula N Reserve Scott St. URD 1,816,826 1,195,341 621,485Missoula Front St URD 1,915,446 1,413,035 502,411Missoula River Front URD 345,528 157,858 187,670Missoula URD II 4,052,435 1,546,186 2,506,249Missoula URD II 690,504 313,637 376,867Missoula URD III 11,202,692 8,172,844 3,029,848Park Livingston Urban Renewal 1,821,354 1,604,273 217,081Silver Bow Butte Uptown URD 5,460,890 3,587,625 1,873,265Silver Bow Eastside TIFID 535,856 286,251 249,605Yellowstone 2008 Expanded N 27th St 6,586,103 3,328,807 3,257,296Yellowstone East Billings 3,003,096 1,800,794 1,202,302Yellowstone Laurel 2,167,647 1,169,223 998,424Yellowstone North 27th St 1,392,039 783,431 608,608Yellowstone South Billings Blvd 12,023,470 7,046,472 4,976,998
Flathead Columbia Falls Industrial Park TEDD 2,181,185 1,896,297 284,888Flathead Glacier Rail Park TEDD 7,676 7,057 619Lincoln Kootenai Business Park 1 13,795 4,007 9,788Lincoln Kootenai Business Park 3 186,172 132,754 53,418Lincoln Kootenai Business Park 2 10,101 6,500 3,601Missoula Bonner W Log Yard TEDD 93,585 0 93,585Missoula Bonner W Log Yard TEDD 76,079 1,148 74,931Yellowstone Lockwood TEDD 678,913 678,913 0Total 130,367,557 72,196,464 58,171,093
Tax Increment Financing Districts (TIF) / Targeted Economic Development Districts (TEDD)TY 2017 Taxable Value of Increment and Revenue Generated for the District
Industrial Tax Increment Financing Districts
Technology Tax Increment Financing Districts
Urban Renewal Tax Increment Financing Districts
Targeted Economic Development Districts (TEDD)
Page 11
172revenue.mt.gov
Tax Increment Financing
County District State CountyCountywide and Local
Schools Cities & Towns Misc Total Revenue
Big Horn Hardin Industrial 124,654 147,671 313,372 228,743 13,172 827,612Cascade East Industrial Park 30,839 40,608 73,754 63,352 7,318 215,872Cascade Airport TID 4,619 6,082 11,047 9,489 174 31,412Cascade Int'l Malting TID 37,041 48,776 88,589 76,094 1,395 251,895Cascade Manchester Exit 6,100 9,814 14,588 0 1,352 31,854Cascade Montana Milling 4,071 6,550 9,736 0 902 21,259Deer Lodge Mill Creek 711,078 2,294,611 1,482,785 0 265,380 4,753,854Flathead Kalispell H 1,781 2,779 4,400 3,501 515 12,975Gallatin Mandeville Farm 8,325 8,799 24,883 17,816 879 60,703Hill Hill Co Industrial 15 26 48 0 3 93Jefferson North Jefferson Co Industrial 6,839 11,678 15,459 0 3,589 37,565Jefferson Sunlight Industrial (4FT) 60,242 102,875 61,726 0 11,635 236,479Missoula Airport Industrial 261,756 529,805 657,943 0 387,850 1,837,354Missoula Bonner Mill Industrial 27,967 56,606 91,810 0 53,168 229,551Park West End Industrial 14,348 17,249 41,321 35,917 264 109,099Ravalli Hamilton Airport 1,666 2,707 4,194 0 853 9,421Ravalli N Stevensville Industrial 1,394 1,909 3,536 1,668 239 8,746Ravalli Stevensville Airport 1,123 1,538 2,849 1,344 192 7,047Silver Bow Ramsey TIFID 408,352 1,445,947 841,205 0 61,062 2,756,567Toole Shelby Industrial 21,843 35,728 59,125 57,405 2,935 177,036
Flathead Kalispell G 10,154 15,839 25,034 19,956 2,936 73,919Gallatin S Bozeman Tech District 0 0 0 0 0 0Missoula Technology District 28,800 58,292 72,391 0 42,673 202,156
Cascade GF DT Urban Renewal 24,377 32,099 58,300 50,077 5,869 170,722Cascade GF West Bank 63,135 83,136 150,995 129,699 15,201 442,167Chouteau 1TID 5,454 7,621 14,346 13,205 2,219 42,845Chouteau 2TID 5,477 7,653 14,406 13,260 2,228 43,024Custer Miles City Downtown 5,268 10,906 20,007 12,339 264 48,783Deer Lodge Ana - Downtown 16,237 52,396 33,858 6,011 27,318 135,820Fergus Lewistown Urban 6,306 9,571 23,388 15,805 59 55,129Flathead Columbia Falls URD 279 435 928 604 69 2,316Flathead Kalispell B 70,057 109,275 231,942 137,681 20,258 569,213Flathead Kalispell C - amended 2011 26,438 41,237 87,528 51,957 8,633 215,793Flathead Whitefish A 966,429 1,507,426 2,426,754 691,648 457,154 6,049,411Gallatin Bozeman Downtown 358,142 378,537 1,070,468 766,424 37,829 2,611,400Gallatin Bozeman Midtown URD 90,128 95,261 269,388 192,874 9,520 657,170Gallatin NE Urban Renewal 21,258 22,468 63,538 45,491 2,245 155,001Jefferson Whitehall Urban Renewal 13,956 20,758 25,972 18,381 3,996 83,062Lake Polson 25,732 40,866 65,392 47,225 5,722 184,938Lewis & Clark Railroad District Urban Renewal 15,434 28,118 46,260 26,760 1,507 118,080Lincoln Riverside 11,606 18,552 24,016 20,735 2,012 76,921Missoula Hellgate URD 13,450 23,686 43,858 36,250 7,657 124,902Missoula N. Reserve Scott St. URD 21,658 38,141 70,621 58,371 12,330 201,121Missoula N Reserve Scott St. URD 59,973 105,615 173,606 161,636 34,142 534,972Missoula Front St URD 48,483 85,380 158,089 130,667 27,601 450,219Missoula River Front URD 18,110 31,893 59,052 48,809 10,310 168,174Missoula URD II 241,853 425,912 788,616 651,825 137,684 2,245,891Missoula URD II 36,368 64,045 105,274 98,016 20,704 324,406Missoula URD III 292,380 514,892 953,372 788,003 166,449 2,715,096Park Livingston Urban Renewal 20,623 24,793 59,391 51,624 380 156,811Silver Bow Butte Uptown URD 180,770 640,095 442,990 0 132,852 1,396,706Silver Bow Eastside TIFID 24,087 85,290 59,027 0 17,702 186,105Yellowstone 2008 Expanded N 27th St 314,329 368,954 997,156 522,470 53,895 2,256,804Yellowstone East Billings 116,022 136,185 368,061 192,849 19,893 833,010Yellowstone Laurel 96,348 113,391 221,990 188,642 16,520 636,891Yellowstone North 27th St 58,731 68,937 186,313 97,621 10,070 421,672Yellowstone South Billings Blvd 480,280 563,745 1,351,258 798,310 82,349 3,275,942
Flathead Columbia Falls Industrial Park TEDD 27,064 42,215 89,982 58,556 6,710 224,527Flathead Glacier Rail Park TEDD 59 92 195 116 17 478Lincoln Kootenai Business Park 1 930 1,486 2,748 0 471 5,636Lincoln Kootenai Business Park 3 5,075 8,112 14,999 0 113 28,299Lincoln Kootenai Business Park 2 342 547 1,011 589 8 2,496Missoula Bonner W Log Yard TEDD 9,031 18,279 29,647 0 13,381 70,338Missoula Bonner W Log Yard TEDD 7,231 14,636 23,737 0 13,747 59,350Yellowstone Lockwood TEDD 0 0 0 0 0 0Total 5,571,918 10,688,524 14,728,273 6,639,817 2,245,574 39,874,104
TY 2017 Taxable Value of Increment and Revenue Generated for the DistrictTax Increment Financing Districts (TIF) / Targeted Economic Development Districts (TEDD)
Targeted Economic Development Districts (TEDD)
Industrial Tax Increment Financing Districts
Technology Tax Increment Financing Districts
Urban Renewal Tax Increment Financing Districts
Page 12
173revenue.mt.gov
County District2018 Total Taxable
ValueTaxable Value of
BaseIncremental
Taxable Value
Big Horn Hardin Industrial 1,806,588 465,144 1,341,444Cascade East Industrial Park 467,686 2,322 465,364Cascade Airport TID 155,466 107,149 48,317Cascade Int'l Malting TID 802,165 362,124 440,041Cascade Manchester Exit 68,746 3,217 65,529Cascade Montana Milling 47,748 381 47,367Deer Lodge Mill Creek 8,012,523 909,339 7,103,184Flathead Kalispell H 15,908 126 15,782Gallatin Mandeville Farm 265,081 244,332 20,749Hill Hill Co Industrial 1,043 912 131Jefferson North Jefferson Co Industrial 101,359 18,590 82,769Jefferson Sunlight Industrial (4FT) 1,268,554 737,334 531,220Missoula Bonner Mill Industrial 753,941 121,676 632,265Park West End Industrial 149,459 128 149,331Ravalli Hamilton Airport 128,808 107,624 21,184Ravalli N Stevensville Industrial 122,981 109,850 13,131Ravalli Stevensville Airport 67,530 49,132 18,398Silver Bow Ramsey TIFID 5,339,662 1,721,230 3,618,432Toole Shelby Industrial 303,240 89,401 213,839
Flathead Kalispell G 88,838 390 88,448Gallatin S Bozeman Tech District 305 305 0Missoula Technology District 284,441 0 284,441
Cascade GF DT Urban Renewal 3,933,236 3,643,698 289,538Cascade GF West Bank 1,065,439 292,536 772,903Chouteau 1TID 215,036 160,843 54,193Chouteau 2TID 74,499 17,494 57,005Custer Miles City Downtown 1,613,142 1,556,649 56,493Deer Lodge Ana - Downtown 1,051,316 856,215 195,101Fallon Baker Urban Renewal 712,351 699,066 13,285Fergus Lewistown Urban 1,538,724 1,482,192 56,532Flathead Columbia Falls URD 63,977 62,035 1,942Flathead Kalispell B 1,213,915 453,612 760,303Flathead Kalispell C - amended 2011 8,008,362 7,932,918 75,444Flathead Whitefish A 15,119,049 4,185,352 10,933,697Gallatin Belgrade Urban Renewal 2,287,231 2,201,304 85,927Gallatin Bozeman Downtown 5,488,691 1,328,695 4,159,996Gallatin Bozeman Midtown URD 4,490,297 4,064,574 425,723Gallatin NE Urban Renewal 652,101 423,054 229,047Jefferson Whitehall Urban Renewal 882,092 736,527 145,565Lake Polson 1,643,841 1,433,450 210,391Lewis And Clark Railroad District Urban Renewal 2,483,271 2,334,837 148,434Lincoln Riverside 520,702 347,928 172,774Missoula Hellgate URD 1,175,577 1,025,448 150,129Missoula N. Reserve Scott St. URD 583,552 295,864 287,688Missoula N Reserve Scott St. URD 2,114,679 1,195,341 919,338Missoula Front St URD 1,931,931 1,413,035 518,896Missoula River Front URD 702,205 157,858 544,347Missoula URD II 3,936,281 1,546,186 2,390,095Missoula URD II 663,919 313,637 350,282Missoula URD III 11,134,939 8,172,844 2,962,095Park Livingston Urban Renewal 1,871,913 1,604,273 267,640Silver Bow Butte Uptown URD 5,427,191 3,587,625 1,839,566Silver Bow Eastside TIFID 520,564 286,251 234,313Yellowstone 2008 Expanded N 27th St 5,861,481 3,328,807 2,532,674Yellowstone East Billings 2,967,167 1,939,797 1,027,370Yellowstone Laurel 2,200,111 1,169,223 1,030,888Yellowstone North 27th St 1,360,038 783,431 576,607Yellowstone South Billings Blvd 11,726,572 7,046,472 4,680,100
Fergus Lewistown TEDD 201,083 196,783 4,300Flathead Columbia Falls Industrial Park TEDD 2,117,872 1,896,297 221,575Flathead Glacier Rail Park TEDD 7,598 7,057 541Lincoln Kootenai Business Park 195,514 157,299 38,215Missoula Bonner W Log Yard TEDD 91,121 0 91,121Missoula Bonner W Log Yard TEDD 74,659 1,148 73,511Silver Bow South Butte TEDD 1,267,716 1,267,716 0Yellowstone Lockwood TEDD 892,060 752,028 140,032Total 132,335,087 77,408,105 54,926,982
Tax Increment Financing Districts (TIF) / Targeted Economic Development Districts (TEDD)TY 2018 Taxable Value of Increment and Revenue Generated for the District
Industrial Tax Increment Financing Districts
Technology Tax Increment Financing Districts
Urban Renewal Tax Increment Financing Districts
Targeted Economic Development Districts (TEDD)
Tax Increment Financing
Page 13
174revenue.mt.gov
County District State CountyCountywide and Local
Schools Cities & Towns Misc Total Revenue
Big Horn Hardin Industrial 127,437 185,247 390,897 223,511 12,663 939,755Cascade East Industrial Park 44,908 60,330 138,544 93,650 9,037 346,468Cascade Airport TID 4,663 6,264 14,384 9,723 0 35,034Cascade Int'l Malting TID 42,464 57,047 131,005 88,554 0 319,069Cascade Manchester Exit 6,324 10,487 19,509 0 1,172 37,492Cascade Montana Milling 4,571 7,581 14,102 0 847 27,101Deer Lodge Mill Creek 674,802 2,327,784 1,467,376 0 147,174 4,617,136Flathead Kalispell H 1,499 2,215 4,841 2,884 363 11,803Gallatin Mandeville Farm 1,971 2,051 6,235 3,927 41 14,226Hill Hill Co Industrial 12 23 41 0 2 78Jefferson North Jefferson Co Industrial 7,863 14,492 19,652 0 3,898 45,906Jefferson Sunlight Industrial (4FT) 50,466 93,011 87,428 0 9,053 239,958Missoula Bonner Mill Industrial 61,014 129,387 216,329 0 103,420 510,149Park West End Industrial 14,186 17,319 40,036 34,452 111 106,104Ravalli Hamilton Airport 2,012 3,336 5,313 0 683 11,344Ravalli N Stevensville Industrial 1,247 1,752 3,259 1,401 0 7,660Ravalli Stevensville Airport 1,748 2,455 4,566 1,964 0 10,732Silver Bow Ramsey TIFID 349,179 1,307,701 885,213 0 52,612 2,594,705Toole Shelby Industrial 20,315 39,056 67,483 55,331 2,989 185,175
Flathead Kalispell G 8,403 12,416 27,130 16,165 2,034 66,148Gallatin S Bozeman Tech District 0 0 0 0 0 0Missoula Technology District 27,449 58,208 64,616 0 35,919 186,192
Cascade GF DT Urban Renewal 27,940 37,536 86,198 58,267 5,689 215,631Cascade GF West Bank 74,585 100,199 230,101 155,539 15,188 575,612Chouteau 1TID 5,148 7,419 14,065 12,749 1,957 41,339Chouteau 2TID 5,415 7,804 14,795 13,411 2,058 43,484Custer Miles City Downtown 5,367 11,491 19,573 12,363 0 48,794Deer Lodge Ana - Downtown 18,535 63,937 40,304 6,711 27,667 157,154Fallon Baker Urban Renewal 1,262 1,786 754 2,858 0 6,660Fergus Lewistown Urban 5,371 8,245 20,788 13,727 0 48,130Flathead Columbia Falls URD 184 273 657 406 40 1,560Flathead Kalispell B 72,229 106,731 296,267 138,953 17,487 631,667Flathead Kalispell C - amended 2011 7,167 10,591 29,398 13,788 2,014 62,958Flathead Whitefish A 1,038,701 1,534,872 3,025,682 731,760 587,306 6,918,321Gallatin Belgrade Urban Renewal 8,163 8,496 29,269 19,971 296 66,196Gallatin Bozeman Downtown 395,200 411,299 1,250,162 787,238 8,320 2,852,218Gallatin Bozeman Midtown URD 40,444 42,091 127,938 80,564 851 291,888Gallatin NE Urban Renewal 21,759 22,646 68,833 43,345 458 157,041Jefferson Whitehall Urban Renewal 13,829 22,500 28,826 18,022 3,741 86,918Lake Polson 19,987 34,542 51,377 37,328 4,244 147,478Lewis And Clark Railroad District Urban Renewal 14,324 27,624 62,071 25,194 496 129,708Lincoln Riverside 16,414 25,150 34,838 30,356 2,528 109,286Missoula Hellgate URD 14,487 26,912 54,288 36,357 5,598 137,643Missoula N. Reserve Scott St. URD 27,762 51,571 104,031 69,669 10,728 263,761Missoula N Reserve Scott St. URD 88,716 164,801 310,994 222,636 34,282 821,429Missoula Front St URD 50,073 93,017 187,638 125,661 19,350 475,739Missoula River Front URD 52,529 97,580 196,841 131,825 20,299 499,074Missoula URD II 230,644 428,448 864,282 578,809 89,127 2,191,311Missoula URD II 33,802 62,792 118,493 84,828 13,062 312,977Missoula URD III 285,842 530,985 1,071,123 717,331 110,457 2,715,738Park Livingston Urban Renewal 25,426 31,041 71,754 61,747 198 190,166Silver Bow Butte Uptown URD 177,518 664,819 507,794 0 119,149 1,469,280Silver Bow Eastside TIFID 22,611 84,681 64,680 0 15,176 187,148Yellowstone 2008 Expanded N 27th St 244,403 315,976 811,975 413,130 8,332 1,793,817Yellowstone East Billings 99,141 128,175 329,375 167,585 3,380 727,655Yellowstone Laurel 99,481 129,129 277,226 187,116 3,392 696,344Yellowstone North 27th St 55,643 71,937 184,860 94,056 1,897 408,393Yellowstone South Billings Blvd 451,630 583,889 1,365,547 763,418 15,398 3,179,881
Fergus Lewistown TEDD 409 627 1,581 1,044 0 3,661Flathead Columbia Falls Industrial Park TEDD 21,050 31,105 74,996 46,311 4,565 178,027Flathead Glacier Rail Park TEDD 51 76 211 99 12 449Lincoln Kootenai Business Park 3,630 5,563 11,498 276 469 21,436Missoula Bonner W Log Yard TEDD 8,793 18,647 31,177 0 11,507 70,124Missoula Bonner W Log Yard TEDD 7,094 15,043 25,152 0 12,024 59,313Silver Bow South Butte TEDD 0 0 0 0 0 0Yellowstone Lockwood TEDD 13,513 25,258 64,338 0 461 103,569Total 5,258,806 10,385,468 15,769,712 6,436,009 1,561,221 39,411,215
Tax Increment Financing Districts (TIF) / Targeted Economic Development Districts (TEDD)TY 2018 Taxable Value of Increment and Revenue Generated for the District
Industrial Tax Increment Financing Districts
Technology Tax Increment Financing Districts
Urban Renewal Tax Increment Financing Districts
Targeted Economic Development Districts (TEDD)
Tax Increment Financing
Page 14
175revenue.mt.gov
Taxes Levied
Taxes LeviedThe following sections provide information on the value of property in Montana and the tax revenue derived from this property.
Taxes Levied – A Statewide LookIn Tax Year 2018, the full market value of non-exempt property eligible for taxation in Montana was estimated at $151.023 billion. Multiplying the applicable tax rates for each class of property by the taxable market value determines the taxable value. In Tax Year 2018, the total taxable value of property in Montana was estimated at $2.905 billion. This is an average tax rate of 1.92 percent.
In 2018, the total of property taxes paid was estimated at $1,752 billion. Therefore, the average mills levied was 603.3.
Taxable Market Value Taxable Value Average Tax Rate
Total $151,023,043,539 $2,904,772,508 1.92%
Montana Property 2018
Taxable Value Taxes Average Millage Rate Average Mills
Total $2,904,772,508 $1,752,461,527 0.60330 603.30
Montana Property 2018
Page 15
176revenue.mt.gov
Property Taxes Paid by Class
Property Taxes Paid by Class of Property in 2017The following table presents market value, taxable market value, and the taxes paid by class of property in the state in Tax Year 2017. Class 4 property provided 64.10 percent, Class 9 provided 14.84 percent, and Class 8 personal property paid 5.21 percent of total property taxes paid in the state.
The following graph compares the percent of property tax paid for each class of property in Tax Year 2017.
Tax Class Description Market Value Taxable Value Taxes Paid by
Tax ClassPercent of
Total Taxes
1 Mine Net Proceeds $3,983,884 $3,983,884 $1,663,481 0.10%2 Gross Proceeds Metal Mines $596,330,812 $17,889,922 $10,540,788 0.62%3 Agricultural Land $6,773,149,809 $152,939,062 $80,572,619 4.74%
4.1 Residential Improvements $71,819,718,701 $964,823,550 $599,049,221 35.28%4.2 Residential Land $27,489,914,546 $363,426,744 $224,438,413 13.22%4.8 Commercial Improvements $14,508,864,247 $270,164,282 $184,485,684 10.86%4.9 Commercial Land $6,199,894,368 $116,693,748 $80,513,895 4.74%
Subtotal Class 4 $120,018,391,862 $1,715,108,324 $1,088,487,213 64.10%5 Pollution Control Equipment $1,604,336,425 $47,670,939 $25,576,862 1.51%7 Non-Centrally Assessed Public Util. $14,329,565 $1,146,364 $835,551 0.05%8 Business Personal Property $6,664,537,325 $155,338,618 $88,481,210 5.21%9 Non-Elect. Gen. Prop. Of Electrical Util. $4,211,367,133 $502,592,656 $252,077,089 14.84%
10 Forest Land $1,327,634,179 $4,912,562 $2,640,259 0.16%12 Railroad and Airline Property $3,107,554,738 $95,052,168 $52,846,656 3.11%13 Telecommunication & Electric Property $2,986,239,384 $179,089,959 $83,887,621 4.94%14 Commercial Wind Generation Facilities $841,476,695 $16,958,003 $9,603,932 0.57%15 Carbon Dioxide and Liquid Pipeline $190,178,993 $2,532,568 $982,478 0.06%
Total $148,339,510,804 $2,895,215,029 $1,698,195,759
Estimated Property Taxes Paid By Property ClassTax Year 2017 (Fiscal Year 2018)
0.10%0.62%
4.74%
48.49%
15.60%
1.51%0.05%
5.21%
14.84%
0.16%3.11%4.94% 0.57%
0.06%
Percent of Property Taxes Paid by Class TY2017
Mine Net ProceedsGross Proceeds Metal MinesAgricultural LandResidentialCommercialPollution Control EquipmentNon-Centrally Assessed Public Util.Business Personal PropertyNon-Elect. Gen. Prop. Of Electrical Util.Forest LandRailroad and Airline PropertyTelecommunication & Electric PropertyCommercial Wind Generation FacilitiesCarbon Dioxide and Liquid Pipeline
Page 16
177revenue.mt.gov
Property Taxes Paid by Class
Property Taxes Paid by Class of Property in 2018The following table presents market value, taxable market value, and the taxes paid by class of property in the state in Tax Year 2018. Class 4 property provided 64.46 percent, Class 9 provided 14.82 percent, and personal property paid 5.27 percent of total property taxes paid in the state.
The following graph compares the percent of property tax paid for each class of property in Tax Year 2018.
Tax Class Description Market Value Taxable Value Taxes Paid by
Tax ClassPercent of
Total Taxes1 Mine Net Proceeds $4,794,622 $4,794,622 $1,930,216 0.11%2 Gross Proceeds Metal Mines $742,469,971 $22,274,100 $13,047,519 0.74%3 Agricultural Land $6,753,405,034 $152,576,949 $82,081,810 4.68%
4.1 Residential Improvements $73,899,125,456 $987,734,976 $626,526,133 35.75%4.2 Residential Land $27,710,304,492 $364,026,323 $229,649,792 13.10%4.8 Commercial Improvements $14,681,978,732 $273,677,910 $191,356,525 10.92%4.9 Commercial Land $6,181,878,587 $116,352,932 $82,016,084 4.68%
Subtotal Class 4 $122,473,287,267 $1,741,792,141 $1,129,548,534 64.46%5 Pollution Control Equipment $1,970,360,360 $47,312,291 $26,009,480 1.48%7 Non-Centrally Assessed Public Util. $15,191,024 $1,215,281 $911,447 0.05%8 Business Personal Property $6,949,617,276 $155,861,423 $92,316,434 5.27%9 Non-Elect. Gen. Prop. Of Electrical Util. $4,176,210,477 $495,370,951 $259,741,619 14.82%
10 Forest Land $1,323,802,727 $4,898,379 $2,633,117 0.15%12 Railroad and Airline Property $2,823,508,511 $87,932,183 $50,029,906 2.85%13 Telecommunication & Electric Property $2,877,270,073 $172,526,493 $84,435,089 4.82%14 Commercial Wind Generation Facilities $761,927,227 $16,207,755 $8,993,866 0.51%15 Carbon Dioxide and Liquid Pipeline $151,198,970 $2,009,940 $778,679 0.04%
Total $151,023,043,539 $2,904,772,508 $1,752,457,716
Estimated Property Taxes Paid By Property ClassTax Year 2018 (Fiscal Year 2019)
0.11%0.74%4.68%
48.86%
15.60%
1.48%
0.05%
5.27%
14.82%
0.15%
2.85%4.82%
0.51%0.04%
Percent of Property Taxes Paid by Class TY2018Mine Net ProceedsGross Proceeds Metal MinesAgricultural LandResidentialCommercialPollution Control EquipmentNon-Centrally Assessed Public Util.Business Personal PropertyNon-Elect. Gen. Prop. Of Electrical Util.Forest LandRailroad and Airline PropertyTelecommunication & Electric PropertyCommercial Wind Generation FacilitiesCarbon Dioxide and Liquid Pipeline
Page 17
178revenue.mt.gov
Property Taxes Paid by Taxing Jurisdiction Type
Property Taxes by Taxing JurisdictionThe next table shows statewide property tax collections for different types of taxing jurisdictions for Fiscal Years 2016 through 2019. The difference between the previous estimates of total tax collection by property type and the following estimates of total tax collections by type is primarily due to local abatements and the difference between county taxable value and state taxable value. Local abatements lower taxable value for the county but not for the state. In the “Estimated Property Taxes Paid by Property Class” table on the this page, taxes paid does not include the difference related to abated property, but the “Taxes Levied on the Montana Property Tax Bill” on the next page does include the difference.
Page 18
179revenue.mt.gov
Property Taxes Paid by Taxing Jurisdiction Type
FY 2016 FY 2017 FY 2018 FY 2019
Valuation1
Market Value of Taxable Property 135,220,585,424 136,934,429,644 148,339,510,804 151,023,043,539Statewide Total Taxable Value 2,619,721,826 2,691,987,518 2,895,215,029 2,904,772,508City/Town Taxable Value 899,768,492 919,157,377 979,467,125 990,265,593
Taxes Levied2
StateUniversity 15,822,579 15,491,504 17,455,388 17,563,962Vo-Tech (General Fund) 1,344,028 1,369,397 1,451,966 1,469,488State General Fund 250,553,092 257,908,937 276,405,990 278,124,867
Subtotal State 267,719,699 274,769,838 295,313,344 297,158,316
CountyGeneral 115,323,300 116,876,741 126,609,859 124,058,556Road 53,799,325 55,615,371 56,393,977 60,829,727Bridge 12,953,170 15,113,861 14,172,207 15,075,882Entitlement 7,100,939 5,324,005 5,517,187 5,673,223County Fair 6,797,709 7,150,091 8,877,393 8,980,675Library 11,986,772 12,965,969 14,870,744 15,512,643Agricultural Extension 3,670,719 3,955,752 4,245,403 4,086,672Planning 2,914,576 3,138,904 3,312,845 3,393,007Health and Sanitation 10,008,092 10,842,902 43,696,194 46,555,306Hospital 4,280,524 3,683,031 3,769,007 3,640,887Airport 2,110,235 2,149,239 2,645,896 2,358,232District Court 7,030,337 7,247,268 7,307,808 7,619,265Weed Control 5,588,345 5,697,817 5,770,341 5,789,810Senior Citizens 3,298,693 5,171,256 8,400,186 8,823,073Public Safety 74,513,721 79,787,788 109,302,531 119,869,197Other 82,010,814 101,175,180 32,410,728 39,136,437
Subtotal County 403,387,271 435,895,178 447,302,306 471,402,590
Local SchoolsElementary 263,156,621 275,281,737 323,335,565 327,625,303High School 150,851,960 155,434,923 181,713,418 188,931,156K-12 58,935,893 63,852,009 74,580,017 89,522,972Jr. College 6,844,488 7,068,968 7,563,594 7,821,051
Subtotal Local Schools 479,788,961 501,637,637 587,192,594 613,900,481
County-Wide Schools 103,985,844 109,143,305 119,124,717 126,502,579
Cities and Towns 159,503,534 164,529,140 171,739,280 177,769,753
Fire and Miscellaneous 67,292,732 58,756,356 77,523,883 65,727,808
Total Property Tax Based on Mills $1,481,678,040 $1,544,731,454 $1,698,196,124 $1,752,461,527
S.I.D.'s and Fees $149,389,749 $176,274,421 $157,236,226 $178,739,245
Total Property Taxes $1,631,067,789 $1,721,005,875 $1,855,432,350 $1,931,200,772
Taxes Levied on the Montana Property Tax Bill
1 State taxable value include local abatements, Source: State Assessor's Report
2 Includes revenue distributed to TIFDs, Source: Taxes Levied Report
Page 19
180revenue.mt.gov
Property Taxes Paid by Taxing Jurisdiction Type
In Fiscal Year 2017, approximately $1.544 billion in property tax revenue was used by the state and local jurisdictions. Of this amount, approximately 17.93 percent was budgeted by the state for educational purposes, 27.75 percent was budgeted for county services, 32.66 percent was used to fund local schools, 7.11 percent was used to fund educational retirement and transportation, 10.72 percent was budgeted for cities, and towns, services, and 3.83 percent was budgeted for fire and other miscellaneous services. As presented in the following table, the Fiscal Year 2018 distributions were similar.
The following pie chart presents the allocation of property tax usage by taxing jurisdiction type for Fiscal Year 2019.
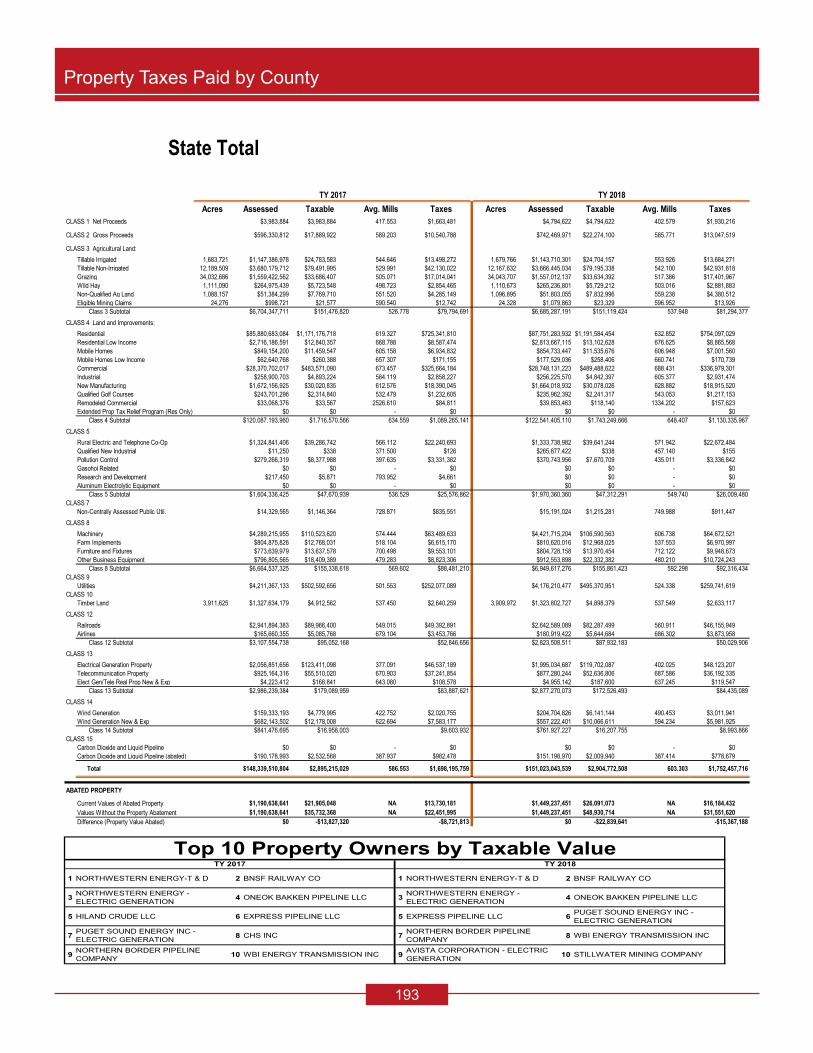
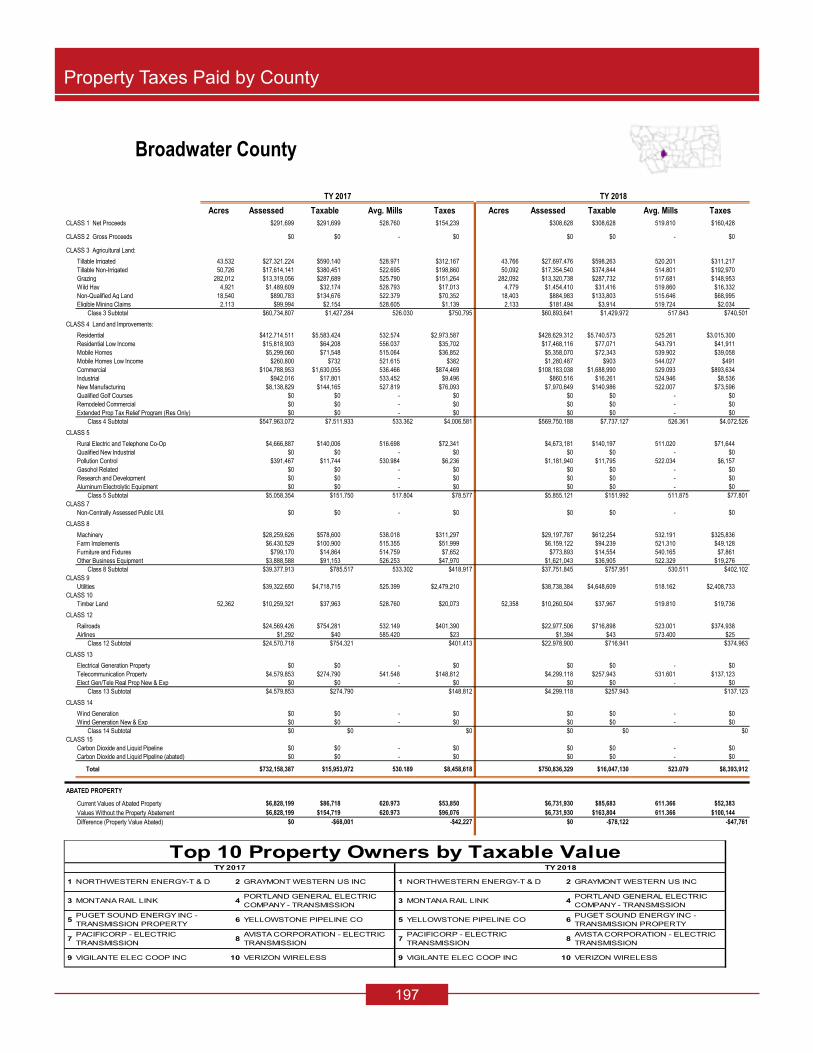
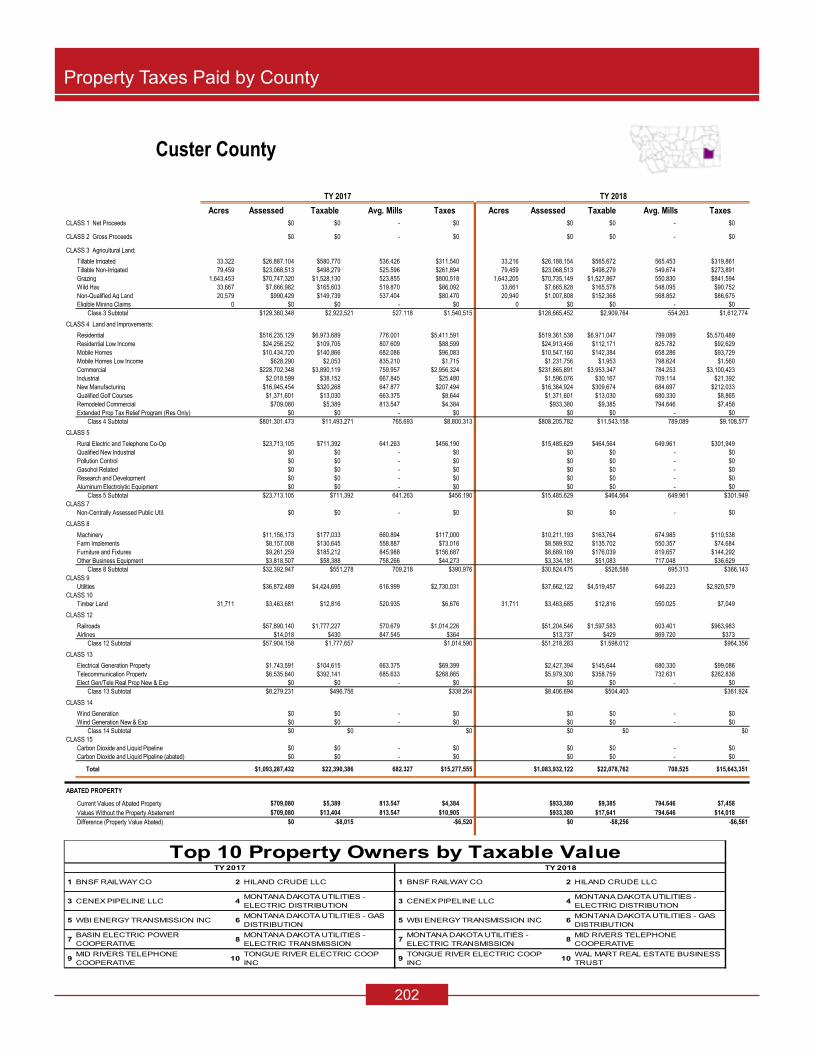
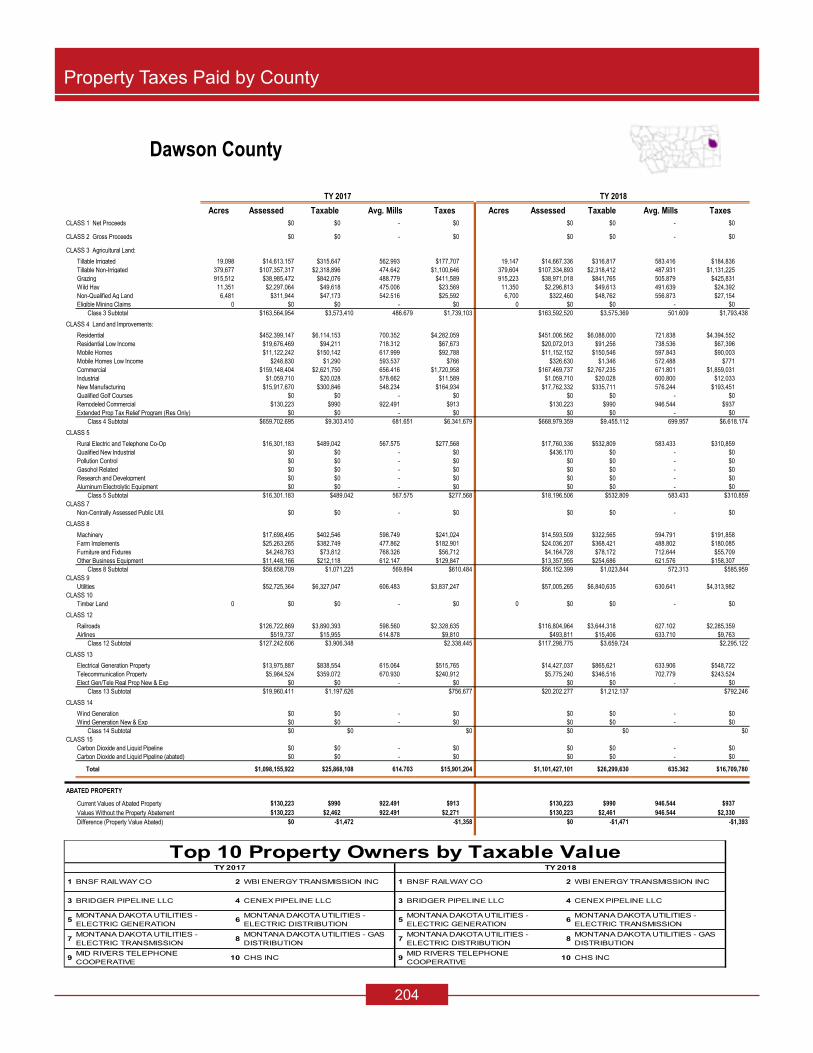
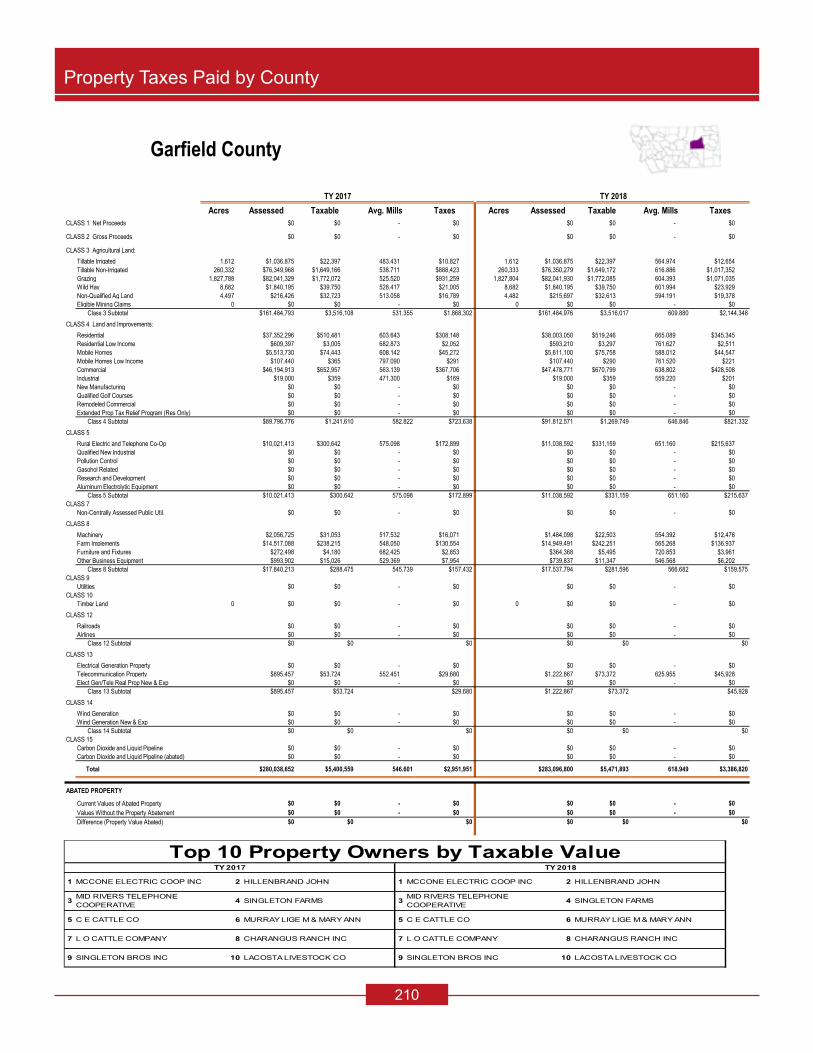
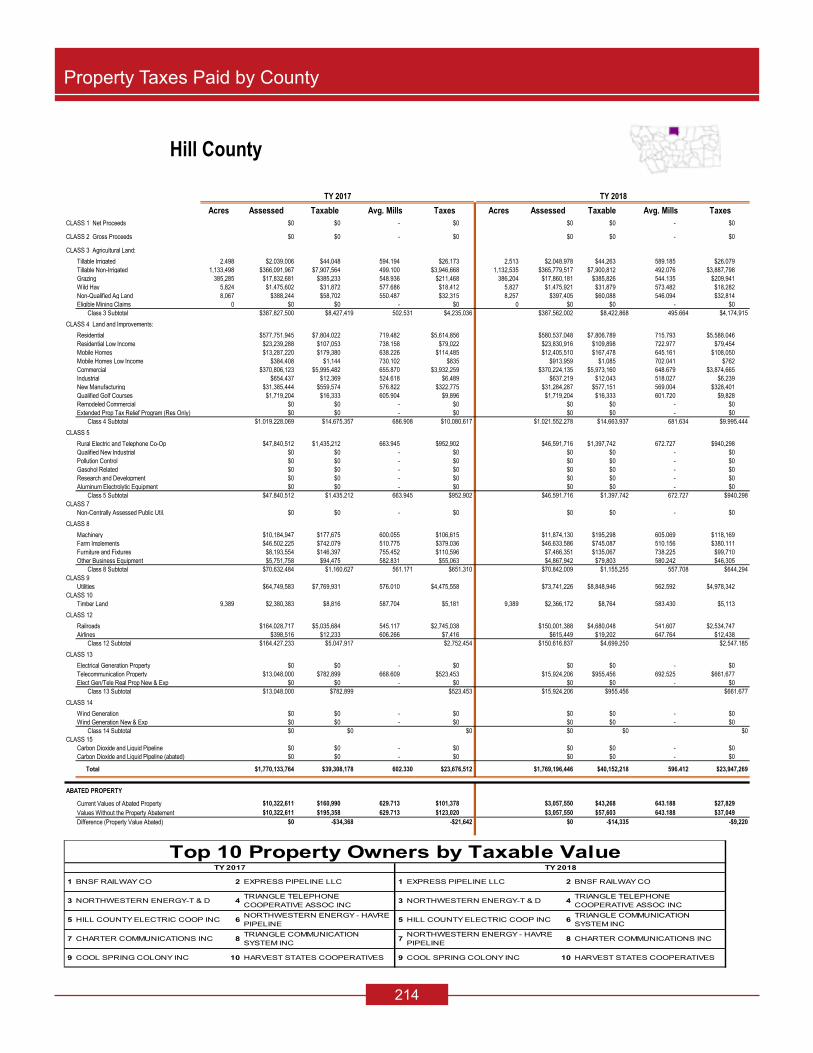
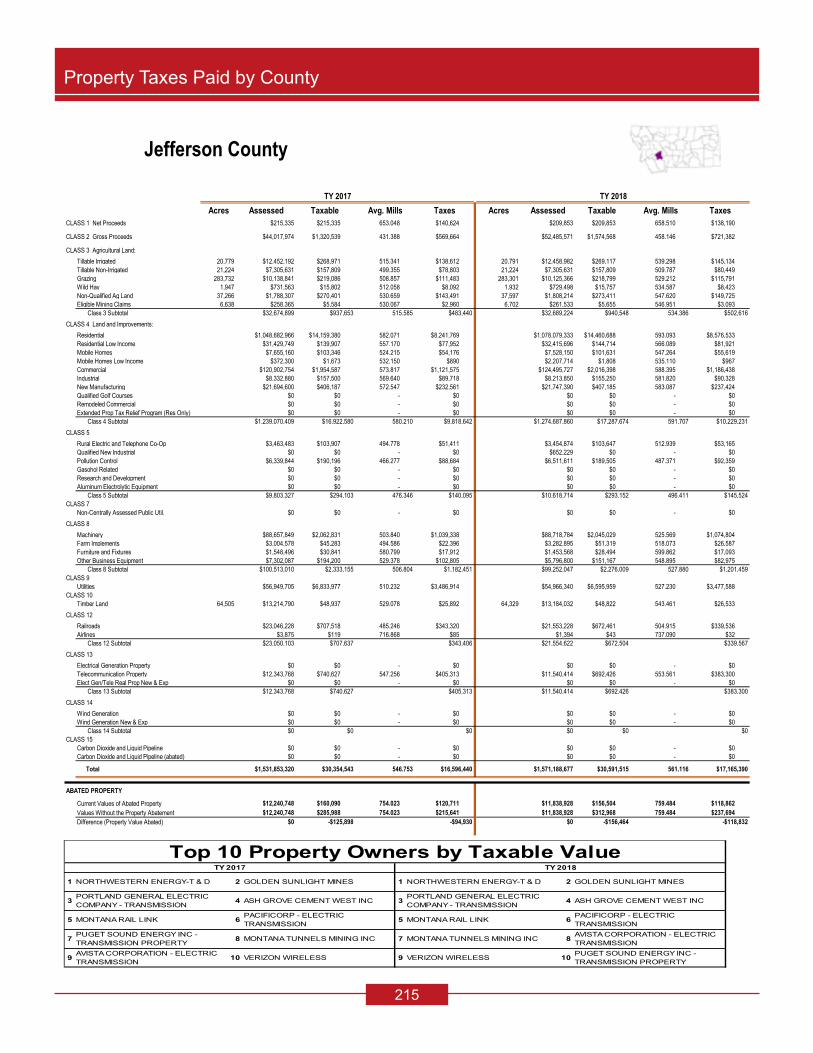
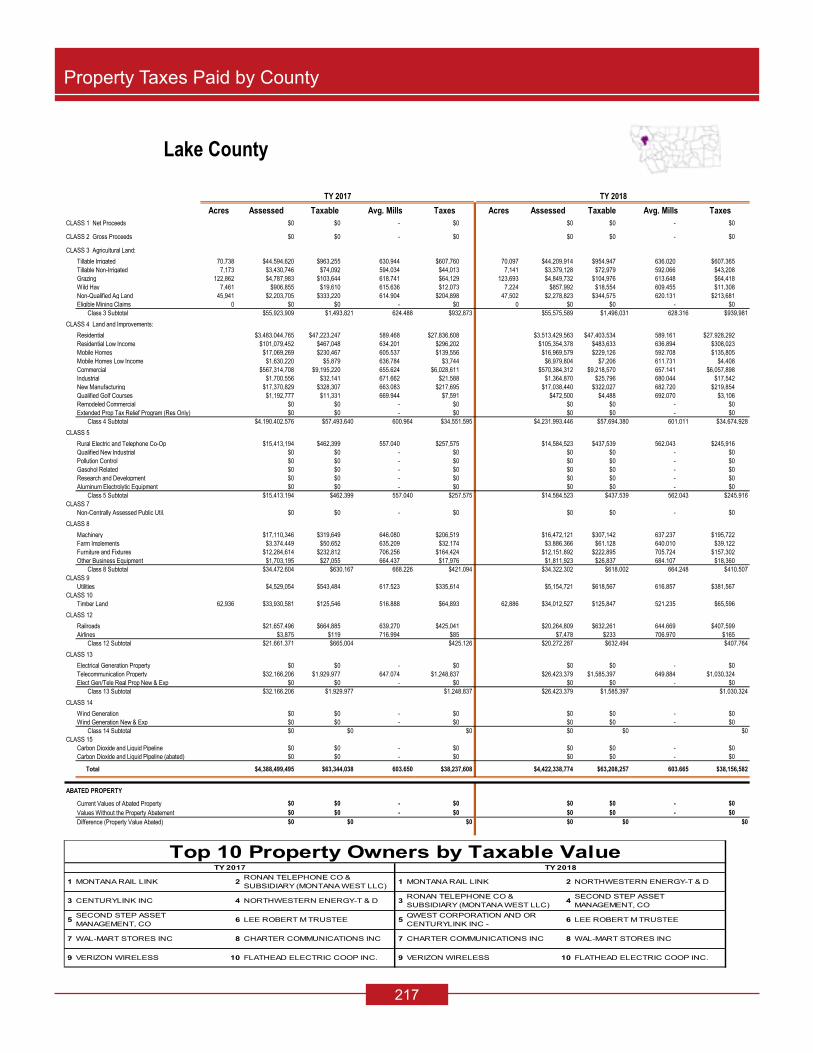
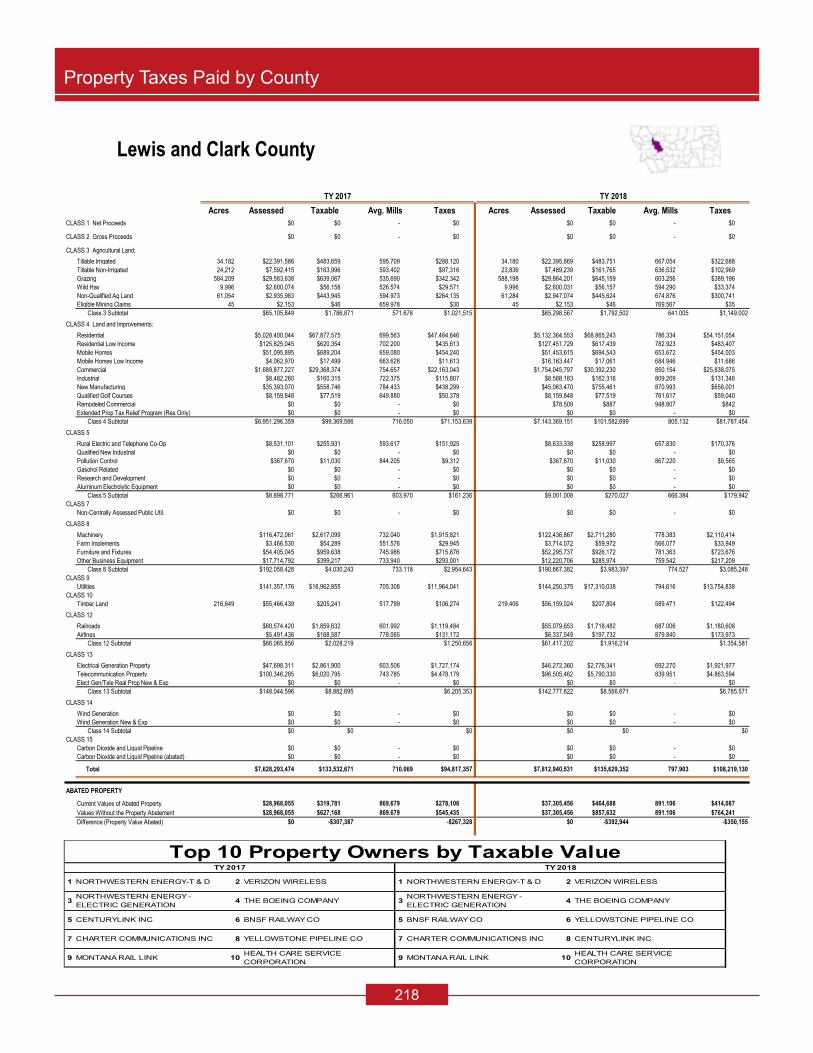
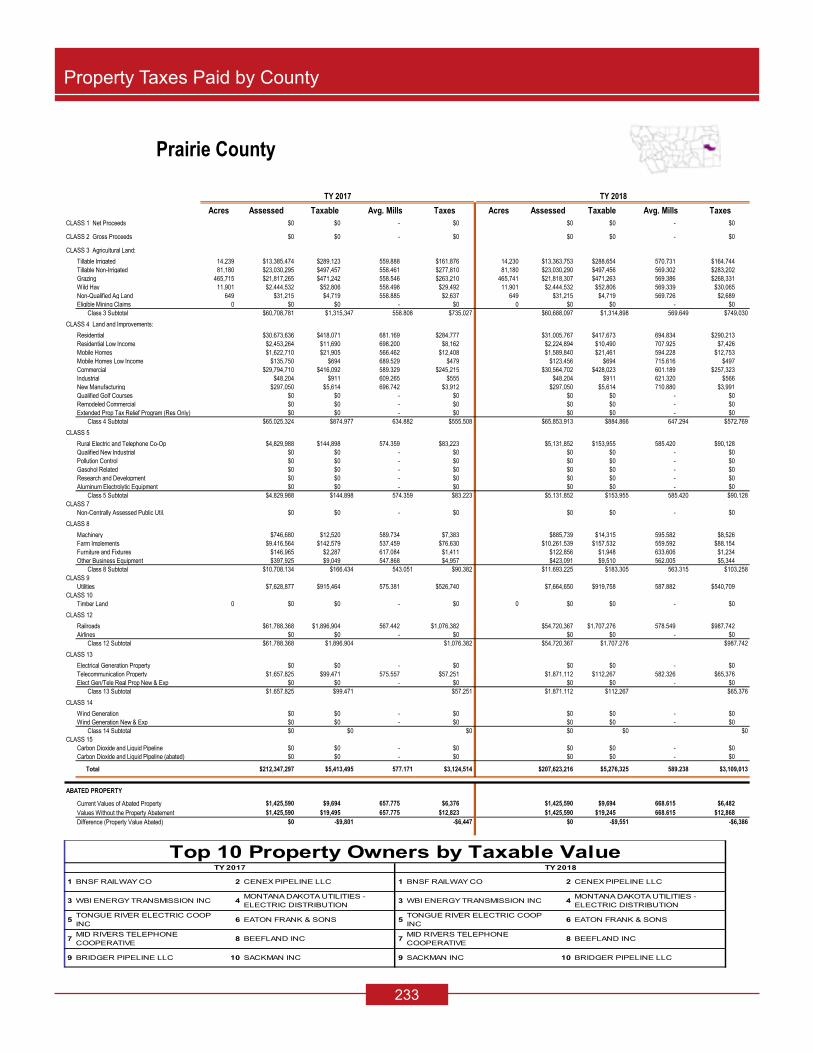
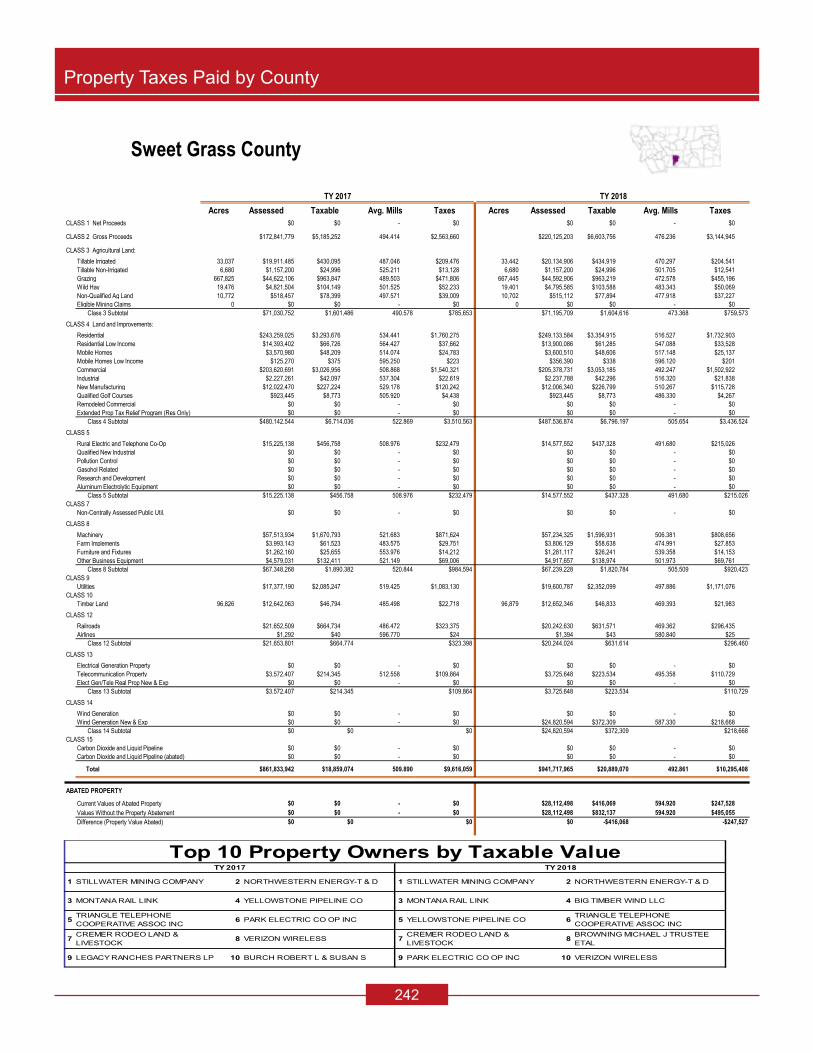
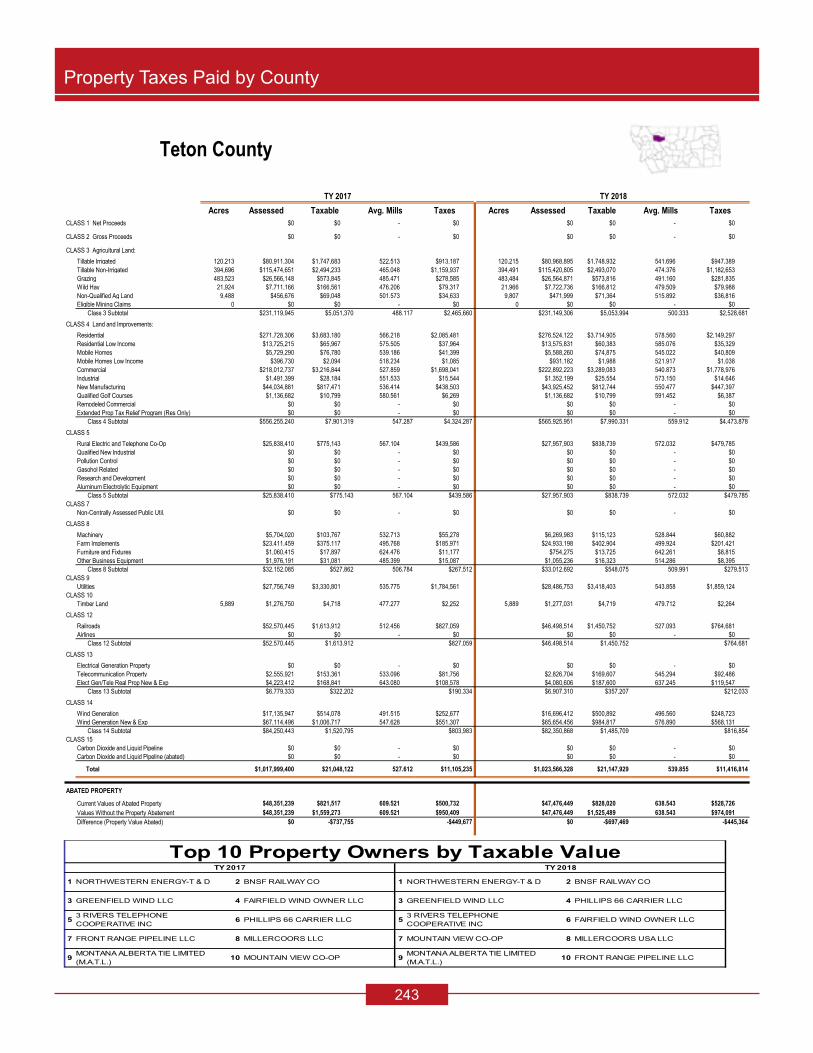
Tax Revenue by CountyThe following two-page tables presents property tax revenue collected for each county in Tax Year 2017 and Tax Year 2018 by each type of taxing jurisdiction.
Taxing Jurisdiction Tax Revenue Percent of Total Tax Revenue Percent of TotalState $295,313,344 17.39% $297,158,316 16.96%County $447,302,306 26.34% $471,402,590 26.90%Local Schools $587,192,594 34.58% $613,900,481 35.03%County-Wide Schools $119,124,717 7.01% $126,502,579 7.22%Cities and Towns $171,739,280 10.11% $177,769,753 10.14%Fire and Micellaneous $77,523,883 4.57% $65,727,808 3.75%
$1,698,196,124 100.00% $1,752,461,527 100.00%
Taxes Levied by Jurisdiction TypeFY2018 FY2019
16.96%
26.90%
35.03%
7.22%
10.14%
3.75%
Allocation of Property Taxes by Taxing Jurisdiction Type in FY 2019
State
County
Local Schools
County-Wide Schools
Cities and Towns
Fire and Micellaneous
Page 20
181revenue.mt.gov
Property Tax and Property Value Summaries
County
Mill Levy Revenue Mill Levy Revenue Mill Levy RevenueBeaverhead 101.000 2,190,759 163.582 3,546,050 50.931 1,104,062Big Horn 101.000 2,571,638 158.705 4,021,939 45.833 1,161,502Blaine 101.000 1,471,390 284.118 4,131,000 60.662 882,004Broadwater 101.000 1,619,412 165.080 2,633,685 33.028 526,930Carbon 101.000 4,097,598 127.925 5,164,001 46.145 1,862,751Carter 101.000 5,284,799 109.315 5,719,877 4.311 225,557Cascade 102.500 16,813,599 138.469 22,658,946 49.041 8,024,977Chouteau 101.000 2,582,962 186.041 4,737,619 40.698 1,036,381Custer 101.000 2,262,238 200.174 4,481,978 98.747 2,210,990Daniels 101.000 778,240 170.198 1,311,437 42.860 330,254Dawson 101.000 2,612,828 148.565 3,843,088 98.815 2,556,146Deer Lodge 101.000 2,097,286 324.143 6,728,197 36.741 762,624Fallon 101.000 4,459,533 157.034 6,915,350 0.000 0Fergus 101.000 3,742,842 165.731 5,678,147 50.428 1,727,716Flathead 101.000 25,752,860 152.439 38,821,626 71.108 18,109,123Gallatin 101.000 29,490,426 106.572 31,104,481 46.249 13,498,339Garfield 101.000 545,456 245.276 1,324,628 46.673 252,059Glacier 101.000 2,788,940 229.690 6,175,455 66.420 1,785,769Golden Valley 101.000 618,913 153.312 939,475 41.745 255,805Granite 101.000 1,277,137 222.700 2,811,485 31.535 398,121Hill 101.000 3,973,551 152.861 6,008,704 58.124 2,284,757Jefferson 101.000 3,081,974 165.725 5,030,517 44.565 1,352,763Judith Basin 101.000 1,691,850 123.572 1,982,278 33.566 538,454Lake 101.000 6,397,748 195.932 12,411,129 52.656 3,335,433Lewis & Clark 102.500 13,719,756 191.039 25,509,888 46.071 6,151,966Liberty 101.000 970,747 225.161 2,164,108 23.112 222,136Lincoln 101.000 3,574,531 141.240 4,998,093 46.118 1,631,976Madison 101.000 11,254,195 94.667 10,545,178 10.268 1,143,734McCone 101.000 764,673 259.851 1,966,060 38.929 294,540Meagher 101.000 880,208 189.470 1,622,295 30.066 257,433Mineral 101.000 1,116,249 191.914 2,114,717 56.423 621,723Missoula 102.500 23,633,595 183.614 42,289,888 46.894 10,800,610Musselshell 101.000 1,367,704 203.953 2,582,422 41.926 530,856Park 101.000 4,486,318 124.959 5,550,549 46.816 2,079,500Petroleum 101.000 168,900 230.705 385,803 33.497 56,017Phillips 101.000 1,902,415 131.556 2,477,964 45.696 860,724Pondera 101.000 1,669,670 230.117 3,771,602 47.428 777,335Powder River 101.000 1,544,233 170.851 2,612,212 8.844 135,220Powell 101.000 1,795,749 172.645 3,069,571 48.013 853,661Prairie 101.000 547,728 252.984 1,369,528 32.686 176,943Ravalli 101.000 8,027,907 148.843 11,830,644 27.780 2,208,110Richland 101.000 7,359,025 142.304 10,352,519 0.000 0Roosevelt 101.000 3,649,688 216.551 7,710,691 49.303 1,755,536Rosebud 101.000 9,564,154 56.019 5,304,692 12.665 1,199,327Sanders 101.000 4,171,758 132.555 5,475,104 41.679 1,721,534Sheridan 101.000 1,839,458 231.005 4,172,676 51.370 927,900Silver Bow 102.500 6,981,878 357.004 24,309,845 32.677 2,225,119Stillwater 101.000 4,168,342 168.665 6,960,910 38.351 1,582,754Sweet Grass 101.000 1,904,767 199.217 3,757,045 37.571 708,552Teton 101.000 2,200,306 130.248 2,741,475 48.942 1,030,131Toole 101.000 2,749,270 231.167 5,509,846 38.876 926,605Treasure 101.000 540,588 167.911 898,720 22.600 120,966Valley 101.000 3,204,704 132.237 4,195,858 50.694 1,608,520Wheatland 101.000 1,706,507 136.984 2,202,246 29.340 471,697Wibaux 101.000 1,575,179 146.539 2,285,394 16.167 252,132Yellowstone 102.500 38,068,797 130.538 48,383,673 51.619 19,132,534Statewide Total 295,312,979 447,302,306 126,688,311
Property Taxes Levied and Average Mills - TY 2017
State Assessed Mills1 and Revenue
County Assessed Mills and Revenue
County Wide School Mills2 and Revenue
3. Total taxes from mill levies of all cities/towns within a county divided by total taxable value of the cities/towns.2. The mill levy represents an average fo all county wide levies, includeing the levy for Jr. Collegs where applicable.
1. State assessed mills include: 6 mills for the university system, 33 mills for elementary equalization and BASE program support, 22 mills for high school equalization and Base program support, 40 mills for state equalization aid to public schools, and 1.5 mills to support vocational-technical education.
Page 21
182revenue.mt.gov
Property Tax and Property Value Summaries
County
BeaverheadBig HornBlaineBroadwaterCarbonCarterCascadeChouteauCusterDanielsDawsonDeer LodgeFallonFergusFlatheadGallatinGarfieldGlacierGolden ValleyGraniteHillJeffersonJudith BasinLakeLewis & ClarkLibertyLincolnMadisonMcConeMeagherMineralMissoulaMusselshellParkPetroleumPhillipsPonderaPowder RiverPowellPrairieRavalliRichlandRooseveltRosebudSandersSheridanSilver BowStillwaterSweet GrassTetonTooleTreasureValleyWheatlandWibauxYellowstoneStatewide Total
Property Taxes Levied and Average Mills - TY 2017
SID's and Fees Total of All Taxes and Fees
Mill Levy Revenue Mill Levy Revenue Mill Levy Revenue Revenue Revenue242.564 5,258,182 14.195 307,709 56.738 916,220 42,201 13,365,183192.812 4,886,285 6.684 169,383 39.300 801,703 1,609,332 15,221,783187.604 2,727,717 7.729 112,372 65.626 816,747 1,798,808 11,940,037189.019 3,015,611 31.117 496,436 11.855 166,544 818,092 9,276,709195.074 7,874,659 18.527 747,905 38.600 1,221,055 813,894 21,781,864
35.682 1,867,041 0.113 5,898 2.081 108,067 65,634 13,276,873238.992 39,108,452 21.720 3,554,330 285.396 18,892,815 10,012,147 119,065,265187.918 4,785,427 30.307 771,785 26.209 593,720 461,299 14,969,194186.603 4,178,116 8.182 183,189 149.492 1,961,044 2,498,166 17,775,722172.737 1,331,001 76.654 590,647 43.329 274,114 361,933 4,977,625188.960 4,888,039 18.490 478,306 86.406 1,522,798 2,745,625 18,646,829192.266 3,990,835 59.258 1,230,004 11.295 175,428 0 14,984,375
24.048 1,059,027 4.582 201,791 13.117 542,199 82,064 13,259,965204.947 7,021,712 16.252 556,814 65.100 1,741,152 1,449,475 21,917,859231.259 58,894,440 29.863 7,605,252 68.180 11,597,277 17,015,820 177,796,399225.872 65,923,824 33.206 9,691,730 146.096 23,728,464 3,590,931 177,028,195144.931 782,706 0.000 0 9.231 47,102 88,528 3,040,480255.207 6,861,497 6.244 167,879 22.721 544,077 542,619 18,866,236184.375 1,129,819 2.276 13,945 6.364 36,433 17,633 3,012,023163.116 2,059,269 24.391 307,927 26.931 291,982 135,717 7,281,638209.571 8,237,855 13.969 549,078 94.441 2,622,567 3,484,834 27,161,346191.355 5,808,504 32.044 972,685 12.494 349,997 1,432,922 18,029,362157.377 2,524,556 9.986 160,188 5.875 90,597 5,399,913 12,387,835190.870 12,090,488 31.767 2,012,269 38.689 1,990,541 6,521,752 44,759,360263.594 35,198,386 21.190 2,829,532 175.649 11,407,829 1,077,099 95,894,456131.319 1,262,156 14.172 136,217 15.402 133,784 5,468 4,894,616217.596 7,700,129 24.134 854,022 25.806 791,733 2,788,366 22,338,851
51.258 5,709,774 34.880 3,885,423 5.339 571,963 2,126,744 35,237,011199.761 1,511,412 2.956 22,364 45.253 296,703 75,645 4,931,397239.670 2,052,127 11.001 94,193 25.942 193,014 86,374 5,185,643262.823 2,896,067 25.402 279,911 32.885 313,473 133,300 7,475,440295.031 67,951,357 73.702 16,975,052 323.271 32,646,776 10,243,229 204,540,507210.622 2,666,861 13.141 166,392 28.048 301,108 2,881,887 10,497,229192.994 8,572,579 18.019 800,375 88.242 2,807,933 2,667,560 26,964,814214.362 358,474 7.644 12,782 21.884 33,343 116,003 1,131,322183.076 3,448,385 6.046 113,888 36.078 574,915 1,815,701 11,193,991224.884 3,685,843 16.380 268,463 41.808 543,677 164,650 10,881,240
95.757 1,464,077 1.909 29,193 4.533 67,172 327,425 6,179,533222.479 3,955,602 13.916 247,421 25.771 382,258 886,032 11,190,295159.569 863,826 8.648 46,813 24.960 119,675 766,652 3,891,165191.281 15,203,821 45.126 3,586,815 43.142 2,847,894 3,121,339 46,826,531
74.504 5,420,124 0.000 0 28.248 1,683,840 3,785,299 28,600,808156.153 5,560,121 12.408 441,826 26.787 845,008 567,540 20,530,410
56.809 5,379,468 27.342 2,589,155 105.810 3,383,072 1,353,007 28,772,876167.445 6,916,248 16.629 686,856 21.857 835,702 1,769,059 21,576,262187.457 3,386,050 10.150 183,347 49.443 745,476 0 11,254,907211.498 14,401,764 59.190 4,030,503 0.561 37,902 10,622,992 62,610,004155.738 6,427,424 15.973 659,235 38.181 1,301,594 906,851 22,007,110128.237 2,418,436 16.900 318,723 33.455 508,537 23,390 9,639,450216.346 4,553,684 4.593 96,678 27.741 482,960 2,829,796 13,935,031198.192 4,723,884 7.196 171,520 51.187 1,015,836 670,408 15,767,368143.600 768,596 3.956 21,174 17.244 88,496 416,356 2,854,895228.597 7,253,337 15.714 498,604 52.173 1,363,721 2,857,044 20,981,787165.591 2,662,149 4.707 75,676 12.000 179,098 80,588 7,377,961
66.541 1,037,758 12.081 188,418 5.669 85,417 27,028 5,451,325237.190 87,914,016 17.067 6,325,791 216.564 34,116,725 41,054,059 274,995,595
579,628,999 77,523,883 171,739,281 157,236,226 1,855,431,984
Misc. & Fire District Average Mills & Revenue
City Average Mills3 and Revenue
Property Taxes Levied and Average Mills - TY 2017
Local School Average Mills and Revenue
Page 22
183revenue.mt.gov
Property Tax and Property Value Summaries
County
Mill Levy Revenue Mill Levy Revenue Mill Levy RevenueBeaverhead 101.000 2,189,365 175.718 3,806,768 42.442 919,478Big Horn 101.000 2,570,213 168.528 4,223,618 48.195 1,207,856Blaine 101.000 1,475,615 288.121 4,201,263 59.225 863,603Broadwater 101.000 1,628,650 170.580 2,737,320 36.216 581,157Carbon 101.000 4,215,630 125.908 5,237,533 39.549 1,645,168Carter 101.000 5,285,072 111.233 5,820,552 4.101 214,591Cascade 102.500 17,162,351 141.627 23,645,589 47.763 7,974,288Chouteau 101.000 2,680,031 189.215 4,998,669 42.854 1,132,127Custer 101.000 2,230,789 219.955 4,856,334 104.446 2,306,034Daniels 101.000 771,745 184.002 1,405,964 51.436 393,023Dawson 101.000 2,656,411 149.386 3,928,809 58.686 1,543,423Deer Lodge 101.000 2,073,681 327.661 6,724,517 45.249 928,643Fallon 101.000 4,402,989 160.308 6,975,413 0.000 0Fergus 101.000 4,254,984 168.520 6,123,702 52.023 1,890,407Flathead 101.000 26,048,342 156.485 40,319,338 71.719 18,478,891Gallatin 101.000 30,377,669 114.142 34,320,438 48.901 14,703,612Garfield 101.000 552,661 289.762 1,585,545 68.458 374,592Glacier 101.000 2,697,239 232.378 6,109,661 69.461 1,826,276Golden Valley 101.000 658,083 137.847 890,300 40.226 259,807Granite 101.000 1,311,500 226.264 2,934,486 37.932 491,956Hill 101.000 4,056,822 162.790 6,536,374 48.434 1,944,717Jefferson 101.000 3,105,546 173.348 5,302,975 47.743 1,460,545Judith Basin 101.000 1,796,441 126.055 2,173,056 32.582 561,685Lake 101.000 6,384,034 193.927 12,257,799 52.165 3,297,247Lewis & Clark 102.500 13,942,285 204.640 27,755,147 103.328 14,014,312Liberty 101.000 966,789 233.715 2,237,158 30.818 294,992Lincoln 101.000 3,536,308 145.506 5,094,001 40.647 1,422,987Madison 101.000 11,703,518 107.011 12,396,351 0.000 0McCone 101.000 758,743 265.720 1,996,169 44.765 336,287Meagher 101.000 863,859 193.120 1,630,322 28.517 240,738Mineral 101.000 1,083,317 197.038 2,112,810 41.230 442,105Missoula 102.500 23,772,011 190.309 44,097,296 45.537 10,551,656Musselshell 101.000 1,382,049 201.039 2,686,453 30.786 411,394Park 101.000 4,603,225 126.516 5,766,159 46.989 2,141,592Petroleum 101.000 168,830 253.195 423,238 59.573 99,582Phillips 101.000 1,711,357 148.266 2,512,245 57.351 971,762Pondera 101.000 1,690,308 234.424 3,890,104 48.622 806,848Powder River 101.000 1,445,077 180.158 2,577,650 1.081 15,467Powell 101.000 1,775,589 180.585 3,174,708 56.312 989,976Prairie 101.000 533,874 263.216 1,388,811 39.033 205,949Ravalli 101.000 8,154,791 153.417 12,386,997 33.169 2,678,070Richland 101.000 5,905,130 193.001 11,270,691 0.000 0Roosevelt 101.000 3,527,915 226.537 7,812,975 45.456 1,567,728Rosebud 101.000 9,135,916 61.302 5,545,057 24.319 2,199,785Sanders 101.000 4,266,612 132.794 5,609,718 36.860 1,557,083Sheridan 101.000 1,735,194 251.179 4,284,785 38.084 649,662Silver Bow 102.500 7,122,184 360.966 25,045,520 47.499 3,295,719Stillwater 101.000 4,420,558 169.430 7,415,605 37.754 1,652,409Sweet Grass 101.000 2,151,819 205.437 4,291,380 32.725 683,603Teton 101.000 2,206,385 140.247 2,965,929 56.756 1,200,265Toole 101.000 2,525,998 231.868 5,310,320 35.410 810,980Treasure 101.000 519,249 182.241 936,913 14.185 72,925Valley 101.000 3,173,223 136.238 4,280,298 57.022 1,791,499Wheatland 101.000 1,738,983 132.055 2,183,256 26.596 439,702Wibaux 101.000 1,632,037 147.044 2,376,054 12.693 205,109Yellowstone 102.500 38,417,517 144.136 52,828,961 47.951 17,575,042
Statewide Total 297,156,515 471,399,106 134,324,354
2. The mill levy represents an average fo all county wide levies, includeing the levy for Jr. Collegs where applicable. 3. Total taxes from mill levies of all cities/towns within a county divided by total taxable value of the cities/towns.
Property Taxes Levied and Average Mills - TY 2018
State Assessed Mills1 and Revenue
County Assessed Mills and Revenue
County Wide School Mills2 and Revenue
1. State assessed mills include: 6 mills for the university system, 33 mills for elementary equalization and BASE program support, 22 mills for high school equalization and Base program support, 40 mills for state equalization aid to public schools, and 1.5 mills to support vocational-technical education.
Page 23
184revenue.mt.gov
Property Tax and Property Value Summaries
County
BeaverheadBig HornBlaineBroadwaterCarbonCarterCascadeChouteauCusterDanielsDawsonDeer LodgeFallonFergusFlatheadGallatinGarfieldGlacierGolden ValleyGraniteHillJeffersonJudith BasinLakeLewis & ClarkLibertyLincolnMadisonMcConeMeagherMineralMissoulaMusselshellParkPetroleumPhillipsPonderaPowder RiverPowellPrairieRavalliRichlandRooseveltRosebudSandersSheridanSilver BowStillwaterSweet GrassTetonTooleTreasureValleyWheatlandWibauxYellowstone
Statewide Total
Property Taxes Levied and Average Mills - TY 2018
SID's and FeesTotal of All Taxes
and FeesMill Levy Revenue Mill Levy Revenue Mill Levy Revenue Revenue Revenue
240.222 5,204,205 13.640 295,508 209.076 1,154,778 78,713 13,648,814201.939 5,060,954 6.010 150,628 164.896 821,868 1,767,120 15,802,257189.601 2,764,688 3.917 57,111 404.261 840,143 1,890,617 12,093,040184.765 2,964,952 19.769 317,232 85.185 164,601 846,101 9,240,012193.959 8,068,357 19.288 802,343 128.745 1,137,723 4,824 21,111,577
36.126 1,890,402 0.000 0 265.747 109,217 67,084 13,386,919252.599 42,173,193 18.433 3,077,564 200.139 20,178,190 12,152,569 126,363,744178.204 4,707,784 30.518 806,223 215.358 601,550 495,111 15,421,495190.146 4,198,186 0.000 0 217.672 2,052,009 2,971,002 18,614,353179.454 1,371,214 64.558 493,288 205.584 281,850 417,771 5,134,854196.430 5,166,036 69.603 1,830,533 189.139 1,584,568 2,682,782 19,392,562163.178 3,348,866 53.958 1,107,379 34.393 180,271 95,714 14,459,071
48.107 2,093,247 4.615 200,823 207.704 584,243 92,877 14,349,592192.584 6,998,129 15.550 565,045 237.621 1,792,481 1,513,280 23,138,028242.377 62,450,073 29.602 7,627,221 136.808 11,949,974 15,759,405 182,633,244244.200 73,426,282 29.948 9,004,904 186.799 25,030,535 7,482,924 194,346,363150.655 824,368 0.000 0 159.228 49,653 98,014 3,484,835252.264 6,632,512 6.638 174,523 252.576 601,270 818,653 18,860,134183.860 1,187,482 2.950 19,054 91.875 42,939 23,818 3,081,483152.359 1,975,994 22.708 294,513 166.579 306,506 157,301 7,472,257211.547 8,494,087 5.016 201,413 226.453 2,713,857 3,558,175 27,505,444194.491 5,949,784 32.097 981,887 152.420 364,653 1,513,042 18,678,432146.122 2,518,989 10.029 172,885 150.479 92,918 5,649,353 12,965,326191.182 12,084,296 33.252 2,101,780 172.984 2,031,426 10,176,618 48,333,200282.980 38,380,420 15.333 2,079,562 171.694 12,047,403 7,471,766 115,690,896137.498 1,316,157 8.919 85,376 150.728 145,945 180,174 5,226,591216.547 7,581,044 22.589 790,799 171.848 814,323 2,864,530 22,103,992
50.243 5,820,237 34.894 4,042,209 137.006 598,765 2,854,676 37,415,755209.494 1,573,785 0.265 1,988 312.632 297,080 97,739 5,061,792231.636 1,955,477 10.340 87,292 174.036 198,642 97,079 5,073,410275.466 2,953,777 23.898 256,259 213.351 325,066 167,084 7,340,418292.258 67,720,334 59.966 13,894,893 242.371 31,470,162 16,672,649 208,179,000201.821 2,696,901 10.170 135,898 162.769 320,323 1,755,608 9,388,626186.367 8,493,971 18.444 840,610 226.637 2,979,144 2,866,619 27,691,321213.539 356,950 7.479 12,502 227.492 34,226 112,829 1,208,158191.327 3,241,869 4.491 76,096 231.035 638,028 1,867,422 11,018,780236.478 3,924,196 14.255 236,544 163.684 558,271 580,304 11,686,575
96.331 1,378,277 1.056 15,106 143.466 69,401 1,387,571 6,888,549228.504 4,017,118 0.000 0 132.815 389,455 1,251,266 11,598,112161.129 850,168 1.445 7,623 198.912 122,588 811,027 3,920,040193.435 15,618,045 29.115 2,350,779 205.997 2,777,930 3,705,971 47,672,584103.157 6,024,059 0.000 0 128.243 1,675,150 4,833,811 29,708,841156.850 5,409,537 12.298 424,154 238.347 973,202 913,801 20,629,311
54.934 4,969,034 28.223 2,552,911 79.096 4,599,568 1,493,771 30,496,042167.589 7,079,578 16.144 681,970 293.461 916,518 2,156,892 22,268,371227.173 3,875,278 8.776 149,709 263.701 799,972 22,896 11,517,496222.899 15,465,795 56.575 3,925,451 80.183 39,081 11,561,646 66,455,396135.486 5,929,940 17.991 787,414 189.177 1,385,426 928,196 22,519,549117.430 2,453,011 8.575 179,128 140.987 536,467 34,986 10,330,394214.880 4,544,257 0.282 5,971 136.295 494,008 2,845,982 14,262,796203.387 4,658,044 6.462 147,988 256.682 1,028,019 666,787 15,148,136164.978 848,164 2.000 10,281 408.636 93,509 339,794 2,820,836233.518 7,336,591 5.851 183,830 253.340 1,405,865 3,378,844 21,550,150169.207 2,797,476 0.000 0 163.082 188,577 156,854 7,504,849
71.689 1,158,406 11.314 182,817 165.361 92,618 31,210 5,678,251256.735 94,098,608 3.550 1,301,244 163.821 35,086,941 34,316,595 273,624,907
606,080,581 65,728,262 177,768,897 178,739,245 1,931,196,962
Misc. & Fire District Average Mills & Revenue City Average Mills3 and Revenue
Property Taxes Levied and Average Mills - TY 2018
Local School Average Mills and Revenue
Page 24
185revenue.mt.gov
Property Tax and Property Value Summaries
Tax Base and Revenue for Cities and Towns in 2017 and 2018The following table displays taxable value, mill rate, and estimated taxes levied for cities and towns. The cities listed are only those that levy mills to fund city municipal governments. The estimated taxes levied is the amount of property tax that is paid to the city government to fund the municipality. Property owners in these cities are levied other mills used to fund county governments, schools, miscellaneous districts, and the state.
Page 25
186revenue.mt.gov
Property Tax and Property Value Summaries
County City
Taxable Value Mill Levy Estimated Taxes Taxable Value Mill Levy Estimated TaxesBeaverhead Dillon 5,276,620 165.60 873,817 5,279,301 210.48 1,111,165Beaverhead Lima 252,504 167.93 42,404 243,952 178.78 43,613Big Horn Hardin 4,816,300 163.64 788,125 4,847,557 166.52 807,206Big Horn Lodge Grass 126,496 107.34 13,578 136,594 107.34 14,662Blaine Chinook 1,487,757 254.31 378,350 1,488,570 265.92 395,836Blaine Harlem 606,487 722.85 438,397 589,650 753.51 444,307Broadwater Townsend 1,906,096 87.37 166,544 1,932,275 85.19 164,601Carbon Bearcreek 136,875 96.00 13,140 136,742 96.00 13,127Carbon Bridger 735,897 235.17 173,061 734,242 241.72 177,480Carbon Fromberg 332,135 172.83 57,403 333,852 172.83 57,700Carbon Joliet 553,856 150.21 83,196 553,698 154.78 85,703Carbon Red Lodge 6,975,486 128.20 894,256 7,078,483 113.54 803,714Carter Ekalaka 406,686 265.73 108,067 410,981 265.75 109,217Cascade Belt 475,827 186.50 88,744 478,206 189.13 90,445Cascade Cascade 802,736 136.89 109,886 800,891 140.56 112,571Cascade Great Falls 95,790,732 194.84 18,664,102 99,167,007 201.12 19,944,590Cascade Neihart 371,547 80.97 30,083 374,947 81.57 30,583Chouteau Big Sandy 600,495 127.29 76,437 592,600 130.40 77,276Chouteau Fort Benton 1,954,113 232.70 454,719 1,961,392 235.25 461,408Chouteau Geraldine 257,802 242.68 62,564 239,268 262.74 62,866Custer Ismay 57,223 41.03 2,348 55,282 45.38 2,509Custer Miles City 9,215,070 212.55 1,958,696 9,371,798 218.69 2,049,500Daniels Flaxville 88,838 128.35 11,402 89,326 134.53 12,017Daniels Scobey 1,290,140 203.63 262,712 1,281,644 210.54 269,833Dawson Glendive 8,058,948 185.35 1,493,746 8,192,075 189.75 1,554,414Dawson Richey 185,421 156.68 29,052 185,726 162.36 30,154Deer Lodge Anaconda 5,225,054 33.57 175,428 5,241,507 34.39 180,271Fallon Baker 2,552,938 207.44 529,588 2,653,067 214.95 570,271Fallon Plevna 148,184 85.10 12,610 159,797 87.44 13,973Fergus Denton 247,724 290.09 71,861 233,042 313.42 73,039Fergus Grass Range 88,835 134.34 11,934 89,873 138.71 12,467Fergus Lewistown 6,606,041 239.48 1,582,022 6,651,856 242.75 1,614,705Fergus Moore 342,094 161.45 55,231 345,565 206.80 71,463Fergus Winifred 230,703 87.14 20,104 223,102 93.26 20,807Flathead Columbia Falls 7,234,265 198.05 1,432,763 7,260,026 208.74 1,515,465Flathead Kalispell 42,359,404 182.23 7,719,194 43,808,232 182.74 8,005,673Flathead Whitefish 34,976,412 69.91 2,445,321 36,280,067 66.95 2,428,836Gallatin Belgrade 11,807,725 229.59 2,710,993 12,541,373 232.37 2,914,213Gallatin Bozeman 106,225,288 185.55 19,710,229 109,713,783 189.19 20,756,767Gallatin Manhattan 3,197,093 126.09 403,108 3,474,493 125.59 436,366Gallatin Three Forks 2,281,690 165.11 376,736 2,358,315 164.78 388,609Gallatin West Yellowstone 5,935,260 88.86 527,398 5,908,843 90.47 534,580Garfield Jordan 297,982 158.07 47,102 311,837 159.23 49,653Glacier Cut Bank 2,414,134 225.37 544,077 2,380,552 252.58 601,270Golden Valley Lavina 190,031 86.97 16,527 250,916 88.99 22,328Golden Valley Ryegate 213,198 93.37 19,906 216,448 95.22 20,611Granite Drummond 353,566 179.66 63,522 389,434 182.63 71,121Granite Philipsburg 1,429,096 159.86 228,460 1,450,570 162.27 235,384Hill Havre 11,311,436 230.79 2,610,516 11,760,382 229.75 2,701,994Hill Hingham 227,375 53.00 12,051 223,828 53.00 11,863Jefferson Boulder 1,069,176 181.34 193,885 1,102,673 185.90 204,991Jefferson Whitehall 1,271,979 122.73 156,113 1,289,751 123.79 159,662Judith Basin Hobson 200,691 115.48 23,176 208,349 116.40 24,252Judith Basin Stanford 421,296 160.03 67,421 409,134 167.83 68,667Lake Polson 9,595,761 173.67 1,666,457 9,482,406 177.38 1,682,020Lake Ronan 1,737,611 146.05 253,777 1,706,628 162.86 277,943Lake St. Ignatius 560,255 125.49 70,308 554,375 128.91 71,463Lewis & Clark East Helena 2,329,963 232.65 542,074 2,350,755 234.82 552,012Lewis & Clark Helena 66,256,080 164.00 10,865,755 67,817,220 169.51 11,495,391Liberty Chester 925,102 144.62 133,784 968,268 150.73 145,945Lincoln Eureka 1,298,810 176.80 229,624 1,354,079 175.73 237,954Lincoln Libby 2,688,176 154.74 415,960 2,697,985 155.38 419,210Lincoln Troy 720,158 202.94 146,149 686,546 228.91 157,159Madison Ennis 2,367,247 154.26 365,174 2,448,060 158.84 388,842
Valuation by City and Property Taxes Levied by City Governments
TY 2017 (FY 2018) TY 2018 (FY 2019)
Page 26
187revenue.mt.gov
Property Tax and Property Value Summaries
County City
Valuation by City and Property Taxes Levied by City Governments
TY 2017 (FY 2018) TY 2018 (FY 2019)
Madison Sheridan 931,432 111.08 103,461 944,201 111.62 105,387Madison Twin Bridges 480,701 144.40 69,413 483,018 143.22 69,178Madison Virginia City 475,076 71.39 33,915 495,076 71.42 35,358McCone Circle 1,009,541 293.90 296,703 950,254 312.63 297,080Meagher White Sulphur Springs 1,121,994 172.03 193,014 1,141,385 174.04 198,642Mineral Alberton 439,912 184.72 81,261 448,116 188.57 84,502Mineral Superior 1,046,857 221.82 232,212 1,075,503 223.68 240,564Missoula Missoula 129,330,752 252.43 32,646,776 129,843,031 242.37 31,470,162Musselshell Melstone 116,850 305.63 35,713 156,126 306.92 47,919Musselshell Roundup 1,809,423 146.67 265,394 1,811,829 150.35 272,404Park Clyde Park 343,946 76.08 26,169 344,930 77.49 26,730Park Livingston 12,254,304 227.00 2,781,764 12,800,096 230.66 2,952,414Petroleum Winnett 148,641 224.32 33,343 150,451 227.49 34,226Phillips Dodson 139,744 170.00 23,756 136,473 170.00 23,200Phillips Malta 2,318,235 182.73 423,614 2,295,673 212.19 487,116Phillips Saco 442,610 288.16 127,544 329,464 387.63 127,711Pondera Conrad 2,698,594 172.32 465,025 2,725,904 175.36 478,015Pondera Valier 687,112 114.47 78,652 684,750 117.20 80,255Powder River Broadus 471,075 142.59 67,172 483,745 143.47 69,401Powell Deer Lodge 2,946,902 129.72 382,258 2,932,315 132.81 389,455Prairie Terry 618,727 193.42 119,675 616,295 198.91 122,588Ravalli Darby 804,088 139.20 111,927 797,275 142.64 113,727Ravalli Hamilton 9,754,521 249.02 2,429,044 9,685,242 242.98 2,353,355Ravalli Pinesdale 321,897 79.31 25,529 327,877 77.21 25,315Ravalli Stevensville 2,591,958 108.56 281,395 2,674,917 106.74 285,533Richland Fairview 1,078,206 156.60 168,847 1,113,534 156.60 174,379Richland Sidney 12,062,047 125.60 1,514,993 11,948,811 125.60 1,500,771Roosevelt Bainville 341,055 173.11 59,039 350,686 179.77 63,044Roosevelt Brockton 124,793 0.00 0 118,696 0.00 0Roosevelt Culbertson 1,297,395 160.18 207,811 1,343,110 161.83 217,361Roosevelt Froid 215,704 158.94 34,285 207,404 168.52 34,951Roosevelt Poplar 380,301 349.04 132,739 387,118 361.94 140,113Roosevelt Wolf Point 1,702,118 241.54 411,134 1,676,122 308.89 517,733Rosebud Colstrip 60,699,201 47.63 2,890,827 56,125,976 72.84 4,088,487Rosebud Forsyth 2,022,278 243.41 492,245 2,025,873 252.28 511,080Sanders Hot Springs 422,021 341.88 144,281 431,706 349.83 151,025Sanders Plains 1,217,390 255.82 311,432 1,256,698 299.09 375,870Sanders Thompson Falls 1,429,347 265.85 379,989 1,434,726 271.57 389,623Sheridan Medicine Lake 253,719 389.33 98,781 257,325 399.50 102,802Sheridan Outlook 88,087 117.35 10,337 87,150 120.00 10,458Sheridan Plentywood 2,282,871 196.52 448,635 2,281,080 201.07 458,653Sheridan Westby 360,892 520.17 187,724 408,075 558.87 228,059Silver Bow Walkerville 488,592 77.57 37,902 487,399 80.18 39,081Stillwater Columbus 7,180,547 181.27 1,301,594 7,323,447 189.18 1,385,426Sweet Grass Big Timber 3,658,536 139.00 508,537 3,805,073 140.99 536,467Teton Choteau 2,059,881 95.35 196,418 2,030,181 99.00 200,990Teton Dutton 289,767 272.50 78,962 280,934 281.09 78,967Teton Fairfield 1,288,806 161.06 207,580 1,313,440 162.97 214,051Toole Kevin 112,471 373.73 42,034 109,251 388.60 42,455Toole Shelby 3,363,627 255.65 859,896 3,371,420 258.65 872,031Toole Sunburst 513,245 221.93 113,906 524,361 216.52 113,533Treasure Hysham 220,230 401.83 88,496 228,833 408.64 93,509Valley Fort Peck 536,990 60.06 32,254 556,615 61.48 34,220Valley Glasgow 4,621,847 274.25 1,267,522 4,558,471 285.88 1,303,182Valley Nashua 323,189 157.34 50,852 315,943 165.58 52,314Valley Opheim 109,458 119.62 13,093 118,285 136.53 16,150Wheatland Harlowton 987,162 154.89 152,900 988,098 162.93 160,992Wheatland Judith Gap 164,816 158.95 26,198 168,238 163.97 27,586Wibaux Wibaux 527,879 161.81 85,417 560,098 165.36 92,618Yellowstone Billings 203,841,721 159.03 32,416,896 204,834,312 163.03 33,394,642Yellowstone Broadview 289,411 151.57 43,866 287,181 166.39 47,783Yellowstone Laurel 8,980,456 184.40 1,655,963 9,056,783 181.58 1,644,516
979,467,125 171,739,281 990,265,593 177,768,897
Page 27
188revenue.mt.gov
Property Tax and Property Value Summaries
Property Taxes Paid by Type of PropertyThe final section of the property tax section summarizes property taxes paid by each type of property. The actual amount of taxes paid is determined by the product of the total mills levied times the taxable value. Identical properties in separate locations may have different taxes because their jurisdictions have different levels of services or different costs of providing services and therefore different millage rates. Neighboring properties in different classes with identical market values may pay different taxes because of the application of different tax rates for different classes of property.
The tables on the following pages show the distribution of taxes paid by each class of property, the average mill for individual classes, and the effective rate taxpayers pay on their assessed value.
The pages following the property value summary tables show property values by county. This includes quantity in acres, the assessed market value, and the taxable value of different types of property.
Page 28
189revenue.mt.gov
Property Tax and Property Value Summaries
Property Type2018 Tax
Rate Class 2018 Total Assessed Value 2018 Total Taxable ValueAssessed Value within
Towns/CitiesTaxable Value within
Towns/Cities University (6 mills)State General Fund
(95 mills)Proceeds
Net Proceeds 100.00% 1.0 $4,794,622 $4,794,622 $0 $0 $28,768 $455,489Gross Proceeds of Metal Mines 3.00% 2.0 $742,469,971 $22,274,100 $74,698,529 $2,240,956 $133,645 $2,126,759
Subtotal $747,264,593 $27,068,722 $74,698,529 $2,240,956 $162,412 $2,582,249Subtotal Percent of Column Statewide Total 0.49% 0.93% 0.13% 0.23% 0.92% 0.92%
Agricultural LandTillable Irrigated 2.16% 3.0 $1,143,710,301 $24,704,157 $1,880,459 $40,617 $148,225 $2,350,456Tillable Non-Irrigated 2.16% 3.0 $3,666,445,034 $79,195,338 $1,223,915 $26,437 $475,172 $7,528,306Grazing Land 2.16% 3.0 $1,557,012,137 $33,634,392 $478,839 $10,512 $201,806 $3,199,244Wild Hay 2.16% 3.0 $265,236,801 $5,729,212 $188,296 $4,067 $34,375 $545,042Timber Land 0.37% 10.0 $1,323,802,727 $4,898,379 $445,212 $1,653 $29,390 $466,499
Subtotal $7,956,207,000 $148,161,478 $4,216,721 $83,286 $888,969 $14,089,547Subtotal Percent of Column Statewide Total 5.27% 5.10% 0.01% 0.01% 5.06% 5.04%
Residential LandFarmstead 1 Acre 1.35% 4.2 $66,815,227 $1,448,802 $329,785 $7,137 $8,693 $137,880Non-Qualified Ag Land 15.12% 3.0 $51,803,055 $7,832,996 $455,445 $68,891 $46,997 $746,672Non-Q Ag Land 1 Acre 1.35% 4.2 $1,091,013,653 $14,729,556 $8,488,506 $114,593 $88,377 $1,404,431City/town Lots Residential 1.35% 4.2 $9,730,122,680 $131,356,785 $9,191,533,488 $124,086,314 $788,140 $12,585,977Suburban Tracts Residential 1.35% 4.2 $15,835,186,800 $213,776,487 $204,844,726 $2,765,439 $1,282,659 $20,382,206Suburban Tracts - Low Income varies 4.2 $1,010,062,575 $4,163,495 $388,865,601 $1,677,413 $24,981 $398,077
Subtotal $27,785,003,990 $373,308,121 $9,794,517,551 $128,719,787 $2,239,847 $35,655,242Subtotal Percent of Column Statewide Total 18.40% 12.85% 16.94% 13.00% 12.75% 12.75%
Residential ImprovementsImpr. on Ag and Timber Land 1.35% 4.1 $5,743,476,267 $78,190,061 $13,102,985 $176,897 $469,192 $7,442,347Impr. on Disparately Owned Ag Land 1.35% 4.1 $42,392,817 $572,313 $133,920 $1,808 $3,434 $54,373Impr. on Right of Way - Agricultural 1.35% 4.1 $683,140 $9,222 $608,350 $8,212 $55 $876Impr. on Suburban Tracts Residential 1.35% 4.1 $35,007,580,708 $483,407,069 $366,422,933 $4,727,756 $2,900,440 $46,099,199Impr. on City/Town Lots Residential 1.35% 4.1 $29,949,188,140 $404,691,114 $28,248,433,025 $381,730,919 $2,428,147 $38,779,599Impr. on Tracts and Lots - Low Income varies 4.1 $2,281,676,967 $9,073,938 $1,097,545,632 $4,606,272 $54,444 $867,715Impr. on Right of Way - Residential 1.35% 4.1 $491,530 $6,634 $276,030 $3,725 $40 $632Remodeled Residential Improvements varies 4.1 $178,324 $0 $0 $0 $14 $229Mobile Homes 1.35% 4.1 $854,391,507 $11,534,655 $252,059,787 $3,402,968 $69,208 $1,102,667Mobile Homes - Low Income varies 4.1 $64,287,456 $258,693 $24,941,833 $100,195 $1,552 $24,794Extended Property Tax Assistance Program varies 4.3 $0 $0 $0 $0 $0 $0Penalty 1.35% 4.1 $0 $0 $0 $0 $0 $0
Subtotal $73,944,346,856 $987,743,699 $30,003,524,495 $394,758,752 $5,926,526 $94,372,431Subtotal Percent of Column Statewide Total 48.96% 34.00% 51.88% 39.86% 33.74% 33.75%
Commercial LandSuburban Tracts Commercial 1.89% 4.9 $1,607,631,583 $30,384,347 $123,587,677 $2,335,807 $182,283 $2,903,088City/town Lots Commercial 1.89% 4.9 $4,269,163,478 $80,687,156 $4,111,221,541 $77,702,050 $484,119 $7,741,929Industrial Sites 1.89% 4.9 $253,524,481 $4,791,615 $57,135,770 $1,079,859 $28,741 $458,929Qualified Golf Courses 0.95% 4.9 $51,559,045 $489,814 $9,863,138 $93,702 $2,939 $46,675Locally Assessed Co-op Land 3.00% 5.0 $33,701 $1,011 $5,684 $171 $6 $96Eligible Mining Claims 2.16% 3.0 $1,079,863 $23,329 $17,044 $371 $140 $2,227
Subtotal $6,182,992,151 $116,377,272 $4,301,830,854 $81,211,960 $698,229 $11,152,945Subtotal Percent of Column Statewide Total 4.09% 4.01% 7.44% 8.20% 3.98% 3.99%
Commercial ImprovementsImpr. on Suburban Tracts Commercial 1.89% 4.8 $3,703,414,224 $69,994,548 $319,346,357 $6,035,646 $419,830 $6,682,470Impr. on City/Town Lots Commercial 1.89% 4.8 $9,061,522,504 $171,192,279 $8,539,855,949 $161,332,751 $1,027,581 $16,421,206Impr. on Right of Way - Commercial 1.89% 4.8 $28,747,172 $543,324 $22,794,719 $430,824 $3,145 $51,723Locally Assessed Co-op Improvements 3.00% 5.0 $198,472 $5,954 $0 $0 $36 $566Impr. on Qualified Golf Courses 0.95% 4.8 $184,403,347 $1,751,503 $25,248,757 $239,862 $10,511 $167,121Impr. on Industrial Sites 1.89% 4.8 $1,488,759,509 $28,137,559 $364,166,052 $6,882,732 $167,520 $2,690,873New Industrial Improvements varies 4.8 $175,259,423 $1,940,467 $85,097,300 $957,612 $19,874 $316,592Improvements on Industrial Land 3.00% 5.0 $11,250 $338 $0 $0 $2 $32Remodeled Commercial Improvements varies 4.8 $39,853,463 $118,140 $20,702,706 $42,711 $4,519 $72,632New and Expanding R & D Improvements varies 5.0 $19,090 $90 $0 $0 $2 $35Impr. for Pollution Control 3.00% 5.0 $16,771,512 $394,010 $2,424,092 $11,030 $2,364 $37,888
Subtotal $14,698,959,966 $274,078,212 $9,379,635,932 $175,933,168 $1,655,385 $26,441,138Subtotal Percent of Column Statewide Total 9.73% 9.44% 16.22% 17.77% 9.42% 9.46%
Valuation by Property Type Taxes Levied by Levy Type
Page 29
190revenue.mt.gov
Property Tax and Property Value Summaries
Property Type2018 Tax
Rate ClassProceeds
Net Proceeds 100.00% 1.0Gross Proceeds of Metal Mines 3.00% 2.0
SubtotalSubtotal Percent of Column Statewide Total
Agricultural LandTillable Irrigated 2.16% 3.0Tillable Non-Irrigated 2.16% 3.0Grazing Land 2.16% 3.0Wild Hay 2.16% 3.0Timber Land 0.37% 10.0
SubtotalSubtotal Percent of Column Statewide Total
Residential LandFarmstead 1 Acre 1.35% 4.2Non-Qualified Ag Land 15.12% 3.0Non-Q Ag Land 1 Acre 1.35% 4.2City/town Lots Residential 1.35% 4.2Suburban Tracts Residential 1.35% 4.2Suburban Tracts - Low Income varies 4.2
SubtotalSubtotal Percent of Column Statewide Total
Residential ImprovementsImpr. on Ag and Timber Land 1.35% 4.1Impr. on Disparately Owned Ag Land 1.35% 4.1Impr. on Right of Way - Agricultural 1.35% 4.1Impr. on Suburban Tracts Residential 1.35% 4.1Impr. on City/Town Lots Residential 1.35% 4.1Impr. on Tracts and Lots - Low Income varies 4.1Impr. on Right of Way - Residential 1.35% 4.1Remodeled Residential Improvements varies 4.1Mobile Homes 1.35% 4.1Mobile Homes - Low Income varies 4.1Extended Property Tax Assistance Program varies 4.3Penalty 1.35% 4.1
SubtotalSubtotal Percent of Column Statewide Total
Commercial LandSuburban Tracts Commercial 1.89% 4.9City/town Lots Commercial 1.89% 4.9Industrial Sites 1.89% 4.9Qualified Golf Courses 0.95% 4.9Locally Assessed Co-op Land 3.00% 5.0Eligible Mining Claims 2.16% 3.0
SubtotalSubtotal Percent of Column Statewide Total
Commercial ImprovementsImpr. on Suburban Tracts Commercial 1.89% 4.8Impr. on City/Town Lots Commercial 1.89% 4.8Impr. on Right of Way - Commercial 1.89% 4.8Locally Assessed Co-op Improvements 3.00% 5.0Impr. on Qualified Golf Courses 0.95% 4.8Impr. on Industrial Sites 1.89% 4.8New Industrial Improvements varies 4.8Improvements on Industrial Land 3.00% 5.0Remodeled Commercial Improvements varies 4.8New and Expanding R & D Improvements varies 5.0Impr. for Pollution Control 3.00% 5.0
SubtotalSubtotal Percent of Column Statewide Total
CountyMiscellaneous and
FireCounty Wide
School Ret/Trans Local Schools Cities/Towns Total Taxes LeviedEffective
RateAverage Mill Levy for Property Type
$594,627 $183,135 $59,421 $608,777 $0 $1,930,216 40.26% 402.58$5,396,015 $653,146 $894,352 $3,460,828 $382,774 $13,047,519 1.76% 585.77
$5,990,641 $836,280 $953,773 $4,069,605 $382,774 $14,977,734 2.00% 553.321.27% 1.27% 0.71% 0.67% 0.22% 0.85%
$4,423,547 $432,847 $1,091,176 $5,231,271 $6,750 $13,684,271 1.20% 553.93$16,080,333 $1,084,461 $3,492,525 $14,265,949 $5,072 $42,931,818 1.17% 542.10
$6,294,900 $371,187 $1,459,650 $5,873,307 $1,873 $17,401,967 1.12% 517.39$996,039 $67,724 $232,074 $1,005,740 $887 $2,881,883 1.09% 503.02$834,989 $66,918 $239,205 $995,954 $161 $2,633,117 0.20% 537.55
$28,629,807 $2,023,138 $6,514,631 $27,372,221 $14,743 $79,533,056 1.00% 536.806.07% 3.08% 4.85% 4.52% 0.01% 4.54%
$261,685 $27,702 $62,842 $282,626 $836 $782,264 1.17% 539.94$1,414,135 $183,582 $370,154 $1,606,660 $12,312 $4,380,512 8.46% 559.24$2,442,604 $447,567 $741,885 $3,068,923 $14,873 $8,208,659 0.75% 557.29
$19,493,062 $2,478,095 $6,936,859 $34,130,582 $22,834,766 $99,247,481 1.02% 755.56$35,189,982 $8,006,592 $10,597,306 $43,507,573 $442,295 $119,408,614 0.75% 558.57
$683,502 $131,403 $212,614 $1,013,787 $320,674 $2,785,037 0.28% 668.92
$59,484,970 $11,274,942 $18,921,659 $83,610,151 $23,625,756 $234,812,567 0.85% 629.0012.62% 17.15% 14.09% 13.80% 13.29% 13.40%
$13,823,835 $1,623,841 $3,434,879 $15,446,827 $32,328 $42,273,250 0.74% 540.65$110,990 $7,868 $23,984 $103,920 $570 $305,139 0.72% 533.17
$1,213 $155 $460 $2,986 $1,079 $6,824 1.00% 739.99$78,228,112 $17,789,177 $22,768,741 $98,309,508 $871,582 $266,966,759 0.76% 552.26$59,850,874 $6,755,793 $21,270,997 $104,188,429 $70,359,941 $303,633,780 1.01% 750.29
$1,494,929 $240,821 $455,070 $2,194,051 $861,906 $6,168,936 0.27% 679.85$1,025 $210 $323 $1,475 $806 $4,510 0.92% 679.88
$0 $0 $0 $0 $0 $243 0.14% -$1,849,811 $302,666 $533,218 $2,533,364 $609,997 $7,000,931 0.82% 606.95
$41,063 $9,325 $12,682 $63,039 $18,476 $170,931 0.27% 660.75$0 $0 $0 $0 $0 $0 - -$0 $0 $0 $0 $0 $0 - -
$155,401,852 $26,729,856 $48,500,354 $222,843,599 $72,756,685 $626,531,302 0.85% 634.3132.97% 40.67% 36.11% 36.77% 40.93% 35.75%
$4,990,427 $1,405,758 $1,492,465 $6,751,357 $440,589 $18,165,968 1.13% 597.87$11,650,031 $1,381,879 $4,300,955 $20,683,895 $14,427,980 $60,670,789 1.42% 751.93
$791,073 $125,929 $226,488 $1,073,005 $197,327 $2,901,493 1.14% 605.54$74,296 $18,341 $22,566 $100,019 $12,998 $277,834 0.54% 567.22
$198 $29 $52 $158 $22 $561 1.66% 554.64$5,084 $732 $846 $4,867 $30 $13,926 1.29% 596.95
$17,511,110 $2,932,669 $6,043,372 $28,613,301 $15,078,946 $82,030,571 1.33% 704.873.71% 4.46% 4.50% 4.72% 8.48% 4.68%
$11,640,643 $2,822,438 $3,511,242 $16,020,758 $1,206,806 $42,304,188 1.14% 604.39$25,480,193 $2,949,659 $9,163,883 $43,462,665 $30,159,411 $128,664,599 1.42% 751.58
$75,931 $7,626 $23,733 $121,710 $91,327 $375,195 1.31% 690.55$850 $17 $339 $1,033 $0 $2,840 1.43% 476.98
$270,243 $54,059 $72,522 $330,415 $34,448 $939,319 0.51% 536.29$5,151,481 $590,780 $1,302,733 $6,123,650 $1,474,578 $17,501,615 1.18% 622.00
$324,407 $23,113 $92,518 $460,249 $177,150 $1,413,905 0.81% 728.64$74 $0 $0 $47 $0 $155 1.37% 457.14
$32,023 $5,025 $6,206 $28,414 $8,804 $157,623 0.40% 1334.20$15 $0 $4 $25 $0 $81 0.43% 905.17
$84,787 $2,523 $19,124 $104,836 $2,590 $254,112 1.52% 644.94
$43,060,646 $6,455,241 $14,192,305 $66,653,801 $33,155,115 $191,613,631 1.30% 699.129.13% 9.82% 10.57% 11.00% 18.65% 10.93%
Totals and SummariesTaxes Levied by Levy Type
Page 30
191revenue.mt.gov
Property Tax and Property Value Summaries
Property Type2018 Tax
Rate Class 2018 Total Assessed Value 2018 Total Taxable ValueAssessed Value within
Towns/CitiesTaxable Value within
Towns/Cities University (6 mills)State General Fund
(95 mills)
Valuation by Property Type Taxes Levied by Levy Type
Personal PropertyFurniture and Fixtures varies 8.0 $802,911,487 $13,942,753 $626,526,882 $10,772,286 $83,657 $1,336,755Machin. other than Farm, Min., Manuf. varies 8.0 $887,993,920 $17,572,303 $137,002,337 $2,339,556 $105,434 $1,677,803Repair Tools varies 8.0 $2,453,278 $45,020 $1,194,480 $23,457 $270 $4,310Manufacturing Machinery varies 8.0 $2,851,824,123 $78,892,145 $709,357,411 $19,054,142 $473,353 $7,581,401Ski Lifts varies 8.0 $46,583,175 $1,096,471 $0 $0 $6,579 $104,175Supplies and Materials varies 8.0 $316,153,528 $8,835,980 $55,826,577 $1,347,393 $53,016 $846,955Rural Telephone Property 8.00% 7.0 $15,191,024 $1,215,281 $15,142,552 $1,211,404 $7,292 $117,260Air and H2O Pollution Control 3.00% 5.0 $84,965,597 $2,548,966 $4,081,969 $122,458 $15,294 $245,103New & Expanding Ind- Air & H2O P C 2.40% 5.0 $0 $0 $0 $0 $0 $0Aluminum Electrolytic Equipment 3.00% 5.0 $0 $0 $0 $0 $0 $0Cable TV Systems varies 8.0 $14,286,677 $215,642 $8,585,495 $129,929 $1,294 $20,581Theatre and Sound Equipment varies 8.0 $1,824,192 $27,814 $1,683,737 $25,283 $167 $2,664Radio and TV Broadcasting Equip. varies 8.0 $12,551,168 $186,349 $6,230,470 $93,536 $1,118 $17,897CB's and Mobile Phones varies 8.0 $5,483,403 $150,803 $463,431 $8,172 $905 $14,514Rental Equipment varies 8.0 $17,774,849 $286,370 $5,250,529 $85,663 $1,718 $27,359New & Expanding Ind- Mach & Eq varies 8.0 $573,694,171 $6,810,461 $26,184,858 $340,401 $97,853 $1,567,758Oil & Gas Field Equipment varies 8.0 $277,514,348 $6,236,235 $5,184,993 $78,047 $37,417 $592,463Oil & Gas Flow Lines varies 8.0 $112,894,229 $2,928,281 $994,820 $15,051 $17,570 $278,212Ag Implements varies 8.0 $810,620,016 $12,968,025 $6,785,217 $289,715 $77,808 $1,232,890Local Assessed Utility Intra-Co Lines varies 8.0 $0 $0 $0 $0 $0 $0Centrally Assessed Personal Property varies 8.0 $180,315,631 $5,137,550 $5,918,560 $149,042 $30,825 $488,344Failure to Report Penalty 8.00% 7.0 $0 $0 $0 $0 $0 $0Failure to Report Penalty varies 8.0 $34,739,081 $529,222 $7,881,883 $123,415 $3,175 $50,462Coal and Ore Haulers varies 8.0 $0 $0 $0 $0 $0 $0
Subtotal $7,049,773,897 $159,625,670 $1,624,296,201 $36,208,951 $1,014,745 $16,206,905Subtotal Percent of Column Statewide Total 4.67% 5.50% 2.81% 3.66% 7.24% 7.26%
Utilities RealRural Co-op companies Real 3.00% 5.0 $101,299,870 $3,038,372 $25,571,105 $767,125 $18,234 $289,143Independent Tele Companies Real 3.00% 5.0 $2,046,181 $61,386 $292,768 $8,784 $368 $5,874Electric Companies Real 12.00% 9.0 $57,108,891 $6,853,063 $5,541,855 $665,022 $41,118 $654,591Gas & Electric Companies Real 12.00% 9.0 $111,778,384 $13,413,418 $26,892,080 $3,227,055 $80,481 $1,283,496Pipelines Real 12.00% 9.0 $205,265,896 $18,857,781 $4,507,102 $540,852 $147,791 $2,340,954Class 15 Pipeline Real 3.00% 15.0 $19,476,612 $272,721 $0 $0 $1,636 $25,908Telecom Companies Real 6.00% 13.0 $348,283,582 $20,897,015 $166,378,993 $9,982,739 $125,382 $1,999,215Centrally Assessed New & Exp Situs 9.60% 9.0 $0 $0 $0 $0 $0 $0Railroads Real 2.97% 12.0 $100,574,481 $3,137,454 $40,109,685 $1,251,421 $18,828 $299,690Airlines Real 2.97% 12.0 $1,855,677 $57,895 $1,593,982 $49,731 $347 $5,586Electric Generation Real Property 6.00% 13.0 $1,570,760,445 $94,245,628 $811,030,273 $48,661,818 $565,474 $8,976,344Rural Co-op Companies Real Prop New&Exp 1.50% 5.0 $0 $0 $0 $0 $0 $010 Year Exempt Electric Generation Real 0.00% 13.0 $874,536 $0 $518,475 $0 $0 $0
Subtotal $2,519,324,555 $160,834,733 $1,082,436,318 $65,154,547 $999,660 $15,880,803Subtotal Percent of Column Statewide Total 1.67% 5.54% 1.87% 6.58% 5.69% 5.68%
Utilities PersonalRural Co-op Companies Pers Prop 3.00% 5.0 $409,378,936 $11,914,920 $92,282,581 $2,768,485 $73,686 $1,168,802Independent Tele Companies Pers Prop varies 5.0 $8,015,671 $240,477 $919,585 $27,590 $1,443 $22,965Electric Companies Pers Prop 12.00% 9.0 $18,295,043 $2,195,411 $15,386,329 $1,846,365 $13,172 $208,743Gas & Electric Companies Pers Prop 12.00% 9.0 $1,272,063,296 $152,647,423 $516,845,560 $62,021,447 $915,885 $14,614,601Pipelines Pers Prop 12.00% 9.0 $442,876,784 $49,565,639 $8,487,308 $1,018,474 $297,394 $4,715,212Class 15 Pipeline Personal 3.00% 15.0 $95,251,614 $1,428,774 $0 $0 $8,573 $135,734Telecom Companies Pers Prop 6.00% 13.0 $296,457,070 $17,787,420 $202,657,910 $12,159,459 $106,725 $1,703,501Rural Co-op Companies Pers Prop New&Exp 1.50% 5.0 $0 $0 $0 $0 $0 $0Railroads Pers Prop 2.97% 12.0 $130,538,399 $4,071,571 $33,319,057 $1,039,552 $24,437 $391,225Airlines Pers Prop 2.97% 12.0 $20,712,593 $646,233 $13,725,398 $428,232 $3,877 $62,120Electric Generation Personal Prop 6.00% 13.0 $424,274,242 $25,456,459 $31,207,451 $1,872,449 $152,739 $2,427,534Centrally Assessed Pollution Control 3.00% 5.0 $534,873,019 $4,727,733 $245,965,983 $3,127,625 $28,366 $449,135New & Exp Ind -Elect Gen/Tele Pers Prop varies 13.0 $4,080,606 $187,600 $0 $0 $1,469 $23,25910 Year Exempt Electric Generation Pers Prop 0.00% 13.0 $0 $0 $0 $0 $0 $0
Subtotal $3,656,817,273 $270,869,660 $1,160,797,162 $86,309,678 $1,627,765 $25,922,832Subtotal Percent of Column Statewide Total 2.42% 9.32% 2.01% 8.72% 9.27% 9.27%
Utilities mileageRural Co-op Companies Mileage 3.00% 5.0 $787,925,260 $23,633,896 $35,817,622 $1,074,529 $141,826 $2,249,338Independent Tele Companies Mileage 3.00% 5.0 $24,840,891 $745,228 $138,282 $4,150 $4,471 $71,031Electric Companies Mileage 12.00% 9.0 $201,569,061 $24,188,275 $20,311,819 $2,437,415 $145,130 $2,304,491Gas & Electric Companies Mileage 12.00% 9.0 $459,108,619 $55,093,007 $17,276,475 $2,073,173 $330,558 $5,252,113Pipelines Mileage 12.00% 9.0 $1,439,963,289 $172,795,600 $13,657,740 $1,638,929 $1,036,774 $16,426,879Class 15 Pipeline Millage 3.00% 15.0 $4,651,958 $69,779 $0 $0 $419 $6,629Telecom Companies Mileage 6.00% 13.0 $232,539,592 $13,952,371 $85,742,711 $5,144,553 $83,714 $1,335,851Rural Co-op Companies Mileage New&Exp 1.50% 5.0 $0 $0 $0 $0 $0 $0Railroads Mileage 2.97% 12.0 $2,411,476,209 $75,078,474 $163,034,878 $5,086,690 $451,337 $7,166,010Airlines Flight Property Mileage 2.97% 12.0 $158,351,152 $4,940,556 $70,026,212 $2,184,818 $29,643 $473,788Renewable Mileage 1.50% 14.0 $118,924,000 $1,783,860 $0 $0 $10,703 $169,881
Subtotal $5,839,350,031 $372,281,046 $406,005,739 $19,644,257 $2,234,576 $35,456,011Subtotal Percent of Column Statewide Total 3.87% 12.82% 0.70% 1.98% 12.72% 12.68%
Wind GenerationWind Generation Impr. New&Exp varies 14.0 $3,542,013 $98,401 $0 $0 $638 $10,095Wind Generation Personal Prop. New&Exp varies 14.0 $639,461,214 $14,325,494 $8,367 $251 $115,103 $1,822,464
Subtotal $643,003,227 $14,423,895 $8,367 $251 $115,741 $1,832,559Subtotal Percent of Column Statewide Total 0.43% 0.50% 0.00% 0.00% 0.66% 0.66%
Statewide Summaries
Statewide Total $151,023,043,539 $2,904,772,508 $57,831,967,869 $990,265,593 $17,563,853 $279,592,662Statewide Average Mill Levy 6.05 96.25
Page 31
192revenue.mt.gov
Property Tax and Property Value Summaries
Property Type2018 Tax
Rate Class
Personal PropertyFurniture and Fixtures varies 8.0Machin. other than Farm, Min., Manuf. varies 8.0Repair Tools varies 8.0Manufacturing Machinery varies 8.0Ski Lifts varies 8.0Supplies and Materials varies 8.0Rural Telephone Property 8.00% 7.0Air and H2O Pollution Control 3.00% 5.0New & Expanding Ind- Air & H2O P C 2.40% 5.0Aluminum Electrolytic Equipment 3.00% 5.0Cable TV Systems varies 8.0Theatre and Sound Equipment varies 8.0Radio and TV Broadcasting Equip. varies 8.0CB's and Mobile Phones varies 8.0Rental Equipment varies 8.0New & Expanding Ind- Mach & Eq varies 8.0Oil & Gas Field Equipment varies 8.0Oil & Gas Flow Lines varies 8.0Ag Implements varies 8.0Local Assessed Utility Intra-Co Lines varies 8.0Centrally Assessed Personal Property varies 8.0Failure to Report Penalty 8.00% 7.0Failure to Report Penalty varies 8.0Coal and Ore Haulers varies 8.0
SubtotalSubtotal Percent of Column Statewide Total
Utilities RealRural Co-op companies Real 3.00% 5.0Independent Tele Companies Real 3.00% 5.0Electric Companies Real 12.00% 9.0Gas & Electric Companies Real 12.00% 9.0Pipelines Real 12.00% 9.0Class 15 Pipeline Real 3.00% 15.0Telecom Companies Real 6.00% 13.0Centrally Assessed New & Exp Situs 9.60% 9.0Railroads Real 2.97% 12.0Airlines Real 2.97% 12.0Electric Generation Real Property 6.00% 13.0Rural Co-op Companies Real Prop New&Exp 1.50% 5.010 Year Exempt Electric Generation Real 0.00% 13.0
SubtotalSubtotal Percent of Column Statewide Total
Utilities PersonalRural Co-op Companies Pers Prop 3.00% 5.0Independent Tele Companies Pers Prop varies 5.0Electric Companies Pers Prop 12.00% 9.0Gas & Electric Companies Pers Prop 12.00% 9.0Pipelines Pers Prop 12.00% 9.0Class 15 Pipeline Personal 3.00% 15.0Telecom Companies Pers Prop 6.00% 13.0Rural Co-op Companies Pers Prop New&Exp 1.50% 5.0Railroads Pers Prop 2.97% 12.0Airlines Pers Prop 2.97% 12.0Electric Generation Personal Prop 6.00% 13.0Centrally Assessed Pollution Control 3.00% 5.0New & Exp Ind -Elect Gen/Tele Pers Prop varies 13.010 Year Exempt Electric Generation Pers Prop 0.00% 13.0
SubtotalSubtotal Percent of Column Statewide Total
Utilities mileageRural Co-op Companies Mileage 3.00% 5.0Independent Tele Companies Mileage 3.00% 5.0Electric Companies Mileage 12.00% 9.0Gas & Electric Companies Mileage 12.00% 9.0Pipelines Mileage 12.00% 9.0Class 15 Pipeline Millage 3.00% 15.0Telecom Companies Mileage 6.00% 13.0Rural Co-op Companies Mileage New&Exp 1.50% 5.0Railroads Mileage 2.97% 12.0Airlines Flight Property Mileage 2.97% 12.0Renewable Mileage 1.50% 14.0
SubtotalSubtotal Percent of Column Statewide Total
Wind GenerationWind Generation Impr. New&Exp varies 14.0Wind Generation Personal Prop. New&Exp varies 14.0
SubtotalSubtotal Percent of Column Statewide Total
Statewide Summaries
Statewide TotalStatewide Average Mill Levy
CountyMiscellaneous and
FireCounty Wide
School Ret/Trans Local Schools Cities/Towns Total Taxes LeviedEffective
RateAverage Mill Levy for Property Type
Totals and SummariesTaxes Levied by Levy Type
$2,075,180 $317,774 $696,428 $3,389,053 $2,029,658 $9,928,504 1.24% 712.09$3,026,752 $444,451 $764,279 $3,181,490 $446,022 $9,646,231 1.09% 548.95
$5,916 $906 $2,139 $8,602 $3,747 $25,891 1.06% 575.10$13,909,145 $1,037,002 $3,662,952 $18,399,463 $3,741,699 $48,805,014 1.71% 618.63
$127,098 $27,196 $13,531 $75,202 $0 $353,781 0.76% 322.65$1,526,937 $99,239 $385,975 $1,896,317 $258,055 $5,066,493 1.60% 573.39
$158,064 $23,663 $58,192 $305,636 $241,340 $911,447 6.00% 749.99$432,647 $16,889 $117,558 $624,845 $23,776 $1,476,113 1.74% 579.10
$0 $0 $0 $0 $0 $0 - -$0 $0 $0 $0 $0 $0 - -
$31,810 $4,475 $10,387 $46,501 $22,675 $137,722 0.96% 638.66$3,971 $608 $1,441 $6,717 $4,663 $20,231 1.11% 727.34
$29,432 $4,396 $8,883 $43,434 $18,129 $123,290 0.98% 661.61$25,440 $827 $7,049 $37,013 $1,561 $87,308 1.59% 578.96$45,913 $7,255 $13,210 $61,148 $15,006 $171,610 0.97% 599.26
$1,217,559 $89,717 $336,285 $1,653,068 $51,314 $5,013,555 0.87% 736.16$1,122,645 $32,375 $86,827 $534,449 $15,506 $2,421,682 0.87% 388.32
$540,241 $14,620 $40,443 $222,298 $3,419 $1,116,804 0.99% 381.39$2,473,129 $196,553 $547,920 $2,390,006 $52,691 $6,970,997 0.86% 537.55
$0 $0 $0 $0 $0 $0 - -$1,108,919 $22,942 $50,382 $386,797 $28,974 $2,117,183 1.17% 412.10
$0 $0 $0 $0 $0 $0 - -$94,108 $10,811 $23,454 $106,171 $21,957 $310,139 0.89% 586.03
$0 $0 $0 $0 $0 $0 - -
$27,954,906 $2,351,698 $6,827,337 $33,368,210 $6,980,193 $94,703,994 1.34% 593.298.22% 5.65% 6.99% 6.99% 4.41% 7.04%
$549,347 $51,459 $117,761 $610,474 $162,438 $1,798,856 1.78% 592.05$10,597 $859 $2,907 $14,851 $2,113 $37,568 1.84% 612.00
$1,095,449 $85,725 $235,938 $699,103 $48,865 $2,860,790 5.01% 417.45$2,889,352 $363,100 $617,172 $2,827,703 $608,687 $8,669,991 7.76% 646.37$3,117,894 $322,567 $860,511 $2,337,562 $109,407 $9,236,687 4.50% 489.81
$49,730 $274 $269 $27,560 $0 $105,377 0.54% 386.39$3,570,990 $379,129 $1,193,942 $5,029,075 $1,870,196 $14,167,928 4.07% 677.99
$0 $0 $0 $0 $0 $0 - -$502,064 $50,248 $160,559 $728,479 $263,659 $2,023,527 2.01% 644.96
$8,321 $916 $2,846 $14,496 $9,394 $41,906 2.26% 723.82$8,637,867 $2,571,075 $2,977,059 $8,313,482 $3,642,016 $35,683,317 2.27% 378.62
$0 $0 $0 $0 $0 $0 - -$0 $0 $0 $0 $0 $0 0.00% -
$20,431,610 $3,825,351 $6,168,965 $20,602,784 $6,716,775 $74,625,948 2.96% 463.994.33% 5.82% 4.59% 3.40% 3.78% 4.26%
$2,123,443 $216,449 $573,312 $2,530,987 $579,964 $7,266,642 1.78% 609.88$43,538 $3,666 $11,736 $51,611 $6,143 $141,101 1.76% 586.76
$314,503 $53,568 $140,566 $582,264 $293,174 $1,605,990 8.78% 731.52$26,847,661 $2,985,395 $7,784,834 $36,406,403 $11,482,556 $101,037,335 7.94% 661.90
$8,263,943 $443,031 $1,260,125 $5,840,424 $206,555 $21,026,683 4.75% 424.22$260,519 $1,450 $1,457 $146,358 $0 $554,091 0.58% 387.81
$2,815,545 $312,100 $971,566 $4,487,202 $2,280,470 $12,677,108 4.28% 712.70$0 $0 $0 $0 $0 $0 - -
$660,991 $67,824 $205,415 $953,095 $209,741 $2,512,728 1.92% 617.14$91,942 $16,426 $33,214 $169,040 $77,002 $453,622 2.19% 701.95
$4,501,574 $441,438 $964,653 $3,815,091 $136,860 $12,439,889 2.93% 488.67$396,022 $147,307 $123,812 $230,013 $231,962 $1,606,618 0.30% 339.83
$27,213 $0 $10,676 $56,929 $0 $119,547 2.93% 637.24$0 $0 $0 $0 $0 $0 - -
$46,346,895 $4,688,654 $12,081,366 $55,269,416 $15,504,426 $161,441,355 4.41% 596.019.83% 7.13% 8.99% 9.12% 8.72% 9.21%
$4,331,487 $382,113 $1,085,981 $4,621,198 $215,876 $13,027,819 1.65% 551.23$140,139 $12,217 $34,679 $133,864 $695 $397,097 1.60% 532.85
$4,144,392 $306,773 $1,025,096 $5,040,001 $389,787 $13,355,670 6.63% 552.15$9,955,230 $978,140 $2,620,172 $11,290,818 $375,358 $30,802,389 6.71% 559.10
$28,076,594 $1,274,711 $4,176,403 $20,007,752 $239,489 $71,238,602 4.95% 412.27$12,724 $70 $68 $6,784 $0 $26,694 0.57% 382.54
$2,372,467 $335,424 $751,528 $3,511,293 $957,022 $9,347,298 4.02% 669.94$0 $0 $0 $0 $0 $0 - -
$13,690,770 $1,041,758 $3,555,326 $14,721,818 $992,674 $41,619,694 1.73% 554.35$734,662 $205,403 $257,392 $1,295,004 $382,538 $3,378,430 2.13% 683.82$372,396 $18,170 $100,824 $399,635 $0 $1,071,609 0.90% 600.72
$63,830,861 $4,554,778 $13,607,468 $61,028,168 $3,553,439 $184,265,301 3.16% 494.9613.54% 6.93% 10.13% 10.07% 2.00% 10.51%
$15,925 $645 $36 $5,671 $0 $33,009 0.93% 335.45$2,739,882 $55,011 $513,089 $2,643,654 $46 $7,889,249 1.23% 550.71
$2,755,807 $55,655 $513,124 $2,649,325 $46 $7,922,257 1.23% 549.250.58% 0.08% 0.38% 0.44% 0.00% 0.45%
$471,399,106 $65,728,262 $134,324,354 $606,080,581 $177,768,897 $1,752,457,716 1.16% 603.30162.28 22.63 46.24 208.65 61.20 603.30
Page 32
193revenue.mt.gov
Property Taxes Paid by County
Acres Assessed Taxable Avg. Mills Taxes Acres Assessed Taxable Avg. Mills TaxesCLASS 1 Net Proceeds $3,983,884 $3,983,884 417.553 $1,663,481 $4,794,622 $4,794,622 402.579 $1,930,216
CLASS 2 Gross Proceeds $596,330,812 $17,889,922 589.203 $10,540,788 $742,469,971 $22,274,100 585.771 $13,047,519
CLASS 3 Agricultural Land:Tillable Irrigated 1,683,721 $1,147,386,978 $24,783,583 544.646 $13,498,272 1,679,766 $1,143,710,301 $24,704,157 553.926 $13,684,271Tillable Non-Irrigated 12,189,509 $3,680,179,712 $79,491,995 529.991 $42,130,022 12,167,632 $3,666,445,034 $79,195,338 542.100 $42,931,818Grazing 34,032,686 $1,559,422,562 $33,686,407 505.071 $17,014,041 34,043,707 $1,557,012,137 $33,634,392 517.386 $17,401,967Wild Hay 1,111,090 $264,975,439 $5,723,548 498.723 $2,854,465 1,110,673 $265,236,801 $5,729,212 503.016 $2,881,883Non-Qualified Ag Land 1,088,157 $51,384,299 $7,769,710 551.520 $4,285,149 1,096,895 $51,803,055 $7,832,996 559.238 $4,380,512Eligible Mining Claims 24,276 $998,721 $21,577 590.540 $12,742 24,328 $1,079,863 $23,329 596.952 $13,926 Class 3 Subtotal $6,704,347,711 $151,476,820 526.778 $79,794,691 $6,685,287,191 $151,119,424 537.948 $81,294,377
CLASS 4 Land and Improvements:Residential $85,880,683,084 $1,171,176,718 619.327 $725,341,810 $87,751,283,932 $1,191,584,454 632.852 $754,097,029Residential Low Income $2,716,186,591 $12,840,357 668.788 $8,587,474 $2,813,667,115 $13,102,628 676.625 $8,865,568Mobile Homes $849,154,200 $11,459,547 605.158 $6,934,832 $854,733,447 $11,535,676 606.948 $7,001,560Mobile Homes Low Income $62,640,768 $260,388 657.307 $171,155 $177,529,036 $258,406 660.741 $170,739Commercial $28,370,702,017 $483,571,090 673.457 $325,664,184 $28,748,131,223 $489,488,622 688.431 $336,979,301Industrial $258,900,703 $4,893,224 584.119 $2,858,227 $256,225,570 $4,842,397 605.377 $2,931,474New Manufacturing $1,672,156,925 $30,020,835 612.576 $18,390,045 $1,664,018,932 $30,078,026 628.882 $18,915,520Qualified Golf Courses $243,701,296 $2,314,840 532.479 $1,232,605 $235,962,392 $2,241,317 543.053 $1,217,153Remodeled Commercial $33,068,376 $33,567 2526.610 $84,811 $39,853,463 $118,140 1334.202 $157,623Extended Prop Tax Relief Program (Res Only) $0 $0 - $0 $0 $0 - $0 Class 4 Subtotal $120,087,193,960 $1,716,570,566 634.559 $1,089,265,141 $122,541,405,110 $1,743,249,666 648.407 $1,130,335,967
CLASS 5Rural Electric and Telephone Co-Op $1,324,841,406 $39,286,742 566.112 $22,240,693 $1,333,738,982 $39,641,244 571.942 $22,672,484Qualified New Industrial $11,250 $338 371.500 $126 $265,877,422 $338 457.140 $155Pollution Control $279,266,319 $8,377,988 397.635 $3,331,382 $370,743,956 $7,670,709 435.011 $3,336,842Gasohol Related $0 $0 - $0 $0 $0 - $0Research and Development $217,450 $5,871 793.952 $4,661 $0 $0 - $0Aluminum Electrolytic Equipment $0 $0 - $0 $0 $0 - $0 Class 5 Subtotal $1,604,336,425 $47,670,939 536.529 $25,576,862 $1,970,360,360 $47,312,291 549.740 $26,009,480
CLASS 7Non-Centrally Assessed Public Util. $14,329,565 $1,146,364 728.871 $835,551 $15,191,024 $1,215,281 749.988 $911,447
CLASS 8Machinery $4,289,215,955 $110,523,620 574.444 $63,489,633 $4,421,715,204 $106,590,563 606.738 $64,672,521Farm Implements $804,875,826 $12,768,031 518.104 $6,615,170 $810,620,016 $12,968,025 537.553 $6,970,997Furniture and Fixtures $773,639,979 $13,637,578 700.498 $9,553,101 $804,728,158 $13,970,454 712.122 $9,948,673Other Business Equipment $796,805,565 $18,409,389 479.283 $8,823,306 $912,553,898 $22,332,382 480.210 $10,724,243 Class 8 Subtotal $6,664,537,325 $155,338,618 569.602 $88,481,210 $6,949,617,276 $155,861,423 592.298 $92,316,434
CLASS 9Utilities $4,211,367,133 $502,592,656 501.553 $252,077,089 $4,176,210,477 $495,370,951 524.338 $259,741,619
CLASS 10Timber Land 3,911,625 $1,327,634,179 $4,912,562 537.450 $2,640,259 3,909,972 $1,323,802,727 $4,898,379 537.549 $2,633,117
CLASS 12Railroads $2,941,894,383 $89,966,400 549.015 $49,392,891 $2,642,589,089 $82,287,499 560.911 $46,155,949Airlines $165,660,355 $5,085,768 679.104 $3,453,766 $180,919,422 $5,644,684 686.302 $3,873,958 Class 12 Subtotal $3,107,554,738 $95,052,168 $52,846,656 $2,823,508,511 $87,932,183 $50,029,906
CLASS 13Electrical Generation Property $2,056,851,656 $123,411,098 377.091 $46,537,189 $1,995,034,687 $119,702,087 402.025 $48,123,207Telecommunication Property $925,164,316 $55,510,020 670.903 $37,241,854 $877,280,244 $52,636,806 687.586 $36,192,335Elect Gen/Tele Real Prop New & Exp $4,223,412 $168,841 643.080 $108,578 $4,955,142 $187,600 637.245 $119,547 Class 13 Subtotal $2,986,239,384 $179,089,959 $83,887,621 $2,877,270,073 $172,526,493 $84,435,089
CLASS 14Wind Generation $159,333,193 $4,779,995 422.752 $2,020,755 $204,704,826 $6,141,144 490.453 $3,011,941Wind Generation New & Exp $682,143,502 $12,178,008 622.694 $7,583,177 $557,222,401 $10,066,611 594.234 $5,981,925 Class 14 Subtotal $841,476,695 $16,958,003 $9,603,932 $761,927,227 $16,207,755 $8,993,866
CLASS 15Carbon Dioxide and Liquid Pipeline $0 $0 - $0 $0 $0 - $0Carbon Dioxide and Liquid Pipeline (abated) $190,178,993 $2,532,568 387.937 $982,478 $151,198,970 $2,009,940 387.414 $778,679
Total $148,339,510,804 $2,895,215,029 586.553 $1,698,195,759 $151,023,043,539 $2,904,772,508 603.303 $1,752,457,716
ABATED PROPERTY
Current Values of Abated Property $1,190,638,641 $21,905,048 NA $13,730,181 $1,449,237,451 $26,091,073 NA $16,184,432Values Without the Property Abatement $1,190,638,641 $35,732,368 NA $22,451,995 $1,449,237,451 $48,930,714 NA $31,551,620Difference (Property Value Abated) $0 -$13,827,320 -$8,721,813 $0 -$22,839,641 -$15,367,188
State Total
TY 2018TY 2017
1 NORTHWESTERN ENERGY-T & D 2 BNSF RAILWAY CO 1 NORTHWESTERN ENERGY-T & D 2 BNSF RAILWAY CO
3 NORTHWESTERN ENERGY - ELECTRIC GENERATION 4 ONEOK BAKKEN PIPELINE LLC 3 NORTHWESTERN ENERGY -
ELECTRIC GENERATION 4 ONEOK BAKKEN PIPELINE LLC
5 HILAND CRUDE LLC 6 EXPRESS PIPELINE LLC 5 EXPRESS PIPELINE LLC 6 PUGET SOUND ENERGY INC - ELECTRIC GENERATION
7 PUGET SOUND ENERGY INC - ELECTRIC GENERATION 8 CHS INC 7 NORTHERN BORDER PIPELINE
COMPANY 8 WBI ENERGY TRANSMISSION INC
9 NORTHERN BORDER PIPELINE COMPANY 10 WBI ENERGY TRANSMISSION INC 9 AVISTA CORPORATION - ELECTRIC
GENERATION 10 STILLWATER MINING COMPANY
Top 10 Property Owners by Taxable ValueTY 2017 TY 2018
Page 33
194revenue.mt.gov
Property Taxes Paid by County
Acres Assessed Taxable Avg. Mills Taxes Acres Assessed Taxable Avg. Mills TaxesCLASS 1 Net Proceeds $0 $0 - $0 $0 $0 - $0
CLASS 2 Gross Proceeds $372,977 $11,189 476.866 $5,336 $0 $0 - $0
CLASS 3 Agricultural Land:Tillable Irrigated 120,300 $72,094,572 $1,557,249 565.706 $880,945 118,861 $71,232,722 $1,538,632 566.778 $872,063Tillable Non-Irrigated 431 $111,927 $2,418 615.752 $1,489 383 $95,936 $2,073 613.322 $1,271Grazing 908,968 $47,822,878 $1,033,022 545.480 $563,493 910,296 $47,911,028 $1,034,929 549.000 $568,176Wild Hay 1,297 $433,149 $9,356 524.817 $4,910 1,297 $433,149 $9,356 525.667 $4,918Non-Qualified Ag Land 19,326 $929,957 $140,604 567.154 $79,744 19,100 $919,077 $138,956 568.492 $78,995Eligible Mining Claims 1,593 $51,198 $1,100 538.783 $593 1,593 $51,198 $1,100 544.145 $599 Class 3 Subtotal $121,443,681 $2,743,749 558.059 $1,531,174 $120,643,110 $2,725,046 559.999 $1,526,023
CLASS 4 Land and Improvements:Residential $575,820,583 $7,787,815 636.789 $4,959,193 $583,068,759 $7,852,890 649.526 $5,100,658Residential Low Income $29,569,859 $146,593 666.296 $97,674 $31,407,293 $146,250 676.807 $98,983Mobile Homes $10,823,310 $146,113 567.467 $82,914 $10,815,230 $146,006 611.641 $89,303Mobile Homes Low Income $493,010 $2,010 596.346 $1,199 $1,293,521 $3,180 627.232 $1,995Commercial $269,502,775 $4,335,174 646.753 $2,803,785 $273,408,201 $4,393,244 665.021 $2,921,600Industrial $716,637 $13,545 620.587 $8,406 $717,247 $13,557 627.538 $8,508New Manufacturing $8,649,020 $163,466 616.566 $100,788 $8,649,020 $163,466 614.120 $100,388Qualified Golf Courses $1,061,095 $10,080 616.566 $6,215 $1,291,324 $12,267 614.120 $7,533Remodeled Commercial $0 $0 - $0 $0 $0 - $0Extended Prop Tax Relief Program (Res Only) $0 $0 - $0 $0 $0 - $0 Class 4 Subtotal $896,636,289 $12,604,796 639.453 $8,060,174 $910,650,595 $12,730,860 654.234 $8,328,968
CLASS 5Rural Electric and Telephone Co-Op $29,449,747 $883,483 546.681 $482,984 $28,720,338 $861,612 550.796 $474,572Qualified New Industrial $0 $0 - $0 $0 $0 - $0Pollution Control $94,303 $2,829 616.566 $1,744 $94,709 $2,841 614.120 $1,745Gasohol Related $0 $0 - $0 $0 $0 - $0Research and Development $0 $0 - $0 $0 $0 - $0Aluminum Electrolytic Equipment $0 $0 - $0 $0 $0 - $0 Class 5 Subtotal $29,544,050 $886,312 546.904 $484,728 $28,815,047 $864,453 551.004 $476,317
CLASS 7Non-Centrally Assessed Public Util. $0 $0 - $0 $0 $0 - $0
CLASS 8Machinery $26,517,155 $599,324 621.042 $372,205 $27,818,030 $624,234 624.697 $389,957Farm Implements $12,455,240 $189,615 562.107 $106,584 $11,702,863 $177,803 578.019 $102,774Furniture and Fixtures $4,876,616 $81,538 692.083 $56,431 $4,429,130 $74,056 730.421 $54,092Other Business Equipment $3,861,424 $88,614 611.465 $54,184 $4,840,304 $105,296 628.667 $66,196 Class 8 Subtotal $47,710,435 $959,091 614.545 $589,405 $48,790,327 $981,389 624.644 $613,018
CLASS 9Utilities $29,812,411 $3,577,478 590.300 $2,111,785 $29,260,207 $3,511,217 599.862 $2,106,245
CLASS 10Timber Land 29,916 $5,731,810 $21,210 540.895 $11,472 29,930 $5,735,507 $21,224 544.765 $11,562
CLASS 12Railroads $14,432,916 $443,090 570.635 $252,843 $13,142,624 $410,052 573.895 $235,327Airlines $1,292 $40 748.236 $30 $2,789 $87 791.300 $69 Class 12 Subtotal $14,434,208 $443,130 $252,873 $13,145,413 $410,139 $235,396
CLASS 13Electrical Generation Property $0 $0 - $0 $0 $0 - $0Telecommunication Property $7,176,286 $430,574 641.088 $276,036 $6,996,722 $419,802 649.287 $272,572Elect Gen/Tele Real Prop New & Exp $0 $0 - $0 $0 $0 - $0 Class 13 Subtotal $7,176,286 $430,574 $276,036 $6,996,722 $419,802 $272,572
CLASS 14Wind Generation $0 $0 - $0 $0 $0 - $0Wind Generation New & Exp $0 $0 - $0 $0 $0 - $0 Class 14 Subtotal $0 $0 $0 $0 $0 $0
CLASS 15Carbon Dioxide and Liquid Pipeline $0 $0 - $0 $0 $0 - $0Carbon Dioxide and Liquid Pipeline (abated) $0 $0 - $0 $0 $0 - $0
Total $1,152,862,147 $21,677,529 614.599 $13,322,982 $1,164,036,928 $21,664,130 626.386 $13,570,101
ABATED PROPERTY
Current Values of Abated Property $998,033 $13,157 717.566 $9,441 $964,024 $12,753 715.120 $9,120Values Without the Property Abatement $998,033 $23,471 717.566 $16,842 $964,024 $25,506 715.120 $18,240Difference (Property Value Abated) $0 -$10,314 -$7,401 $0 -$12,753 -$9,120
Beaverhead County
TY 2018TY 2017
1 NORTHWESTERN ENERGY-T & D 2 SPECIALTY MINERALS 1 NORTHWESTERN ENERGY-T & D 2 SPECIALTY MINERALS
3 UNION PACIFIC RAILROAD CO 4 VIGILANTE ELEC COOP INC 3 UNION PACIFIC RAILROAD CO 4 VIGILANTE ELEC COOP INC
5 IDAHO POWER COMPANY 6 SOUTHERN MONTANA TELEPHONE CO 5 IDAHO POWER COMPANY 6 SOUTHERN MONTANA TELEPHONE
CO
7 VERIZON WIRELESS 8 MATADOR CATTLE COMPANY 7 VERIZON WIRELESS 8 MATADOR CATTLE COMPANY
9 3 RIVERS TELEPHONE COOPERATIVE INC 10 CLARK CANYON RANCH LLC 9 CLARK CANYON RANCH LLC 10 3 RIVERS TELEPHONE
COOPERATIVE INC
Top 10 Property Owners by Taxable ValueTY 2017 TY 2018
Page 34
195revenue.mt.gov
Property Taxes Paid by County
Acres Assessed Taxable Avg. Mills Taxes Acres Assessed Taxable Avg. Mills TaxesCLASS 1 Net Proceeds $0 $0 - $0 $0 $0 - $0
CLASS 2 Gross Proceeds $0 $0 - $0 $0 $0 - $0
CLASS 3 Agricultural Land:Tillable Irrigated 51,258 $36,462,860 $787,604 548.405 $431,926 50,963 $36,208,031 $782,098 566.947 $443,408Tillable Non-Irrigated 164,179 $33,308,545 $719,488 538.443 $387,403 163,869 $33,213,639 $717,439 563.953 $404,602Grazing 1,376,458 $54,391,716 $1,175,187 508.059 $597,065 1,375,558 $54,375,570 $1,174,840 531.534 $624,468Wild Hay 36,453 $7,991,126 $172,636 507.527 $87,617 36,424 $7,983,982 $172,482 523.818 $90,349Non-Qualified Ag Land 9,756 $462,646 $69,961 532.945 $37,285 11,282 $536,101 $81,066 553.322 $44,856Eligible Mining Claims 0 $0 $0 - $0 0 $0 $0 - $0 Class 3 Subtotal $132,616,893 $2,924,876 526.961 $1,541,297 $132,317,323 $2,927,925 549.086 $1,607,683
CLASS 4 Land and Improvements:Residential $197,090,084 $2,670,170 615.189 $1,642,658 $200,619,050 $2,710,895 635.493 $1,722,754Residential Low Income $7,487,369 $33,416 650.378 $21,733 $8,112,073 $38,236 672.225 $25,703Mobile Homes $13,188,595 $178,031 506.539 $90,180 $13,630,895 $184,002 556.239 $102,349Mobile Homes Low Income $158,860 $511 570.766 $292 $289,405 $423 642.894 $272Commercial $165,224,491 $2,655,733 602.167 $1,599,195 $169,745,804 $2,736,926 623.037 $1,705,206Industrial $13,181,752 $249,139 424.973 $105,877 $13,181,752 $249,139 440.545 $109,757New Manufacturing $63,579,927 $1,201,371 459.806 $552,398 $63,185,369 $1,193,731 475.348 $567,438Qualified Golf Courses $492,825 $4,682 554.708 $2,597 $492,825 $4,682 576.625 $2,700Remodeled Commercial $0 $0 - $0 $0 $0 - $0Extended Prop Tax Relief Program (Res Only) $0 $0 - $0 $0 $0 - $0 Class 4 Subtotal $460,403,903 $6,993,053 574.131 $4,014,930 $469,257,173 $7,118,034 595.133 $4,236,178
CLASS 5Rural Electric and Telephone Co-Op $26,959,972 $808,789 504.709 $408,203 $28,186,738 $845,599 527.711 $446,231Qualified New Industrial $0 $0 - $0 $0 $0 - $0Pollution Control $2,681,567 $80,447 558.817 $44,955 $2,609,715 $78,291 572.800 $44,845Gasohol Related $0 $0 - $0 $0 $0 - $0Research and Development $0 $0 - $0 $0 $0 - $0Aluminum Electrolytic Equipment $0 $0 - $0 $0 $0 - $0 Class 5 Subtotal $29,641,539 $889,236 509.604 $453,158 $30,796,453 $923,890 531.531 $491,077
CLASS 7Non-Centrally Assessed Public Util. $0 $0 - $0 $0 $0 - $0
CLASS 8Machinery $149,436,526 $4,050,025 444.493 $1,800,208 $150,266,966 $3,815,425 455.666 $1,738,560Farm Implements $24,293,866 $436,612 518.215 $226,259 $23,858,716 $420,759 558.462 $234,978Furniture and Fixtures $3,318,501 $60,252 575.075 $34,650 $6,374,293 $105,954 646.243 $68,472Other Business Equipment $26,171,844 $701,444 435.248 $305,302 $25,819,501 $703,999 448.456 $315,713 Class 8 Subtotal $203,220,737 $5,248,333 450.890 $2,366,419 $206,319,476 $5,046,137 467.233 $2,357,723
CLASS 9Utilities $46,070,878 $5,528,509 551.105 $3,046,788 $46,294,525 $5,555,345 585.212 $3,251,052
CLASS 10Timber Land 30,261 $3,132,710 $11,601 542.310 $6,291 30,261 $3,132,680 $11,601 569.776 $6,610
CLASS 12Railroads $69,117,976 $2,121,918 541.180 $1,148,340 $61,248,274 $1,910,947 553.707 $1,058,104Airlines $0 $0 - $0 $0 $0 - $0 Class 12 Subtotal $69,117,976 $2,121,918 $1,148,340 $61,248,274 $1,910,947 $1,058,104
CLASS 13Electrical Generation Property $17,814,624 $1,068,878 686.408 $733,687 $16,962,206 $1,017,733 706.555 $719,084Telecommunication Property $9,263,383 $555,808 542.529 $301,542 $9,168,892 $550,133 559.186 $307,627Elect Gen/Tele Real Prop New & Exp $0 $0 - $0 $0 $0 - $0 Class 13 Subtotal $27,078,007 $1,624,686 $1,035,229 $26,131,098 $1,567,866 $1,026,711
CLASS 14Wind Generation $0 $0 - $0 $0 $0 - $0Wind Generation New & Exp $0 $0 - $0 $0 $0 - $0 Class 14 Subtotal $0 $0 $0 $0 $0 $0
CLASS 15Carbon Dioxide and Liquid Pipeline $0 $0 - $0 $0 $0 - $0Carbon Dioxide and Liquid Pipeline (abated) $0 $0 - $0 $0 $0 - $0
Total $971,282,643 $25,342,212 537.145 $13,612,451 $975,497,002 $25,061,745 560.022 $14,035,137
ABATED PROPERTY
Current Values of Abated Property $8,786,477 $119,557 497.435 $59,472 $27,729,114 $385,915 540.384 $208,542Values Without the Property Abatement $8,786,477 $206,496 497.435 $102,718 $27,729,114 $771,825 540.384 $417,082Difference (Property Value Abated) $0 -$86,938 -$43,246 $0 -$385,909 -$208,539
Big Horn County
TY 2018TY 2017
1 SPRING CREEK COAL LLC 2 BNSF RAILWAY CO 1 SPRING CREEK COAL LLC 2 BNSF RAILWAY CO
3 NORTHWESTERN ENERGY-T & D 4 WESTMORELAND RESOURCES INC 3 NORTHWESTERN ENERGY-T & D 4 DECKER COAL COMPANY
5 DECKER COAL COMPANY 6 ROCKY MOUNTAIN POWER, LLC 5 PACIFICORP - ELECTRIC TRANSMISSION 6 ROCKY MOUNTAIN POWER, LLC
7 PACIFICORP - ELECTRIC TRANSMISSION 8 CENEX PIPELINE LLC 7 WESTMORELAND RESOURCES INC 8 PHILLIPS 66 CARRIER LLC
9 PHILLIPS 66 CARRIER LLC 10 WBI ENERGY TRANSMISSION INC 9 CENEX PIPELINE LLC 10 WBI ENERGY TRANSMISSION INC
Top 10 Property Owners by Taxable ValueTY 2017 TY 2018
Page 35
196revenue.mt.gov
Property Taxes Paid by County
Acres Assessed Taxable Avg. Mills Taxes Acres Assessed Taxable Avg. Mills TaxesCLASS 1 Net Proceeds $0 $0 - $0 $0 $0 - $0
CLASS 2 Gross Proceeds $0 $0 - $0 $0 $0 - $0
CLASS 3 Agricultural Land:Tillable Irrigated 54,772 $42,909,805 $926,857 643.482 $596,416 54,538 $42,695,921 $922,237 642.309 $592,361Tillable Non-Irrigated 470,741 $142,969,762 $3,088,146 659.750 $2,037,404 468,599 $141,959,149 $3,066,315 657.547 $2,016,247Grazing 997,538 $48,847,501 $1,055,132 618.564 $652,666 1,000,220 $45,817,394 $989,685 615.195 $608,850Wild Hay 28,560 $6,612,233 $142,819 599.970 $85,687 28,563 $6,611,960 $142,815 602.687 $86,073Non-Qualified Ag Land 3,561 $160,711 $24,297 655.370 $15,924 3,595 $162,347 $24,544 658.305 $16,157Eligible Mining Claims 0 $0 $0 - $0 0 $0 $0 - $0 Class 3 Subtotal $241,500,012 $5,237,251 646.923 $3,388,097 $237,246,771 $5,145,596 645.151 $3,319,688
CLASS 4 Land and Improvements:Residential $95,806,802 $1,302,865 928.282 $1,209,426 $96,429,212 $1,303,900 942.813 $1,229,334Residential Low Income $3,115,320 $16,140 923.951 $14,913 $3,595,839 $16,626 945.467 $15,719Mobile Homes $3,309,990 $44,687 761.560 $34,032 $3,241,130 $43,757 810.882 $35,482Mobile Homes Low Income $103,790 $357 753.058 $269 $179,089 $326 807.196 $263Commercial $111,075,773 $1,635,491 751.334 $1,228,801 $110,743,590 $1,629,185 756.426 $1,232,358Industrial $51,608 $976 1143.163 $1,116 $54,376 $1,029 1155.569 $1,189New Manufacturing $7,868,589 $120,939 1131.296 $136,818 $7,868,589 $120,939 1153.374 $139,488Qualified Golf Courses $608,633 $5,782 653.164 $3,777 $608,633 $5,782 656.577 $3,796Remodeled Commercial $0 $0 - $0 $0 $0 - $0Extended Prop Tax Relief Program (Res Only) $0 $0 - $0 $0 $0 - $0 Class 4 Subtotal $221,940,505 $3,127,237 840.726 $2,629,150 $222,720,458 $3,121,544 851.383 $2,657,630
CLASS 5Rural Electric and Telephone Co-Op $31,508,181 $945,247 674.871 $637,920 $30,958,712 $928,753 682.320 $633,707Qualified New Industrial $0 $0 - $0 $0 $0 - $0Pollution Control $0 $0 - $0 $0 $0 - $0Gasohol Related $0 $0 - $0 $0 $0 - $0Research and Development $0 $0 - $0 $0 $0 - $0Aluminum Electrolytic Equipment $0 $0 - $0 $0 $0 - $0 Class 5 Subtotal $31,508,181 $945,247 674.871 $637,920 $30,958,712 $928,753 682.320 $633,707
CLASS 7Non-Centrally Assessed Public Util. $0 $0 - $0 $0 $0 - $0
CLASS 8Machinery $2,424,953 $39,176 753.191 $29,507 $2,270,422 $36,324 758.436 $27,549Farm Implements $21,884,636 $354,879 627.460 $222,672 $24,372,235 $389,857 642.987 $250,673Furniture and Fixtures $1,213,756 $25,363 871.263 $22,098 $1,123,906 $22,272 913.001 $20,334Other Business Equipment $7,382,003 $118,404 613.449 $72,635 $6,636,505 $106,050 633.450 $67,177 Class 8 Subtotal $32,905,348 $537,821 645.031 $346,911 $34,403,068 $554,502 659.571 $365,734
CLASS 9Utilities $20,189,978 $2,422,787 675.430 $1,636,423 $22,658,822 $2,719,055 669.038 $1,819,150
CLASS 10Timber Land 11,057 $2,156,249 $7,978 549.155 $4,381 11,057 $2,157,329 $7,981 560.991 $4,477
CLASS 12Railroads $66,304,752 $2,035,556 656.621 $1,336,588 $58,677,758 $1,830,746 657.091 $1,202,967Airlines $0 $0 - $0 $0 $0 - $0 Class 12 Subtotal $66,304,752 $2,035,556 $1,336,588 $58,677,758 $1,830,746 $1,202,967
CLASS 13Electrical Generation Property $0 $0 - $0 $0 $0 - $0Telecommunication Property $3,764,244 $225,858 716.195 $161,758 $4,557,363 $273,439 728.023 $199,070Elect Gen/Tele Real Prop New & Exp $0 $0 - $0 $0 $0 - $0 Class 13 Subtotal $3,764,244 $225,858 $161,758 $4,557,363 $273,439 $199,070
CLASS 14Wind Generation $0 $0 - $0 $0 $0 - $0Wind Generation New & Exp $0 $0 - $0 $0 $0 - $0 Class 14 Subtotal $0 $0 $0 $0 $0 $0
CLASS 15Carbon Dioxide and Liquid Pipeline $0 $0 - $0 $0 $0 - $0Carbon Dioxide and Liquid Pipeline (abated) $0 $0 - $0 $0 $0 - $0
Total $620,269,269 $14,539,735 697.484 $10,141,229 $613,380,281 $14,581,616 699.677 $10,202,423
ABATED PROPERTY
Current Values of Abated Property $3,049,210 $28,779 1,046.301 $30,112 $3,042,040 $28,726 1,064.313 $30,573Values Without the Property Abatement $3,049,210 $58,074 1,046.301 $60,763 $3,042,040 $57,155 1,064.313 $60,831Difference (Property Value Abated) $0 -$29,295 -$30,651 $0 -$28,429 -$30,258
Blaine County
TY 2018TY 2017
1 BNSF RAILWAY CO 2 NORTHWESTERN ENERGY-T & D 1 BNSF RAILWAY CO 2 NORTHWESTERN ENERGY-T & D
3 TRIANGLE TELEPHONE COOPERATIVE ASSOC INC 4 NORTHWESTERN ENERGY - HAVRE
PIPELINE 3 TRIANGLE TELEPHONE COOPERATIVE ASSOC INC 4 NORTHWESTERN ENERGY - HAVRE
PIPELINE
5 HARTLAND COLONY INC 6 TRIANGLE COMMUNICATION SYSTEM INC 5 TRIANGLE COMMUNICATION
SYSTEM INC 6 HARTLAND COLONY INC
7 NORTHWESTERN ENERGY BEAR PAW SOUTH GAS PRODUCTION 8 HILL COUNTY ELECTRIC COOP INC 7 NORTHWESTERN ENERGY BEAR
PAW SOUTH GAS PRODUCTION 8 HILL COUNTY ELECTRIC COOP INC
9 OMIMEX CANADA LTD 10 NORTH HARLEM HUTTERIAN BRETHREN INC 9 NORTH HARLEM HUTTERIAN
BRETHREN INC 10 COLUMBIA GRAIN INC
Top 10 Property Owners by Taxable ValueTY 2017 TY 2018
Page 36
197revenue.mt.gov
Property Taxes Paid by County
Acres Assessed Taxable Avg. Mills Taxes Acres Assessed Taxable Avg. Mills TaxesCLASS 1 Net Proceeds $291,699 $291,699 528.760 $154,239 $308,628 $308,628 519.810 $160,428
CLASS 2 Gross Proceeds $0 $0 - $0 $0 $0 - $0
CLASS 3 Agricultural Land:Tillable Irrigated 43,532 $27,321,224 $590,140 528.971 $312,167 43,766 $27,697,476 $598,263 520.201 $311,217Tillable Non-Irrigated 50,726 $17,614,141 $380,451 522.695 $198,860 50,092 $17,354,540 $374,844 514.801 $192,970Grazing 282,012 $13,319,056 $287,689 525.790 $151,264 282,092 $13,320,738 $287,732 517.681 $148,953Wild Hay 4,921 $1,489,609 $32,174 528.793 $17,013 4,779 $1,454,410 $31,416 519.860 $16,332Non-Qualified Ag Land 18,540 $890,783 $134,676 522.379 $70,352 18,403 $884,983 $133,803 515.646 $68,995Eligible Mining Claims 2,113 $99,994 $2,154 528.605 $1,139 2,133 $181,494 $3,914 519.724 $2,034 Class 3 Subtotal $60,734,807 $1,427,284 526.030 $750,795 $60,893,641 $1,429,972 517.843 $740,501
CLASS 4 Land and Improvements:Residential $412,714,511 $5,583,424 532.574 $2,973,587 $428,629,312 $5,740,573 525.261 $3,015,300Residential Low Income $15,818,903 $64,208 556.037 $35,702 $17,468,116 $77,071 543.791 $41,911Mobile Homes $5,299,060 $71,548 515.064 $36,852 $5,358,070 $72,343 539.902 $39,058Mobile Homes Low Income $260,800 $732 521.615 $382 $1,280,487 $903 544.027 $491Commercial $104,788,953 $1,630,055 536.466 $874,469 $108,183,038 $1,688,990 529.093 $893,634Industrial $942,016 $17,801 533.452 $9,496 $860,516 $16,261 524.946 $8,536New Manufacturing $8,138,829 $144,165 527.819 $76,093 $7,970,649 $140,986 522.007 $73,596Qualified Golf Courses $0 $0 - $0 $0 $0 - $0Remodeled Commercial $0 $0 - $0 $0 $0 - $0Extended Prop Tax Relief Program (Res Only) $0 $0 - $0 $0 $0 - $0 Class 4 Subtotal $547,963,072 $7,511,933 533.362 $4,006,581 $569,750,188 $7,737,127 526.361 $4,072,526
CLASS 5Rural Electric and Telephone Co-Op $4,666,887 $140,006 516.698 $72,341 $4,673,181 $140,197 511.020 $71,644Qualified New Industrial $0 $0 - $0 $0 $0 - $0Pollution Control $391,467 $11,744 530.984 $6,236 $1,181,940 $11,795 522.034 $6,157Gasohol Related $0 $0 - $0 $0 $0 - $0Research and Development $0 $0 - $0 $0 $0 - $0Aluminum Electrolytic Equipment $0 $0 - $0 $0 $0 - $0 Class 5 Subtotal $5,058,354 $151,750 517.804 $78,577 $5,855,121 $151,992 511.875 $77,801
CLASS 7Non-Centrally Assessed Public Util. $0 $0 - $0 $0 $0 - $0
CLASS 8Machinery $28,259,626 $578,600 538.018 $311,297 $29,197,787 $612,254 532.191 $325,836Farm Implements $6,430,529 $100,900 515.355 $51,999 $6,159,122 $94,239 521.310 $49,128Furniture and Fixtures $799,170 $14,864 514.759 $7,652 $773,893 $14,554 540.165 $7,861Other Business Equipment $3,888,588 $91,153 526.253 $47,970 $1,621,043 $36,905 522.329 $19,276 Class 8 Subtotal $39,377,913 $785,517 533.302 $418,917 $37,751,845 $757,951 530.511 $402,102
CLASS 9Utilities $39,322,650 $4,718,715 525.399 $2,479,210 $38,738,384 $4,648,609 518.162 $2,408,733
CLASS 10Timber Land 52,362 $10,259,321 $37,963 528.760 $20,073 52,358 $10,260,504 $37,967 519.810 $19,736
CLASS 12Railroads $24,569,426 $754,281 532.149 $401,390 $22,977,506 $716,898 523.001 $374,938Airlines $1,292 $40 585.420 $23 $1,394 $43 573.400 $25 Class 12 Subtotal $24,570,718 $754,321 $401,413 $22,978,900 $716,941 $374,963
CLASS 13Electrical Generation Property $0 $0 - $0 $0 $0 - $0Telecommunication Property $4,579,853 $274,790 541.548 $148,812 $4,299,118 $257,943 531.601 $137,123Elect Gen/Tele Real Prop New & Exp $0 $0 - $0 $0 $0 - $0 Class 13 Subtotal $4,579,853 $274,790 $148,812 $4,299,118 $257,943 $137,123
CLASS 14Wind Generation $0 $0 - $0 $0 $0 - $0Wind Generation New & Exp $0 $0 - $0 $0 $0 - $0 Class 14 Subtotal $0 $0 $0 $0 $0 $0
CLASS 15Carbon Dioxide and Liquid Pipeline $0 $0 - $0 $0 $0 - $0Carbon Dioxide and Liquid Pipeline (abated) $0 $0 - $0 $0 $0 - $0
Total $732,158,387 $15,953,972 530.189 $8,458,618 $750,836,329 $16,047,130 523.079 $8,393,912
ABATED PROPERTY
Current Values of Abated Property $6,828,199 $86,718 620.973 $53,850 $6,731,930 $85,683 611.366 $52,383Values Without the Property Abatement $6,828,199 $154,719 620.973 $96,076 $6,731,930 $163,804 611.366 $100,144Difference (Property Value Abated) $0 -$68,001 -$42,227 $0 -$78,122 -$47,761
Broadwater County
TY 2018TY 2017
1 NORTHWESTERN ENERGY-T & D 2 GRAYMONT WESTERN US INC 1 NORTHWESTERN ENERGY-T & D 2 GRAYMONT WESTERN US INC
3 MONTANA RAIL LINK 4 PORTLAND GENERAL ELECTRIC COMPANY - TRANSMISSION 3 MONTANA RAIL LINK 4 PORTLAND GENERAL ELECTRIC
COMPANY - TRANSMISSION
5 PUGET SOUND ENERGY INC - TRANSMISSION PROPERTY 6 YELLOWSTONE PIPELINE CO 5 YELLOWSTONE PIPELINE CO 6 PUGET SOUND ENERGY INC -
TRANSMISSION PROPERTY
7 PACIFICORP - ELECTRIC TRANSMISSION 8 AVISTA CORPORATION - ELECTRIC
TRANSMISSION 7 PACIFICORP - ELECTRIC TRANSMISSION 8 AVISTA CORPORATION - ELECTRIC
TRANSMISSION
9 VIGILANTE ELEC COOP INC 10 VERIZON WIRELESS 9 VIGILANTE ELEC COOP INC 10 VERIZON WIRELESS
Top 10 Property Owners by Taxable ValueTY 2017 TY 2018
Page 37
198revenue.mt.gov
Property Taxes Paid by County
Acres Assessed Taxable Avg. Mills Taxes Acres Assessed Taxable Avg. Mills TaxesCLASS 1 Net Proceeds $355,251 $355,251 462.035 $164,138 $384,723 $384,723 467.710 $179,939
CLASS 2 Gross Proceeds $0 $0 - $0 $0 $0 - $0
CLASS 3 Agricultural Land:Tillable Irrigated 74,708 $49,462,983 $1,068,414 502.929 $537,337 74,326 $49,209,591 $1,062,941 493.972 $525,063Tillable Non-Irrigated 37,010 $8,646,098 $186,762 529.011 $98,799 36,931 $8,630,341 $186,422 509.567 $94,994Grazing 509,317 $23,655,541 $510,958 498.423 $254,673 509,079 $23,639,112 $510,605 487.948 $249,149Wild Hay 12,889 $3,254,647 $70,305 517.040 $36,350 12,886 $3,254,227 $70,295 496.111 $34,874Non-Qualified Ag Land 31,221 $1,502,651 $227,210 496.727 $112,861 31,862 $1,533,500 $231,877 488.267 $113,218Eligible Mining Claims 0 $0 $0 - $0 0 $0 $0 - $0 Class 3 Subtotal $86,521,920 $2,063,649 503.972 $1,040,021 $86,266,771 $2,062,140 493.321 $1,017,298
CLASS 4 Land and Improvements:Residential $1,253,401,516 $16,945,628 538.558 $9,126,199 $1,270,890,074 $17,121,422 521.901 $8,935,694Residential Low Income $37,554,982 $192,090 551.248 $105,889 $39,373,240 $194,928 531.942 $103,690Mobile Homes $11,040,140 $149,056 524.685 $78,207 $11,171,850 $150,837 532.516 $80,323Mobile Homes Low Income $735,590 $2,059 569.209 $1,172 $1,757,812 $2,101 567.987 $1,193Commercial $309,179,901 $4,822,641 538.599 $2,597,469 $313,116,443 $4,876,559 523.119 $2,551,019Industrial $3,599,840 $68,035 464.600 $31,609 $3,663,675 $69,241 469.797 $32,529New Manufacturing $19,628,187 $282,082 499.008 $140,761 $14,380,767 $221,501 496.737 $110,028Qualified Golf Courses $2,537,200 $24,103 581.385 $14,013 $2,537,200 $24,103 559.900 $13,495Remodeled Commercial $0 $0 - $0 $0 $0 - $0Extended Prop Tax Relief Program (Res Only) $0 $0 - $0 $0 $0 - $0 Class 4 Subtotal $1,637,677,356 $22,485,694 537.912 $12,095,320 $1,656,891,061 $22,660,692 521.960 $11,827,972
CLASS 5Rural Electric and Telephone Co-Op $13,496,098 $404,885 509.876 $206,441 $13,624,820 $408,751 499.038 $203,982Qualified New Industrial $0 $0 - $0 $0 $0 - $0Pollution Control $0 $0 - $0 $0 $0 - $0Gasohol Related $0 $0 - $0 $0 $0 - $0Research and Development $0 $0 - $0 $0 $0 - $0Aluminum Electrolytic Equipment $0 $0 - $0 $0 $0 - $0 Class 5 Subtotal $13,496,098 $404,885 509.876 $206,441 $13,624,820 $408,751 499.038 $203,982
CLASS 7Non-Centrally Assessed Public Util. $0 $0 - $0 $0 $0 - $0
CLASS 8Machinery $22,347,895 $357,520 511.837 $182,992 $21,603,967 $365,982 507.070 $185,578Farm Implements $7,353,996 $118,861 473.482 $56,279 $7,784,042 $127,779 486.854 $62,210Furniture and Fixtures $2,581,581 $44,588 572.841 $25,542 $2,402,558 $41,022 565.715 $23,207Other Business Equipment $2,729,456 $41,535 486.079 $20,189 $2,450,980 $37,327 492.900 $18,399 Class 8 Subtotal $35,012,928 $562,503 506.666 $285,001 $34,241,547 $572,110 505.835 $289,393
CLASS 9Utilities $106,797,748 $12,815,684 493.022 $6,318,409 $116,238,211 $13,948,569 487.846 $6,804,759
CLASS 10Timber Land 6,992 $852,916 $3,155 505.756 $1,596 6,992 $852,982 $3,155 482.425 $1,522
CLASS 12Railroads $36,030,983 $1,106,151 499.740 $552,788 $31,917,889 $995,838 492.693 $490,642Airlines $0 $0 - $0 $0 $0 - $0 Class 12 Subtotal $36,030,983 $1,106,151 $552,788 $31,917,889 $995,838 $490,642
CLASS 13Electrical Generation Property $0 $0 - $0 $0 $0 - $0Telecommunication Property $9,509,111 $570,549 533.268 $304,255 $9,371,289 $562,271 517.980 $291,245Elect Gen/Tele Real Prop New & Exp $0 $0 - $0 $0 $0 - $0 Class 13 Subtotal $9,509,111 $570,549 $304,255 $9,371,289 $562,271 $291,245
CLASS 14Wind Generation $0 $0 - $0 $0 $0 - $0Wind Generation New & Exp $0 $0 - $0 $0 $0 - $0 Class 14 Subtotal $0 $0 $0 $0 $0 $0
CLASS 15Carbon Dioxide and Liquid Pipeline $0 $0 - $0 $0 $0 - $0Carbon Dioxide and Liquid Pipeline (abated) $0 $0 - $0 $0 $0 - $0
Total $1,926,254,311 $40,367,521 519.427 $20,967,970 $1,949,789,293 $41,598,249 507.395 $21,106,753
ABATED PROPERTY
Current Values of Abated Property $31,285,656 $456,016 506.230 $230,849 $25,707,053 $410,262 501.861 $205,894Values Without the Property Abatement $31,285,656 $656,172 506.230 $332,174 $25,707,053 $550,922 501.861 $276,486Difference (Property Value Abated) $0 -$200,156 -$101,325 $0 -$140,660 -$70,592
Carbon County
TY 2018TY 2017
1 EXPRESS PIPELINE LLC 2 NORTHWESTERN ENERGY-T & D 1 EXPRESS PIPELINE LLC 2 NORTHWESTERN ENERGY-T & D
3 WBI ENERGY TRANSMISSION INC 4 BNSF RAILWAY CO 3 WBI ENERGY TRANSMISSION INC 4 BNSF RAILWAY CO
5 MONTANA LIMESTONE COMPANY 6 EXXONMOBIL PIPELINE COMPANY 5 MONTANA LIMESTONE COMPANY 6 EXXONMOBIL PIPELINE COMPANY
7 BEARTOOTH ELEC COOP INC 8 PACIFICORP - ELECTRIC TRANSMISSION 7 BEARTOOTH ELEC COOP INC 8 PACIFICORP - ELECTRIC
TRANSMISSION
9 VERIZON WIRELESS 10 COLORADO INTERSTATE GAS CO 9 VERIZON WIRELESS 10 RED BUTTE PIPELINE COMPANY
Top 10 Property Owners by Taxable ValueTY 2017 TY 2018
Page 38
199revenue.mt.gov
Property Taxes Paid by County
Acres Assessed Taxable Avg. Mills Taxes Acres Assessed Taxable Avg. Mills TaxesCLASS 1 Net Proceeds $0 $0 - $0 $0 $0 - $0
CLASS 2 Gross Proceeds $0 $0 - $0 $0 $0 - $0
CLASS 3 Agricultural Land:Tillable Irrigated 125 $142,500 $3,077 229.903 $707 125 $142,500 $3,077 231.830 $713Tillable Non-Irrigated 107,267 $23,622,586 $510,246 266.421 $135,940 107,272 $23,623,298 $510,261 268.348 $136,928Grazing 1,186,738 $44,883,445 $969,521 256.578 $248,757 1,186,826 $44,868,307 $969,191 258.812 $250,838Wild Hay 86,923 $16,192,028 $349,743 260.577 $91,135 86,923 $16,192,000 $349,743 262.638 $91,856Non-Qualified Ag Land 2,603 $125,260 $18,941 273.376 $5,178 2,601 $125,204 $18,933 275.129 $5,209Eligible Mining Claims 0 $0 $0 - $0 0 $0 $0 - $0 Class 3 Subtotal $84,965,819 $1,851,528 260.173 $481,718 $84,951,309 $1,851,205 262.285 $485,544
CLASS 4 Land and Improvements:Residential $26,472,141 $365,046 417.533 $152,419 $27,059,087 $369,686 421.081 $155,668Residential Low Income $407,720 $1,985 514.063 $1,020 $513,870 $1,849 517.770 $957Mobile Homes $5,854,820 $79,038 302.934 $23,943 $6,077,930 $82,049 313.847 $25,751Mobile Homes Low Income $15,580 $42 255.743 $11 $106,756 $42 275.500 $12Commercial $48,758,382 $684,734 287.640 $196,957 $52,238,340 $731,728 288.946 $211,430Industrial $0 $0 - $0 $0 $0 - $0New Manufacturing $0 $0 - $0 $0 $0 - $0Qualified Golf Courses $0 $0 - $0 $0 $0 - $0Remodeled Commercial $0 $0 - $0 $0 $0 - $0Extended Prop Tax Relief Program (Res Only) $0 $0 - $0 $0 $0 - $0 Class 4 Subtotal $81,508,643 $1,130,845 331.036 $374,350 $85,995,983 $1,185,354 332.236 $393,818
CLASS 5Rural Electric and Telephone Co-Op $13,650,001 $409,501 316.142 $129,461 $14,280,434 $428,413 316.631 $135,649Qualified New Industrial $0 $0 - $0 $0 $0 - $0Pollution Control $0 $0 - $0 $0 $0 - $0Gasohol Related $0 $0 - $0 $0 $0 - $0Research and Development $0 $0 - $0 $0 $0 - $0Aluminum Electrolytic Equipment $0 $0 - $0 $0 $0 - $0 Class 5 Subtotal $13,650,001 $409,501 316.142 $129,461 $14,280,434 $428,413 316.631 $135,649
CLASS 7Non-Centrally Assessed Public Util. $0 $0 - $0 $0 $0 - $0
CLASS 8Machinery $3,387,632 $51,018 222.946 $11,374 $2,550,089 $38,488 240.555 $9,258Farm Implements $12,092,653 $193,238 254.479 $49,175 $12,539,718 $201,924 265.518 $53,615Furniture and Fixtures $166,579 $2,570 302.107 $776 $97,532 $1,470 332.070 $488Other Business Equipment $1,317,389 $19,774 248.120 $4,906 $773,554 $11,637 263.806 $3,070 Class 8 Subtotal $16,964,253 $266,600 248.432 $66,232 $15,960,893 $253,519 262.036 $66,431
CLASS 9Utilities $405,198,130 $48,623,772 249.851 $12,148,713 $404,651,784 $48,558,212 251.768 $12,225,390
CLASS 10Timber Land 10,505 $1,237,213 $4,577 256.297 $1,173 10,531 $1,239,981 $4,587 258.381 $1,185
CLASS 12Railroads $0 $0 - $0 $0 $0 - $0Airlines $0 $0 - $0 $0 $0 - $0 Class 12 Subtotal $0 $0 $0 $0 $0 $0
CLASS 13Electrical Generation Property $0 $0 - $0 $0 $0 - $0Telecommunication Property $632,040 $37,923 252.929 $9,592 $769,289 $46,156 256.061 $11,819Elect Gen/Tele Real Prop New & Exp $0 $0 - $0 $0 $0 - $0 Class 13 Subtotal $632,040 $37,923 $9,592 $769,289 $46,156 $11,819
CLASS 14Wind Generation $0 $0 - $0 $0 $0 - $0Wind Generation New & Exp $0 $0 - $0 $0 $0 - $0 Class 14 Subtotal $0 $0 $0 $0 $0 $0
CLASS 15Carbon Dioxide and Liquid Pipeline $0 $0 - $0 $0 $0 - $0Carbon Dioxide and Liquid Pipeline (abated) $0 $0 - $0 $0 $0 - $0
Total $604,156,099 $52,324,746 252.485 $13,211,239 $607,849,673 $52,327,446 254.548 $13,319,835
ABATED PROPERTY
Current Values of Abated Property $0 $0 - $0 $0 $0 - $0Values Without the Property Abatement $0 $0 - $0 $0 $0 - $0Difference (Property Value Abated) $0 $0 $0 $0 $0 $0
Carter County
TY 2018TY 2017
1 BISON PIPELINE LLC 2 ONEOK BAKKEN PIPELINE LLC 1 BISON PIPELINE LLC 2 ONEOK BAKKEN PIPELINE LLC
3 BRIDGER PIPELINE LLC 4 BUTTE PIPE LINE CO 3 BRIDGER PIPELINE LLC 4 BUTTE PIPE LINE CO
5 WBI ENERGY TRANSMISSION INC 6 BELLE FOURCHE PIPELINE COMPANY 5 WBI ENERGY TRANSMISSION INC 6 BELLE FOURCHE PIPELINE
COMPANY
7 HILAND CRUDE LLC 8 SOUTHEAST ELECTRIC COOPERATIVE INC 7 HILAND CRUDE LLC 8 SOUTHEAST ELECTRIC
COOPERATIVE INC
9 BLACK HILLS POWER & LIGHT CO 10 KITTELMANN SCOTT 9 BLACK HILLS POWER & LIGHT CO 10 MID RIVERS TELEPHONE COOPERATIVE
Top 10 Property Owners by Taxable ValueTY 2017 TY 2018
Page 39
200revenue.mt.gov
Property Taxes Paid by County
Acres Assessed Taxable Avg. Mills Taxes Acres Assessed Taxable Avg. Mills TaxesCLASS 1 Net Proceeds $0 $0 - $0 $0 $0 - $0
CLASS 2 Gross Proceeds $0 $0 - $0 $0 $0 - $0
CLASS 3 Agricultural Land:Tillable Irrigated 42,378 $27,321,586 $590,145 664.192 $391,970 42,061 $27,096,490 $585,282 653.256 $382,339Tillable Non-Irrigated 335,642 $99,000,156 $2,138,375 592.605 $1,267,213 335,550 $98,998,447 $2,138,339 591.572 $1,264,982Grazing 780,391 $48,706,099 $1,052,068 619.048 $651,280 780,204 $48,690,196 $1,051,722 601.824 $632,952Wild Hay 58,778 $16,248,078 $350,970 610.657 $214,322 58,754 $16,241,041 $350,819 602.543 $211,384Non-Qualified Ag Land 48,851 $2,345,914 $354,687 611.384 $216,850 49,502 $2,377,683 $359,488 600.126 $215,738Eligible Mining Claims 282 $13,594 $294 582.501 $171 282 $13,594 $294 581.101 $171 Class 3 Subtotal $193,635,427 $4,486,539 611.118 $2,741,806 $193,417,451 $4,485,944 603.566 $2,707,565
CLASS 4 Land and Improvements:Residential $4,515,966,472 $60,965,887 683.593 $41,675,836 $4,599,258,232 $61,566,612 699.020 $43,036,284Residential Low Income $234,069,004 $1,130,063 699.312 $790,267 $244,556,104 $1,161,586 717.922 $833,929Mobile Homes $44,902,180 $604,071 619.375 $374,147 $44,506,480 $598,728 652.830 $390,867Mobile Homes Low Income $5,624,170 $23,146 644.930 $14,928 $15,027,897 $23,310 680.452 $15,861Commercial $1,972,711,706 $34,256,613 703.634 $24,104,117 $1,990,188,918 $34,537,810 721.421 $24,916,301Industrial $19,789,135 $374,011 652.707 $244,120 $20,228,978 $382,325 675.488 $258,256New Manufacturing $138,336,429 $2,381,854 709.440 $1,689,783 $149,385,391 $2,540,011 733.286 $1,862,554Qualified Golf Courses $2,966,807 $28,187 622.852 $17,556 $2,966,807 $28,187 638.958 $18,010Remodeled Commercial $3,957,058 $15,036 1135.895 $17,079 $3,957,058 $30,074 903.138 $27,161Extended Prop Tax Relief Program (Res Only) $0 $0 - $0 $0 $0 - $0 Class 4 Subtotal $6,938,322,961 $99,778,868 690.806 $68,927,833 $7,070,075,865 $100,868,643 707.447 $71,359,223
CLASS 5Rural Electric and Telephone Co-Op $14,896,338 $446,891 640.357 $286,170 $15,508,385 $465,260 639.561 $297,562Qualified New Industrial $0 $0 - $0 $82,086,591 $0 - $0Pollution Control $2,968,813 $89,064 728.565 $64,889 $4,433,798 $71,321 750.740 $53,544Gasohol Related $0 $0 - $0 $0 $0 - $0Research and Development $0 $0 - $0 $0 $0 - $0Aluminum Electrolytic Equipment $0 $0 - $0 $0 $0 - $0 Class 5 Subtotal $17,865,151 $535,955 655.015 $351,059 $102,028,774 $536,581 654.339 $351,106
CLASS 7Non-Centrally Assessed Public Util. $14,329,565 $1,146,364 728.871 $835,551 $15,067,196 $1,205,375 749.161 $903,020
CLASS 8Machinery $394,596,450 $10,707,388 718.830 $7,696,794 $470,320,254 $12,809,884 743.418 $9,523,094Farm Implements $15,148,649 $256,743 588.240 $151,026 $14,688,162 $244,611 602.011 $147,258Furniture and Fixtures $73,981,619 $1,308,655 679.219 $888,864 $82,647,380 $1,414,862 717.629 $1,015,345Other Business Equipment $33,995,437 $836,353 711.391 $594,974 $27,284,234 $611,589 734.389 $449,144 Class 8 Subtotal $517,722,155 $13,109,139 711.844 $9,331,659 $594,940,030 $15,080,946 738.338 $11,134,842
CLASS 9Utilities $142,687,022 $17,122,450 630.854 $10,801,761 $149,358,716 $17,923,024 644.343 $11,548,569
CLASS 10Timber Land 73,354 $15,740,361 $58,235 613.164 $35,708 73,144 $15,695,313 $58,070 591.354 $34,340
CLASS 12Railroads $109,973,419 $3,376,185 620.245 $2,094,063 $107,888,356 $3,366,111 636.017 $2,140,903Airlines $25,454,578 $781,457 709.255 $554,252 $27,486,073 $857,566 731.090 $626,958 Class 12 Subtotal $135,427,997 $4,157,642 $2,648,315 $135,374,429 $4,223,677 $2,767,860
CLASS 13Electrical Generation Property $308,948,019 $18,536,878 557.144 $10,327,705 $301,937,949 $18,116,280 575.040 $10,417,586Telecommunication Property $73,763,708 $4,425,830 651.890 $2,885,153 $69,706,547 $4,182,379 674.997 $2,823,093Elect Gen/Tele Real Prop New & Exp $0 $0 - $0 $0 $0 - $0 Class 13 Subtotal $382,711,727 $22,962,708 $13,212,858 $371,644,496 $22,298,659 $13,240,679
CLASS 14Wind Generation $0 $0 - $0 $0 $0 - $0Wind Generation New & Exp $18,769,056 $281,536 591.646 $166,570 $18,401,714 $276,025 594.042 $163,970 Class 14 Subtotal $18,769,056 $281,536 $166,570 $18,401,714 $276,025 $163,970
CLASS 15Carbon Dioxide and Liquid Pipeline $0 $0 - $0 $0 $0 - $0Carbon Dioxide and Liquid Pipeline (abated) $0 $0 - $0 $0 $0 - $0
Total $8,377,211,422 $163,639,436 666.423 $109,053,119 $8,666,003,984 $166,956,944 684.076 $114,211,175
ABATED PROPERTY
Current Values of Abated Property $38,860,817 $327,525 825.231 $270,284 $50,639,115 $496,536 809.061 $401,727Values Without the Property Abatement $38,860,817 $747,916 825.231 $617,204 $50,639,115 $977,167 809.061 $790,587Difference (Property Value Abated) $0 -$420,392 -$346,920 $0 -$480,631 -$388,860
Cascade County
TY 2018TY 2017
1 NORTHWESTERN ENERGY - ELECTRIC GENERATION 2 NORTHWESTERN ENERGY-T & D 1 NORTHWESTERN ENERGY -
ELECTRIC GENERATION 2 NORTHWESTERN ENERGY-T & D
3 MONTANA REFINING COMPANY INC 4 BNSF RAILWAY CO 3 MONTANA REFINING COMPANY INC 4 BNSF RAILWAY CO
5 CENTURYLINK INC 6 ENERGY WEST MONTANA INC 5 QWEST CORPORATION AND OR CENTURYLINK INC - 6 ENERGY WEST MONTANA INC
7 PHILLIPS 66 CARRIER LLC 8 VERIZON WIRELESS 7 PHILLIPS 66 CARRIER LLC 8 VERIZON WIRELESS
9 CHARTER COMMUNICATIONS INC 10 GK HOLIDAY VILLAGE LLC 9 CHARTER COMMUNICATIONS INC 10 GK HOLIDAY VILLAGE LLC
Top 10 Property Owners by Taxable ValueTY 2017 TY 2018
Page 40
201revenue.mt.gov
Property Taxes Paid by County
Acres Assessed Taxable Avg. Mills Taxes Acres Assessed Taxable Avg. Mills TaxesCLASS 1 Net Proceeds $0 $0 - $0 $0 $0 - $0
CLASS 2 Gross Proceeds $0 $0 - $0 $0 $0 - $0
CLASS 3 Agricultural Land:Tillable Irrigated 9,725 $5,998,961 $129,583 573.453 $74,310 9,652 $5,955,135 $128,636 568.583 $73,140Tillable Non-Irrigated 1,196,035 $405,780,308 $8,764,835 557.694 $4,888,098 1,195,901 $405,731,802 $8,763,788 554.080 $4,855,840Grazing 806,447 $39,660,325 $856,703 560.906 $480,530 806,376 $39,655,840 $856,603 559.845 $479,564Wild Hay 24,032 $6,488,446 $140,162 599.437 $84,018 24,362 $6,575,344 $142,039 603.408 $85,708Non-Qualified Ag Land 5,331 $272,111 $41,135 589.056 $24,231 5,504 $280,433 $42,392 581.520 $24,652Eligible Mining Claims 0 $0 $0 - $0 0 $0 $0 - $0 Class 3 Subtotal $458,200,151 $9,932,418 558.896 $5,551,187 $458,198,554 $9,933,458 555.587 $5,518,904
CLASS 4 Land and Improvements:Residential $141,278,887 $1,926,116 707.033 $1,361,827 $142,179,788 $1,926,893 704.351 $1,357,208Residential Low Income $5,936,558 $24,014 737.567 $17,712 $6,516,092 $27,322 733.746 $20,047Mobile Homes $4,476,960 $60,435 567.985 $34,326 $4,453,720 $60,119 592.412 $35,615Mobile Homes Low Income $48,930 $248 687.867 $171 $160,064 $324 694.251 $225Commercial $166,865,047 $2,384,337 596.101 $1,421,305 $169,672,196 $2,422,865 592.405 $1,435,317Industrial $1,064,153 $20,107 649.691 $13,063 $1,064,905 $20,122 643.245 $12,943New Manufacturing $44,349,187 $729,800 639.384 $466,623 $46,130,714 $755,341 627.746 $474,163Qualified Golf Courses $0 $0 - $0 $0 $0 - $0Remodeled Commercial $0 $0 - $0 $0 $0 - $0Extended Prop Tax Relief Program (Res Only) $0 $0 - $0 $0 $0 - $0 Class 4 Subtotal $364,019,722 $5,145,057 644.313 $3,315,027 $370,177,479 $5,212,986 639.848 $3,335,519
CLASS 5Rural Electric and Telephone Co-Op $36,274,966 $1,088,249 575.331 $626,103 $35,633,077 $1,068,992 577.470 $617,311Qualified New Industrial $0 $0 - $0 $0 $0 - $0Pollution Control $0 $0 - $0 $0 $0 - $0Gasohol Related $0 $0 - $0 $0 $0 - $0Research and Development $0 $0 - $0 $0 $0 - $0Aluminum Electrolytic Equipment $0 $0 - $0 $0 $0 - $0 Class 5 Subtotal $36,274,966 $1,088,249 575.331 $626,103 $35,633,077 $1,068,992 577.470 $617,311
CLASS 7Non-Centrally Assessed Public Util. $0 $0 - $0 $0 $0 - $0
CLASS 8Machinery $7,732,904 $146,152 682.460 $99,743 $6,741,636 $124,138 684.616 $84,987Farm Implements $55,110,015 $912,165 547.969 $499,838 $52,253,029 $866,086 566.064 $490,261Furniture and Fixtures $876,003 $15,169 632.621 $9,596 $950,508 $16,928 646.128 $10,938Other Business Equipment $3,209,946 $49,917 534.667 $26,689 $2,300,062 $35,999 568.993 $20,483 Class 8 Subtotal $66,928,868 $1,123,402 566.018 $635,866 $62,245,235 $1,043,152 581.573 $606,669
CLASS 9Utilities $59,476,439 $7,137,147 528.788 $3,774,035 $68,399,860 $8,207,976 523.828 $4,299,564
CLASS 10Timber Land 20,313 $6,190,400 $22,904 624.671 $14,307 20,313 $6,193,237 $22,915 627.623 $14,382
CLASS 12Railroads $26,400,326 $810,489 571.342 $463,067 $23,418,730 $730,663 565.860 $413,453Airlines $0 $0 - $0 $0 $0 - $0 Class 12 Subtotal $26,400,326 $810,489 $463,067 $23,418,730 $730,663 $413,453
CLASS 13Electrical Generation Property $30,849 $1,851 761.955 $1,410 $29,904 $1,794 764.770 $1,372Telecommunication Property $3,399,151 $203,957 622.156 $126,893 $3,267,569 $196,054 608.054 $119,211Elect Gen/Tele Real Prop New & Exp $0 $0 - $0 $0 $0 - $0 Class 13 Subtotal $3,430,000 $205,808 $128,304 $3,297,473 $197,848 $120,583
CLASS 14Wind Generation $0 $0 - $0 $0 $0 - $0Wind Generation New & Exp $0 $0 - $0 $0 $0 - $0 Class 14 Subtotal $0 $0 $0 $0 $0 $0
CLASS 15Carbon Dioxide and Liquid Pipeline $0 $0 - $0 $0 $0 - $0Carbon Dioxide and Liquid Pipeline (abated) $0 $0 - $0 $0 $0 - $0
Total $1,020,920,872 $25,465,474 569.708 $14,507,895 $1,027,563,645 $26,417,990 565.008 $14,926,385
ABATED PROPERTY
Current Values of Abated Property $14,269,213 $161,287 714.302 $115,208 $13,364,525 $135,397 739.917 $100,182Values Without the Property Abatement $14,269,213 $269,733 714.302 $192,671 $13,364,525 $252,371 739.917 $186,734Difference (Property Value Abated) $0 -$108,446 -$77,464 $0 -$116,975 -$86,551
Chouteau County
TY 2018TY 2017
1 EXPRESS PIPELINE LLC 2 NORTHWESTERN ENERGY-T & D 1 EXPRESS PIPELINE LLC 2 NORTHWESTERN ENERGY-T & D
3 BNSF RAILWAY CO 4 TRIANGLE TELEPHONE COOPERATIVE ASSOC INC 3 BNSF RAILWAY CO 4 TRIANGLE TELEPHONE
COOPERATIVE ASSOC INC
5 EGT LLC 6 PHILLIPS 66 CARRIER LLC 5 PHILLIPS 66 CARRIER LLC 6 EGT LLC
7 HILL COUNTY ELECTRIC COOP INC 8 CHS INC 7 HILL COUNTY ELECTRIC COOP INC 8 TWIN HILLS COLONY INC
9 TWIN HILLS COLONY INC 10 MOUNTAIN VIEW CO-OP 9 CHS INC 10 3 RIVERS TELEPHONE COOPERATIVE INC
Top 10 Property Owners by Taxable ValueTY 2017 TY 2018
Page 41
202revenue.mt.gov
Property Taxes Paid by County
Acres Assessed Taxable Avg. Mills Taxes Acres Assessed Taxable Avg. Mills TaxesCLASS 1 Net Proceeds $0 $0 - $0 $0 $0 - $0
CLASS 2 Gross Proceeds $0 $0 - $0 $0 $0 - $0
CLASS 3 Agricultural Land:Tillable Irrigated 33,322 $26,887,104 $580,770 536.426 $311,540 33,216 $26,188,154 $565,672 565.453 $319,861Tillable Non-Irrigated 79,459 $23,068,513 $498,279 525.596 $261,894 79,459 $23,068,513 $498,279 549.674 $273,891Grazing 1,643,453 $70,747,320 $1,528,130 523.855 $800,518 1,643,205 $70,735,149 $1,527,867 550.830 $841,594Wild Hay 33,667 $7,666,982 $165,603 519.870 $86,092 33,661 $7,665,828 $165,578 548.095 $90,752Non-Qualified Ag Land 20,579 $990,429 $149,739 537.404 $80,470 20,940 $1,007,808 $152,368 568.852 $86,675Eligible Mining Claims 0 $0 $0 - $0 0 $0 $0 - $0 Class 3 Subtotal $129,360,348 $2,922,521 527.118 $1,540,515 $128,665,452 $2,909,764 554.263 $1,612,774
CLASS 4 Land and Improvements:Residential $516,235,129 $6,973,689 776.001 $5,411,591 $519,361,538 $6,971,047 799.089 $5,570,489Residential Low Income $24,256,252 $109,705 807.609 $88,599 $24,913,456 $112,171 825.782 $92,629Mobile Homes $10,434,720 $140,866 682.086 $96,083 $10,547,160 $142,384 658.286 $93,729Mobile Homes Low Income $628,290 $2,053 835.210 $1,715 $1,231,756 $1,953 798.624 $1,560Commercial $228,702,348 $3,890,119 759.957 $2,956,324 $231,865,891 $3,953,347 784.253 $3,100,423Industrial $2,018,599 $38,152 667.845 $25,480 $1,596,076 $30,167 709.114 $21,392New Manufacturing $16,945,454 $320,268 647.877 $207,494 $16,384,924 $309,674 684.697 $212,033Qualified Golf Courses $1,371,601 $13,030 663.375 $8,644 $1,371,601 $13,030 680.330 $8,865Remodeled Commercial $709,080 $5,389 813.547 $4,384 $933,380 $9,385 794.646 $7,458Extended Prop Tax Relief Program (Res Only) $0 $0 - $0 $0 $0 - $0 Class 4 Subtotal $801,301,473 $11,493,271 765.693 $8,800,313 $808,205,782 $11,543,158 789.089 $9,108,577
CLASS 5Rural Electric and Telephone Co-Op $23,713,105 $711,392 641.263 $456,190 $15,485,629 $464,564 649.961 $301,949Qualified New Industrial $0 $0 - $0 $0 $0 - $0Pollution Control $0 $0 - $0 $0 $0 - $0Gasohol Related $0 $0 - $0 $0 $0 - $0Research and Development $0 $0 - $0 $0 $0 - $0Aluminum Electrolytic Equipment $0 $0 - $0 $0 $0 - $0 Class 5 Subtotal $23,713,105 $711,392 641.263 $456,190 $15,485,629 $464,564 649.961 $301,949
CLASS 7Non-Centrally Assessed Public Util. $0 $0 - $0 $0 $0 - $0
CLASS 8Machinery $11,156,173 $177,033 660.894 $117,000 $10,211,193 $163,764 674.985 $110,538Farm Implements $8,157,008 $130,645 558.887 $73,016 $8,589,932 $135,702 550.357 $74,684Furniture and Fixtures $9,261,259 $185,212 845.988 $156,687 $8,689,169 $176,039 819.657 $144,292Other Business Equipment $3,818,507 $58,388 758.266 $44,273 $3,334,181 $51,083 717.048 $36,629 Class 8 Subtotal $32,392,947 $551,278 709.218 $390,976 $30,824,475 $526,588 695.313 $366,143
CLASS 9Utilities $36,872,489 $4,424,695 616.999 $2,730,031 $37,662,122 $4,519,457 646.223 $2,920,579
CLASS 10Timber Land 31,711 $3,463,681 $12,816 520.935 $6,676 31,711 $3,463,685 $12,816 550.025 $7,049
CLASS 12Railroads $57,890,140 $1,777,227 570.679 $1,014,226 $51,204,546 $1,597,583 603.401 $963,983Airlines $14,018 $430 847.545 $364 $13,737 $429 869.720 $373 Class 12 Subtotal $57,904,158 $1,777,657 $1,014,590 $51,218,283 $1,598,012 $964,356
CLASS 13Electrical Generation Property $1,743,591 $104,615 663.375 $69,399 $2,427,394 $145,644 680.330 $99,086Telecommunication Property $6,535,640 $392,141 685.633 $268,865 $5,979,300 $358,759 732.631 $262,838Elect Gen/Tele Real Prop New & Exp $0 $0 - $0 $0 $0 - $0 Class 13 Subtotal $8,279,231 $496,756 $338,264 $8,406,694 $504,403 $361,924
CLASS 14Wind Generation $0 $0 - $0 $0 $0 - $0Wind Generation New & Exp $0 $0 - $0 $0 $0 - $0 Class 14 Subtotal $0 $0 $0 $0 $0 $0
CLASS 15Carbon Dioxide and Liquid Pipeline $0 $0 - $0 $0 $0 - $0Carbon Dioxide and Liquid Pipeline (abated) $0 $0 - $0 $0 $0 - $0
Total $1,093,287,432 $22,390,386 682.327 $15,277,555 $1,083,932,122 $22,078,762 708.525 $15,643,351
ABATED PROPERTY
Current Values of Abated Property $709,080 $5,389 813.547 $4,384 $933,380 $9,385 794.646 $7,458Values Without the Property Abatement $709,080 $13,404 813.547 $10,905 $933,380 $17,641 794.646 $14,018Difference (Property Value Abated) $0 -$8,015 -$6,520 $0 -$8,256 -$6,561
Custer County
TY 2018TY 2017
1 BNSF RAILWAY CO 2 HILAND CRUDE LLC 1 BNSF RAILWAY CO 2 HILAND CRUDE LLC
3 CENEX PIPELINE LLC 4 MONTANA DAKOTA UTILITIES - ELECTRIC DISTRIBUTION 3 CENEX PIPELINE LLC 4 MONTANA DAKOTA UTILITIES -
ELECTRIC DISTRIBUTION
5 WBI ENERGY TRANSMISSION INC 6 MONTANA DAKOTA UTILITIES - GAS DISTRIBUTION 5 WBI ENERGY TRANSMISSION INC 6 MONTANA DAKOTA UTILITIES - GAS
DISTRIBUTION
7 BASIN ELECTRIC POWER COOPERATIVE 8 MONTANA DAKOTA UTILITIES -
ELECTRIC TRANSMISSION 7 MONTANA DAKOTA UTILITIES - ELECTRIC TRANSMISSION 8 MID RIVERS TELEPHONE
COOPERATIVE
9 MID RIVERS TELEPHONE COOPERATIVE 10 TONGUE RIVER ELECTRIC COOP
INC 9 TONGUE RIVER ELECTRIC COOP INC 10 WAL MART REAL ESTATE BUSINESS
TRUST
Top 10 Property Owners by Taxable ValueTY 2017 TY 2018
Page 42
203revenue.mt.gov
Property Taxes Paid by County
Acres Assessed Taxable Avg. Mills Taxes Acres Assessed Taxable Avg. Mills TaxesCLASS 1 Net Proceeds $0 $0 - $0 $0 $0 - $0
CLASS 2 Gross Proceeds $0 $0 - $0 $0 $0 - $0
CLASS 3 Agricultural Land:Tillable Irrigated 608 $364,421 $7,871 570.283 $4,489 608 $364,421 $7,871 587.890 $4,627Tillable Non-Irrigated 441,032 $145,712,089 $3,147,368 568.501 $1,789,280 440,579 $145,575,607 $3,144,417 586.183 $1,843,202Grazing 210,802 $8,901,806 $192,276 568.937 $109,393 211,216 $8,932,178 $192,931 586.624 $113,178Wild Hay 6,024 $1,199,888 $25,916 568.413 $14,731 6,024 $1,199,748 $25,913 586.097 $15,188Non-Qualified Ag Land 2,477 $115,414 $17,451 568.301 $9,917 2,375 $110,474 $16,704 585.996 $9,788Eligible Mining Claims 0 $0 $0 - $0 0 $0 $0 - $0 Class 3 Subtotal $156,293,618 $3,390,882 568.528 $1,927,810 $156,182,428 $3,387,836 586.210 $1,985,984
CLASS 4 Land and Improvements:Residential $74,219,715 $1,008,267 708.736 $714,595 $74,645,922 $1,010,559 733.038 $740,778Residential Low Income $2,455,707 $11,022 743.805 $8,198 $2,722,465 $13,658 753.360 $10,289Mobile Homes $1,035,440 $13,978 558.664 $7,809 $1,218,250 $16,446 605.184 $9,953Mobile Homes Low Income $0 $0 - $0 $43,409 $0 - $0Commercial $62,015,273 $936,119 603.383 $564,838 $61,718,564 $927,047 622.627 $577,204Industrial $90,014 $1,702 674.410 $1,148 $90,014 $1,702 697.728 $1,188New Manufacturing $4,516,801 $85,368 583.011 $49,770 $6,311,091 $119,280 598.024 $71,332Qualified Golf Courses $139,490 $1,325 572.390 $758 $139,490 $1,325 589.480 $781Remodeled Commercial $0 $0 - $0 $0 $0 - $0Extended Prop Tax Relief Program (Res Only) $0 $0 - $0 $0 $0 - $0 Class 4 Subtotal $144,472,440 $2,057,781 654.645 $1,347,117 $146,889,205 $2,090,017 675.366 $1,411,526
CLASS 5Rural Electric and Telephone Co-Op $14,382,707 $431,487 588.378 $253,877 $12,419,511 $372,592 604.976 $225,409Qualified New Industrial $0 $0 - $0 $0 $0 - $0Pollution Control $0 $0 - $0 $0 $0 - $0Gasohol Related $0 $0 - $0 $0 $0 - $0Research and Development $0 $0 - $0 $0 $0 - $0Aluminum Electrolytic Equipment $0 $0 - $0 $0 $0 - $0 Class 5 Subtotal $14,382,707 $431,487 588.378 $253,877 $12,419,511 $372,592 604.976 $225,409
CLASS 7Non-Centrally Assessed Public Util. $0 $0 - $0 $0 $0 - $0
CLASS 8Machinery $1,621,491 $24,949 652.960 $16,291 $2,400,450 $81,451 400.882 $32,652Farm Implements $29,640,758 $456,441 557.838 $254,620 $30,533,851 $616,691 623.469 $384,487Furniture and Fixtures $449,927 $6,897 657.389 $4,534 $514,764 -$121,512 694.460 -$84,385Other Business Equipment $834,518 $12,536 575.601 $7,216 $784,045 -$50,037 704.173 -$35,235 Class 8 Subtotal $32,546,694 $500,823 564.392 $282,661 $34,233,110 $526,593 564.990 $297,520
CLASS 9Utilities $1,285,430 $154,251 695.659 $107,306 $1,539,042 $184,687 722.058 $133,355
CLASS 10Timber Land 0 $0 $0 - $0 0 $0 $0 - $0
CLASS 12Railroads $15,257,167 $468,394 585.856 $274,412 $13,494,704 $421,035 604.539 $254,532Airlines $0 $0 - $0 $0 $0 - $0 Class 12 Subtotal $15,257,167 $468,394 $274,412 $13,494,704 $421,035 $254,532
CLASS 13Electrical Generation Property $0 $0 - $0 $0 $0 - $0Telecommunication Property $11,695,586 $701,733 602.094 $422,509 $10,971,355 $658,281 620.947 $408,758Elect Gen/Tele Real Prop New & Exp $0 $0 - $0 $0 $0 - $0 Class 13 Subtotal $11,695,586 $701,733 $422,509 $10,971,355 $658,281 $408,758
CLASS 14Wind Generation $0 $0 - $0 $0 $0 - $0Wind Generation New & Exp $0 $0 - $0 $0 $0 - $0 Class 14 Subtotal $0 $0 $0 $0 $0 $0
CLASS 15Carbon Dioxide and Liquid Pipeline $0 $0 - $0 $0 $0 - $0Carbon Dioxide and Liquid Pipeline (abated) $0 $0 - $0 $0 $0 - $0
Total $375,933,642 $7,705,351 599.024 $4,615,692 $375,729,355 $7,641,041 617.335 $4,717,083
ABATED PROPERTY
Current Values of Abated Property $0 $0 - $0 $0 $0 - $0Values Without the Property Abatement $0 $0 - $0 $0 $0 - $0Difference (Property Value Abated) $0 $0 $0 $0 $0 $0
Daniels County
TY 2018TY 2017
1 NEMONT COMMUNICATIONS INC 2 BNSF RAILWAY CO 1 NEMONT COMMUNICATIONS INC 2 BNSF RAILWAY CO
3 NEMONT TELEPHONE COOPERATIVE INC 4 SAGEBRUSH CELLULAR INC 3 NEMONT TELEPHONE
COOPERATIVE INC 4 PRO CO-OP
5 SHERIDAN ELECTRIC CO OP INC 6 PRO CO-OP 5 SAGEBRUSH CELLULAR INC 6 SHERIDAN ELECTRIC CO OP INC
7 MONTANA DAKOTA UTILITIES - ELECTRIC DISTRIBUTION 8 TADE INC 7 MONTANA DAKOTA UTILITIES -
ELECTRIC DISTRIBUTION 8 TADE INC
9 NORVAL ELECTRIC COOPERATIVE INC 10 A BAR S PROPERTIES LLC 9 A BAR S PROPERTIES LLC 10 MONTANA DAKOTA UTILITIES -
ELECTRIC TRANSMISSION
Top 10 Property Owners by Taxable ValueTY 2017 TY 2018
Page 43
204revenue.mt.gov
Property Taxes Paid by County
Acres Assessed Taxable Avg. Mills Taxes Acres Assessed Taxable Avg. Mills TaxesCLASS 1 Net Proceeds $0 $0 - $0 $0 $0 - $0
CLASS 2 Gross Proceeds $0 $0 - $0 $0 $0 - $0
CLASS 3 Agricultural Land:Tillable Irrigated 19,098 $14,613,157 $315,647 562.993 $177,707 19,147 $14,667,336 $316,817 583.416 $184,836Tillable Non-Irrigated 379,677 $107,357,317 $2,318,896 474.642 $1,100,646 379,604 $107,334,893 $2,318,412 487.931 $1,131,225Grazing 915,512 $38,985,472 $842,076 488.779 $411,589 915,223 $38,971,018 $841,765 505.879 $425,831Wild Hay 11,351 $2,297,064 $49,618 475.006 $23,569 11,350 $2,296,813 $49,613 491.639 $24,392Non-Qualified Ag Land 6,481 $311,944 $47,173 542.516 $25,592 6,700 $322,460 $48,762 556.873 $27,154Eligible Mining Claims 0 $0 $0 - $0 0 $0 $0 - $0 Class 3 Subtotal $163,564,954 $3,573,410 486.679 $1,739,103 $163,592,520 $3,575,369 501.609 $1,793,438
CLASS 4 Land and Improvements:Residential $452,399,147 $6,114,153 700.352 $4,282,059 $451,006,562 $6,088,000 721.838 $4,394,552Residential Low Income $19,676,469 $94,211 718.312 $67,673 $20,072,013 $91,256 738.536 $67,396Mobile Homes $11,122,242 $150,142 617.999 $92,788 $11,152,152 $150,546 597.843 $90,003Mobile Homes Low Income $248,830 $1,290 593.537 $766 $326,630 $1,346 572.488 $771Commercial $159,148,404 $2,621,750 656.416 $1,720,958 $167,469,737 $2,767,235 671.801 $1,859,031Industrial $1,059,710 $20,028 578.662 $11,589 $1,059,710 $20,028 600.800 $12,033New Manufacturing $15,917,670 $300,846 548.234 $164,934 $17,762,332 $335,711 576.244 $193,451Qualified Golf Courses $0 $0 - $0 $0 $0 - $0Remodeled Commercial $130,223 $990 922.491 $913 $130,223 $990 946.544 $937Extended Prop Tax Relief Program (Res Only) $0 $0 - $0 $0 $0 - $0 Class 4 Subtotal $659,702,695 $9,303,410 681.651 $6,341,679 $668,979,359 $9,455,112 699.957 $6,618,174
CLASS 5Rural Electric and Telephone Co-Op $16,301,183 $489,042 567.575 $277,568 $17,760,336 $532,809 583.433 $310,859Qualified New Industrial $0 $0 - $0 $436,170 $0 - $0Pollution Control $0 $0 - $0 $0 $0 - $0Gasohol Related $0 $0 - $0 $0 $0 - $0Research and Development $0 $0 - $0 $0 $0 - $0Aluminum Electrolytic Equipment $0 $0 - $0 $0 $0 - $0 Class 5 Subtotal $16,301,183 $489,042 567.575 $277,568 $18,196,506 $532,809 583.433 $310,859
CLASS 7Non-Centrally Assessed Public Util. $0 $0 - $0 $0 $0 - $0
CLASS 8Machinery $17,698,495 $402,546 598.749 $241,024 $14,593,509 $322,565 594.791 $191,858Farm Implements $25,263,265 $382,749 477.862 $182,901 $24,036,207 $368,421 488.802 $180,085Furniture and Fixtures $4,248,783 $73,812 768.326 $56,712 $4,164,728 $78,172 712.644 $55,709Other Business Equipment $11,448,166 $212,118 612.147 $129,847 $13,357,955 $254,686 621.576 $158,307 Class 8 Subtotal $58,658,709 $1,071,225 569.894 $610,484 $56,152,399 $1,023,844 572.313 $585,959
CLASS 9Utilities $52,725,364 $6,327,047 606.483 $3,837,247 $57,005,265 $6,840,635 630.641 $4,313,982
CLASS 10Timber Land 0 $0 $0 - $0 0 $0 $0 - $0
CLASS 12Railroads $126,722,869 $3,890,393 598.560 $2,328,635 $116,804,964 $3,644,318 627.102 $2,285,359Airlines $519,737 $15,955 614.878 $9,810 $493,811 $15,406 633.710 $9,763 Class 12 Subtotal $127,242,606 $3,906,348 $2,338,445 $117,298,775 $3,659,724 $2,295,122
CLASS 13Electrical Generation Property $13,975,887 $838,554 615.064 $515,765 $14,427,037 $865,621 633.906 $548,722Telecommunication Property $5,984,524 $359,072 670.930 $240,912 $5,775,240 $346,516 702.779 $243,524Elect Gen/Tele Real Prop New & Exp $0 $0 - $0 $0 $0 - $0 Class 13 Subtotal $19,960,411 $1,197,626 $756,677 $20,202,277 $1,212,137 $792,246
CLASS 14Wind Generation $0 $0 - $0 $0 $0 - $0Wind Generation New & Exp $0 $0 - $0 $0 $0 - $0 Class 14 Subtotal $0 $0 $0 $0 $0 $0
CLASS 15Carbon Dioxide and Liquid Pipeline $0 $0 - $0 $0 $0 - $0Carbon Dioxide and Liquid Pipeline (abated) $0 $0 - $0 $0 $0 - $0
Total $1,098,155,922 $25,868,108 614.703 $15,901,204 $1,101,427,101 $26,299,630 635.362 $16,709,780
ABATED PROPERTY
Current Values of Abated Property $130,223 $990 922.491 $913 $130,223 $990 946.544 $937Values Without the Property Abatement $130,223 $2,462 922.491 $2,271 $130,223 $2,461 946.544 $2,330Difference (Property Value Abated) $0 -$1,472 -$1,358 $0 -$1,471 -$1,393
Dawson County
TY 2018TY 2017
1 BNSF RAILWAY CO 2 WBI ENERGY TRANSMISSION INC 1 BNSF RAILWAY CO 2 WBI ENERGY TRANSMISSION INC
3 BRIDGER PIPELINE LLC 4 CENEX PIPELINE LLC 3 BRIDGER PIPELINE LLC 4 CENEX PIPELINE LLC
5 MONTANA DAKOTA UTILITIES - ELECTRIC GENERATION 6 MONTANA DAKOTA UTILITIES -
ELECTRIC DISTRIBUTION 5 MONTANA DAKOTA UTILITIES - ELECTRIC GENERATION 6 MONTANA DAKOTA UTILITIES -
ELECTRIC TRANSMISSION
7 MONTANA DAKOTA UTILITIES - ELECTRIC TRANSMISSION 8 MONTANA DAKOTA UTILITIES - GAS
DISTRIBUTION 7 MONTANA DAKOTA UTILITIES - ELECTRIC DISTRIBUTION 8 MONTANA DAKOTA UTILITIES - GAS
DISTRIBUTION
9 MID RIVERS TELEPHONE COOPERATIVE 10 CHS INC 9 MID RIVERS TELEPHONE
COOPERATIVE 10 CHS INC
Top 10 Property Owners by Taxable ValueTY 2017 TY 2018
Page 44
205revenue.mt.gov
Property Taxes Paid by County
Acres Assessed Taxable Avg. Mills Taxes Acres Assessed Taxable Avg. Mills TaxesCLASS 1 Net Proceeds $0 $0 - $0 $0 $0 - $0
CLASS 2 Gross Proceeds $0 $0 - $0 $0 $0 - $0
CLASS 3 Agricultural Land:Tillable Irrigated 9,384 $6,007,469 $129,755 704.365 $91,395 8,754 $5,628,579 $121,571 704.224 $85,613Tillable Non-Irrigated 0 $0 $0 - $0 0 $0 $0 - $0Grazing 140,284 $6,700,871 $144,767 633.062 $91,646 140,542 $6,760,593 $146,056 631.274 $92,201Wild Hay 1,493 $567,803 $12,263 611.186 $7,495 1,493 $567,803 $12,263 615.909 $7,553Non-Qualified Ag Land 25,562 $1,228,279 $185,709 680.465 $126,369 25,645 $1,233,232 $186,456 658.954 $122,866Eligible Mining Claims 325 $6,650 $146 711.228 $104 334 $7,086 $155 691.604 $107 Class 3 Subtotal $14,511,072 $472,640 670.719 $317,009 $14,197,293 $466,501 660.965 $308,341
CLASS 4 Land and Improvements:Residential $501,760,372 $6,773,005 755.196 $5,114,949 $504,231,124 $6,782,967 731.918 $4,964,574Residential Low Income $36,929,928 $178,010 787.601 $140,201 $40,352,777 $187,373 765.756 $143,482Mobile Homes $5,673,820 $76,593 668.915 $51,234 $5,272,090 $71,168 687.503 $48,928Mobile Homes Low Income $342,320 $1,351 660.906 $893 $747,388 $1,311 694.746 $911Commercial $81,556,913 $1,417,859 783.791 $1,111,305 $80,714,353 $1,405,587 763.925 $1,073,763Industrial $68,016 $1,286 672.585 $865 $68,016 $1,286 648.290 $834New Manufacturing $2,070,170 $39,126 672.585 $26,316 $1,830,740 $34,601 648.290 $22,431Qualified Golf Courses $860,336 $8,174 722.145 $5,903 $860,336 $8,174 695.680 $5,686Remodeled Commercial $0 $0 - $0 $0 $0 - $0Extended Prop Tax Relief Program (Res Only) $0 $0 - $0 $0 $0 - $0 Class 4 Subtotal $629,261,875 $8,495,404 759.430 $6,451,666 $634,076,824 $8,492,467 737.196 $6,260,609
CLASS 5Rural Electric and Telephone Co-Op $1,168,878 $35,066 571.559 $20,042 $789,176 $23,675 578.290 $13,691Qualified New Industrial $0 $0 - $0 $0 $0 - $0Pollution Control $15,190,665 $455,720 682.310 $310,943 $14,621,112 $438,634 655.286 $287,431Gasohol Related $0 $0 - $0 $0 $0 - $0Research and Development $0 $0 - $0 $0 $0 - $0Aluminum Electrolytic Equipment $0 $0 - $0 $0 $0 - $0 Class 5 Subtotal $16,359,543 $490,786 674.397 $330,985 $15,410,288 $462,309 651.343 $301,122
CLASS 7Non-Centrally Assessed Public Util. $0 $0 - $0 $0 $0 - $0
CLASS 8Machinery $10,569,444 $152,755 643.145 $98,244 $11,895,158 $172,340 682.716 $117,659Farm Implements $240,683 $3,610 673.378 $2,431 $231,642 $3,475 648.103 $2,252Furniture and Fixtures $9,426,778 $202,866 670.092 $135,939 $5,090,648 $86,464 753.084 $65,115Other Business Equipment $856,233 $12,927 659.852 $8,530 $768,389 $11,605 691.952 $8,030 Class 8 Subtotal $21,093,138 $372,158 658.708 $245,143 $17,985,837 $273,884 704.883 $193,056
CLASS 9Utilities $40,370,111 $4,844,394 712.062 $3,449,509 $40,676,501 $4,881,178 688.997 $3,363,118
CLASS 10Timber Land 54,036 $12,312,148 $45,560 642.066 $29,253 54,012 $12,307,040 $45,541 630.962 $28,735
CLASS 12Railroads $13,236,434 $406,355 696.758 $283,131 $11,993,473 $374,205 680.828 $254,769Airlines $0 $0 - $0 $0 $0 - $0 Class 12 Subtotal $13,236,434 $406,355 $283,131 $11,993,473 $374,205 $254,769
CLASS 13Electrical Generation Property $87,962,923 $5,277,775 683.275 $3,606,170 $86,304,488 $5,178,269 656.010 $3,396,996Telecommunication Property $5,862,940 $351,780 771.814 $271,509 $5,807,315 $348,441 736.454 $256,611Elect Gen/Tele Real Prop New & Exp $0 $0 - $0 $0 $0 - $0 Class 13 Subtotal $93,825,863 $5,629,555 $3,877,679 $92,111,803 $5,526,710 $3,653,607
CLASS 14Wind Generation $0 $0 - $0 $0 $0 - $0Wind Generation New & Exp $0 $0 - $0 $0 $0 - $0 Class 14 Subtotal $0 $0 $0 $0 $0 $0
CLASS 15Carbon Dioxide and Liquid Pipeline $0 $0 - $0 $0 $0 - $0Carbon Dioxide and Liquid Pipeline (abated) $0 $0 - $0 $0 $0 - $0
Total $840,970,184 $20,756,852 721.900 $14,984,375 $838,759,059 $20,522,795 699.873 $14,363,357
ABATED PROPERTY
Current Values of Abated Property $1,114,194 $8,357 731.585 $6,114 $1,160,625 $8,705 772.960 $6,728Values Without the Property Abatement $1,114,194 $26,203 731.585 $19,170 $1,160,625 $17,409 772.960 $13,457Difference (Property Value Abated) $0 -$17,846 -$13,056 $0 -$8,705 -$6,728
Deer Lodge County
TY 2018TY 2017
1 NORTHWESTERN ENERGY - ELECTRIC GENERATION 2 NORTHWESTERN ENERGY-T & D 1 NORTHWESTERN ENERGY -
ELECTRIC GENERATION 2 NORTHWESTERN ENERGY-T & D
3NORTHWESTERN ENERGY - RATTLESNAKE GAS GATE SUBSTATION
4 ARCO ENVIRONMENTAL REMEDIATION LLC 3
NORTHWESTERN ENERGY - RATTLESNAKE GAS GATE SUBSTATION
4 BNSF RAILWAY CO
5 BNSF RAILWAY CO 6 PACIFICORP - ELECTRIC TRANSMISSION 5 ARCO ENVIRONMENTAL
REMEDIATION LLC 6 PACIFICORP - ELECTRIC TRANSMISSION
7 IDAHO POWER COMPANY 8 CENTURYLINK INC 7 IDAHO POWER COMPANY 8 CHARTER COMMUNICATIONS INC
9 CHARTER COMMUNICATIONS INC 10 RARUS RAILWAY COMPANY 9 VERIZON WIRELESS 10 QWEST CORPORATION AND OR CENTURYLINK INC -
Top 10 Property Owners by Taxable ValueTY 2017 TY 2018
Page 45
206revenue.mt.gov
Property Taxes Paid by County
Acres Assessed Taxable Avg. Mills Taxes Acres Assessed Taxable Avg. Mills TaxesCLASS 1 Net Proceeds $0 $0 - $0 $0 $0 - $0
CLASS 2 Gross Proceeds $0 $0 - $0 $0 $0 - $0
CLASS 3 Agricultural Land:Tillable Irrigated 0 $0 $0 - $0 0 $0 $0 - $0Tillable Non-Irrigated 145,699 $38,803,525 $838,179 289.617 $242,751 145,538 $38,780,465 $837,681 318.528 $266,825Grazing 631,841 $26,885,817 $580,738 288.149 $167,339 632,180 $26,897,408 $580,986 313.634 $182,217Wild Hay 55,874 $11,943,191 $257,976 288.355 $74,389 55,874 $11,943,253 $257,977 314.328 $81,089Non-Qualified Ag Land 3,976 $191,376 $28,933 293.611 $8,495 4,076 $196,180 $29,659 325.949 $9,667Eligible Mining Claims 0 $0 $0 - $0 0 $0 $0 - $0 Class 3 Subtotal $77,823,909 $1,705,826 288.994 $492,974 $77,817,306 $1,706,303 316.356 $539,799
CLASS 4 Land and Improvements:Residential $137,587,371 $1,862,963 422.445 $787,000 $138,529,276 $1,875,657 460.548 $863,831Residential Low Income $1,281,821 $6,119 398.933 $2,441 $1,538,212 $6,597 481.999 $3,180Mobile Homes $9,006,830 $121,593 363.955 $44,254 $9,008,240 $121,609 370.308 $45,033Mobile Homes Low Income $96,760 $294 468.190 $138 $136,670 $402 465.560 $187Commercial $91,483,741 $1,483,939 357.403 $530,364 $95,423,240 $1,553,566 393.311 $611,034Industrial $1,052,217 $19,890 347.606 $6,914 $1,111,573 $21,012 379.770 $7,980New Manufacturing $10,944,170 $206,847 291.171 $60,228 $10,944,170 $206,847 323.717 $66,960Qualified Golf Courses $0 $0 - $0 $0 $0 - $0Remodeled Commercial $0 $0 - $0 $0 $0 - $0Extended Prop Tax Relief Program (Res Only) $0 $0 - $0 $0 $0 - $0 Class 4 Subtotal $251,452,910 $3,701,645 386.677 $1,431,339 $256,691,381 $3,785,690 422.170 $1,598,205
CLASS 5Rural Electric and Telephone Co-Op $9,795,873 $293,881 328.932 $96,667 $10,646,495 $319,398 357.720 $114,255Qualified New Industrial $0 $0 - $0 $0 $0 - $0Pollution Control $0 $0 - $0 $0 $0 - $0Gasohol Related $0 $0 - $0 $0 $0 - $0Research and Development $0 $0 - $0 $0 $0 - $0Aluminum Electrolytic Equipment $0 $0 - $0 $0 $0 - $0 Class 5 Subtotal $9,795,873 $293,881 328.932 $96,667 $10,646,495 $319,398 357.720 $114,255
CLASS 7Non-Centrally Assessed Public Util. $0 $0 - $0 $0 $0 - $0
CLASS 8Machinery $34,605,130 $836,518 284.620 $238,090 $26,270,747 $593,807 302.746 $179,773Farm Implements $11,538,170 $185,325 285.754 $52,957 $10,926,663 $174,271 310.142 $54,049Furniture and Fixtures $1,189,821 $20,072 419.541 $8,421 $1,830,944 $28,913 413.248 $11,948Other Business Equipment $48,319,539 $1,227,530 282.770 $347,109 $39,676,792 $1,019,389 297.466 $303,234 Class 8 Subtotal $95,652,660 $2,269,445 284.905 $646,577 $78,705,146 $1,816,380 302.251 $549,004
CLASS 9Utilities $286,053,377 $34,326,419 290.876 $9,984,748 $284,534,997 $34,144,195 318.623 $10,879,115
CLASS 10Timber Land 122 $13,281 $49 292.000 $14 122 $13,281 $49 326.480 $16
CLASS 12Railroads $26,392,723 $810,254 298.047 $241,493 $23,343,562 $728,319 324.756 $236,526Airlines $0 $0 - $0 $0 $0 - $0 Class 12 Subtotal $26,392,723 $810,254 $241,493 $23,343,562 $728,319 $236,526
CLASS 13Electrical Generation Property $0 $0 - $0 $0 $0 - $0Telecommunication Property $763,694 $45,822 309.977 $14,204 $928,935 $55,737 345.907 $19,280Elect Gen/Tele Real Prop New & Exp $0 $0 - $0 $0 $0 - $0 Class 13 Subtotal $763,694 $45,822 $14,204 $928,935 $55,737 $19,280
CLASS 14Wind Generation $20,405,224 $612,157 292.000 $178,750 $21,046,816 $631,405 326.480 $206,141Wind Generation New & Exp $12,943,290 $271,808 335.286 $91,133 $13,549,169 $325,179 351.730 $114,375 Class 14 Subtotal $33,348,514 $883,965 $269,883 $34,595,985 $956,584 $320,516
CLASS 15Carbon Dioxide and Liquid Pipeline $0 $0 - $0 $0 $0 - $0Carbon Dioxide and Liquid Pipeline (abated) $0 $0 - $0 $0 $0 - $0
Total $781,296,941 $44,037,306 299.244 $13,177,900 $767,277,088 $43,512,655 327.645 $14,256,715
ABATED PROPERTY
Current Values of Abated Property $12,943,290 $271,808 335.286 $91,133 $13,549,169 $325,179 351.730 $114,375Values Without the Property Abatement $12,943,290 $388,299 335.286 $130,191 $13,549,169 $406,475 351.730 $142,970Difference (Property Value Abated) $0 -$116,491 -$39,058 $0 -$81,296 -$28,594
Fallon County
TY 2018TY 2017
1 WBI ENERGY TRANSMISSION INC 2 ONEOK BAKKEN PIPELINE LLC 1 WBI ENERGY TRANSMISSION INC 2 ONEOK BAKKEN PIPELINE LLC
3 BRIDGER PIPELINE LLC 4 BUTTE PIPE LINE CO 3 BRIDGER PIPELINE LLC 4 BUTTE PIPE LINE CO
5 HILAND CRUDE LLC 6 PLAINS PIPELINE LP 5 HILAND CRUDE LLC 6 BISON PIPELINE LLC
7 BISON PIPELINE LLC 8 DENBURY ONSHORE LLC 7 MONTANA DAKOTA UTILITIES - ELECTRIC TRANSMISSION 8 DENBURY ONSHORE LLC
9 MONTANA DAKOTA UTILITIES - ELECTRIC TRANSMISSION 10 MONTANA DAKOTA UTILITIES - WIND
GENERATION 9 MONTANA DAKOTA UTILITIES - WIND GENERATION 10 BNSF RAILWAY CO
Top 10 Property Owners by Taxable ValueTY 2017 TY 2018
Page 46
207revenue.mt.gov
Property Taxes Paid by County
Acres Assessed Taxable Avg. Mills Taxes Acres Assessed Taxable Avg. Mills TaxesCLASS 1 Net Proceeds $0 $0 - $0 $0 $0 - $0
CLASS 2 Gross Proceeds $0 $0 - $0 $0 $0 - $0
CLASS 3 Agricultural Land:Tillable Irrigated 12,084 $8,643,060 $186,688 569.901 $106,394 12,090 $8,646,871 $186,771 567.216 $105,939Tillable Non-Irrigated 375,735 $98,647,312 $2,130,778 516.338 $1,100,202 370,986 $98,260,771 $2,122,430 516.248 $1,095,699Grazing 1,360,262 $69,013,857 $1,490,723 580.655 $865,596 1,363,982 $69,135,686 $1,493,348 588.907 $879,444Wild Hay 160,463 $41,340,554 $892,952 573.608 $512,204 161,540 $41,486,383 $896,101 576.625 $516,714Non-Qualified Ag Land 21,869 $1,052,535 $159,153 608.437 $96,835 21,845 $1,051,403 $158,984 613.473 $97,532Eligible Mining Claims 19 $922 $20 665.243 $13 19 $922 $20 660.270 $13 Class 3 Subtotal $218,698,240 $4,860,314 551.660 $2,681,243 $218,582,036 $4,857,654 554.865 $2,695,343
CLASS 4 Land and Improvements:Residential $533,626,136 $7,218,802 746.570 $5,389,343 $543,847,371 $7,311,321 744.571 $5,443,795Residential Low Income $31,322,102 $138,740 801.184 $111,156 $30,723,725 $137,457 790.511 $108,661Mobile Homes $19,690,110 $265,812 640.069 $170,138 $19,578,610 $264,307 657.215 $173,707Mobile Homes Low Income $1,618,370 $5,926 725.694 $4,300 $2,575,781 $5,671 744.715 $4,223Commercial $328,217,456 $5,165,002 684.418 $3,535,019 $341,813,153 $5,395,105 680.437 $3,671,029Industrial $717,838 $13,569 615.107 $8,346 $659,748 $12,471 616.468 $7,688New Manufacturing $13,383,825 $233,263 590.067 $137,641 $13,095,885 $236,105 601.180 $141,942Qualified Golf Courses $2,280,330 $21,662 684.613 $14,830 $2,280,330 $21,662 680.600 $14,743Remodeled Commercial $599,390 $5,394 873.075 $4,709 $684,270 $8,057 918.500 $7,400Extended Prop Tax Relief Program (Res Only) $0 $0 - $0 $0 $0 - $0 Class 4 Subtotal $931,455,557 $13,068,170 717.429 $9,375,483 $955,258,873 $13,392,156 714.836 $9,573,189
CLASS 5Rural Electric and Telephone Co-Op $34,562,529 $1,036,880 603.014 $625,253 $34,029,683 $1,020,894 607.183 $619,869Qualified New Industrial $0 $0 - $0 $0 $0 - $0Pollution Control $917,336 $27,520 429.589 $11,822 $18,584,797 $32,348 417.295 $13,499Gasohol Related $0 $0 - $0 $0 $0 - $0Research and Development $0 $0 - $0 $0 $0 - $0Aluminum Electrolytic Equipment $0 $0 - $0 $0 $0 - $0 Class 5 Subtotal $35,479,865 $1,064,400 598.530 $637,076 $52,614,480 $1,053,242 601.351 $633,368
CLASS 7Non-Centrally Assessed Public Util. $0 $0 - $0 $0 $0 - $0
CLASS 8Machinery $25,318,117 $387,655 620.345 $240,480 $22,231,920 $339,738 634.339 $215,509Farm Implements $24,531,239 $379,662 528.281 $200,568 $28,422,393 $434,858 542.590 $235,950Furniture and Fixtures $3,871,270 $69,898 786.528 $54,977 $3,650,093 $68,560 813.784 $55,793Other Business Equipment $4,160,940 $62,868 598.843 $37,648 $2,638,170 $39,845 610.120 $24,310 Class 8 Subtotal $57,881,566 $900,083 592.915 $533,673 $56,942,576 $883,001 601.995 $531,562
CLASS 9Utilities $135,269,353 $13,461,274 499.633 $6,725,691 $175,577,394 $15,295,155 503.962 $7,708,177
CLASS 10Timber Land 156,308 $36,984,712 $136,847 604.221 $82,686 156,304 $36,983,159 $136,845 604.345 $82,702
CLASS 12Railroads $12,773,747 $392,153 450.870 $176,810 $11,399,887 $355,676 444.247 $158,008Airlines $0 $0 - $0 $0 $0 - $0 Class 12 Subtotal $12,773,747 $392,153 $176,810 $11,399,887 $355,676 $158,008
CLASS 13Electrical Generation Property $0 $0 - $0 $0 $0 - $0Telecommunication Property $6,298,928 $377,933 676.631 $255,721 $6,073,572 $364,417 665.171 $242,400Elect Gen/Tele Real Prop New & Exp $0 $0 - $0 $0 $0 - $0 Class 13 Subtotal $6,298,928 $377,933 $255,721 $6,073,572 $364,417 $242,400
CLASS 14Wind Generation $0 $0 - $0 $0 $0 - $0Wind Generation New & Exp $0 $0 - $0 $0 $0 - $0 Class 14 Subtotal $0 $0 $0 $0 $0 $0
CLASS 15Carbon Dioxide and Liquid Pipeline $0 $0 - $0 $0 $0 - $0Carbon Dioxide and Liquid Pipeline (abated) $0 $0 - $0 $0 $0 - $0
Total $1,434,841,968 $34,261,174 597.422 $20,468,384 $1,513,431,977 $36,338,146 595.098 $21,624,748
ABATED PROPERTY
Current Values of Abated Property $52,356,688 $2,862,077 529.354 $1,515,052 $97,933,152 $5,789,929 515.548 $2,984,984Values Without the Property Abatement $52,356,688 $5,658,754 529.354 $2,995,485 $97,933,152 $11,580,335 515.548 $5,970,213Difference (Property Value Abated) $0 -$2,796,677 -$1,480,433 $0 -$5,790,406 -$2,985,229
Fergus County
TY 2018TY 2017
1 EXPRESS PIPELINE LLC 2 PHILLIPS 66 CARRIER LLC 1 EXPRESS PIPELINE LLC 2 PHILLIPS 66 CARRIER LLC
3 NORTHWESTERN ENERGY-T & D 4 FERGUS ELECTRIC COOP 3 NORTHWESTERN ENERGY-T & D 4 WILKS RANCH MONTANA LTD
5 FRONT RANGE PIPELINE LLC 6 TRIANGLE TELEPHONE COOPERATIVE ASSOC INC 5 FERGUS ELECTRIC COOP 6 FRONT RANGE PIPELINE LLC
7 BNSF RAILWAY CO 8 WILKS RANCH MONTANA LTD 7 BNSF RAILWAY CO 8 TRIANGLE TELEPHONE COOPERATIVE ASSOC INC
9 VERIZON WIRELESS 10 MID RIVERS TELEPHONE COOPERATIVE 9 VERIZON WIRELESS 10 MID RIVERS TELEPHONE
COOPERATIVE
Top 10 Property Owners by Taxable ValueTY 2017 TY 2018
Page 47
208revenue.mt.gov
Property Taxes Paid by County
Acres Assessed Taxable Avg. Mills Taxes Acres Assessed Taxable Avg. Mills TaxesCLASS 1 Net Proceeds $0 $0 - $0 $0 $0 - $0
CLASS 2 Gross Proceeds $0 $0 - $0 $0 $0 - $0
CLASS 3 Agricultural Land:Tillable Irrigated 19,423 $12,582,144 $271,771 606.332 $164,783 19,014 $12,260,943 $264,834 610.714 $161,738Tillable Non-Irrigated 15,965 $22,871,348 $494,020 573.843 $283,490 15,298 $14,354,349 $310,059 585.891 $181,661Grazing 51,307 $2,503,538 $54,215 576.603 $31,261 50,865 $2,548,406 $55,186 577.437 $31,866Wild Hay 17,347 $4,138,742 $89,405 573.381 $51,263 17,467 $4,284,997 $92,568 574.116 $53,145Non-Qualified Ag Land 58,392 $2,787,594 $421,518 581.313 $245,034 59,020 $2,817,800 $426,083 590.524 $251,612Eligible Mining Claims 0 $0 $0 - $0 0 $0 $0 - $0 Class 3 Subtotal $44,883,366 $1,330,929 582.924 $775,831 $36,266,495 $1,148,730 591.977 $680,022
CLASS 4 Land and Improvements:Residential $12,755,534,607 $173,185,483 613.726 $106,288,394 $12,967,255,398 $175,056,812 631.001 $110,461,089Residential Low Income $298,377,017 $1,433,428 661.645 $948,420 $311,053,052 $1,456,526 673.500 $980,971Mobile Homes $77,176,025 $1,041,907 604.478 $629,810 $80,620,620 $1,088,421 623.962 $679,133Mobile Homes Low Income $6,281,885 $26,549 596.214 $15,829 $19,186,135 $25,663 605.924 $15,550Commercial $2,513,093,961 $44,734,264 695.636 $31,118,751 $2,582,175,144 $45,944,371 708.541 $32,553,458Industrial $20,560,220 $388,587 636.434 $247,310 $20,196,191 $381,707 643.580 $245,659New Manufacturing $81,747,065 $1,498,530 645.049 $966,626 $73,546,304 $1,369,300 665.518 $911,293Qualified Golf Courses $27,679,808 $262,960 611.119 $160,700 $27,678,188 $262,944 628.402 $165,234Remodeled Commercial $0 $0 - $0 $2,060 $0 - $4Extended Prop Tax Relief Program (Res Only) $0 $0 - $0 $0 $0 - $0 Class 4 Subtotal $15,780,450,588 $222,571,708 630.699 $140,375,839 $16,081,713,092 $225,585,744 647.259 $146,012,391
CLASS 5Rural Electric and Telephone Co-Op $177,922,659 $5,337,694 600.301 $3,204,221 $176,828,459 $5,304,869 612.202 $3,247,651Qualified New Industrial $0 $0 - $0 $0 $0 - $0Pollution Control $2,277,333 $68,320 646.112 $44,142 $2,191,291 $65,738 664.731 $43,698Gasohol Related $0 $0 - $0 $0 $0 - $0Research and Development $0 $0 - $0 $0 $0 - $0Aluminum Electrolytic Equipment $0 $0 - $0 $0 $0 - $0 Class 5 Subtotal $180,199,992 $5,406,014 600.880 $3,248,364 $179,019,750 $5,370,607 612.845 $3,291,349
CLASS 7Non-Centrally Assessed Public Util. $0 $0 - $0 $0 $0 - $0
CLASS 8Machinery $187,693,794 $4,035,257 636.161 $2,567,074 $198,375,556 $4,278,581 647.115 $2,768,735Farm Implements $5,172,501 $84,811 567.815 $48,157 $5,298,498 $82,966 585.359 $48,565Furniture and Fixtures $89,714,882 $1,624,094 713.626 $1,158,996 $94,272,846 $1,680,047 753.956 $1,266,681Other Business Equipment $34,294,324 $722,314 635.778 $459,231 $32,818,485 $695,738 651.470 $453,253 Class 8 Subtotal $316,875,501 $6,466,477 654.678 $4,233,458 $330,765,385 $6,737,332 673.447 $4,537,233
CLASS 9Utilities $60,400,185 $7,247,997 702.368 $5,090,760 $65,909,959 $7,909,196 715.295 $5,657,405
CLASS 10Timber Land 481,144 $214,134,869 $792,317 566.117 $448,544 481,018 $214,142,543 $792,348 561.893 $445,215
CLASS 12Railroads $132,576,193 $4,070,086 508.599 $2,070,042 $118,043,052 $3,682,942 523.092 $1,926,518Airlines $13,906,044 $426,915 654.271 $279,318 $18,505,758 $577,380 660.307 $381,248 Class 12 Subtotal $146,482,237 $4,497,001 $2,349,360 $136,548,810 $4,260,322 $2,307,766
CLASS 13Electrical Generation Property $4,420,582 $265,235 511.570 $135,686 $4,866,458 $291,987 514.710 $150,289Telecommunication Property $99,955,533 $5,997,348 679.102 $4,072,810 $91,041,819 $5,462,526 684.051 $3,736,645Elect Gen/Tele Real Prop New & Exp $0 $0 - $0 $13,988 $0 - $0 Class 13 Subtotal $104,376,115 $6,262,583 $4,208,496 $95,922,265 $5,754,513 $3,886,934
CLASS 14Wind Generation $3,101,409 $93,042 529.220 $49,240 $3,225,659 $96,770 566.812 $54,850Wind Generation New & Exp $0 $0 - $0 $0 $0 - $0 Class 14 Subtotal $3,101,409 $93,042 $49,240 $3,225,659 $96,770 $54,850
CLASS 15Carbon Dioxide and Liquid Pipeline $0 $0 - $0 $0 $0 - $0Carbon Dioxide and Liquid Pipeline (abated) $75,343 $1,130 608.350 $687 $71,743 $1,076 626.160 $674
Total $16,850,979,605 $254,669,198 631.331 $160,780,579 $17,143,585,701 $257,656,638 647.660 $166,873,839
ABATED PROPERTY
Current Values of Abated Property $31,925,027 $434,592 686.320 $298,269 $25,625,995 $328,028 730.557 $239,643Values Without the Property Abatement $31,925,027 $704,566 686.320 $483,558 $25,625,995 $575,767 730.557 $420,631Difference (Property Value Abated) $0 -$269,974 -$185,288 $0 -$247,739 -$180,988
Flathead County
TY 2018TY 2017
1 FLATHEAD ELECTRIC COOP INC. 2 NORTHWESTERN ENERGY-T & D 1 FLATHEAD ELECTRIC COOP INC. 2 NORTHWESTERN ENERGY-T & D
3 BNSF RAILWAY CO 4 CENTURYLINK INC 3 BNSF RAILWAY CO 4 FLATHEAD ELECTRIC COOPERATIVE INC - CLASS 9
5 FLATHEAD ELECTRIC COOPERATIVE INC - CLASS 9 6 PLUM CREEK MDF INC 5 WEYERHAEUSER NR COMPANY 6 QWEST CORPORATION AND OR
CENTURYLINK INC -
7 CHARTER COMMUNICATIONS INC 8 VERIZON WIRELESS 7 CHARTER COMMUNICATIONS INC 8 VERIZON WIRELESS
9 PLUM CREEK NORTHWEST PLYWOOD INC 10 TWO BEAR PROPERTIES OF
WHITEFISH LLC 9 SEMITOOL INC 10 TWO BEAR PROPERTIES OF WHITEFISH LLC
Top 10 Property Owners by Taxable ValueTY 2017 TY 2018
Page 48
209revenue.mt.gov
Property Taxes Paid by County
Acres Assessed Taxable Avg. Mills Taxes Acres Assessed Taxable Avg. Mills TaxesCLASS 1 Net Proceeds $283,750 $283,750 479.574 $136,079 $286,997 $286,997 485.600 $139,366
CLASS 2 Gross Proceeds $0 $0 - $0 $0 $0 - $0
CLASS 3 Agricultural Land:Tillable Irrigated 75,550 $58,070,861 $1,254,323 600.786 $753,580 75,968 $58,135,988 $1,255,729 607.625 $763,013Tillable Non-Irrigated 78,251 $34,460,979 $744,369 571.207 $425,189 77,823 $34,291,860 $740,717 578.561 $428,550Grazing 427,529 $21,615,723 $466,965 525.802 $245,531 427,216 $21,598,741 $466,599 535.445 $249,838Wild Hay 17,934 $6,254,616 $135,085 560.811 $75,757 18,056 $6,305,139 $136,181 581.968 $79,253Non-Qualified Ag Land 73,525 $3,538,657 $535,066 555.636 $297,302 72,880 $3,505,242 $530,012 575.141 $304,832Eligible Mining Claims 0 $0 $0 - $0 0 $0 $0 - $0 Class 3 Subtotal $123,940,836 $3,135,808 573.173 $1,797,359 $123,836,970 $3,129,238 583.364 $1,825,486
CLASS 4 Land and Improvements:Residential $12,793,167,500 $173,317,558 590.194 $102,290,911 $13,227,907,376 $178,850,855 620.087 $110,903,040Residential Low Income $121,611,042 $582,465 627.373 $365,423 $130,765,747 $640,835 653.615 $418,859Mobile Homes $62,330,860 $841,487 624.261 $525,308 $62,310,160 $841,021 586.584 $493,329Mobile Homes Low Income $2,486,870 $10,232 628.059 $6,426 $11,751,184 $9,816 593.460 $5,825Commercial $4,119,794,832 $71,705,279 624.579 $44,785,629 $4,242,433,838 $73,819,383 652.862 $48,193,853Industrial $19,369,551 $366,083 595.865 $218,136 $19,148,304 $361,901 619.377 $224,153New Manufacturing $84,604,907 $1,511,872 570.272 $862,178 $98,013,167 $1,789,435 599.689 $1,073,105Qualified Golf Courses $35,956,180 $341,587 529.882 $181,001 $33,772,735 $320,845 571.008 $183,205Remodeled Commercial $0 $0 - $0 $0 $0 - $0Extended Prop Tax Relief Program (Res Only) $0 $0 - $0 $0 $0 - $0 Class 4 Subtotal $17,239,321,742 $248,676,563 600.117 $149,235,012 $17,826,102,511 $256,634,091 629.283 $161,495,370
CLASS 5Rural Electric and Telephone Co-Op $18,669,663 $560,090 464.171 $259,978 $19,083,373 $572,501 469.313 $268,682Qualified New Industrial $0 $0 - $0 $10,693,936 $0 - $0Pollution Control $34,032 $1,021 479.574 $490 $325,314 $1,026 485.600 $498Gasohol Related $0 $0 - $0 $0 $0 - $0Research and Development $0 $0 - $0 $0 $0 - $0Aluminum Electrolytic Equipment $0 $0 - $0 $0 $0 - $0 Class 5 Subtotal $18,703,695 $561,111 464.199 $260,467 $30,102,623 $573,527 469.342 $269,180
CLASS 7Non-Centrally Assessed Public Util. $0 $0 - $0 $0 $0 - $0
CLASS 8Machinery $159,230,750 $3,105,823 606.538 $1,883,800 $161,728,662 $3,270,570 590.160 $1,930,159Farm Implements $18,930,921 $306,874 625.290 $191,885 $17,774,971 $281,974 606.420 $170,994Furniture and Fixtures $78,426,406 $1,296,796 671.739 $871,108 $84,935,983 $1,416,778 629.520 $891,891Other Business Equipment $37,647,887 $628,378 572.427 $359,701 $26,187,608 $473,332 573.208 $271,318 Class 8 Subtotal $294,235,964 $5,337,872 619.441 $3,306,495 $290,627,224 $5,442,653 599.774 $3,264,362
CLASS 9Utilities $204,087,923 $24,490,535 548.616 $13,435,902 $212,456,482 $25,494,770 570.021 $14,532,560
CLASS 10Timber Land 126,640 $29,356,952 $108,708 475.075 $51,644 126,716 $29,380,104 $108,783 499.165 $54,301
CLASS 12Railroads $49,769,051 $1,527,910 519.142 $793,202 $46,522,548 $1,451,502 565.191 $820,376Airlines $42,967,449 $1,319,098 623.687 $822,704 $45,667,498 $1,424,827 632.587 $901,327 Class 12 Subtotal $92,736,500 $2,847,008 $1,615,906 $92,190,046 $2,876,329 $1,721,703
CLASS 13Electrical Generation Property $38,698,166 $2,321,890 477.428 $1,108,536 $38,229,782 $2,293,788 486.512 $1,115,955Telecommunication Property $68,343,078 $4,100,595 607.195 $2,489,862 $64,015,795 $3,840,951 636.602 $2,445,155Elect Gen/Tele Real Prop New & Exp $0 $0 - $0 $504,487 $0 - $0 Class 13 Subtotal $107,041,244 $6,422,485 $3,598,399 $102,750,064 $6,134,739 $3,561,110
CLASS 14Wind Generation $0 $0 - $0 $0 $0 - $0Wind Generation New & Exp $0 $0 - $0 $0 $0 - $0 Class 14 Subtotal $0 $0 $0 $0 $0 $0
CLASS 15Carbon Dioxide and Liquid Pipeline $0 $0 - $0 $0 $0 - $0Carbon Dioxide and Liquid Pipeline (abated) $0 $0 - $0 $0 $0 - $0
Total $18,109,708,606 $291,863,840 594.240 $173,437,264 $18,707,733,021 $300,681,127 621.467 $186,863,439
ABATED PROPERTY
Current Values of Abated Property $14,591,527 $154,051 822.209 $126,662 $12,673,509 $157,721 787.752 $124,245Values Without the Property Abatement $14,591,527 $295,578 822.209 $243,027 $12,673,509 $245,596 787.752 $193,469Difference (Property Value Abated) $0 -$141,527 -$116,364 $0 -$87,875 -$69,224
Gallatin County
TY 2018TY 2017
1 NORTHWESTERN ENERGY-T & D 2 NORTHWESTERN ENERGY - ELECTRIC GENERATION 1 NORTHWESTERN ENERGY-T & D 2 NORTHWESTERN ENERGY -
ELECTRIC GENERATION
3 MONTANA RAIL LINK 4 CENTURYLINK INC 3 MONTANA RAIL LINK 4 VERIZON WIRELESS
5 VERIZON WIRELESS 6 OLDCASTLE MATERIALS CEMENT HOLDINGS INC 5 CHARTER COMMUNICATIONS INC 6 GCC THREE FORKS LLC
7 CHARTER COMMUNICATIONS INC 8 LUZENAC AMERICA INC 7 LUZENAC AMERICA INC 8 CENTURYLINK INC
9 YELLOWSTONE PIPELINE CO 10 D & G INVESTMENTS LLLP 9 YELLOWSTONE PIPELINE CO 10 QWEST CORPORATION AND OR CENTURYLINK INC -
Top 10 Property Owners by Taxable ValueTY 2017 TY 2018
Page 49
210revenue.mt.gov
Property Taxes Paid by County
Acres Assessed Taxable Avg. Mills Taxes Acres Assessed Taxable Avg. Mills TaxesCLASS 1 Net Proceeds $0 $0 - $0 $0 $0 - $0
CLASS 2 Gross Proceeds $0 $0 - $0 $0 $0 - $0
CLASS 3 Agricultural Land:Tillable Irrigated 1,612 $1,036,875 $22,397 483.431 $10,827 1,612 $1,036,875 $22,397 564.974 $12,654Tillable Non-Irrigated 260,332 $76,349,968 $1,649,166 538.711 $888,423 260,333 $76,350,279 $1,649,172 616.886 $1,017,352Grazing 1,827,788 $82,041,329 $1,772,072 525.520 $931,259 1,827,804 $82,041,930 $1,772,085 604.393 $1,071,035Wild Hay 8,682 $1,840,195 $39,750 528.417 $21,005 8,682 $1,840,195 $39,750 601.994 $23,929Non-Qualified Ag Land 4,497 $216,426 $32,723 513.058 $16,789 4,482 $215,697 $32,613 594.191 $19,378Eligible Mining Claims 0 $0 $0 - $0 0 $0 $0 - $0 Class 3 Subtotal $161,484,793 $3,516,108 531.355 $1,868,302 $161,484,976 $3,516,017 609.880 $2,144,348
CLASS 4 Land and Improvements:Residential $37,352,296 $510,481 603.643 $308,148 $38,003,050 $519,246 665.089 $345,345Residential Low Income $609,397 $3,005 682.873 $2,052 $593,210 $3,297 761.627 $2,511Mobile Homes $5,513,730 $74,443 608.142 $45,272 $5,611,100 $75,758 588.012 $44,547Mobile Homes Low Income $107,440 $365 797.090 $291 $107,440 $290 761.520 $221Commercial $46,194,913 $652,957 563.139 $367,706 $47,478,771 $670,799 638.802 $428,508Industrial $19,000 $359 471.300 $169 $19,000 $359 559.220 $201New Manufacturing $0 $0 - $0 $0 $0 - $0Qualified Golf Courses $0 $0 - $0 $0 $0 - $0Remodeled Commercial $0 $0 - $0 $0 $0 - $0Extended Prop Tax Relief Program (Res Only) $0 $0 - $0 $0 $0 - $0 Class 4 Subtotal $89,796,776 $1,241,610 582.822 $723,638 $91,812,571 $1,269,749 646.846 $821,332
CLASS 5Rural Electric and Telephone Co-Op $10,021,413 $300,642 575.098 $172,899 $11,038,592 $331,159 651.160 $215,637Qualified New Industrial $0 $0 - $0 $0 $0 - $0Pollution Control $0 $0 - $0 $0 $0 - $0Gasohol Related $0 $0 - $0 $0 $0 - $0Research and Development $0 $0 - $0 $0 $0 - $0Aluminum Electrolytic Equipment $0 $0 - $0 $0 $0 - $0 Class 5 Subtotal $10,021,413 $300,642 575.098 $172,899 $11,038,592 $331,159 651.160 $215,637
CLASS 7Non-Centrally Assessed Public Util. $0 $0 - $0 $0 $0 - $0
CLASS 8Machinery $2,056,725 $31,053 517.532 $16,071 $1,484,098 $22,503 554.392 $12,476Farm Implements $14,517,088 $238,215 548.050 $130,554 $14,949,491 $242,251 565.268 $136,937Furniture and Fixtures $272,498 $4,180 682.425 $2,853 $364,368 $5,495 720.853 $3,961Other Business Equipment $993,902 $15,026 529.369 $7,954 $739,837 $11,347 546.568 $6,202 Class 8 Subtotal $17,840,213 $288,475 545.739 $157,432 $17,537,794 $281,596 566.682 $159,575
CLASS 9Utilities $0 $0 - $0 $0 $0 - $0
CLASS 10Timber Land 0 $0 $0 - $0 0 $0 $0 - $0
CLASS 12Railroads $0 $0 - $0 $0 $0 - $0Airlines $0 $0 - $0 $0 $0 - $0 Class 12 Subtotal $0 $0 $0 $0 $0 $0
CLASS 13Electrical Generation Property $0 $0 - $0 $0 $0 - $0Telecommunication Property $895,457 $53,724 552.451 $29,680 $1,222,867 $73,372 625.955 $45,928Elect Gen/Tele Real Prop New & Exp $0 $0 - $0 $0 $0 - $0 Class 13 Subtotal $895,457 $53,724 $29,680 $1,222,867 $73,372 $45,928
CLASS 14Wind Generation $0 $0 - $0 $0 $0 - $0Wind Generation New & Exp $0 $0 - $0 $0 $0 - $0 Class 14 Subtotal $0 $0 $0 $0 $0 $0
CLASS 15Carbon Dioxide and Liquid Pipeline $0 $0 - $0 $0 $0 - $0Carbon Dioxide and Liquid Pipeline (abated) $0 $0 - $0 $0 $0 - $0
Total $280,038,652 $5,400,559 546.601 $2,951,951 $283,096,800 $5,471,893 618.949 $3,386,820
ABATED PROPERTY
Current Values of Abated Property $0 $0 - $0 $0 $0 - $0Values Without the Property Abatement $0 $0 - $0 $0 $0 - $0Difference (Property Value Abated) $0 $0 $0 $0 $0 $0
Garfield County
TY 2018TY 2017
1 MCCONE ELECTRIC COOP INC 2 HILLENBRAND JOHN 1 MCCONE ELECTRIC COOP INC 2 HILLENBRAND JOHN
3 MID RIVERS TELEPHONE COOPERATIVE 4 SINGLETON FARMS 3 MID RIVERS TELEPHONE
COOPERATIVE 4 SINGLETON FARMS
5 C E CATTLE CO 6 MURRAY LIGE M & MARY ANN 5 C E CATTLE CO 6 MURRAY LIGE M & MARY ANN
7 L O CATTLE COMPANY 8 CHARANGUS RANCH INC 7 L O CATTLE COMPANY 8 CHARANGUS RANCH INC
9 SINGLETON BROS INC 10 LACOSTA LIVESTOCK CO 9 SINGLETON BROS INC 10 LACOSTA LIVESTOCK CO
Top 10 Property Owners by Taxable ValueTY 2017 TY 2018
Page 50
211revenue.mt.gov
Property Taxes Paid by County
Acres Assessed Taxable Avg. Mills Taxes Acres Assessed Taxable Avg. Mills TaxesCLASS 1 Net Proceeds $0 $0 - $0 $0 $0 - $0
CLASS 2 Gross Proceeds $0 $0 - $0 $0 $0 - $0
CLASS 3 Agricultural Land:Tillable Irrigated 15,394 $9,195,898 $198,638 663.024 $131,702 14,127 $8,433,490 $182,170 665.167 $121,173Tillable Non-Irrigated 348,961 $93,434,750 $2,018,193 673.220 $1,358,688 347,816 $93,191,498 $2,012,938 671.146 $1,350,976Grazing 412,437 $23,755,495 $513,354 729.581 $374,533 412,221 $23,821,659 $514,786 709.744 $365,366Wild Hay 19,530 $6,357,975 $137,346 743.541 $102,122 18,382 $6,454,153 $139,426 719.711 $100,346Non-Qualified Ag Land 29,616 $666,869 $100,845 698.837 $70,474 29,280 $629,959 $95,263 690.747 $65,803Eligible Mining Claims 0 $0 $0 - $0 0 $0 $0 - $0 Class 3 Subtotal $133,410,987 $2,968,376 686.409 $2,037,520 $132,530,759 $2,944,583 680.458 $2,003,665
CLASS 4 Land and Improvements:Residential $200,803,244 $2,712,461 745.101 $2,021,058 $200,569,917 $2,698,187 757.413 $2,043,641Residential Low Income $6,997,983 $28,838 754.854 $21,768 $7,287,461 $28,582 783.967 $22,407Mobile Homes $9,038,839 $122,132 692.727 $84,604 $8,540,248 $115,290 705.596 $81,348Mobile Homes Low Income $152,825 $411 773.335 $318 $319,364 $689 779.921 $537Commercial $185,339,292 $3,043,454 718.833 $2,187,737 $185,289,607 $3,037,777 718.653 $2,183,108Industrial $1,107,691 $20,936 634.720 $13,288 $1,107,691 $20,936 645.294 $13,510New Manufacturing $5,234,477 $98,933 660.903 $65,385 $5,237,567 $98,991 665.706 $65,899Qualified Golf Courses $1,659,377 $15,765 670.380 $10,569 $1,659,377 $15,765 666.196 $10,503Remodeled Commercial $0 $0 - $0 $0 $0 - $0Extended Prop Tax Relief Program (Res Only) $0 $0 - $0 $0 $0 - $0 Class 4 Subtotal $410,333,728 $6,042,930 728.906 $4,404,727 $410,011,232 $6,016,217 734.839 $4,420,954
CLASS 5Rural Electric and Telephone Co-Op $36,054,329 $1,081,631 701.155 $758,391 $36,574,325 $1,097,232 690.659 $757,813Qualified New Industrial $0 $0 - $0 $0 $0 - $0Pollution Control $0 $0 - $0 $0 $0 - $0Gasohol Related $0 $0 - $0 $0 $0 - $0Research and Development $0 $0 - $0 $0 $0 - $0Aluminum Electrolytic Equipment $0 $0 - $0 $0 $0 - $0 Class 5 Subtotal $36,054,329 $1,081,631 701.155 $758,391 $36,574,325 $1,097,232 690.659 $757,813
CLASS 7Non-Centrally Assessed Public Util. $0 $0 - $0 $84,377 $6,750 840.640 $5,674
CLASS 8Machinery $3,322,747 $54,195 677.529 $36,718 $7,044,547 $120,356 667.175 $80,299Farm Implements $15,628,421 $271,475 638.393 $173,308 $14,943,409 $251,627 664.781 $167,277Furniture and Fixtures $6,884,223 $118,302 749.516 $88,670 $8,885,693 $158,280 750.720 $118,824Other Business Equipment $9,349,600 $152,623 663.161 $101,213 $8,800,450 $148,190 686.075 $101,670 Class 8 Subtotal $35,184,991 $596,595 670.320 $399,909 $39,674,099 $678,454 689.906 $468,070
CLASS 9Utilities $91,033,438 $10,924,011 650.876 $7,110,173 $90,100,402 $10,812,047 661.858 $7,156,045
CLASS 10Timber Land 4,481 $1,132,011 $4,195 719.653 $3,019 4,418 $1,132,248 $4,195 701.423 $2,942
CLASS 12Railroads $81,781,569 $2,510,695 693.869 $1,742,093 $72,507,828 $2,262,245 688.340 $1,557,194Airlines $2,583 $79 802.580 $63 $1,394 $43 840.640 $36 Class 12 Subtotal $81,784,152 $2,510,774 $1,742,156 $72,509,222 $2,262,288 $1,557,230
CLASS 13Electrical Generation Property $0 $0 - $0 $0 $0 - $0Telecommunication Property $10,872,343 $652,340 712.055 $464,502 $9,246,315 $554,783 712.623 $395,351Elect Gen/Tele Real Prop New & Exp $0 $0 - $0 $0 $0 - $0 Class 13 Subtotal $10,872,343 $652,340 $464,502 $9,246,315 $554,783 $395,351
CLASS 14Wind Generation $0 $0 - $0 $0 $0 - $0Wind Generation New & Exp $112,719,563 $2,105,200 666.549 $1,403,219 $95,573,627 $1,915,401 664.998 $1,273,738 Class 14 Subtotal $112,719,563 $2,105,200 $1,403,219 $95,573,627 $1,915,401 $1,273,738
CLASS 15Carbon Dioxide and Liquid Pipeline $0 $0 - $0 $0 $0 - $0Carbon Dioxide and Liquid Pipeline (abated) $0 $0 - $0 $0 $0 - $0
Total $912,525,542 $26,886,052 681.529 $18,323,617 $887,436,606 $26,291,950 686.198 $18,041,481
ABATED PROPERTY
Current Values of Abated Property $76,107,980 $1,556,026 678.863 $1,056,328 $59,678,592 $1,376,975 673.521 $927,422Values Without the Property Abatement $76,107,980 $2,283,239 678.863 $1,550,006 $59,678,592 $1,790,358 673.521 $1,205,844Difference (Property Value Abated) $0 -$727,213 -$493,678 $0 -$413,383 -$278,422
Glacier County
TY 2018TY 2017
1 NORTHWESTERN ENERGY-T & D 2 BNSF RAILWAY CO 1 NORTHWESTERN ENERGY-T & D 2 BNSF RAILWAY CO
3 FRONT RANGE PIPELINE LLC 4 PHILLIPS 66 CARRIER LLC 3 FRONT RANGE PIPELINE LLC 4 PHILLIPS 66 CARRIER LLC
5 NATURENER GLACIER WIND ENERGY 2 LLC 6 ROCKY MOUNTAIN PIPELINE
SYSTEM LLC 5 ROCKY MOUNTAIN PIPELINE SYSTEM LLC 6 NATURENER GLACIER WIND
ENERGY 2 LLC
7 GLACIER ELECTRIC COOPERATIVE INC 8 OMIMEX CANADA LTD 7 GLACIER ELECTRIC COOPERATIVE
INC 8 MONTANA ALBERTA TIE LIMITED (M.A.T.L.)
9 MONTANA ALBERTA TIE LIMITED (M.A.T.L.) 10 NATURENER RIM ROCK WIND
ENERGY LLC 9 NATURENER RIM ROCK WIND ENERGY LLC 10 GLACIER PARK INC
Top 10 Property Owners by Taxable ValueTY 2017 TY 2018
Page 51
212revenue.mt.gov
Property Taxes Paid by County
Acres Assessed Taxable Avg. Mills Taxes Acres Assessed Taxable Avg. Mills TaxesCLASS 1 Net Proceeds $0 $0 - $0 $0 $0 - $0
CLASS 2 Gross Proceeds $0 $0 - $0 $0 $0 - $0
CLASS 3 Agricultural Land:Tillable Irrigated 8,584 $6,606,981 $142,707 487.261 $69,536 8,539 $6,522,015 $140,873 468.902 $66,056Tillable Non-Irrigated 102,925 $17,619,783 $380,595 495.380 $188,539 102,910 $17,617,399 $380,545 478.032 $181,913Grazing 519,551 $21,650,342 $467,635 492.051 $230,100 519,578 $21,658,791 $467,817 474.579 $222,016Wild Hay 16,476 $2,984,401 $64,468 483.250 $31,154 16,476 $2,984,401 $64,468 465.283 $29,996Non-Qualified Ag Land 3,234 $155,677 $23,543 502.174 $11,823 3,228 $155,359 $23,496 485.214 $11,401Eligible Mining Claims 0 $0 $0 - $0 0 $0 $0 - $0 Class 3 Subtotal $49,017,184 $1,078,948 492.287 $531,152 $48,937,965 $1,077,199 474.732 $511,381
CLASS 4 Land and Improvements:Residential $20,915,167 $285,381 517.883 $147,794 $21,407,186 $288,001 502.845 $144,820Residential Low Income $1,709,639 $7,201 526.072 $3,788 $2,034,898 $8,030 514.534 $4,132Mobile Homes $1,346,560 $18,178 485.702 $8,829 $1,252,910 $16,912 506.714 $8,570Mobile Homes Low Income $39,900 $108 481.346 $52 $183,991 $726 518.494 $376Commercial $36,213,247 $506,707 491.194 $248,892 $37,179,924 $524,614 472.784 $248,029Industrial $32,875 $621 478.047 $297 $78,497 $1,483 512.909 $761New Manufacturing $569,510 $10,764 490.405 $5,279 $583,580 $10,898 476.812 $5,196Qualified Golf Courses $0 $0 - $0 $0 $0 - $0Remodeled Commercial $0 $0 - $0 $0 $0 - $0Extended Prop Tax Relief Program (Res Only) $0 $0 - $0 $0 $0 - $0 Class 4 Subtotal $60,826,898 $828,960 500.543 $414,930 $62,720,986 $850,664 484.191 $411,884
CLASS 5Rural Electric and Telephone Co-Op $3,208,855 $96,264 489.933 $47,163 $3,511,047 $105,331 470.185 $49,525Qualified New Industrial $0 $0 - $0 $0 $0 - $0Pollution Control $0 $0 - $0 $0 $0 - $0Gasohol Related $0 $0 - $0 $0 $0 - $0Research and Development $0 $0 - $0 $0 $0 - $0Aluminum Electrolytic Equipment $0 $0 - $0 $0 $0 - $0 Class 5 Subtotal $3,208,855 $96,264 489.933 $47,163 $3,511,047 $105,331 470.185 $49,525
CLASS 7Non-Centrally Assessed Public Util. $0 $0 - $0 $0 $0 - $0
CLASS 8Machinery $581,966 $8,909 455.533 $4,058 $5,797,575 $80,089 597.430 $47,848Farm Implements $3,088,697 $50,739 472.582 $23,978 $3,681,389 $61,934 475.729 $29,464Furniture and Fixtures $123,724 $1,935 474.908 $919 $136,138 $2,223 491.003 $1,092Other Business Equipment $201,056 $3,027 452.389 $1,370 $275,821 $4,138 469.599 $1,943 Class 8 Subtotal $3,995,443 $64,610 469.355 $30,325 $9,890,923 $148,385 541.474 $80,346
CLASS 9Utilities $27,307,547 $3,276,904 482.495 $1,581,090 $29,758,293 $3,570,993 466.176 $1,664,710
CLASS 10Timber Land 13,916 $2,512,280 $9,290 505.344 $4,695 13,916 $2,513,268 $9,294 488.530 $4,540
CLASS 12Railroads $24,907,571 $764,663 498.241 $380,987 $22,029,905 $687,332 481.085 $330,665Airlines $1,813 $56 460.776 $26 $1,901 $59 441.730 $26 Class 12 Subtotal $24,909,384 $764,719 $381,013 $22,031,806 $687,391 $330,691
CLASS 13Electrical Generation Property $0 $0 - $0 $0 $0 - $0Telecommunication Property $135,893 $8,154 493.252 $4,022 $156,126 $9,367 489.890 $4,589Elect Gen/Tele Real Prop New & Exp $0 $0 - $0 $0 $0 - $0 Class 13 Subtotal $135,893 $8,154 $4,022 $156,126 $9,367 $4,589
CLASS 14Wind Generation $0 $0 - $0 $0 $0 - $0Wind Generation New & Exp $0 $0 - $0 $0 $0 - $0 Class 14 Subtotal $0 $0 $0 $0 $0 $0
CLASS 15Carbon Dioxide and Liquid Pipeline $0 $0 - $0 $0 $0 - $0Carbon Dioxide and Liquid Pipeline (abated) $0 $0 - $0 $0 $0 - $0
Total $171,913,484 $6,127,849 488.653 $2,994,390 $179,520,414 $6,458,624 473.424 $3,057,666
ABATED PROPERTY
Current Values of Abated Property $0 $0 - $0 $4,291,207 $57,054 651.356 $37,162Values Without the Property Abatement $0 $0 - $0 $4,291,207 $114,105 651.356 $74,323Difference (Property Value Abated) $0 $0 $0 $0 -$57,052 -$37,161
Golden Valley County
TY 2018TY 2017
1 NORTHWESTERN ENERGY-T & D 2 PHILLIPS 66 CARRIER LLC 1 PHILLIPS 66 CARRIER LLC 2 NORTHWESTERN ENERGY-T & D
3 BNSF RAILWAY CO 4 EXPRESS PIPELINE LLC 3 BNSF RAILWAY CO 4 EXPRESS PIPELINE LLC
5 PUGET SOUND ENERGY INC - TRANSMISSION PROPERTY 6 PORTLAND GENERAL ELECTRIC
COMPANY - TRANSMISSION 5 PUGET SOUND ENERGY INC - TRANSMISSION PROPERTY 6 PORTLAND GENERAL ELECTRIC
COMPANY - TRANSMISSION
7 FRONT RANGE PIPELINE LLC 8 GOLDEN VALLEY COLONY INC 7 ROCKY MOUNTAIN PIPELINE SYSTEM LLC 8 GOLDEN VALLEY COLONY INC
9 AVISTA CORPORATION - ELECTRIC TRANSMISSION 10 ROCKY MOUNTAIN PIPELINE
SYSTEM LLC 9 FRONT RANGE PIPELINE LLC 10 AVISTA CORPORATION - ELECTRIC TRANSMISSION
Top 10 Property Owners by Taxable ValueTY 2017 TY 2018
Page 52
213revenue.mt.gov
Property Taxes Paid by County
Acres Assessed Taxable Avg. Mills Taxes Acres Assessed Taxable Avg. Mills TaxesCLASS 1 Net Proceeds $0 $0 - $0 $235,831 $235,831 516.960 $121,915
CLASS 2 Gross Proceeds $33,119 $994 528.094 $525 $625,253 $18,758 516.960 $9,697
CLASS 3 Agricultural Land:Tillable Irrigated 27,870 $17,020,915 $367,659 543.037 $199,653 27,865 $17,012,338 $367,475 544.127 $199,953Tillable Non-Irrigated 0 $0 $0 - $0 0 $0 $0 - $0Grazing 208,399 $8,584,567 $185,448 541.066 $100,340 208,387 $8,639,950 $186,639 540.890 $100,951Wild Hay 1,159 $383,830 $8,295 541.936 $4,495 1,159 $383,830 $8,295 540.422 $4,483Non-Qualified Ag Land 13,318 $638,883 $96,622 545.033 $52,662 13,213 $634,990 $96,034 542.051 $52,055Eligible Mining Claims 356 $17,151 $372 531.508 $198 372 $17,885 $388 523.156 $203 Class 3 Subtotal $26,645,346 $658,396 542.755 $357,347 $26,688,993 $658,831 542.848 $357,645
CLASS 4 Land and Improvements:Residential $392,198,540 $5,301,589 564.037 $2,990,292 $398,348,030 $5,371,547 558.231 $2,998,563Residential Low Income $11,126,699 $50,341 583.063 $29,352 $12,927,929 $55,784 578.724 $32,284Mobile Homes $4,259,860 $57,513 550.354 $31,652 $4,341,000 $58,609 574.012 $33,642Mobile Homes Low Income $221,660 $1,215 581.134 $706 $354,079 $413 587.555 $243Commercial $76,356,155 $1,177,932 579.867 $683,044 $78,414,935 $1,208,956 575.185 $695,374Industrial $403,669 $7,631 528.094 $4,030 $403,669 $7,631 516.960 $3,945New Manufacturing $733,116 $13,290 532.396 $7,076 $732,676 $13,282 521.265 $6,923Qualified Golf Courses $0 $0 - $0 $0 $0 - $0Remodeled Commercial $0 $0 - $0 $0 $0 - $0Extended Prop Tax Relief Program (Res Only) $0 $0 - $0 $0 $0 - $0 Class 4 Subtotal $485,299,699 $6,609,511 566.782 $3,746,152 $495,522,318 $6,716,222 561.472 $3,770,974
CLASS 5Rural Electric and Telephone Co-Op $5,260,015 $157,802 569.375 $89,849 $4,968,219 $149,048 576.783 $85,968Qualified New Industrial $0 $0 - $0 $0 $0 - $0Pollution Control $0 $0 - $0 $0 $0 - $0Gasohol Related $0 $0 - $0 $0 $0 - $0Research and Development $0 $0 - $0 $0 $0 - $0Aluminum Electrolytic Equipment $0 $0 - $0 $0 $0 - $0 Class 5 Subtotal $5,260,015 $157,802 569.375 $89,849 $4,968,219 $149,048 576.783 $85,968
CLASS 7Non-Centrally Assessed Public Util. $0 $0 - $0 $0 $0 - $0
CLASS 8Machinery $9,185,171 $119,258 545.624 $65,070 $8,727,835 $116,789 553.447 $64,637Farm Implements $1,607,647 $24,817 536.625 $13,318 $1,661,105 $26,138 544.219 $14,225Furniture and Fixtures $2,317,042 $35,513 597.638 $21,224 $1,905,252 $29,103 602.179 $17,525Other Business Equipment $1,900,692 $28,577 530.831 $15,170 $1,481,056 $22,251 525.613 $11,696 Class 8 Subtotal $15,010,552 $208,166 551.394 $114,782 $13,775,248 $194,282 556.318 $108,082
CLASS 9Utilities $31,389,985 $3,766,794 570.080 $2,147,374 $31,655,432 $3,798,653 573.439 $2,178,297
CLASS 10Timber Land 120,422 $31,261,227 $115,696 538.321 $62,282 119,647 $31,572,189 $116,844 538.029 $62,865
CLASS 12Railroads $30,982,075 $951,151 568.981 $541,187 $28,980,631 $904,196 574.803 $519,734Airlines $0 $0 - $0 $1,394 $43 662.360 $28 Class 12 Subtotal $30,982,075 $951,151 $541,187 $28,982,025 $904,239 $519,763
CLASS 13Electrical Generation Property $0 $0 - $0 $0 $0 - $0Telecommunication Property $2,600,895 $156,057 553.798 $86,424 $2,943,042 $176,586 564.869 $99,748Elect Gen/Tele Real Prop New & Exp $0 $0 - $0 $0 $0 - $0 Class 13 Subtotal $2,600,895 $156,057 $86,424 $2,943,042 $176,586 $99,748
CLASS 14Wind Generation $0 $0 - $0 $0 $0 - $0Wind Generation New & Exp $0 $0 - $0 $0 $0 - $0 Class 14 Subtotal $0 $0 $0 $0 $0 $0
CLASS 15Carbon Dioxide and Liquid Pipeline $0 $0 - $0 $0 $0 - $0Carbon Dioxide and Liquid Pipeline (abated) $0 $0 - $0 $0 $0 - $0
Total $628,482,913 $12,624,567 566.033 $7,145,921 $636,968,550 $12,969,294 564.021 $7,314,955
ABATED PROPERTY
Current Values of Abated Property $2,698,958 $20,363 629.059 $12,810 $2,099,141 $15,865 617.916 $9,803Values Without the Property Abatement $2,698,958 $63,195 629.059 $39,753 $2,099,141 $31,722 617.916 $19,602Difference (Property Value Abated) $0 -$42,832 -$26,944 $0 -$15,858 -$9,799
Granite County
TY 2018TY 2017
1 NORTHWESTERN ENERGY-T & D 2 MONTANA RAIL LINK 1 NORTHWESTERN ENERGY-T & D 2 MONTANA RAIL LINK
3 PORTLAND GENERAL ELECTRIC COMPANY - TRANSMISSION 4 PACIFICORP - ELECTRIC
TRANSMISSION 3 PORTLAND GENERAL ELECTRIC COMPANY - TRANSMISSION 4 PACIFICORP - ELECTRIC
TRANSMISSION
5 YELLOWSTONE PIPELINE CO 6 PUGET SOUND ENERGY INC - TRANSMISSION PROPERTY 5 YELLOWSTONE PIPELINE CO 6 POTENTATE MINING LLC
7 ROCKING J RANCH LLC 8 BLACKFOOT TELEPHONE COOP INC 7 PUGET SOUND ENERGY INC - TRANSMISSION PROPERTY 8 ROCKING J RANCH LLC
9 AVISTA CORPORATION - ELECTRIC TRANSMISSION 10 VERIZON WIRELESS 9 BLACKFOOT TELEPHONE COOP INC 10 AVISTA CORPORATION - ELECTRIC
TRANSMISSION
Top 10 Property Owners by Taxable ValueTY 2017 TY 2018
Page 53
214revenue.mt.gov
Property Taxes Paid by County
Acres Assessed Taxable Avg. Mills Taxes Acres Assessed Taxable Avg. Mills TaxesCLASS 1 Net Proceeds $0 $0 - $0 $0 $0 - $0
CLASS 2 Gross Proceeds $0 $0 - $0 $0 $0 - $0
CLASS 3 Agricultural Land:Tillable Irrigated 2,498 $2,039,006 $44,048 594.194 $26,173 2,513 $2,048,978 $44,263 589.185 $26,079Tillable Non-Irrigated 1,133,498 $366,091,967 $7,907,564 499.100 $3,946,668 1,132,535 $365,779,517 $7,900,812 492.076 $3,887,798Grazing 385,285 $17,832,681 $385,233 548.936 $211,468 386,204 $17,860,181 $385,826 544.135 $209,941Wild Hay 5,824 $1,475,602 $31,872 577.686 $18,412 5,827 $1,475,921 $31,879 573.482 $18,282Non-Qualified Ag Land 8,067 $388,244 $58,702 550.487 $32,315 8,257 $397,405 $60,088 546.094 $32,814Eligible Mining Claims 0 $0 $0 - $0 0 $0 $0 - $0 Class 3 Subtotal $387,827,500 $8,427,419 502.531 $4,235,036 $387,562,002 $8,422,868 495.664 $4,174,915
CLASS 4 Land and Improvements:Residential $577,751,945 $7,804,022 719.482 $5,614,856 $580,537,048 $7,806,789 715.793 $5,588,046Residential Low Income $23,239,288 $107,053 738.158 $79,022 $23,830,916 $109,898 722.977 $79,454Mobile Homes $13,287,220 $179,380 638.226 $114,485 $12,405,510 $167,478 645.161 $108,050Mobile Homes Low Income $384,408 $1,144 730.102 $835 $913,959 $1,085 702.041 $762Commercial $370,806,123 $5,995,482 655.870 $3,932,259 $370,224,135 $5,973,160 648.679 $3,874,665Industrial $654,437 $12,369 524.618 $6,489 $637,219 $12,043 518.027 $6,239New Manufacturing $31,385,444 $559,574 576.822 $322,775 $31,284,287 $577,151 569.004 $328,401Qualified Golf Courses $1,719,204 $16,333 605.904 $9,896 $1,719,204 $16,333 601.720 $9,828Remodeled Commercial $0 $0 - $0 $0 $0 - $0Extended Prop Tax Relief Program (Res Only) $0 $0 - $0 $0 $0 - $0 Class 4 Subtotal $1,019,228,069 $14,675,357 686.908 $10,080,617 $1,021,552,278 $14,663,937 681.634 $9,995,444
CLASS 5Rural Electric and Telephone Co-Op $47,840,512 $1,435,212 663.945 $952,902 $46,591,716 $1,397,742 672.727 $940,298Qualified New Industrial $0 $0 - $0 $0 $0 - $0Pollution Control $0 $0 - $0 $0 $0 - $0Gasohol Related $0 $0 - $0 $0 $0 - $0Research and Development $0 $0 - $0 $0 $0 - $0Aluminum Electrolytic Equipment $0 $0 - $0 $0 $0 - $0 Class 5 Subtotal $47,840,512 $1,435,212 663.945 $952,902 $46,591,716 $1,397,742 672.727 $940,298
CLASS 7Non-Centrally Assessed Public Util. $0 $0 - $0 $0 $0 - $0
CLASS 8Machinery $10,184,947 $177,675 600.055 $106,615 $11,874,130 $195,298 605.069 $118,169Farm Implements $46,502,225 $742,079 510.775 $379,036 $46,633,586 $745,087 510.156 $380,111Furniture and Fixtures $8,193,554 $146,397 755.452 $110,596 $7,466,351 $135,067 738.225 $99,710Other Business Equipment $5,751,758 $94,475 582.831 $55,063 $4,867,942 $79,803 580.242 $46,305 Class 8 Subtotal $70,632,484 $1,160,627 561.171 $651,310 $70,842,009 $1,155,255 557.708 $644,294
CLASS 9Utilities $64,749,583 $7,769,931 576.010 $4,475,558 $73,741,226 $8,848,946 562.592 $4,978,342
CLASS 10Timber Land 9,389 $2,380,383 $8,816 587.704 $5,181 9,389 $2,366,172 $8,764 583.430 $5,113
CLASS 12Railroads $164,028,717 $5,035,684 545.117 $2,745,038 $150,001,388 $4,680,048 541.607 $2,534,747Airlines $398,516 $12,233 606.266 $7,416 $615,449 $19,202 647.764 $12,438 Class 12 Subtotal $164,427,233 $5,047,917 $2,752,454 $150,616,837 $4,699,250 $2,547,185
CLASS 13Electrical Generation Property $0 $0 - $0 $0 $0 - $0Telecommunication Property $13,048,000 $782,899 668.609 $523,453 $15,924,206 $955,456 692.525 $661,677Elect Gen/Tele Real Prop New & Exp $0 $0 - $0 $0 $0 - $0 Class 13 Subtotal $13,048,000 $782,899 $523,453 $15,924,206 $955,456 $661,677
CLASS 14Wind Generation $0 $0 - $0 $0 $0 - $0Wind Generation New & Exp $0 $0 - $0 $0 $0 - $0 Class 14 Subtotal $0 $0 $0 $0 $0 $0
CLASS 15Carbon Dioxide and Liquid Pipeline $0 $0 - $0 $0 $0 - $0Carbon Dioxide and Liquid Pipeline (abated) $0 $0 - $0 $0 $0 - $0
Total $1,770,133,764 $39,308,178 602.330 $23,676,512 $1,769,196,446 $40,152,218 596.412 $23,947,269
ABATED PROPERTY
Current Values of Abated Property $10,322,611 $160,990 629.713 $101,378 $3,057,550 $43,268 643.188 $27,829Values Without the Property Abatement $10,322,611 $195,358 629.713 $123,020 $3,057,550 $57,603 643.188 $37,049Difference (Property Value Abated) $0 -$34,368 -$21,642 $0 -$14,335 -$9,220
Hill County
TY 2018TY 2017
1 BNSF RAILWAY CO 2 EXPRESS PIPELINE LLC 1 EXPRESS PIPELINE LLC 2 BNSF RAILWAY CO
3 NORTHWESTERN ENERGY-T & D 4 TRIANGLE TELEPHONE COOPERATIVE ASSOC INC 3 NORTHWESTERN ENERGY-T & D 4 TRIANGLE TELEPHONE
COOPERATIVE ASSOC INC
5 HILL COUNTY ELECTRIC COOP INC 6 NORTHWESTERN ENERGY - HAVRE PIPELINE 5 HILL COUNTY ELECTRIC COOP INC 6 TRIANGLE COMMUNICATION
SYSTEM INC
7 CHARTER COMMUNICATIONS INC 8 TRIANGLE COMMUNICATION SYSTEM INC 7 NORTHWESTERN ENERGY - HAVRE
PIPELINE 8 CHARTER COMMUNICATIONS INC
9 COOL SPRING COLONY INC 10 HARVEST STATES COOPERATIVES 9 COOL SPRING COLONY INC 10 HARVEST STATES COOPERATIVES
Top 10 Property Owners by Taxable ValueTY 2017 TY 2018
Page 54
215revenue.mt.gov
Property Taxes Paid by County
Acres Assessed Taxable Avg. Mills Taxes Acres Assessed Taxable Avg. Mills TaxesCLASS 1 Net Proceeds $215,335 $215,335 653.048 $140,624 $209,853 $209,853 658.510 $138,190
CLASS 2 Gross Proceeds $44,017,974 $1,320,539 431.388 $569,664 $52,485,571 $1,574,568 458.146 $721,382
CLASS 3 Agricultural Land:Tillable Irrigated 20,779 $12,452,192 $268,971 515.341 $138,612 20,791 $12,458,982 $269,117 539.298 $145,134Tillable Non-Irrigated 21,224 $7,305,631 $157,809 499.355 $78,803 21,224 $7,305,631 $157,809 509.787 $80,449Grazing 283,732 $10,138,841 $219,086 508.857 $111,483 283,301 $10,125,366 $218,799 529.212 $115,791Wild Hay 1,947 $731,563 $15,802 512.058 $8,092 1,932 $729,498 $15,757 534.587 $8,423Non-Qualified Ag Land 37,266 $1,788,307 $270,401 530.659 $143,491 37,597 $1,808,214 $273,411 547.620 $149,725Eligible Mining Claims 6,638 $258,365 $5,584 530.067 $2,960 6,702 $261,533 $5,655 546.951 $3,093 Class 3 Subtotal $32,674,899 $937,653 515.585 $483,440 $32,689,224 $940,548 534.386 $502,616
CLASS 4 Land and Improvements:Residential $1,048,682,966 $14,159,380 582.071 $8,241,769 $1,078,079,333 $14,460,688 593.093 $8,576,533Residential Low Income $31,429,749 $139,907 557.170 $77,952 $32,415,696 $144,714 566.089 $81,921Mobile Homes $7,655,160 $103,346 524.215 $54,176 $7,528,150 $101,631 547.264 $55,619Mobile Homes Low Income $372,300 $1,673 532.150 $890 $2,207,714 $1,808 535.110 $967Commercial $120,902,754 $1,954,587 573.817 $1,121,575 $124,495,727 $2,016,398 588.395 $1,186,438Industrial $8,332,880 $157,500 569.640 $89,718 $8,213,850 $155,250 581.820 $90,328New Manufacturing $21,694,600 $406,187 572.547 $232,561 $21,747,390 $407,185 583.087 $237,424Qualified Golf Courses $0 $0 - $0 $0 $0 - $0Remodeled Commercial $0 $0 - $0 $0 $0 - $0Extended Prop Tax Relief Program (Res Only) $0 $0 - $0 $0 $0 - $0 Class 4 Subtotal $1,239,070,409 $16,922,580 580.210 $9,818,642 $1,274,687,860 $17,287,674 591.707 $10,229,231
CLASS 5Rural Electric and Telephone Co-Op $3,463,483 $103,907 494.778 $51,411 $3,454,874 $103,647 512.939 $53,165Qualified New Industrial $0 $0 - $0 $652,229 $0 - $0Pollution Control $6,339,844 $190,196 466.277 $88,684 $6,511,611 $189,505 487.371 $92,359Gasohol Related $0 $0 - $0 $0 $0 - $0Research and Development $0 $0 - $0 $0 $0 - $0Aluminum Electrolytic Equipment $0 $0 - $0 $0 $0 - $0 Class 5 Subtotal $9,803,327 $294,103 476.346 $140,095 $10,618,714 $293,152 496.411 $145,524
CLASS 7Non-Centrally Assessed Public Util. $0 $0 - $0 $0 $0 - $0
CLASS 8Machinery $88,657,849 $2,062,831 503.840 $1,039,338 $88,718,784 $2,045,029 525.569 $1,074,804Farm Implements $3,004,578 $45,283 494.586 $22,396 $3,282,895 $51,319 518.073 $26,587Furniture and Fixtures $1,548,496 $30,841 580.799 $17,912 $1,453,568 $28,494 599.862 $17,093Other Business Equipment $7,302,087 $194,200 529.378 $102,805 $5,796,800 $151,167 548.895 $82,975 Class 8 Subtotal $100,513,010 $2,333,155 506.804 $1,182,451 $99,252,047 $2,276,009 527.880 $1,201,459
CLASS 9Utilities $56,949,705 $6,833,977 510.232 $3,486,914 $54,966,340 $6,595,959 527.230 $3,477,588
CLASS 10Timber Land 64,505 $13,214,790 $48,937 529.078 $25,892 64,329 $13,184,032 $48,822 543.461 $26,533
CLASS 12Railroads $23,046,228 $707,518 485.246 $343,320 $21,553,228 $672,461 504.915 $339,536Airlines $3,875 $119 716.868 $85 $1,394 $43 737.090 $32 Class 12 Subtotal $23,050,103 $707,637 $343,406 $21,554,622 $672,504 $339,567
CLASS 13Electrical Generation Property $0 $0 - $0 $0 $0 - $0Telecommunication Property $12,343,768 $740,627 547.256 $405,313 $11,540,414 $692,426 553.561 $383,300Elect Gen/Tele Real Prop New & Exp $0 $0 - $0 $0 $0 - $0 Class 13 Subtotal $12,343,768 $740,627 $405,313 $11,540,414 $692,426 $383,300
CLASS 14Wind Generation $0 $0 - $0 $0 $0 - $0Wind Generation New & Exp $0 $0 - $0 $0 $0 - $0 Class 14 Subtotal $0 $0 $0 $0 $0 $0
CLASS 15Carbon Dioxide and Liquid Pipeline $0 $0 - $0 $0 $0 - $0Carbon Dioxide and Liquid Pipeline (abated) $0 $0 - $0 $0 $0 - $0
Total $1,531,853,320 $30,354,543 546.753 $16,596,440 $1,571,188,677 $30,591,515 561.116 $17,165,390
ABATED PROPERTY
Current Values of Abated Property $12,240,748 $160,090 754.023 $120,711 $11,838,928 $156,504 759.484 $118,862Values Without the Property Abatement $12,240,748 $285,988 754.023 $215,641 $11,838,928 $312,968 759.484 $237,694Difference (Property Value Abated) $0 -$125,898 -$94,930 $0 -$156,464 -$118,832
Jefferson County
TY 2018TY 2017
1 NORTHWESTERN ENERGY-T & D 2 GOLDEN SUNLIGHT MINES 1 NORTHWESTERN ENERGY-T & D 2 GOLDEN SUNLIGHT MINES
3 PORTLAND GENERAL ELECTRIC COMPANY - TRANSMISSION 4 ASH GROVE CEMENT WEST INC 3 PORTLAND GENERAL ELECTRIC
COMPANY - TRANSMISSION 4 ASH GROVE CEMENT WEST INC
5 MONTANA RAIL LINK 6 PACIFICORP - ELECTRIC TRANSMISSION 5 MONTANA RAIL LINK 6 PACIFICORP - ELECTRIC
TRANSMISSION
7 PUGET SOUND ENERGY INC - TRANSMISSION PROPERTY 8 MONTANA TUNNELS MINING INC 7 MONTANA TUNNELS MINING INC 8 AVISTA CORPORATION - ELECTRIC
TRANSMISSION
9 AVISTA CORPORATION - ELECTRIC TRANSMISSION 10 VERIZON WIRELESS 9 VERIZON WIRELESS 10 PUGET SOUND ENERGY INC -
TRANSMISSION PROPERTY
Top 10 Property Owners by Taxable ValueTY 2017 TY 2018
Page 55
216revenue.mt.gov
Property Taxes Paid by County
Acres Assessed Taxable Avg. Mills Taxes Acres Assessed Taxable Avg. Mills TaxesCLASS 1 Net Proceeds $0 $0 - $0 $0 $0 - $0
CLASS 2 Gross Proceeds $0 $0 - $0 $0 $0 - $0
CLASS 3 Agricultural Land:Tillable Irrigated 8,213 $7,466,921 $161,287 438.292 $70,691 8,216 $7,469,486 $161,342 411.173 $66,339Tillable Non-Irrigated 164,779 $54,873,574 $1,185,270 439.681 $521,140 164,422 $54,739,569 $1,182,376 424.196 $501,559Grazing 508,736 $38,826,088 $838,594 430.485 $361,002 508,539 $38,764,408 $837,270 420.211 $351,830Wild Hay 74,924 $22,714,141 $490,618 428.565 $210,262 74,821 $22,651,277 $489,262 417.726 $204,378Non-Qualified Ag Land 4,107 $197,692 $29,889 429.044 $12,824 4,507 $216,894 $32,793 411.566 $13,497Eligible Mining Claims 19 $923 $20 448.610 $9 19 $923 $20 449.790 $9 Class 3 Subtotal $124,079,339 $2,705,678 434.615 $1,175,927 $123,842,557 $2,703,063 420.860 $1,137,612
CLASS 4 Land and Improvements:Residential $78,729,887 $1,071,170 472.711 $506,354 $79,927,284 $1,079,389 459.217 $495,674Residential Low Income $2,046,060 $9,369 487.339 $4,566 $2,107,300 $9,386 473.830 $4,447Mobile Homes $3,551,220 $47,946 421.680 $20,218 $3,697,490 $49,920 448.396 $22,384Mobile Homes Low Income $192,150 $1,101 468.077 $515 $259,798 $204 500.530 $102Commercial $83,122,799 $1,173,715 442.434 $519,292 $86,429,800 $1,230,668 430.394 $529,672Industrial $259,344 $4,901 453.491 $2,223 $259,344 $4,901 440.530 $2,159New Manufacturing $11,215,740 $197,526 448.809 $88,651 $11,215,740 $204,752 410.824 $84,117Qualified Golf Courses $0 $0 - $0 $0 $0 - $0Remodeled Commercial $0 $0 - $0 $0 $0 - $0Extended Prop Tax Relief Program (Res Only) $0 $0 - $0 $0 $0 - $0 Class 4 Subtotal $179,117,200 $2,505,728 455.684 $1,141,819 $183,896,756 $2,579,220 441.434 $1,138,555
CLASS 5Rural Electric and Telephone Co-Op $11,747,049 $352,420 440.842 $155,362 $12,256,622 $367,700 431.721 $158,744Qualified New Industrial $0 $0 - $0 $0 $0 - $0Pollution Control $0 $0 - $0 $0 $0 - $0Gasohol Related $0 $0 - $0 $0 $0 - $0Research and Development $0 $0 - $0 $0 $0 - $0Aluminum Electrolytic Equipment $0 $0 - $0 $0 $0 - $0 Class 5 Subtotal $11,747,049 $352,420 440.842 $155,362 $12,256,622 $367,700 431.721 $158,744
CLASS 7Non-Centrally Assessed Public Util. $0 $0 - $0 $0 $0 - $0
CLASS 8Machinery $1,144,319 $19,167 428.877 $8,220 $2,192,062 $35,860 440.210 $15,786Farm Implements $14,465,835 $244,277 423.448 $103,439 $12,925,420 $213,369 429.633 $91,670Furniture and Fixtures $225,080 $3,804 480.543 $1,828 $262,780 $4,837 473.106 $2,289Other Business Equipment $880,975 $13,504 422.793 $5,709 $324,290 $5,095 441.739 $2,251 Class 8 Subtotal $16,716,209 $280,752 424.560 $119,196 $15,704,552 $259,162 432.146 $111,996
CLASS 9Utilities $63,511,653 $7,621,392 424.713 $3,236,904 $73,495,630 $8,819,479 416.136 $3,670,104
CLASS 10Timber Land 16,028 $3,344,977 $12,382 427.016 $5,287 15,996 $3,348,947 $12,398 424.926 $5,268
CLASS 12Railroads $57,697,899 $1,771,325 428.380 $758,799 $51,065,453 $1,593,240 418.621 $666,964Airlines $0 $0 - $0 $0 $0 - $0 Class 12 Subtotal $57,697,899 $1,771,325 $758,799 $51,065,453 $1,593,240 $666,964
CLASS 13Electrical Generation Property $0 $0 - $0 $0 $0 - $0Telecommunication Property $1,612,100 $96,727 452.880 $43,806 $1,570,562 $94,229 443.122 $41,755Elect Gen/Tele Real Prop New & Exp $0 $0 - $0 $0 $0 - $0 Class 13 Subtotal $1,612,100 $96,727 $43,806 $1,570,562 $94,229 $41,755
CLASS 14Wind Generation $0 $0 - $0 $0 $0 - $0Wind Generation New & Exp $46,337,826 $695,067 504.731 $350,822 $45,027,527 $810,496 474.988 $384,976 Class 14 Subtotal $46,337,826 $695,067 $350,822 $45,027,527 $810,496 $384,976
CLASS 15Carbon Dioxide and Liquid Pipeline $0 $0 - $0 $0 $0 - $0Carbon Dioxide and Liquid Pipeline (abated) $0 $0 - $0 $0 $0 - $0
Total $504,164,252 $16,041,471 435.616 $6,987,923 $510,208,606 $17,238,987 424.385 $7,315,974
ABATED PROPERTY
Current Values of Abated Property $50,140,691 $752,490 501.840 $377,629 $48,830,392 $875,145 470.819 $412,035Values Without the Property Abatement $50,140,691 $1,462,020 501.840 $733,700 $48,830,392 $1,422,700 470.819 $669,834Difference (Property Value Abated) $0 -$709,530 -$356,070 $0 -$547,555 -$257,799
Judith Basin County
TY 2018TY 2017
1 PHILLIPS 66 CARRIER LLC 2 BNSF RAILWAY CO 1 PHILLIPS 66 CARRIER LLC 2 EXPRESS PIPELINE LLC
3 EXPRESS PIPELINE LLC 4 FRONT RANGE PIPELINE LLC 3 BNSF RAILWAY CO 4 NORTHWESTERN ENERGY-T & D
5 NORTHWESTERN ENERGY-T & D 6 NORTHWESTERN ENERGY-SPION KOP WIND GENERATION 5 FRONT RANGE PIPELINE LLC 6 NORTHWESTERN ENERGY-SPION
KOP WIND GENERATION
7 TRIANGLE TELEPHONE COOPERATIVE ASSOC INC 8 ROCKY MOUNTAIN PIPELINE
SYSTEM LLC 7 ROCKY MOUNTAIN PIPELINE SYSTEM LLC 8 TRIANGLE TELEPHONE
COOPERATIVE ASSOC INC
9 UNITED GRAIN CORP 10 BOS TERRA LP 9 UNITED GRAIN CORP 10 FERGUS ELECTRIC COOP
Top 10 Property Owners by Taxable ValueTY 2017 TY 2018
Page 56
217revenue.mt.gov
Property Taxes Paid by County
Acres Assessed Taxable Avg. Mills Taxes Acres Assessed Taxable Avg. Mills TaxesCLASS 1 Net Proceeds $0 $0 - $0 $0 $0 - $0
CLASS 2 Gross Proceeds $0 $0 - $0 $0 $0 - $0
CLASS 3 Agricultural Land:Tillable Irrigated 70,738 $44,594,620 $963,255 630.944 $607,760 70,097 $44,209,914 $954,947 636.020 $607,365Tillable Non-Irrigated 7,173 $3,430,746 $74,092 594.034 $44,013 7,141 $3,379,128 $72,979 592.066 $43,208Grazing 122,862 $4,787,983 $103,644 618.741 $64,129 123,693 $4,849,732 $104,976 613.648 $64,418Wild Hay 7,461 $906,855 $19,610 615.636 $12,073 7,224 $857,992 $18,554 609.455 $11,308Non-Qualified Ag Land 45,941 $2,203,705 $333,220 614.904 $204,898 47,502 $2,278,823 $344,575 620.131 $213,681Eligible Mining Claims 0 $0 $0 - $0 0 $0 $0 - $0 Class 3 Subtotal $55,923,909 $1,493,821 624.488 $932,873 $55,575,589 $1,496,031 628.316 $939,981
CLASS 4 Land and Improvements:Residential $3,483,044,765 $47,223,247 589.468 $27,836,608 $3,513,429,563 $47,403,534 589.161 $27,928,292Residential Low Income $101,079,452 $467,048 634.201 $296,202 $105,354,378 $483,633 636.894 $308,023Mobile Homes $17,069,269 $230,467 605.537 $139,556 $16,969,579 $229,126 592.708 $135,805Mobile Homes Low Income $1,630,220 $5,879 636.784 $3,744 $6,979,804 $7,206 611.731 $4,408Commercial $567,314,708 $9,195,220 655.624 $6,028,611 $570,384,312 $9,218,570 657.141 $6,057,898Industrial $1,700,556 $32,141 671.662 $21,588 $1,364,870 $25,796 680.044 $17,542New Manufacturing $17,370,829 $328,307 663.083 $217,695 $17,038,440 $322,027 682.720 $219,854Qualified Golf Courses $1,192,777 $11,331 669.944 $7,591 $472,500 $4,488 692.070 $3,106Remodeled Commercial $0 $0 - $0 $0 $0 - $0Extended Prop Tax Relief Program (Res Only) $0 $0 - $0 $0 $0 - $0 Class 4 Subtotal $4,190,402,576 $57,493,640 600.964 $34,551,595 $4,231,993,446 $57,694,380 601.011 $34,674,928
CLASS 5Rural Electric and Telephone Co-Op $15,413,194 $462,399 557.040 $257,575 $14,584,523 $437,539 562.043 $245,916Qualified New Industrial $0 $0 - $0 $0 $0 - $0Pollution Control $0 $0 - $0 $0 $0 - $0Gasohol Related $0 $0 - $0 $0 $0 - $0Research and Development $0 $0 - $0 $0 $0 - $0Aluminum Electrolytic Equipment $0 $0 - $0 $0 $0 - $0 Class 5 Subtotal $15,413,194 $462,399 557.040 $257,575 $14,584,523 $437,539 562.043 $245,916
CLASS 7Non-Centrally Assessed Public Util. $0 $0 - $0 $0 $0 - $0
CLASS 8Machinery $17,110,346 $319,649 646.080 $206,519 $16,472,121 $307,142 637.237 $195,722Farm Implements $3,374,449 $50,652 635.209 $32,174 $3,886,366 $61,128 640.010 $39,122Furniture and Fixtures $12,284,614 $232,812 706.256 $164,424 $12,151,892 $222,895 705.724 $157,302Other Business Equipment $1,703,195 $27,055 664.437 $17,976 $1,811,923 $26,837 684.107 $18,360 Class 8 Subtotal $34,472,604 $630,167 668.226 $421,094 $34,322,302 $618,002 664.248 $410,507
CLASS 9Utilities $4,529,054 $543,484 617.523 $335,614 $5,154,721 $618,567 616.857 $381,567
CLASS 10Timber Land 62,936 $33,930,581 $125,546 516.888 $64,893 62,886 $34,012,527 $125,847 521.235 $65,596
CLASS 12Railroads $21,657,496 $664,885 639.270 $425,041 $20,264,809 $632,261 644.669 $407,599Airlines $3,875 $119 716.994 $85 $7,478 $233 706.970 $165 Class 12 Subtotal $21,661,371 $665,004 $425,126 $20,272,287 $632,494 $407,764
CLASS 13Electrical Generation Property $0 $0 - $0 $0 $0 - $0Telecommunication Property $32,166,206 $1,929,977 647.074 $1,248,837 $26,423,379 $1,585,397 649.884 $1,030,324Elect Gen/Tele Real Prop New & Exp $0 $0 - $0 $0 $0 - $0 Class 13 Subtotal $32,166,206 $1,929,977 $1,248,837 $26,423,379 $1,585,397 $1,030,324
CLASS 14Wind Generation $0 $0 - $0 $0 $0 - $0Wind Generation New & Exp $0 $0 - $0 $0 $0 - $0 Class 14 Subtotal $0 $0 $0 $0 $0 $0
CLASS 15Carbon Dioxide and Liquid Pipeline $0 $0 - $0 $0 $0 - $0Carbon Dioxide and Liquid Pipeline (abated) $0 $0 - $0 $0 $0 - $0
Total $4,388,499,495 $63,344,038 603.650 $38,237,608 $4,422,338,774 $63,208,257 603.665 $38,156,582
ABATED PROPERTY
Current Values of Abated Property $0 $0 - $0 $0 $0 - $0Values Without the Property Abatement $0 $0 - $0 $0 $0 - $0Difference (Property Value Abated) $0 $0 $0 $0 $0 $0
Lake County
TY 2018TY 2017
1 MONTANA RAIL LINK 2 RONAN TELEPHONE CO & SUBSIDIARY (MONTANA WEST LLC) 1 MONTANA RAIL LINK 2 NORTHWESTERN ENERGY-T & D
3 CENTURYLINK INC 4 NORTHWESTERN ENERGY-T & D 3 RONAN TELEPHONE CO & SUBSIDIARY (MONTANA WEST LLC) 4 SECOND STEP ASSET
MANAGEMENT, CO
5 SECOND STEP ASSET MANAGEMENT, CO 6 LEE ROBERT M TRUSTEE 5 QWEST CORPORATION AND OR
CENTURYLINK INC - 6 LEE ROBERT M TRUSTEE
7 WAL-MART STORES INC 8 CHARTER COMMUNICATIONS INC 7 CHARTER COMMUNICATIONS INC 8 WAL-MART STORES INC
9 VERIZON WIRELESS 10 FLATHEAD ELECTRIC COOP INC. 9 VERIZON WIRELESS 10 FLATHEAD ELECTRIC COOP INC.
Top 10 Property Owners by Taxable ValueTY 2017 TY 2018
Page 57
218revenue.mt.gov
Property Taxes Paid by County
Acres Assessed Taxable Avg. Mills Taxes Acres Assessed Taxable Avg. Mills TaxesCLASS 1 Net Proceeds $0 $0 - $0 $0 $0 - $0
CLASS 2 Gross Proceeds $0 $0 - $0 $0 $0 - $0
CLASS 3 Agricultural Land:Tillable Irrigated 34,182 $22,391,586 $483,659 595.709 $288,120 34,180 $22,395,869 $483,751 667.054 $322,688Tillable Non-Irrigated 24,212 $7,592,415 $163,996 593.402 $97,316 23,836 $7,489,239 $161,765 636.532 $102,969Grazing 584,209 $29,583,638 $639,067 535.690 $342,342 588,198 $29,864,201 $645,159 603.256 $389,196Wild Hay 9,996 $2,600,074 $56,158 526.574 $29,571 9,996 $2,600,031 $56,157 594.290 $33,374Non-Qualified Ag Land 61,054 $2,935,983 $443,945 594.973 $264,135 61,284 $2,947,074 $445,624 674.876 $300,741Eligible Mining Claims 45 $2,153 $46 659.978 $30 45 $2,153 $46 769.567 $35 Class 3 Subtotal $65,105,849 $1,786,871 571.678 $1,021,515 $65,298,567 $1,792,502 641.005 $1,149,002
CLASS 4 Land and Improvements:Residential $5,028,400,044 $67,877,575 699.563 $47,484,646 $5,132,364,553 $68,865,243 786.334 $54,151,054Residential Low Income $125,825,045 $620,354 702.200 $435,613 $127,451,729 $617,439 782.923 $483,407Mobile Homes $51,095,895 $689,204 659.080 $454,240 $51,453,615 $694,543 653.672 $454,003Mobile Homes Low Income $4,062,970 $17,499 663.628 $11,613 $16,163,447 $17,061 684.946 $11,686Commercial $1,689,877,227 $29,368,374 754.657 $22,163,043 $1,754,045,797 $30,392,230 850.154 $25,838,075Industrial $8,482,260 $160,315 722.375 $115,807 $8,588,183 $162,316 809.209 $131,348New Manufacturing $35,393,070 $558,746 784.433 $438,299 $45,063,470 $755,461 870.993 $658,001Qualified Golf Courses $8,159,848 $77,519 649.880 $50,378 $8,159,848 $77,519 761.617 $59,040Remodeled Commercial $0 $0 - $0 $78,509 $887 948.807 $842Extended Prop Tax Relief Program (Res Only) $0 $0 - $0 $0 $0 - $0 Class 4 Subtotal $6,951,296,359 $99,369,586 716.050 $71,153,639 $7,143,369,151 $101,582,699 805.132 $81,787,454
CLASS 5Rural Electric and Telephone Co-Op $8,531,101 $255,931 593.617 $151,925 $8,633,338 $258,997 657.830 $170,376Qualified New Industrial $0 $0 - $0 $0 $0 - $0Pollution Control $367,670 $11,030 844.205 $9,312 $367,670 $11,030 867.220 $9,565Gasohol Related $0 $0 - $0 $0 $0 - $0Research and Development $0 $0 - $0 $0 $0 - $0Aluminum Electrolytic Equipment $0 $0 - $0 $0 $0 - $0 Class 5 Subtotal $8,898,771 $266,961 603.970 $161,236 $9,001,008 $270,027 666.384 $179,942
CLASS 7Non-Centrally Assessed Public Util. $0 $0 - $0 $0 $0 - $0
CLASS 8Machinery $116,472,061 $2,617,099 732.040 $1,915,821 $122,436,867 $2,711,280 778.383 $2,110,414Farm Implements $3,466,530 $54,289 551.576 $29,945 $3,714,072 $59,972 566.077 $33,949Furniture and Fixtures $54,405,045 $959,638 745.986 $715,876 $52,295,737 $926,172 781.363 $723,676Other Business Equipment $17,714,792 $399,217 733.940 $293,001 $12,220,706 $285,974 759.542 $217,209 Class 8 Subtotal $192,058,428 $4,030,243 733.118 $2,954,643 $190,667,382 $3,983,397 774.527 $3,085,248
CLASS 9Utilities $141,357,176 $16,962,855 705.308 $11,964,041 $144,250,375 $17,310,038 794.616 $13,754,838
CLASS 10Timber Land 216,649 $55,466,439 $205,241 517.799 $106,274 219,406 $56,159,024 $207,804 589.471 $122,494
CLASS 12Railroads $60,574,420 $1,859,632 601.992 $1,119,484 $55,079,653 $1,718,482 687.006 $1,180,608Airlines $5,491,436 $168,587 778.065 $131,172 $6,337,549 $197,732 879.840 $173,973 Class 12 Subtotal $66,065,856 $2,028,219 $1,250,656 $61,417,202 $1,916,214 $1,354,581
CLASS 13Electrical Generation Property $47,698,311 $2,861,900 603.506 $1,727,174 $46,272,360 $2,776,341 692.270 $1,921,977Telecommunication Property $100,346,285 $6,020,795 743.785 $4,478,179 $96,505,462 $5,790,330 839.951 $4,863,594Elect Gen/Tele Real Prop New & Exp $0 $0 - $0 $0 $0 - $0 Class 13 Subtotal $148,044,596 $8,882,695 $6,205,353 $142,777,822 $8,566,671 $6,785,571
CLASS 14Wind Generation $0 $0 - $0 $0 $0 - $0Wind Generation New & Exp $0 $0 - $0 $0 $0 - $0 Class 14 Subtotal $0 $0 $0 $0 $0 $0
CLASS 15Carbon Dioxide and Liquid Pipeline $0 $0 - $0 $0 $0 - $0Carbon Dioxide and Liquid Pipeline (abated) $0 $0 - $0 $0 $0 - $0
Total $7,628,293,474 $133,532,671 710.069 $94,817,357 $7,812,940,531 $135,629,352 797.903 $108,219,130
ABATED PROPERTY
Current Values of Abated Property $28,968,055 $319,781 869.679 $278,106 $37,305,456 $464,688 891.106 $414,087Values Without the Property Abatement $28,968,055 $627,168 869.679 $545,435 $37,305,456 $857,632 891.106 $764,241Difference (Property Value Abated) $0 -$307,387 -$267,328 $0 -$392,944 -$350,155
Lewis and Clark County
TY 2018TY 2017
1 NORTHWESTERN ENERGY-T & D 2 VERIZON WIRELESS 1 NORTHWESTERN ENERGY-T & D 2 VERIZON WIRELESS
3 NORTHWESTERN ENERGY - ELECTRIC GENERATION 4 THE BOEING COMPANY 3 NORTHWESTERN ENERGY -
ELECTRIC GENERATION 4 THE BOEING COMPANY
5 CENTURYLINK INC 6 BNSF RAILWAY CO 5 BNSF RAILWAY CO 6 YELLOWSTONE PIPELINE CO
7 CHARTER COMMUNICATIONS INC 8 YELLOWSTONE PIPELINE CO 7 CHARTER COMMUNICATIONS INC 8 CENTURYLINK INC
9 MONTANA RAIL LINK 10 HEALTH CARE SERVICE CORPORATION 9 MONTANA RAIL LINK 10 HEALTH CARE SERVICE
CORPORATION
Top 10 Property Owners by Taxable ValueTY 2017 TY 2018
Page 58
219revenue.mt.gov
Property Taxes Paid by County
Acres Assessed Taxable Avg. Mills Taxes Acres Assessed Taxable Avg. Mills TaxesCLASS 1 Net Proceeds $0 $0 - $0 $0 $0 - $0
CLASS 2 Gross Proceeds $0 $0 - $0 $0 $0 - $0
CLASS 3 Agricultural Land:Tillable Irrigated 8,256 $5,398,009 $116,595 499.525 $58,242 8,256 $5,398,009 $116,595 516.357 $60,205Tillable Non-Irrigated 564,696 $176,982,743 $3,822,826 498.395 $1,905,275 564,684 $176,978,777 $3,822,741 516.425 $1,974,158Grazing 217,354 $11,462,728 $247,616 499.192 $123,608 217,349 $11,462,458 $247,608 515.917 $127,745Wild Hay 6,284 $1,893,982 $40,913 499.214 $20,424 6,284 $1,893,982 $40,913 515.796 $21,103Non-Qualified Ag Land 1,067 $51,330 $7,759 498.043 $3,864 1,067 $51,330 $7,759 516.077 $4,004Eligible Mining Claims 0 $0 $0 - $0 0 $0 $0 - $0 Class 3 Subtotal $195,788,792 $4,235,709 498.480 $2,111,414 $195,784,556 $4,235,616 516.386 $2,187,215
CLASS 4 Land and Improvements:Residential $51,602,843 $701,484 575.199 $403,493 $52,188,343 $702,923 596.131 $419,034Residential Low Income $1,500,735 $6,381 566.994 $3,618 $1,708,252 $7,774 595.669 $4,631Mobile Homes $2,087,550 $28,179 514.965 $14,511 $1,962,160 $26,487 529.885 $14,035Mobile Homes Low Income $0 $0 - $0 $26,222 $0 - $0Commercial $83,200,895 $1,193,449 516.528 $616,450 $85,485,539 $1,224,075 533.517 $653,065Industrial $374,808 $7,082 511.581 $3,623 $374,808 $7,082 528.671 $3,744New Manufacturing $32,075,226 $606,223 501.450 $303,991 $34,751,463 $656,803 523.480 $343,823Qualified Golf Courses $0 $0 - $0 $0 $0 - $0Remodeled Commercial $0 $0 - $0 $0 $0 - $0Extended Prop Tax Relief Program (Res Only) $0 $0 - $0 $0 $0 - $0 Class 4 Subtotal $170,842,057 $2,542,798 529.215 $1,345,686 $176,496,787 $2,625,144 547.906 $1,438,332
CLASS 5Rural Electric and Telephone Co-Op $13,861,317 $415,836 509.885 $212,029 $12,924,191 $387,721 529.560 $205,321Qualified New Industrial $0 $0 - $0 $0 $0 - $0Pollution Control $0 $0 - $0 $0 $0 - $0Gasohol Related $0 $0 - $0 $0 $0 - $0Research and Development $0 $0 - $0 $0 $0 - $0Aluminum Electrolytic Equipment $0 $0 - $0 $0 $0 - $0 Class 5 Subtotal $13,861,317 $415,836 509.885 $212,029 $12,924,191 $387,721 529.560 $205,321
CLASS 7Non-Centrally Assessed Public Util. $0 $0 - $0 $0 $0 - $0
CLASS 8Machinery $2,591,959 $40,984 506.815 $20,772 $3,010,821 $46,225 520.087 $24,041Farm Implements $25,749,369 $418,500 496.679 $207,860 $27,620,691 $446,816 513.852 $229,597Furniture and Fixtures $497,711 $7,615 527.382 $4,016 $593,121 $9,028 531.766 $4,801Other Business Equipment $5,237,375 $80,962 492.774 $39,896 $4,612,952 $71,077 508.909 $36,172 Class 8 Subtotal $34,076,414 $548,062 497.287 $272,544 $35,837,585 $573,145 514.024 $294,610
CLASS 9Utilities $5,614,732 $673,764 516.887 $348,260 $5,355,931 $642,709 536.080 $344,543
CLASS 10Timber Land 727 $160,026 $592 499.594 $296 727 $160,026 $592 515.705 $305
CLASS 12Railroads $32,043,929 $983,747 500.949 $492,807 $28,372,169 $885,211 519.274 $459,667Airlines $0 $0 - $0 $0 $0 - $0 Class 12 Subtotal $32,043,929 $983,747 $492,807 $28,372,169 $885,211 $459,667
CLASS 13Electrical Generation Property $1,324,249 $79,455 491.250 $39,032 $1,193,744 $71,625 506.491 $36,277Telecommunication Property $2,189,986 $131,397 510.512 $67,080 $2,506,740 $150,407 532.857 $80,145Elect Gen/Tele Real Prop New & Exp $0 $0 - $0 $0 $0 - $0 Class 13 Subtotal $3,514,235 $210,852 $106,112 $3,700,484 $222,032 $116,423
CLASS 14Wind Generation $0 $0 - $0 $0 $0 - $0Wind Generation New & Exp $0 $0 - $0 $0 $0 - $0 Class 14 Subtotal $0 $0 $0 $0 $0 $0
CLASS 15Carbon Dioxide and Liquid Pipeline $0 $0 - $0 $0 $0 - $0Carbon Dioxide and Liquid Pipeline (abated) $0 $0 - $0 $0 $0 - $0
Total $455,901,502 $9,611,360 508.684 $4,889,148 $458,631,729 $9,572,170 527.197 $5,046,417
ABATED PROPERTY
Current Values of Abated Property $0 $0 - $0 $0 $0 - $0Values Without the Property Abatement $0 $0 - $0 $0 $0 - $0Difference (Property Value Abated) $0 $0 $0 $0 $0 $0
Liberty County
TY 2018TY 2017
1 BNSF RAILWAY CO 2 NORTHWESTERN ENERGY-T & D 1 BNSF RAILWAY CO 2 NORTHWESTERN ENERGY-T & D
3 TRIANGLE TELEPHONE COOPERATIVE ASSOC INC 4 EGT LLC 3 TRIANGLE TELEPHONE
COOPERATIVE ASSOC INC 4 EGT LLC
5 GAVILON GRAIN LLC 6 EAGLE CREEK COLONY 5 GAVILON GRAIN LLC 6 EAGLE CREEK COLONY
7 RIVERVIEW COLONY 8 SAGE CREEK COLONY 7 RIVERVIEW COLONY 8 SAGE CREEK COLONY
9 COLUMBIA GRAIN INC 10 TIBER MONTANA LLC 9 COLUMBIA GRAIN INC 10 WANKEN FARMS
Top 10 Property Owners by Taxable ValueTY 2017 TY 2018
Page 59
220revenue.mt.gov
Property Taxes Paid by County
Acres Assessed Taxable Avg. Mills Taxes Acres Assessed Taxable Avg. Mills TaxesCLASS 1 Net Proceeds $0 $0 - $0 $0 $0 - $0
CLASS 2 Gross Proceeds $0 $0 - $0 $0 $0 - $0
CLASS 3 Agricultural Land:Tillable Irrigated 2,441 $2,109,018 $45,554 492.067 $22,416 2,444 $2,114,476 $45,672 478.602 $21,859Tillable Non-Irrigated 70 $26,518 $573 486.079 $279 69 $26,461 $572 474.506 $271Grazing 27,423 $686,092 $14,965 518.693 $7,762 27,581 $687,598 $14,994 517.215 $7,755Wild Hay 1,865 $153,807 $3,322 534.048 $1,774 1,871 $154,151 $3,330 535.786 $1,784Non-Qualified Ag Land 24,368 $1,172,856 $177,335 514.208 $91,187 24,191 $1,164,290 $176,035 508.161 $89,454Eligible Mining Claims 0 $0 $0 - $0 0 $0 $0 - $0 Class 3 Subtotal $4,148,291 $241,749 510.519 $123,418 $4,146,976 $240,603 503.417 $121,124
CLASS 4 Land and Improvements:Residential $1,650,457,965 $22,292,105 548.605 $12,229,553 $1,684,992,475 $22,530,003 544.636 $12,270,653Residential Low Income $141,027,183 $598,082 578.113 $345,759 $150,634,205 $635,874 579.025 $368,187Mobile Homes $18,008,640 $243,124 565.303 $137,439 $17,521,410 $236,546 570.661 $134,988Mobile Homes Low Income $2,483,290 $8,555 590.568 $5,052 $8,819,078 $10,158 587.788 $5,971Commercial $187,977,565 $3,330,749 612.011 $2,038,454 $190,141,200 $3,374,181 610.921 $2,061,357Industrial $3,148,298 $59,504 585.374 $34,832 $3,148,298 $59,504 598.505 $35,613New Manufacturing $10,871,810 $201,321 565.265 $113,800 $8,416,540 $154,916 574.813 $89,048Qualified Golf Courses $16,050,988 $152,485 518.940 $79,131 $16,050,988 $152,485 506.506 $77,235Remodeled Commercial $0 $0 - $0 $0 $0 - $0Extended Prop Tax Relief Program (Res Only) $0 $0 - $0 $0 $0 - $0 Class 4 Subtotal $2,030,025,739 $26,885,925 557.318 $14,984,019 $2,079,724,194 $27,153,667 553.997 $15,043,051
CLASS 5Rural Electric and Telephone Co-Op $69,219,473 $2,076,584 527.835 $1,096,093 $68,058,837 $2,041,765 528.574 $1,079,224Qualified New Industrial $0 $0 - $0 $0 $0 - $0Pollution Control $108,856 $3,266 599.501 $1,958 $3,808 $114 619.697 $71Gasohol Related $0 $0 - $0 $0 $0 - $0Research and Development $0 $0 - $0 $0 $0 - $0Aluminum Electrolytic Equipment $0 $0 - $0 $0 $0 - $0 Class 5 Subtotal $69,328,329 $2,079,850 527.947 $1,098,051 $68,062,645 $2,041,879 528.579 $1,079,295
CLASS 7Non-Centrally Assessed Public Util. $0 $0 - $0 $0 $0 - $0
CLASS 8Machinery $15,340,245 $233,834 561.416 $131,278 $13,553,361 $206,994 570.510 $118,092Farm Implements $523,646 $7,977 470.019 $3,749 $544,122 $8,162 481.596 $3,931Furniture and Fixtures $4,499,845 $74,541 631.121 $47,045 $3,982,373 $65,962 639.199 $42,163Other Business Equipment $1,902,417 $28,836 596.688 $17,206 $1,542,793 $23,300 604.790 $14,092 Class 8 Subtotal $22,266,153 $345,189 577.303 $199,278 $19,622,649 $304,418 585.634 $178,277
CLASS 9Utilities $0 $0 - $0 $0 $0 - $0
CLASS 10Timber Land 416,334 $274,231,166 $1,014,647 532.309 $540,106 415,889 $273,943,956 $1,013,591 531.558 $538,782
CLASS 12Railroads $132,793,657 $4,076,767 525.581 $2,142,672 $117,657,837 $3,670,921 521.236 $1,913,417Airlines $0 $0 - $0 $0 $0 - $0 Class 12 Subtotal $132,793,657 $4,076,767 $2,142,672 $117,657,837 $3,670,921 $1,913,417
CLASS 13Electrical Generation Property $0 $0 - $0 $0 $0 - $0Telecommunication Property $12,385,045 $743,110 622.977 $462,941 $9,728,588 $583,714 626.190 $365,516Elect Gen/Tele Real Prop New & Exp $0 $0 - $0 $0 $0 - $0 Class 13 Subtotal $12,385,045 $743,110 $462,941 $9,728,588 $583,714 $365,516
CLASS 14Wind Generation $0 $0 - $0 $0 $0 - $0Wind Generation New & Exp $0 $0 - $0 $0 $0 - $0 Class 14 Subtotal $0 $0 $0 $0 $0 $0
CLASS 15Carbon Dioxide and Liquid Pipeline $0 $0 - $0 $0 $0 - $0Carbon Dioxide and Liquid Pipeline (abated) $0 $0 - $0 $0 $0 - $0
Total $2,545,178,380 $35,387,237 552.473 $19,550,484 $2,572,886,845 $35,008,793 549.561 $19,239,463
ABATED PROPERTY
Current Values of Abated Property $442,240 $4,201 692.661 $2,910 $442,240 $4,201 693.897 $2,915Values Without the Property Abatement $442,240 $8,360 692.661 $5,790 $442,240 $8,358 693.897 $5,800Difference (Property Value Abated) $0 -$4,159 -$2,881 $0 -$4,157 -$2,885
Lincoln County
TY 2018TY 2017
1 BNSF RAILWAY CO 2 INTERBEL TELEPHONE COOPERATIVE INC 1 BNSF RAILWAY CO 2 INTERBEL TELEPHONE
COOPERATIVE INC
3 FLATHEAD ELECTRIC COOP INC. 4 LINCOLN ELECTRIC COOPERATIVE INC 3 FLATHEAD ELECTRIC COOP INC. 4 WEYERHAEUSER CO
5 WEYERHAEUSER CO 6 FRONTIER COMMUNICATIONS 5 LINCOLN ELECTRIC COOPERATIVE INC 6 FRONTIER COMMUNICATIONS
7 NORTHERN LIGHTS INC 8 TROY MINE INC 7 NORTHERN LIGHTS INC 8 STIMSON LUMBER CO
9 STIMSON LUMBER CO 10 VERIZON WIRELESS 9 WILDERNESS PRESERVE US LP 10 VERIZON WIRELESS
Top 10 Property Owners by Taxable ValueTY 2017 TY 2018
Page 60
221revenue.mt.gov
Property Taxes Paid by County
Acres Assessed Taxable Avg. Mills Taxes Acres Assessed Taxable Avg. Mills TaxesCLASS 1 Net Proceeds $2,837,849 $2,837,849 376.483 $1,068,401 $3,368,590 $3,368,590 353.376 $1,190,378
CLASS 2 Gross Proceeds $40,996 $1,230 446.125 $549 $43,462 $1,304 285.190 $372
CLASS 3 Agricultural Land:Tillable Irrigated 88,094 $56,666,743 $1,224,009 467.449 $572,162 88,161 $56,710,999 $1,224,965 457.098 $559,929Tillable Non-Irrigated 12,580 $4,161,892 $89,899 481.173 $43,257 12,581 $4,160,877 $89,877 476.947 $42,867Grazing 803,665 $36,110,024 $780,063 413.988 $322,937 802,609 $36,086,026 $779,549 400.627 $312,309Wild Hay 1,972 $483,134 $10,437 427.813 $4,465 1,972 $483,134 $10,437 415.348 $4,335Non-Qualified Ag Land 56,683 $2,669,635 $403,719 371.379 $149,933 57,118 $2,691,738 $407,067 360.890 $146,907Eligible Mining Claims 4,868 $213,258 $4,599 488.114 $2,245 4,770 $208,526 $4,495 482.048 $2,167 Class 3 Subtotal $100,304,686 $2,512,726 435.781 $1,094,999 $100,341,300 $2,516,390 424.621 $1,068,513
CLASS 4 Land and Improvements:Residential $5,748,213,352 $86,833,478 276.337 $23,995,276 $5,962,481,593 $90,118,340 279.386 $25,177,841Residential Low Income $31,103,295 $142,708 460.111 $65,662 $31,591,532 $149,266 439.717 $65,635Mobile Homes $6,695,790 $90,395 476.567 $43,079 $6,707,940 $90,558 467.930 $42,375Mobile Homes Low Income $194,670 $769 542.746 $417 $791,460 $892 490.821 $438Commercial $566,411,276 $9,523,372 336.723 $3,206,742 $552,353,939 $9,292,947 345.516 $3,210,860Industrial $2,156,965 $40,768 422.339 $17,218 $2,011,219 $38,013 406.725 $15,461New Manufacturing $9,087,920 $161,618 359.772 $58,146 $8,492,510 $150,365 345.102 $51,891Qualified Golf Courses $48,036,037 $456,340 252.961 $115,436 $48,597,018 $461,669 276.016 $127,428Remodeled Commercial $0 $0 - $0 $0 $0 - $0Extended Prop Tax Relief Program (Res Only) $0 $0 - $0 $0 $0 - $0 Class 4 Subtotal $6,411,899,305 $97,249,448 282.798 $27,501,976 $6,613,027,211 $100,302,050 286.055 $28,691,928
CLASS 5Rural Electric and Telephone Co-Op $17,899,890 $537,000 440.151 $236,361 $18,780,716 $563,430 426.712 $240,422Qualified New Industrial $0 $0 - $0 $0 $0 - $0Pollution Control $0 $0 - $0 $0 $0 - $0Gasohol Related $0 $0 - $0 $0 $0 - $0Research and Development $0 $0 - $0 $0 $0 - $0Aluminum Electrolytic Equipment $0 $0 - $0 $0 $0 - $0 Class 5 Subtotal $17,899,890 $537,000 440.151 $236,361 $18,780,716 $563,430 426.712 $240,422
CLASS 7Non-Centrally Assessed Public Util. $0 $0 - $0 $0 $0 - $0
CLASS 8Machinery $33,232,030 $652,757 373.397 $243,738 $31,948,137 $633,249 376.078 $238,151Farm Implements $10,121,366 $156,631 475.616 $74,496 $12,690,764 $195,970 455.974 $89,357Furniture and Fixtures $14,432,621 $308,971 282.783 $87,372 $12,754,858 $304,633 266.956 $81,324Other Business Equipment $25,493,967 $610,521 295.728 $180,548 $38,908,818 $980,450 264.389 $259,221 Class 8 Subtotal $83,279,984 $1,728,880 339.037 $586,154 $96,302,577 $2,114,303 315.968 $668,053
CLASS 9Utilities $30,061,190 $3,607,327 429.875 $1,550,699 $34,251,840 $4,110,207 406.857 $1,672,268
CLASS 10Timber Land 78,548 $17,090,624 $63,258 354.188 $22,405 79,147 $17,176,949 $63,568 350.571 $22,285
CLASS 12Railroads $21,912,730 $672,721 525.403 $353,450 $20,465,111 $638,513 510.497 $325,959Airlines $2,583 $79 420.955 $33 $1,394 $43 421.680 $18 Class 12 Subtotal $21,915,313 $672,800 $353,483 $20,466,505 $638,556 $325,977
CLASS 13Electrical Generation Property $31,880,176 $1,912,810 318.417 $609,071 $30,967,571 $1,858,054 313.266 $582,065Telecommunication Property $4,490,241 $269,414 319.843 $86,170 $5,087,121 $305,225 323.759 $98,819Elect Gen/Tele Real Prop New & Exp $0 $0 - $0 $0 $0 - $0 Class 13 Subtotal $36,370,417 $2,182,224 $695,241 $36,054,692 $2,163,279 $680,885
CLASS 14Wind Generation $0 $0 - $0 $0 $0 - $0Wind Generation New & Exp $0 $0 - $0 $0 $0 - $0 Class 14 Subtotal $0 $0 $0 $0 $0 $0
CLASS 15Carbon Dioxide and Liquid Pipeline $0 $0 - $0 $0 $0 - $0Carbon Dioxide and Liquid Pipeline (abated) $0 $0 - $0 $0 $0 - $0
Total $6,721,700,254 $111,392,742 297.239 $33,110,267 $6,939,813,842 $115,841,677 298.348 $34,561,080
ABATED PROPERTY
Current Values of Abated Property $3,970,592 $35,041 560.460 $19,639 $3,777,698 $34,853 540.722 $18,846Values Without the Property Abatement $3,970,592 $88,399 560.460 $49,544 $3,777,698 $69,596 540.722 $37,632Difference (Property Value Abated) $0 -$53,357 -$29,905 $0 -$34,744 -$18,787
Madison County
TY 2018TY 2017
1 NORTHWESTERN ENERGY-T & D 2 NORTHWESTERN ENERGY - ELECTRIC GENERATION 1 NORTHWESTERN ENERGY-T & D 2 LUZENAC AMERICA INC
3 YELLOWSTONE DEVELOPMENT LLC 4 LUZENAC AMERICA INC 3 NORTHWESTERN ENERGY - ELECTRIC GENERATION 4 YELLOWSTONE DEVELOPMENT LLC
5 YELLOWSTONE MTN CLUB LLC & 6 BARRETTS MINERALS INC 5 YELLOWSTONE MTN CLUB LLC & 6 BARRETTS MINERALS INC
7 BIG SKY RESORT LLC 8 CIP GC OWNER LLC 7 BIG SKY RESORT LLC 8 MB MT ACQUISITION LLC
9 MONTANA RAIL LINK 10 188 FOXTAIL PINE LLC 9 MONTANA RAIL LINK 10 188 FOXTAIL PINE LLC
Top 10 Property Owners by Taxable ValueTY 2017 TY 2018
Page 61
222revenue.mt.gov
Property Taxes Paid by County
Acres Assessed Taxable Avg. Mills Taxes Acres Assessed Taxable Avg. Mills TaxesCLASS 1 Net Proceeds $0 $0 - $0 $0 $0 - $0
CLASS 2 Gross Proceeds $0 $0 - $0 $0 $0 - $0
CLASS 3 Agricultural Land:Tillable Irrigated 9,468 $9,394,656 $202,920 595.488 $120,837 9,468 $9,414,701 $203,353 607.333 $123,503Tillable Non-Irrigated 496,834 $139,555,137 $3,014,376 603.381 $1,818,818 496,280 $139,362,734 $3,010,220 618.766 $1,862,622Grazing 820,616 $36,573,746 $789,995 616.650 $487,151 821,265 $36,601,791 $790,602 638.097 $504,481Wild Hay 5,851 $1,278,207 $27,610 623.384 $17,212 5,851 $1,278,207 $27,610 647.847 $17,887Non-Qualified Ag Land 2,143 $103,140 $15,592 604.523 $9,426 2,274 $109,446 $16,544 621.653 $10,285Eligible Mining Claims 0 $0 $0 - $0 0 $0 $0 - $0 Class 3 Subtotal $186,904,886 $4,050,493 605.714 $2,453,442 $186,766,879 $4,048,329 622.177 $2,518,777
CLASS 4 Land and Improvements:Residential $47,905,334 $655,419 773.996 $507,292 $48,527,502 $659,845 806.018 $531,847Residential Low Income $1,444,617 $7,973 812.503 $6,478 $1,418,437 $8,130 853.798 $6,941Mobile Homes $5,123,490 $69,166 600.547 $41,537 $5,424,590 $73,230 640.441 $46,899Mobile Homes Low Income $110,890 $512 762.744 $391 $132,750 $300 745.377 $224Commercial $72,192,441 $1,030,712 647.775 $667,669 $73,452,955 $1,048,843 668.187 $700,823Industrial $110,242 $2,084 840.854 $1,752 $110,242 $2,084 882.756 $1,840New Manufacturing $2,247,873 $39,250 893.077 $35,053 $2,247,872 $42,484 929.790 $39,501Qualified Golf Courses $0 $0 - $0 $0 $0 - $0Remodeled Commercial $0 $0 - $0 $0 $0 - $0Extended Prop Tax Relief Program (Res Only) $0 $0 - $0 $0 $0 - $0 Class 4 Subtotal $129,134,887 $1,805,116 698.112 $1,260,173 $131,314,348 $1,834,916 723.780 $1,328,075
CLASS 5Rural Electric and Telephone Co-Op $16,410,978 $492,328 695.848 $342,585 $17,165,914 $514,976 721.540 $371,576Qualified New Industrial $0 $0 - $0 $0 $0 - $0Pollution Control $0 $0 - $0 $0 $0 - $0Gasohol Related $0 $0 - $0 $0 $0 - $0Research and Development $0 $0 - $0 $0 $0 - $0Aluminum Electrolytic Equipment $0 $0 - $0 $0 $0 - $0 Class 5 Subtotal $16,410,978 $492,328 695.848 $342,585 $17,165,914 $514,976 721.540 $371,576
CLASS 7Non-Centrally Assessed Public Util. $0 $0 - $0 $0 $0 - $0
CLASS 8Machinery $2,766,890 $64,317 827.769 $53,239 $2,495,543 $59,857 860.478 $51,506Farm Implements $27,767,695 $425,803 585.934 $249,493 $26,791,905 $411,848 614.322 $253,007Furniture and Fixtures $370,676 $6,073 838.059 $5,090 $314,960 $5,033 894.021 $4,499Other Business Equipment $2,555,684 $40,619 605.410 $24,591 $990,485 $14,887 650.650 $9,686 Class 8 Subtotal $33,460,945 $536,813 619.235 $332,413 $30,592,893 $491,625 648.256 $318,699
CLASS 9Utilities $1,647,538 $197,704 573.994 $113,481 $1,723,581 $206,830 576.225 $119,181
CLASS 10Timber Land 0 $0 $0 - $0 0 $0 $0 - $0
CLASS 12Railroads $9,609,902 $295,025 652.113 $192,390 $8,526,923 $266,041 680.301 $180,988Airlines $0 $0 - $0 $0 $0 - $0 Class 12 Subtotal $9,609,902 $295,025 $192,390 $8,526,923 $266,041 $180,988
CLASS 13Electrical Generation Property $0 $0 - $0 $0 $0 - $0Telecommunication Property $3,143,559 $188,613 855.021 $161,268 $2,493,132 $149,589 847.368 $126,757Elect Gen/Tele Real Prop New & Exp $0 $0 - $0 $0 $0 - $0 Class 13 Subtotal $3,143,559 $188,613 $161,268 $2,493,132 $149,589 $126,757
CLASS 14Wind Generation $0 $0 - $0 $0 $0 - $0Wind Generation New & Exp $0 $0 - $0 $0 $0 - $0 Class 14 Subtotal $0 $0 $0 $0 $0 $0
CLASS 15Carbon Dioxide and Liquid Pipeline $0 $0 - $0 $0 $0 - $0Carbon Dioxide and Liquid Pipeline (abated) $0 $0 - $0 $0 $0 - $0
Total $380,312,695 $7,566,092 641.778 $4,855,752 $378,583,670 $7,512,306 660.789 $4,964,052
ABATED PROPERTY
Current Values of Abated Property $1,698,550 $33,401 899.657 $30,050 $0 $0 - $0Values Without the Property Abatement $1,698,550 $34,724 899.657 $31,240 $0 $0 - $0Difference (Property Value Abated) $0 -$1,323 -$1,190 $0 $0 $0
McCone County
TY 2018TY 2017
1 BNSF RAILWAY CO 2 MCCONE ELECTRIC COOP INC 1 BNSF RAILWAY CO 2 MCCONE ELECTRIC COOP INC
3 MID RIVERS TELEPHONE COOPERATIVE 4 WBI ENERGY TRANSMISSION INC 3 MID RIVERS TELEPHONE
COOPERATIVE 4 WBI ENERGY TRANSMISSION INC
5 CABLE & CELLULAR COMMUNICATIONS CORP 6 PRAIRIE ELK HUTTERIAN
BRETHEREN INC 5 CABLE & CELLULAR COMMUNICATIONS CORP 6 PRAIRIE ELK HUTTERIAN
BRETHEREN INC
7 CENEX HARVEST STATES CO OP 8 GREAT NORTHERN PROPERTIES LP 7 CENEX HARVEST STATES CO OP 8 GREAT NORTHERN PROPERTIES LP
9 GACKLE MYRON L & PAULINE 10 PAWLOWSKI BROS INC 9 GF HOLDING LLP 10 EISSINGER LAND & CATTLE CO
Top 10 Property Owners by Taxable ValueTY 2017 TY 2018
Page 62
223revenue.mt.gov
Property Taxes Paid by County
Acres Assessed Taxable Avg. Mills Taxes Acres Assessed Taxable Avg. Mills TaxesCLASS 1 Net Proceeds $0 $0 - $0 $0 $0 - $0
CLASS 2 Gross Proceeds $170,609 $5,118 570.677 $2,921 $130,447 $3,913 563.830 $2,206
CLASS 3 Agricultural Land:Tillable Irrigated 42,945 $25,749,378 $556,187 570.172 $317,122 42,961 $25,758,891 $556,392 563.317 $313,425Tillable Non-Irrigated 24,203 $6,192,648 $133,764 570.623 $76,329 24,203 $6,192,648 $133,764 563.776 $75,413Grazing 682,182 $37,509,486 $810,251 570.079 $461,907 682,192 $37,497,643 $809,995 563.223 $456,208Wild Hay 9,707 $3,166,625 $68,402 570.134 $38,998 9,678 $3,149,509 $68,032 563.276 $38,321Non-Qualified Ag Land 7,874 $378,959 $57,291 570.473 $32,683 7,851 $377,862 $57,124 563.623 $32,196Eligible Mining Claims 0 $0 $0 - $0 0 $0 $0 - $0 Class 3 Subtotal $72,997,096 $1,625,895 570.172 $927,039 $72,976,553 $1,625,307 563.317 $915,563
CLASS 4 Land and Improvements:Residential $125,999,091 $1,706,585 638.134 $1,089,030 $126,792,462 $1,701,766 632.142 $1,075,757Residential Low Income $3,765,543 $16,627 665.112 $11,059 $4,648,836 $20,149 653.502 $13,167Mobile Homes $2,153,090 $29,070 654.685 $19,032 $2,645,840 $35,722 663.871 $23,715Mobile Homes Low Income $92,380 $249 675.197 $168 $251,250 $249 688.276 $171Commercial $80,907,535 $1,159,589 611.307 $708,865 $80,875,459 $1,163,070 605.861 $704,658Industrial $93,401 $1,765 570.677 $1,007 $93,401 $1,765 563.830 $995New Manufacturing $0 $0 - $0 $0 $0 - $0Qualified Golf Courses $0 $0 - $0 $0 $0 - $0Remodeled Commercial $0 $0 - $0 $0 $0 - $0Extended Prop Tax Relief Program (Res Only) $0 $0 - $0 $0 $0 - $0 Class 4 Subtotal $213,011,040 $2,913,885 627.740 $1,829,161 $215,307,248 $2,922,721 622.182 $1,818,464
CLASS 5Rural Electric and Telephone Co-Op $11,440,015 $343,200 607.467 $208,483 $11,438,693 $343,160 599.851 $205,845Qualified New Industrial $0 $0 - $0 $0 $0 - $0Pollution Control $0 $0 - $0 $0 $0 - $0Gasohol Related $0 $0 - $0 $0 $0 - $0Research and Development $0 $0 - $0 $0 $0 - $0Aluminum Electrolytic Equipment $0 $0 - $0 $0 $0 - $0 Class 5 Subtotal $11,440,015 $343,200 607.467 $208,483 $11,438,693 $343,160 599.851 $205,845
CLASS 7Non-Centrally Assessed Public Util. $0 $0 - $0 $0 $0 - $0
CLASS 8Machinery $1,186,024 $19,674 619.224 $12,183 $1,036,539 $17,035 616.867 $10,508Farm Implements $6,268,734 $94,571 567.221 $53,643 $5,292,220 $79,930 570.407 $45,593Furniture and Fixtures $379,595 $6,715 654.244 $4,393 $412,627 $7,486 681.469 $5,101Other Business Equipment $343,421 $5,187 572.872 $2,971 $253,633 $3,825 577.916 $2,210 Class 8 Subtotal $8,177,774 $126,147 580.196 $73,190 $6,995,019 $108,276 585.660 $63,413
CLASS 9Utilities $25,526,259 $3,063,145 574.909 $1,761,029 $24,725,664 $2,967,079 568.618 $1,687,136
CLASS 10Timber Land 177,132 $40,033,781 $148,122 570.314 $84,476 177,134 $40,030,963 $148,112 563.462 $83,455
CLASS 12Railroads $0 $0 - $0 $0 $0 - $0Airlines $1,292 $40 570.677 $23 $1,394 $43 563.830 $24 Class 12 Subtotal $1,292 $40 $23 $1,394 $43 $24
CLASS 13Electrical Generation Property $0 $0 - $0 $0 $0 - $0Telecommunication Property $1,796,735 $107,802 620.381 $66,878 $1,072,683 $64,360 667.218 $42,942Elect Gen/Tele Real Prop New & Exp $0 $0 - $0 $0 $0 - $0 Class 13 Subtotal $1,796,735 $107,802 $66,878 $1,072,683 $64,360 $42,942
CLASS 14Wind Generation $0 $0 - $0 $0 $0 - $0Wind Generation New & Exp $12,719,102 $228,944 638.010 $146,069 $12,336,361 $259,064 607.115 $157,282 Class 14 Subtotal $12,719,102 $228,944 $146,069 $12,336,361 $259,064 $157,282
CLASS 15Carbon Dioxide and Liquid Pipeline $0 $0 - $0 $0 $0 - $0Carbon Dioxide and Liquid Pipeline (abated) $0 $0 - $0 $0 $0 - $0
Total $385,873,703 $8,562,298 595.549 $5,099,269 $385,015,025 $8,442,035 589.470 $4,976,330
ABATED PROPERTY
Current Values of Abated Property $12,719,102 $228,944 638.010 $146,069 $12,336,361 $259,064 607.115 $157,282Values Without the Property Abatement $12,719,102 $381,573 638.010 $243,447 $12,336,361 $370,091 607.115 $224,688Difference (Property Value Abated) $0 -$152,629 -$97,379 $0 -$111,027 -$67,406
Meagher County
TY 2018TY 2017
1 NORTHWESTERN ENERGY-T & D 2 PUGET SOUND ENERGY INC - TRANSMISSION PROPERTY 1 NORTHWESTERN ENERGY-T & D 2 PUGET SOUND ENERGY INC -
TRANSMISSION PROPERTY
3 PORTLAND GENERAL ELECTRIC COMPANY - TRANSMISSION 4 TRIANGLE TELEPHONE
COOPERATIVE ASSOC INC 3 PORTLAND GENERAL ELECTRIC COMPANY - TRANSMISSION 4 TRIANGLE TELEPHONE
COOPERATIVE ASSOC INC
5 AVISTA CORPORATION - ELECTRIC TRANSMISSION 6 GORDON BUTTE WIND LLC 5 AVISTA CORPORATION - ELECTRIC
TRANSMISSION 6 GORDON BUTTE WIND LLC
7 PACIFICORP - ELECTRIC TRANSMISSION 8 GALT RANCH LP 7 PACIFICORP - ELECTRIC
TRANSMISSION 8 GALT RANCH LP
9 CATLIN RANCH LP 10 SPRINGDALE COLONY 9 CATLIN RANCH LP 10 CASTLE MOUNTAIN RANCH INC
Top 10 Property Owners by Taxable ValueTY 2017 TY 2018
Page 63
224revenue.mt.gov
Property Taxes Paid by County
Acres Assessed Taxable Avg. Mills Taxes Acres Assessed Taxable Avg. Mills TaxesCLASS 1 Net Proceeds $0 $0 - $0 $0 $0 - $0
CLASS 2 Gross Proceeds $0 $0 - $0 $0 $0 - $0
CLASS 3 Agricultural Land:Tillable Irrigated 481 $300,053 $6,482 652.346 $4,229 478 $298,495 $6,448 635.016 $4,095Tillable Non-Irrigated 263 $142,205 $3,071 630.606 $1,937 263 $142,205 $3,071 666.910 $2,048Grazing 4,961 $57,335 $1,283 637.571 $818 4,846 $56,588 $1,267 644.226 $816Wild Hay 1,372 $52,040 $1,125 632.948 $712 1,372 $52,040 $1,125 664.442 $747Non-Qualified Ag Land 5,514 $263,913 $39,908 651.443 $25,998 5,583 $268,718 $40,633 655.688 $26,643Eligible Mining Claims 0 $0 $0 - $0 0 $0 $0 - $0 Class 3 Subtotal $815,546 $51,869 649.578 $33,693 $818,046 $52,544 653.718 $34,349
CLASS 4 Land and Improvements:Residential $284,924,888 $3,856,787 683.017 $2,634,251 $295,848,410 $3,955,121 688.691 $2,723,856Residential Low Income $19,748,711 $86,966 696.825 $60,600 $19,953,099 $83,265 709.511 $59,077Mobile Homes $3,613,780 $48,781 652.457 $31,828 $3,837,520 $51,803 673.286 $34,878Mobile Homes Low Income $350,700 $1,606 642.960 $1,033 $1,488,165 $1,517 667.828 $1,013Commercial $54,995,103 $949,390 722.333 $685,776 $55,070,517 $953,346 729.880 $695,828Industrial $703,771 $13,300 643.646 $8,560 $703,771 $13,300 646.517 $8,599New Manufacturing $3,862,320 $72,000 643.310 $46,318 $3,721,250 $69,334 628.633 $43,586Qualified Golf Courses $0 $0 - $0 $0 $0 - $0Remodeled Commercial $0 $0 - $0 $0 $0 - $0Extended Prop Tax Relief Program (Res Only) $0 $0 - $0 $0 $0 - $0 Class 4 Subtotal $368,199,273 $5,028,830 689.696 $3,468,366 $380,622,732 $5,127,686 695.604 $3,566,837
CLASS 5Rural Electric and Telephone Co-Op $6,916,245 $207,489 663.757 $137,722 $6,509,899 $195,300 675.729 $131,970Qualified New Industrial $0 $0 - $0 $0 $0 - $0Pollution Control $0 $0 - $0 $0 $0 - $0Gasohol Related $0 $0 - $0 $0 $0 - $0Research and Development $0 $0 - $0 $0 $0 - $0Aluminum Electrolytic Equipment $0 $0 - $0 $0 $0 - $0 Class 5 Subtotal $6,916,245 $207,489 663.757 $137,722 $6,509,899 $195,300 675.729 $131,970
CLASS 7Non-Centrally Assessed Public Util. $0 $0 - $0 $0 $0 - $0
CLASS 8Machinery $15,380,228 $280,273 649.716 $182,098 $10,054,939 $143,373 631.041 $90,474Farm Implements $45,042 $676 669.740 $453 $15,602 $234 664.006 $155Furniture and Fixtures $1,570,104 $27,277 761.128 $20,762 $1,649,596 $27,557 772.851 $21,298Other Business Equipment $220,947 $3,624 649.632 $2,354 $330,076 $5,024 652.133 $3,276 Class 8 Subtotal $17,216,321 $311,852 659.504 $205,667 $12,050,213 $176,188 653.866 $115,203
CLASS 9Utilities $33,792,406 $4,055,086 642.460 $2,605,232 $32,171,795 $3,860,612 636.555 $2,457,493
CLASS 10Timber Land 88,088 $41,644,167 $154,076 624.620 $96,239 88,073 $41,518,721 $153,610 624.424 $95,918
CLASS 12Railroads $29,736,420 $912,909 643.452 $587,413 $27,800,165 $867,366 652.628 $566,067Airlines $0 $0 - $0 $0 $0 - $0 Class 12 Subtotal $29,736,420 $912,909 $587,413 $27,800,165 $867,366 $566,067
CLASS 13Electrical Generation Property $0 $0 - $0 $0 $0 - $0Telecommunication Property $4,949,047 $296,948 699.812 $207,808 $4,825,755 $289,549 709.712 $205,497Elect Gen/Tele Real Prop New & Exp $0 $0 - $0 $0 $0 - $0 Class 13 Subtotal $4,949,047 $296,948 $207,808 $4,825,755 $289,549 $205,497
CLASS 14Wind Generation $0 $0 - $0 $0 $0 - $0Wind Generation New & Exp $0 $0 - $0 $0 $0 - $0 Class 14 Subtotal $0 $0 $0 $0 $0 $0
CLASS 15Carbon Dioxide and Liquid Pipeline $0 $0 - $0 $0 $0 - $0Carbon Dioxide and Liquid Pipeline (abated) $0 $0 - $0 $0 $0 - $0
Total $503,269,425 $11,019,059 666.313 $7,342,140 $506,317,326 $10,722,855 668.976 $7,173,334
ABATED PROPERTY
Current Values of Abated Property $2,930,685 $32,922 739.766 $24,354 $448,721 $4,091 681.872 $2,790Values Without the Property Abatement $2,930,685 $68,433 739.766 $50,625 $448,721 $7,144 681.872 $4,872Difference (Property Value Abated) $0 -$35,512 -$26,270 $0 -$3,053 -$2,082
Mineral County
TY 2018TY 2017
1 NORTHWESTERN ENERGY-T & D 2 PACIFICORP - ELECTRIC TRANSMISSION 1 NORTHWESTERN ENERGY-T & D 2 PACIFICORP - ELECTRIC
TRANSMISSION
3 PORTLAND GENERAL ELECTRIC COMPANY - TRANSMISSION 4 MONTANA RAIL LINK 3 PORTLAND GENERAL ELECTRIC
COMPANY - TRANSMISSION 4 MONTANA RAIL LINK
5 PUGET SOUND ENERGY INC - TRANSMISSION PROPERTY 6 TRICON TIMBER LLC 5 PUGET SOUND ENERGY INC -
TRANSMISSION PROPERTY 6 AVISTA CORPORATION - ELECTRIC TRANSMISSION
7 AVISTA CORPORATION - ELECTRIC TRANSMISSION 8 VERIZON WIRELESS 7 VERIZON WIRELESS 8 IFG KAMP LLC
9 BLACKFOOT TELEPHONE COOP INC 10 MISSOULA ELECTRIC COOPERATIVE INC 9 BLACKFOOT TELEPHONE COOP INC 10 MISSOULA ELECTRIC COOPERATIVE
INC
Top 10 Property Owners by Taxable ValueTY 2017 TY 2018
Page 64
225revenue.mt.gov
Property Taxes Paid by County
Acres Assessed Taxable Avg. Mills Taxes Acres Assessed Taxable Avg. Mills TaxesCLASS 1 Net Proceeds $0 $0 - $0 $0 $0 - $0
CLASS 2 Gross Proceeds $0 $0 - $0 $0 $0 - $0
CLASS 3 Agricultural Land:Tillable Irrigated 13,955 $8,898,024 $192,205 680.943 $130,881 13,916 $8,870,180 $191,602 665.687 $127,547Tillable Non-Irrigated 1,416 $346,481 $7,485 797.535 $5,970 1,284 $376,219 $8,126 785.612 $6,384Grazing 77,025 $2,561,037 $55,413 657.360 $36,426 76,128 $2,531,354 $54,768 642.558 $35,192Wild Hay 1,752 $273,913 $5,919 695.971 $4,119 1,904 $290,904 $6,287 686.127 $4,314Non-Qualified Ag Land 30,750 $1,467,257 $221,845 707.634 $156,985 31,309 $1,497,762 $226,458 691.169 $156,521Eligible Mining Claims 0 $0 $0 - $0 0 $0 $0 - $0 Class 3 Subtotal $13,546,712 $482,867 692.491 $334,381 $13,566,419 $487,241 677.194 $329,957
CLASS 4 Land and Improvements:Residential $9,126,488,304 $123,276,986 840.780 $103,648,795 $9,293,666,452 $125,169,500 824.183 $103,162,625Residential Low Income $279,687,595 $1,368,018 846.603 $1,158,167 $284,198,203 $1,355,712 827.515 $1,121,871Mobile Homes $77,838,580 $1,050,680 778.566 $818,024 $79,000,750 $1,066,582 798.558 $851,727Mobile Homes Low Income $11,571,980 $50,727 789.391 $40,043 $25,322,123 $48,220 810.713 $39,093Commercial $3,708,659,550 $64,669,097 886.969 $57,359,504 $3,717,073,979 $64,704,880 866.456 $56,063,917Industrial $24,674,106 $466,338 801.247 $373,652 $26,660,701 $503,885 777.135 $391,587New Manufacturing $102,049,615 $1,918,857 853.061 $1,636,903 $61,529,282 $1,161,302 794.419 $922,561Qualified Golf Courses $17,577,381 $166,986 826.776 $138,060 $13,792,036 $131,024 782.602 $102,540Remodeled Commercial $0 $0 - $0 $0 $0 - $0Extended Prop Tax Relief Program (Res Only) $0 $0 - $0 $0 $0 - $0 Class 4 Subtotal $13,348,547,111 $192,967,689 855.963 $165,173,149 $13,501,243,526 $194,141,105 837.823 $162,655,920
CLASS 5Rural Electric and Telephone Co-Op $60,549,073 $1,816,480 735.067 $1,335,235 $58,378,011 $1,751,348 716.883 $1,255,511Qualified New Industrial $0 $0 - $0 $0 $0 - $0Pollution Control $113,554 $3,407 866.226 $2,951 $113,302 $3,399 840.120 $2,856Gasohol Related $0 $0 - $0 $0 $0 - $0Research and Development $0 $0 - $0 $0 $0 - $0Aluminum Electrolytic Equipment $0 $0 - $0 $0 $0 - $0 Class 5 Subtotal $60,662,627 $1,819,887 735.313 $1,338,186 $58,491,313 $1,754,747 717.122 $1,258,367
CLASS 7Non-Centrally Assessed Public Util. $0 $0 - $0 $0 $0 - $0
CLASS 8Machinery $126,140,306 $2,203,866 805.476 $1,775,161 $124,941,164 $2,228,787 813.725 $1,813,620Farm Implements $432,756 $6,493 713.273 $4,631 $540,259 $8,105 693.877 $5,624Furniture and Fixtures $120,738,242 $2,033,416 865.369 $1,759,655 $131,165,277 $2,306,480 876.496 $2,021,620Other Business Equipment $21,542,529 $346,423 823.644 $285,330 $17,449,266 $276,449 826.331 $228,439 Class 8 Subtotal $268,853,833 $4,590,198 833.249 $3,824,777 $274,095,966 $4,819,822 844.285 $4,069,303
CLASS 9Utilities $180,730,888 $21,687,686 760.536 $16,494,264 $183,791,883 $22,055,003 747.697 $16,490,459
CLASS 10Timber Land 356,168 $126,221,923 $467,005 624.947 $291,854 355,367 $125,503,041 $464,345 611.220 $283,817
CLASS 12Railroads $73,324,306 $2,251,062 762.727 $1,716,945 $69,218,641 $2,159,621 746.224 $1,611,562Airlines $24,133,749 $740,903 703.409 $521,158 $25,097,583 $783,045 661.164 $517,721 Class 12 Subtotal $97,458,055 $2,991,965 $2,238,104 $94,316,224 $2,942,666 $2,129,283
CLASS 13Electrical Generation Property $0 $0 - $0 $0 $0 - $0Telecommunication Property $88,540,981 $5,312,467 866.370 $4,602,563 $84,158,392 $5,049,504 849.439 $4,289,246Elect Gen/Tele Real Prop New & Exp $0 $0 - $0 $0 $0 - $0 Class 13 Subtotal $88,540,981 $5,312,467 $4,602,563 $84,158,392 $5,049,504 $4,289,246
CLASS 14Wind Generation $0 $0 - $0 $0 $0 - $0Wind Generation New & Exp $0 $0 - $0 $0 $0 - $0 Class 14 Subtotal $0 $0 $0 $0 $0 $0
CLASS 15Carbon Dioxide and Liquid Pipeline $0 $0 - $0 $0 $0 - $0Carbon Dioxide and Liquid Pipeline (abated) $0 $0 - $0 $0 $0 - $0
Total $14,184,562,130 $230,319,764 843.598 $194,297,278 $14,335,166,764 $231,714,433 826.476 $191,506,352
ABATED PROPERTY
Current Values of Abated Property $27,414,503 $458,097 872.167 $399,537 $15,697,953 $207,646 911.482 $189,265Values Without the Property Abatement $27,414,503 $623,831 872.167 $544,085 $15,697,953 $415,274 911.482 $378,515Difference (Property Value Abated) $0 -$165,734 -$144,548 $0 -$207,629 -$189,250
Missoula County
TY 2018TY 2017
1 NORTHWESTERN ENERGY-T & D 2 MONTANA RAIL LINK 1 NORTHWESTERN ENERGY-T & D 2 MONTANA RAIL LINK
3 VERIZON WIRELESS 4 CHARTER COMMUNICATIONS INC 3 VERIZON WIRELESS 4 CHARTER COMMUNICATIONS INC
5 CENTURYLINK INC 6 MISSOULA ELECTRIC COOPERATIVE INC 5 MISSOULA ELECTRIC COOPERATIVE
INC 6 SOUTHGATE MALL ASSOCIATES LLC
7 SOUTHGATE MALL ASSOCIATES 8 RCHP BILLINGS MISSOULA LLC 7 QWEST CORPORATION AND OR CENTURYLINK INC - 8 RCHP BILLINGS MISSOULA LLC
9 MOUNTAIN WATER CO 10 YELLOWSTONE PIPELINE CO 9 YELLOWSTONE PIPELINE CO 10 GATEWAY LIMITED PARTNERSHIP
Top 10 Property Owners by Taxable ValueTY 2017 TY 2018
Page 65
226revenue.mt.gov
Property Taxes Paid by County
Acres Assessed Taxable Avg. Mills Taxes Acres Assessed Taxable Avg. Mills TaxesCLASS 1 Net Proceeds $0 $0 - $0 $0 $0 - $0
CLASS 2 Gross Proceeds $0 $0 - $0 $0 $0 - $0
CLASS 3 Agricultural Land:Tillable Irrigated 14,002 $11,814,442 $255,187 567.532 $144,827 13,995 $11,809,983 $255,090 535.289 $136,547Tillable Non-Irrigated 84,589 $13,679,255 $295,473 570.617 $168,602 84,564 $13,684,301 $295,582 533.192 $157,602Grazing 674,953 $28,029,799 $605,457 571.166 $345,817 675,085 $28,038,716 $605,651 535.155 $324,117Wild Hay 18,550 $3,568,353 $77,073 568.021 $43,779 18,543 $3,567,617 $77,057 531.467 $40,953Non-Qualified Ag Land 35,465 $1,706,873 $258,129 596.700 $154,026 35,626 $1,714,632 $259,301 553.523 $143,529Eligible Mining Claims 0 $0 $0 - $0 0 $0 $0 - $0 Class 3 Subtotal $58,798,722 $1,491,319 574.692 $857,050 $58,815,249 $1,492,681 537.789 $802,748
CLASS 4 Land and Improvements:Residential $188,281,771 $2,549,459 638.442 $1,627,682 $191,012,838 $2,541,722 596.610 $1,516,416Residential Low Income $15,155,587 $60,097 635.379 $38,184 $17,656,087 $75,993 588.378 $44,713Mobile Homes $8,462,330 $114,234 594.398 $67,900 $8,387,680 $113,224 603.890 $68,375Mobile Homes Low Income $999,060 $4,084 595.283 $2,431 $1,522,965 $3,604 604.389 $2,178Commercial $83,706,655 $1,264,133 617.698 $780,853 $84,092,319 $1,274,242 579.034 $737,829Industrial $2,901,985 $54,848 602.629 $33,053 $2,497,585 $47,205 558.314 $26,355New Manufacturing $18,545,010 $290,098 623.969 $181,012 $18,117,350 $342,418 558.560 $191,261Qualified Golf Courses $0 $0 - $0 $0 $0 - $0Remodeled Commercial $0 $0 - $0 $0 $0 - $0Extended Prop Tax Relief Program (Res Only) $0 $0 - $0 $0 $0 - $0 Class 4 Subtotal $318,052,398 $4,336,953 629.732 $2,731,116 $323,286,824 $4,398,408 588.196 $2,587,126
CLASS 5Rural Electric and Telephone Co-Op $14,693,804 $440,818 616.522 $271,774 $16,364,256 $490,928 574.854 $282,212Qualified New Industrial $0 $0 - $0 $0 $0 - $0Pollution Control $0 $0 - $0 $0 $0 - $0Gasohol Related $0 $0 - $0 $0 $0 - $0Research and Development $0 $0 - $0 $0 $0 - $0Aluminum Electrolytic Equipment $0 $0 - $0 $0 $0 - $0 Class 5 Subtotal $14,693,804 $440,818 616.522 $271,774 $16,364,256 $490,928 574.854 $282,212
CLASS 7Non-Centrally Assessed Public Util. $0 $0 - $0 $0 $0 - $0
CLASS 8Machinery $104,738,912 $2,504,818 607.514 $1,521,712 $100,726,508 $2,720,456 605.884 $1,648,281Farm Implements $4,940,610 $85,141 574.606 $48,923 $4,926,593 $81,250 566.332 $46,014Furniture and Fixtures $520,853 $9,097 663.263 $6,034 $512,477 $8,650 669.718 $5,793Other Business Equipment $13,991,763 $389,165 587.068 $228,466 $15,832,251 $446,741 599.345 $267,752 Class 8 Subtotal $124,192,138 $2,988,222 604.083 $1,805,135 $121,997,829 $3,257,096 604.170 $1,967,840
CLASS 9Utilities $14,010,585 $1,681,264 596.082 $1,002,171 $16,138,493 $1,936,614 560.140 $1,084,775
CLASS 10Timber Land 165,744 $16,063,751 $59,436 563.024 $33,464 163,448 $15,875,718 $58,743 528.171 $31,026
CLASS 12Railroads $57,046,582 $1,401,573 537.871 $753,865 $51,780,740 $1,454,273 496.338 $721,811Airlines $1,292 $40 516.999 $21 $0 $0 - $0 Class 12 Subtotal $57,047,874 $1,401,613 $753,886 $51,780,740 $1,454,273 $721,811
CLASS 13Electrical Generation Property $0 $0 - $0 $0 $0 - $0Telecommunication Property $4,370,188 $262,210 613.044 $160,746 $4,568,330 $274,100 567.233 $155,478Elect Gen/Tele Real Prop New & Exp $0 $0 - $0 $0 $0 - $0 Class 13 Subtotal $4,370,188 $262,210 $160,746 $4,568,330 $274,100 $155,478
CLASS 14Wind Generation $0 $0 - $0 $0 $0 - $0Wind Generation New & Exp $0 $0 - $0 $0 $0 - $0 Class 14 Subtotal $0 $0 $0 $0 $0 $0
CLASS 15Carbon Dioxide and Liquid Pipeline $0 $0 - $0 $0 $0 - $0Carbon Dioxide and Liquid Pipeline (abated) $0 $0 - $0 $0 $0 - $0
Total $607,229,460 $12,661,835 601.441 $7,615,342 $608,827,439 $13,362,843 571.212 $7,633,017
ABATED PROPERTY
Current Values of Abated Property $143,370,524 $3,214,134 584.230 $1,877,793 $106,342,844 $2,887,273 553.455 $1,597,977Values Without the Property Abatement $143,370,524 $3,708,782 584.230 $2,166,781 $106,342,844 $3,208,081 553.455 $1,775,529Difference (Property Value Abated) $0 -$494,648 -$288,988 $0 -$320,808 -$177,553
Musselshell County
TY 2018TY 2017
1 SIGNAL PEAK ENERGY LLP 2 GLOBAL RAIL GROUP LLC 1 SIGNAL PEAK ENERGY LLP 2 GLOBAL RAIL GROUP LLC
3 NORTHWESTERN ENERGY-T & D 4 PHILLIPS 66 CARRIER LLC 3 NORTHWESTERN ENERGY-T & D 4 PHILLIPS 66 CARRIER LLC
5 MUSSELSHELL RESOURCES LLC 6 MID RIVERS TELEPHONE COOPERATIVE 5 MUSSELSHELL RESOURCES LLC 6 MID RIVERS TELEPHONE
COOPERATIVE
7 VERIZON WIRELESS 8 FERGUS ELECTRIC COOP 7 FERGUS ELECTRIC COOP 8 VERIZON WIRELESS
9 WILKS RANCH MONTANA LTD 10 TRANEL PROPERTIES LP 9 WILKS RANCH MONTANA LTD 10 TRANEL PROPERTIES LP
Top 10 Property Owners by Taxable ValueTY 2017 TY 2018
Page 66
227revenue.mt.gov
Property Taxes Paid by County
Acres Assessed Taxable Avg. Mills Taxes Acres Assessed Taxable Avg. Mills TaxesCLASS 1 Net Proceeds $0 $0 - $0 $0 $0 - $0
CLASS 2 Gross Proceeds $0 $0 - $0 $0 $0 - $0
CLASS 3 Agricultural Land:Tillable Irrigated 50,897 $32,779,341 $708,037 486.066 $344,153 50,746 $32,697,315 $706,266 491.754 $347,309Tillable Non-Irrigated 21,270 $3,647,569 $78,792 520.017 $40,973 21,235 $3,637,093 $78,566 519.040 $40,779Grazing 515,101 $33,734,586 $728,700 493.949 $359,941 515,135 $33,718,869 $728,356 501.751 $365,454Wild Hay 8,505 $2,630,874 $56,835 518.027 $29,442 8,421 $2,612,455 $56,436 520.491 $29,374Non-Qualified Ag Land 51,141 $2,460,574 $372,037 484.791 $180,360 51,203 $2,464,362 $372,604 483.937 $180,317Eligible Mining Claims 323 $15,558 $337 385.664 $130 323 $15,558 $337 387.065 $130 Class 3 Subtotal $75,268,502 $1,944,738 491.068 $954,999 $75,145,652 $1,942,565 495.924 $963,364
CLASS 4 Land and Improvements:Residential $1,788,078,318 $24,196,438 545.143 $13,190,525 $1,830,845,273 $24,699,202 540.048 $13,338,751Residential Low Income $76,626,047 $388,089 611.458 $237,300 $78,027,466 $384,054 602.829 $231,519Mobile Homes $11,079,820 $149,578 487.869 $72,974 $12,002,160 $162,030 508.613 $82,411Mobile Homes Low Income $1,047,530 $4,111 492.986 $2,027 $3,069,127 $3,580 517.007 $1,851Commercial $610,968,703 $9,942,860 548.791 $5,456,556 $627,247,833 $10,231,239 543.749 $5,563,223Industrial $1,992,087 $37,650 521.354 $19,629 $1,992,087 $37,650 510.373 $19,216New Manufacturing $2,938,050 $55,528 535.809 $29,752 $2,876,580 $54,367 524.206 $28,499Qualified Golf Courses $2,957,969 $28,099 464.602 $13,055 $2,957,969 $28,099 461.056 $12,955Remodeled Commercial $0 $0 - $0 $0 $0 - $0Extended Prop Tax Relief Program (Res Only) $0 $0 - $0 $0 $0 - $0 Class 4 Subtotal $2,495,688,524 $34,802,353 546.567 $19,021,819 $2,559,018,495 $35,600,221 541.525 $19,278,424
CLASS 5Rural Electric and Telephone Co-Op $15,465,634 $463,973 480.868 $223,110 $13,665,118 $409,954 480.359 $196,925Qualified New Industrial $0 $0 - $0 $0 $0 - $0Pollution Control $0 $0 - $0 $0 $0 - $0Gasohol Related $0 $0 - $0 $0 $0 - $0Research and Development $0 $0 - $0 $0 $0 - $0Aluminum Electrolytic Equipment $0 $0 - $0 $0 $0 - $0 Class 5 Subtotal $15,465,634 $463,973 480.868 $223,110 $13,665,118 $409,954 480.359 $196,925
CLASS 7Non-Centrally Assessed Public Util. $0 $0 - $0 $0 $0 - $0
CLASS 8Machinery $11,247,652 $174,688 569.947 $99,563 $8,813,406 $150,448 583.500 $87,786Farm Implements $4,608,341 $73,883 464.510 $34,319 $4,490,502 $71,526 501.844 $35,895Furniture and Fixtures $8,009,183 $139,716 630.470 $88,087 $10,209,889 $172,574 645.521 $111,400Other Business Equipment $2,431,362 $37,065 544.794 $20,193 $2,117,190 $31,990 563.583 $18,029 Class 8 Subtotal $26,296,538 $425,351 569.321 $242,161 $25,630,987 $426,538 593.406 $253,110
CLASS 9Utilities $40,558,040 $4,866,953 560.813 $2,729,453 $44,646,797 $5,357,603 567.821 $3,042,159
CLASS 10Timber Land 135,883 $31,094,826 $115,065 472.933 $54,418 135,925 $31,120,591 $115,156 475.366 $54,741
CLASS 12Railroads $36,065,935 $1,107,222 610.147 $675,568 $33,624,170 $1,049,071 622.692 $653,248Airlines $1,292 $40 548.319 $22 $1,394 $43 533.040 $23 Class 12 Subtotal $36,067,227 $1,107,262 $675,590 $33,625,564 $1,049,114 $653,271
CLASS 13Electrical Generation Property $0 $0 - $0 $0 $0 - $0Telecommunication Property $11,554,804 $693,292 570.760 $395,703 $11,255,554 $675,337 566.690 $382,707Elect Gen/Tele Real Prop New & Exp $0 $0 - $0 $0 $0 - $0 Class 13 Subtotal $11,554,804 $693,292 $395,703 $11,255,554 $675,337 $382,707
CLASS 14Wind Generation $0 $0 - $0 $0 $0 - $0Wind Generation New & Exp $0 $0 - $0 $0 $0 - $0 Class 14 Subtotal $0 $0 $0 $0 $0 $0
CLASS 15Carbon Dioxide and Liquid Pipeline $0 $0 - $0 $0 $0 - $0Carbon Dioxide and Liquid Pipeline (abated) $0 $0 - $0 $0 $0 - $0
Total $2,731,994,095 $44,418,987 547.002 $24,297,254 $2,794,108,758 $45,576,488 544.682 $24,824,701
ABATED PROPERTY
Current Values of Abated Property $0 $0 - $0 $0 $0 - $0Values Without the Property Abatement $0 $0 - $0 $0 $0 - $0Difference (Property Value Abated) $0 $0 $0 $0 $0 $0
Park County
TY 2018TY 2017
1 NORTHWESTERN ENERGY-T & D 2 MONTANA RAIL LINK 1 NORTHWESTERN ENERGY-T & D 2 MONTANA RAIL LINK
3 PARK ELECTRIC CO OP INC 4 YELLOWSTONE PIPELINE CO 3 YELLOWSTONE PIPELINE CO 4 PARK ELECTRIC CO OP INC
5 CENTURYLINK INC 6 ROCK CREEK RANCH I LTD 5 ROCK CREEK RANCH I LTD 6 PHILIP MORRIS INC
7 PHILIP MORRIS INC 8 MOUNTAIN SKY GUEST RANCH LLC 7 MOUNTAIN SKY GUEST RANCH LLC 8 VERIZON WIRELESS
9 VERIZON WIRELESS 10 KEMP JAMES A 9 QWEST CORPORATION AND OR CENTURYLINK INC - 10 KEMP JAMES A
Top 10 Property Owners by Taxable ValueTY 2017 TY 2018
Page 67
228revenue.mt.gov
Property Taxes Paid by County
Acres Assessed Taxable Avg. Mills Taxes Acres Assessed Taxable Avg. Mills TaxesCLASS 1 Net Proceeds $0 $0 - $0 $0 $0 - $0
CLASS 2 Gross Proceeds $0 $0 - $0 $0 $0 - $0
CLASS 3 Agricultural Land:Tillable Irrigated 10,136 $7,055,421 $152,398 590.748 $90,029 10,151 $7,028,733 $151,822 643.560 $97,707Tillable Non-Irrigated 73,476 $11,067,652 $239,070 590.748 $141,230 73,419 $11,059,414 $238,892 643.560 $153,741Grazing 501,420 $18,627,343 $402,389 590.811 $237,736 501,125 $18,614,609 $402,114 643.624 $258,810Wild Hay 13,516 $2,493,880 $53,877 591.666 $31,877 13,513 $2,492,881 $53,855 644.500 $34,710Non-Qualified Ag Land 4,561 $219,505 $33,192 591.605 $19,637 5,088 $244,870 $37,026 644.346 $23,858Eligible Mining Claims 0 $0 $0 - $0 0 $0 $0 - $0 Class 3 Subtotal $39,463,801 $880,926 590.865 $520,509 $39,440,507 $883,709 643.680 $568,825
CLASS 4 Land and Improvements:Residential $10,704,184 $147,377 692.266 $102,024 $10,840,803 $148,185 746.201 $110,576Residential Low Income $555,957 $1,652 745.993 $1,232 $617,557 $1,918 803.702 $1,541Mobile Homes $2,216,330 $29,919 657.405 $19,669 $2,270,960 $30,655 632.805 $19,399Mobile Homes Low Income $0 $0 - $0 $6,194 $0 - $0Commercial $23,689,177 $329,991 608.414 $200,771 $23,720,957 $330,228 661.290 $218,376Industrial $0 $0 - $0 $60,787 $1,149 643.560 $739New Manufacturing $0 $0 - $0 $0 $0 - $0Qualified Golf Courses $0 $0 - $0 $0 $0 - $0Remodeled Commercial $0 $0 - $0 $0 $0 - $0Extended Prop Tax Relief Program (Res Only) $0 $0 - $0 $0 $0 - $0 Class 4 Subtotal $37,165,648 $508,939 636.022 $323,696 $37,517,258 $512,135 684.647 $350,632
CLASS 5Rural Electric and Telephone Co-Op $5,220,479 $156,614 604.088 $94,609 $5,025,857 $150,779 659.788 $99,482Qualified New Industrial $0 $0 - $0 $0 $0 - $0Pollution Control $0 $0 - $0 $0 $0 - $0Gasohol Related $0 $0 - $0 $0 $0 - $0Research and Development $0 $0 - $0 $0 $0 - $0Aluminum Electrolytic Equipment $0 $0 - $0 $0 $0 - $0 Class 5 Subtotal $5,220,479 $156,614 604.088 $94,609 $5,025,857 $150,779 659.788 $99,482
CLASS 7Non-Centrally Assessed Public Util. $0 $0 - $0 $0 $0 - $0
CLASS 8Machinery $569,862 $8,648 610.353 $5,279 $1,369,385 $20,646 601.695 $12,423Farm Implements $6,663,338 $107,822 608.571 $65,617 $5,847,452 $89,611 609.919 $54,655Furniture and Fixtures $40,911 $652 675.905 $441 $70,758 $1,072 614.755 $659Other Business Equipment $224,877 $3,374 603.034 $2,035 $248,689 $3,732 610.479 $2,278 Class 8 Subtotal $7,498,988 $120,496 608.908 $73,371 $7,536,284 $115,061 608.506 $70,015
CLASS 9Utilities $0 $0 - $0 $0 $0 - $0
CLASS 10Timber Land 1,067 $137,989 $510 590.748 $301 1,067 $138,648 $513 643.560 $330
CLASS 12Railroads $0 $0 - $0 $0 $0 - $0Airlines $0 $0 - $0 $0 $0 - $0 Class 12 Subtotal $0 $0 $0 $0 $0 $0
CLASS 13Electrical Generation Property $0 $0 - $0 $0 $0 - $0Telecommunication Property $79,928 $4,795 590.748 $2,833 $156,534 $9,392 643.560 $6,044Elect Gen/Tele Real Prop New & Exp $0 $0 - $0 $0 $0 - $0 Class 13 Subtotal $79,928 $4,795 $2,833 $156,534 $9,392 $6,044
CLASS 14Wind Generation $0 $0 - $0 $0 $0 - $0Wind Generation New & Exp $0 $0 - $0 $0 $0 - $0 Class 14 Subtotal $0 $0 $0 $0 $0 $0
CLASS 15Carbon Dioxide and Liquid Pipeline $0 $0 - $0 $0 $0 - $0Carbon Dioxide and Liquid Pipeline (abated) $0 $0 - $0 $0 $0 - $0
Total $89,566,833 $1,672,280 607.146 $1,015,319 $89,815,088 $1,671,589 655.262 $1,095,329
ABATED PROPERTY
Current Values of Abated Property $0 $0 - $0 $0 $0 - $0Values Without the Property Abatement $0 $0 - $0 $0 $0 - $0Difference (Property Value Abated) $0 $0 $0 $0 $0 $0
Petroleum County
TY 2018TY 2017
1 TWIN CREEKS FARM & RANCH LLC 2 FLAT WILLOW FARM LLC 1 TWIN CREEKS FARM & RANCH LLC 2 FLAT WILLOW FARM LLC
3 FERGUS ELECTRIC COOP 4 KLAMERT GENE J & RONNA 3 KLAMERT GENE J & RONNA 4 FERGUS ELECTRIC COOP
5 MID RIVERS TELEPHONE COOPERATIVE 6 LEK RANCH LLC 5 MID RIVERS TELEPHONE
COOPERATIVE 6 LEK RANCH LLC
7 MCCONE ELECTRIC COOP INC 8 NEW VIEW INC 7 MCCONE ELECTRIC COOP INC 8 NEW VIEW INC
9 LUND # RANCH INC 10 WALKING SEVEN INC 9 LUND # RANCH INC 10 WALKING SEVEN INC
Top 10 Property Owners by Taxable ValueTY 2017 TY 2018
Page 68
229revenue.mt.gov
Property Taxes Paid by County
Acres Assessed Taxable Avg. Mills Taxes Acres Assessed Taxable Avg. Mills TaxesCLASS 1 Net Proceeds $0 $0 - $0 $0 $0 - $0
CLASS 2 Gross Proceeds $0 $0 - $0 $0 $0 - $0
CLASS 3 Agricultural Land:Tillable Irrigated 44,257 $26,477,443 $571,898 476.263 $272,374 44,572 $26,666,160 $575,975 504.492 $290,575Tillable Non-Irrigated 415,081 $118,943,989 $2,569,187 490.211 $1,259,444 414,858 $118,878,346 $2,567,771 519.355 $1,333,584Grazing 1,099,342 $43,124,019 $931,482 493.703 $459,875 1,099,108 $43,114,220 $931,265 521.892 $486,020Wild Hay 18,135 $3,704,695 $80,019 514.780 $41,192 18,097 $3,697,229 $79,858 541.724 $43,261Non-Qualified Ag Land 5,250 $252,673 $38,205 491.019 $18,759 5,159 $248,319 $37,547 520.117 $19,529Eligible Mining Claims 0 $0 $0 - $0 0 $0 $0 - $0 Class 3 Subtotal $192,502,819 $4,190,791 489.560 $2,051,645 $192,604,274 $4,192,416 518.309 $2,172,968
CLASS 4 Land and Improvements:Residential $141,612,358 $1,919,650 624.161 $1,198,171 $143,163,307 $1,934,679 670.473 $1,297,150Residential Low Income $9,683,585 $41,716 619.775 $25,855 $10,366,331 $44,615 676.095 $30,164Mobile Homes $3,974,450 $53,658 520.362 $27,922 $3,932,350 $53,089 513.637 $27,268Mobile Homes Low Income $213,070 $759 558.289 $424 $240,030 $578 624.767 $361Commercial $124,625,572 $1,874,072 548.396 $1,027,734 $125,873,471 $1,898,563 582.777 $1,106,439Industrial $143,504 $2,712 496.708 $1,347 $105,143 $1,987 559.840 $1,112New Manufacturing $3,799,960 $71,819 506.782 $36,397 $3,060,960 $57,852 559.840 $32,388Qualified Golf Courses $632,830 $6,013 533.672 $3,209 $632,830 $6,013 559.840 $3,366Remodeled Commercial $0 $0 - $0 $0 $0 - $0Extended Prop Tax Relief Program (Res Only) $0 $0 - $0 $0 $0 - $0 Class 4 Subtotal $284,685,329 $3,970,399 584.590 $2,321,057 $287,374,422 $3,997,376 624.972 $2,498,249
CLASS 5Rural Electric and Telephone Co-Op $21,222,999 $636,690 543.707 $346,173 $22,296,574 $668,898 574.764 $384,458Qualified New Industrial $0 $0 - $0 $0 $0 - $0Pollution Control $0 $0 - $0 $0 $0 - $0Gasohol Related $0 $0 - $0 $0 $0 - $0Research and Development $0 $0 - $0 $0 $0 - $0Aluminum Electrolytic Equipment $0 $0 - $0 $0 $0 - $0 Class 5 Subtotal $21,222,999 $636,690 543.707 $346,173 $22,296,574 $668,898 574.764 $384,458
CLASS 7Non-Centrally Assessed Public Util. $0 $0 - $0 $0 $0 - $0
CLASS 8Machinery $4,376,807 $75,991 515.820 $39,198 $4,301,699 $71,914 525.685 $37,804Farm Implements $25,360,800 $385,296 487.300 $187,755 $27,398,043 $418,435 504.021 $210,900Furniture and Fixtures $1,162,184 $24,401 724.901 $17,688 $1,200,907 $24,439 674.698 $16,489Other Business Equipment $8,173,426 $183,550 387.453 $71,117 $7,405,484 $157,028 445.498 $69,956 Class 8 Subtotal $39,073,217 $669,238 471.817 $315,758 $40,306,133 $671,816 498.870 $335,149
CLASS 9Utilities $59,013,108 $7,081,575 449.681 $3,184,448 $43,959,047 $5,275,080 495.221 $2,612,329
CLASS 10Timber Land 2,355 $316,779 $1,171 511.076 $598 2,355 $316,779 $1,171 536.417 $628
CLASS 12Railroads $62,671,061 $1,924,002 497.292 $956,790 $55,469,138 $1,730,637 527.818 $913,462Airlines $0 $0 - $0 $0 $0 - $0 Class 12 Subtotal $62,671,061 $1,924,002 $956,790 $55,469,138 $1,730,637 $913,462
CLASS 13Electrical Generation Property $0 $0 - $0 $0 $0 - $0Telecommunication Property $6,032,117 $361,929 557.626 $201,821 $6,778,872 $406,731 575.602 $234,115Elect Gen/Tele Real Prop New & Exp $0 $0 - $0 $0 $0 - $0 Class 13 Subtotal $6,032,117 $361,929 $201,821 $6,778,872 $406,731 $234,115
CLASS 14Wind Generation $0 $0 - $0 $0 $0 - $0Wind Generation New & Exp $0 $0 - $0 $0 $0 - $0 Class 14 Subtotal $0 $0 $0 $0 $0 $0
CLASS 15Carbon Dioxide and Liquid Pipeline $0 $0 - $0 $0 $0 - $0Carbon Dioxide and Liquid Pipeline (abated) $0 $0 - $0 $0 $0 - $0
Total $665,517,429 $18,835,795 497.897 $9,378,290 $649,105,239 $16,944,125 540.090 $9,151,358
ABATED PROPERTY
Current Values of Abated Property $0 $0 - $0 $0 $0 - $0Values Without the Property Abatement $0 $0 - $0 $0 $0 - $0Difference (Property Value Abated) $0 $0 $0 $0 $0 $0
Phillips County
TY 2018TY 2017
1 WBI ENERGY MIDSTREAM LLC 2 NORTHERN BORDER PIPELINE COMPANY 1 NORTHERN BORDER PIPELINE
COMPANY 2 BNSF RAILWAY CO
3 BNSF RAILWAY CO 4 NORTHWESTERN ENERGY-T & D 3 WBI ENERGY MIDSTREAM LLC 4 NORTHWESTERN ENERGY-T & D
5 TRIANGLE TELEPHONE COOPERATIVE ASSOC INC 6 OMIMEX CANADA LTD 5 TRIANGLE TELEPHONE
COOPERATIVE ASSOC INC 6 WHITEWATER PIPELINE COMPANY
7 TRIANGLE COMMUNICATION SYSTEM INC 8 SCOUT ENERGY MANAGEMENT LLC 7 TRIANGLE COMMUNICATION
SYSTEM INC 8 SCOUT ENERGY MANAGEMENT LLC
9 BIG FLAT ELECTRIC COOP INC 10 MONTANA DAKOTA UTILITIES - GAS DISTRIBUTION 9 BIG FLAT ELECTRIC COOP INC 10 MONTANA DAKOTA UTILITIES - GAS
DISTRIBUTION
Top 10 Property Owners by Taxable ValueTY 2017 TY 2018
Page 69
230revenue.mt.gov
Property Taxes Paid by County
Acres Assessed Taxable Avg. Mills Taxes Acres Assessed Taxable Avg. Mills TaxesCLASS 1 Net Proceeds $0 $0 - $0 $0 $0 - $0
CLASS 2 Gross Proceeds $0 $0 - $0 $0 $0 - $0
CLASS 3 Agricultural Land:Tillable Irrigated 77,077 $48,026,540 $1,037,399 640.419 $664,370 77,250 $48,134,525 $1,039,733 663.491 $689,853Tillable Non-Irrigated 424,211 $136,730,327 $2,953,399 604.489 $1,785,297 424,259 $136,596,697 $2,950,516 617.096 $1,820,751Grazing 234,534 $11,457,731 $247,543 610.429 $151,107 234,967 $11,462,186 $247,644 620.678 $153,707Wild Hay 6,059 $1,705,480 $36,840 564.418 $20,793 6,089 $1,711,214 $36,963 586.994 $21,697Non-Qualified Ag Land 3,493 $157,378 $23,796 633.673 $15,079 3,611 $161,124 $24,362 644.405 $15,699Eligible Mining Claims 0 $0 $0 - $0 0 $0 $0 - $0 Class 3 Subtotal $198,077,456 $4,298,977 613.320 $2,636,647 $198,065,746 $4,299,218 628.418 $2,701,707
CLASS 4 Land and Improvements:Residential $175,765,661 $2,378,571 728.095 $1,731,825 $179,637,366 $2,415,194 746.636 $1,803,270Residential Low Income $9,660,474 $45,646 749.457 $34,210 $9,342,036 $45,408 766.908 $34,824Mobile Homes $3,840,780 $51,854 691.143 $35,839 $3,814,290 $51,498 677.121 $34,870Mobile Homes Low Income $127,270 $343 637.201 $219 $224,099 $362 614.505 $222Commercial $187,984,346 $2,803,866 659.419 $1,848,924 $190,051,967 $2,833,660 676.587 $1,917,218Industrial $907,859 $17,160 693.195 $11,895 $898,179 $16,978 708.516 $12,029New Manufacturing $25,981,536 $349,798 716.636 $250,678 $25,958,407 $349,360 732.065 $255,754Qualified Golf Courses $168,700 $1,603 659.868 $1,058 $168,700 $1,603 674.804 $1,082Remodeled Commercial $0 $0 - $0 $0 $0 - $0Extended Prop Tax Relief Program (Res Only) $0 $0 - $0 $0 $0 - $0 Class 4 Subtotal $404,436,626 $5,648,841 693.000 $3,914,646 $410,095,044 $5,714,063 710.400 $4,059,271
CLASS 5Rural Electric and Telephone Co-Op $16,462,269 $493,866 633.044 $312,639 $15,804,599 $474,135 637.993 $302,495Qualified New Industrial $0 $0 - $0 $0 $0 - $0Pollution Control $0 $0 - $0 $0 $0 - $0Gasohol Related $0 $0 - $0 $0 $0 - $0Research and Development $0 $0 - $0 $0 $0 - $0Aluminum Electrolytic Equipment $0 $0 - $0 $0 $0 - $0 Class 5 Subtotal $16,462,269 $493,866 633.044 $312,639 $15,804,599 $474,135 637.993 $302,495
CLASS 7Non-Centrally Assessed Public Util. $0 $0 - $0 $0 $0 - $0
CLASS 8Machinery $6,178,727 $99,607 668.629 $66,600 $5,613,216 $87,489 667.184 $58,371Farm Implements $26,522,883 $405,069 623.451 $252,541 $25,912,878 $404,009 624.207 $252,185Furniture and Fixtures $1,172,853 $21,921 775.430 $16,998 $1,151,270 $20,876 766.808 $16,008Other Business Equipment $2,147,040 $33,596 646.736 $21,728 $1,543,307 $23,555 646.952 $15,239 Class 8 Subtotal $36,021,503 $560,193 638.827 $357,867 $34,220,671 $535,928 637.777 $341,803
CLASS 9Utilities $28,259,675 $3,391,158 652.258 $2,211,909 $30,806,226 $3,696,752 666.676 $2,464,535
CLASS 10Timber Land 1,321 $186,316 $698 724.469 $506 1,321 $186,316 $698 625.102 $436
CLASS 12Railroads $38,476,453 $1,181,229 645.234 $762,169 $34,043,122 $1,062,147 660.588 $701,641Airlines $2,583 $79 786.098 $62 $2,789 $87 803.064 $70 Class 12 Subtotal $38,479,036 $1,181,308 $762,231 $34,045,911 $1,062,234 $701,711
CLASS 13Electrical Generation Property $0 $0 - $0 $0 $0 - $0Telecommunication Property $3,262,151 $195,727 674.945 $132,105 $3,403,900 $204,234 704.743 $143,932Elect Gen/Tele Real Prop New & Exp $0 $0 - $0 $0 $0 - $0 Class 13 Subtotal $3,262,151 $195,727 $132,105 $3,403,900 $204,234 $143,932
CLASS 14Wind Generation $0 $0 - $0 $0 $0 - $0Wind Generation New & Exp $41,279,079 $619,186 626.694 $388,040 $40,471,179 $607,068 643.058 $390,380 Class 14 Subtotal $41,279,079 $619,186 $388,040 $40,471,179 $607,068 $390,380
CLASS 15Carbon Dioxide and Liquid Pipeline $0 $0 - $0 $0 $0 - $0Carbon Dioxide and Liquid Pipeline (abated) $0 $0 - $0 $0 $0 - $0
Total $766,464,111 $16,389,954 653.851 $10,716,590 $767,099,592 $16,594,330 669.281 $11,106,271
ABATED PROPERTY
Current Values of Abated Property $15,050,168 $142,929 759.807 $108,599 $15,045,784 $142,897 774.743 $110,708Values Without the Property Abatement $15,050,168 $284,600 759.807 $216,241 $15,045,784 $284,292 774.743 $220,253Difference (Property Value Abated) $0 -$141,670 -$107,642 $0 -$141,395 -$109,545
Pondera County
TY 2018TY 2017
1 NORTHWESTERN ENERGY-T & D 2 BNSF RAILWAY CO 1 NORTHWESTERN ENERGY-T & D 2 PHILLIPS 66 CARRIER LLC
3 PHILLIPS 66 CARRIER LLC 4 FRONT RANGE PIPELINE LLC 3 BNSF RAILWAY CO 4 FRONT RANGE PIPELINE LLC
5 MONTANA ALBERTA TIE LIMITED (M.A.T.L.) 6 KINGSBURY COLONY A MT CORP 5 MONTANA ALBERTA TIE LIMITED
(M.A.T.L.) 6 KINGSBURY COLONY A MT CORP
7 SUN RIVER ELECTRIC COOP INC 8 3 RIVERS TELEPHONE COOPERATIVE INC 7 ROCKY MOUNTAIN PIPELINE
SYSTEM LLC 8 3 RIVERS TELEPHONE COOPERATIVE INC
9 MIDWAY COLONY INC 10 BIRCH CREEK COLONY INC 9 MIDWAY COLONY INC 10 SUN RIVER ELECTRIC COOP INC
Top 10 Property Owners by Taxable ValueTY 2017 TY 2018
Page 70
231revenue.mt.gov
Property Taxes Paid by County
Acres Assessed Taxable Avg. Mills Taxes Acres Assessed Taxable Avg. Mills TaxesCLASS 1 Net Proceeds $0 $0 - $0 $0 $0 - $0
CLASS 2 Gross Proceeds $0 $0 - $0 $0 $0 - $0
CLASS 3 Agricultural Land:Tillable Irrigated 11,350 $6,822,072 $147,358 375.281 $55,301 11,350 $6,822,072 $147,358 377.852 $55,680Tillable Non-Irrigated 43,764 $11,443,245 $247,179 371.025 $91,710 43,564 $11,418,606 $246,647 373.487 $92,119Grazing 1,179,333 $39,477,213 $852,744 382.179 $325,901 1,179,318 $39,476,263 $852,723 384.441 $327,821Wild Hay 77,081 $14,194,364 $306,596 386.060 $118,365 77,216 $14,231,774 $307,404 387.961 $119,261Non-Qualified Ag Land 3,920 $188,684 $28,529 414.228 $11,818 4,015 $193,255 $29,220 414.398 $12,109Eligible Mining Claims 0 $0 $0 - $0 0 $0 $0 - $0 Class 3 Subtotal $72,125,578 $1,582,406 381.124 $603,093 $72,141,970 $1,583,352 383.357 $606,990
CLASS 4 Land and Improvements:Residential $31,831,977 $439,330 446.286 $196,067 $32,413,676 $447,222 445.435 $199,208Residential Low Income $993,597 $5,528 448.013 $2,477 $739,507 $3,236 434.093 $1,405Mobile Homes $9,437,410 $127,405 419.732 $53,476 $9,897,630 $133,620 405.853 $54,230Mobile Homes Low Income $44,460 $210 406.362 $85 $44,460 $210 395.617 $83Commercial $66,870,981 $960,612 400.535 $384,759 $68,228,796 $980,561 402.217 $394,398Industrial $962,020 $18,183 388.192 $7,059 $962,020 $18,183 387.640 $7,048New Manufacturing $126,200 $2,385 388.192 $926 $0 $0 - $0Qualified Golf Courses $0 $0 - $0 $0 $0 - $0Remodeled Commercial $0 $0 - $0 $0 $0 - $0Extended Prop Tax Relief Program (Res Only) $0 $0 - $0 $0 $0 - $0 Class 4 Subtotal $110,266,645 $1,553,653 415.053 $644,848 $112,286,089 $1,583,032 414.630 $656,373
CLASS 5Rural Electric and Telephone Co-Op $12,199,647 $365,992 395.575 $144,777 $14,040,300 $421,207 399.827 $168,410Qualified New Industrial $0 $0 - $0 $0 $0 - $0Pollution Control $0 $0 - $0 $0 $0 - $0Gasohol Related $0 $0 - $0 $0 $0 - $0Research and Development $0 $0 - $0 $0 $0 - $0Aluminum Electrolytic Equipment $0 $0 - $0 $0 $0 - $0 Class 5 Subtotal $12,199,647 $365,992 395.575 $144,777 $14,040,300 $421,207 399.827 $168,410
CLASS 7Non-Centrally Assessed Public Util. $0 $0 - $0 $0 $0 - $0
CLASS 8Machinery $8,579,113 $217,735 388.181 $84,521 $3,864,697 $70,517 435.194 $30,688Farm Implements $10,964,808 $165,148 376.695 $62,210 $11,510,745 $173,324 378.056 $65,526Furniture and Fixtures $181,285 $3,012 469.631 $1,415 $156,149 $2,638 446.350 $1,178Other Business Equipment $2,440,466 $55,061 381.812 $21,023 $2,713,098 $62,351 385.417 $24,031 Class 8 Subtotal $22,165,672 $440,955 383.641 $169,168 $18,244,689 $308,830 393.172 $121,423
CLASS 9Utilities $72,678,402 $8,721,409 375.021 $3,270,711 $69,361,639 $8,323,397 376.928 $3,137,322
CLASS 10Timber Land 42,545 $4,780,815 $17,687 370.267 $6,549 42,545 $4,780,815 $17,687 372.513 $6,589
CLASS 12Railroads $0 $0 - $0 $0 $0 - $0Airlines $0 $0 - $0 $0 $0 - $0 Class 12 Subtotal $0 $0 $0 $0 $0 $0
CLASS 13Electrical Generation Property $0 $0 - $0 $0 $0 - $0Telecommunication Property $1,264,930 $75,893 410.712 $31,170 $1,022,076 $61,325 421.780 $25,866Elect Gen/Tele Real Prop New & Exp $0 $0 - $0 $0 $0 - $0 Class 13 Subtotal $1,264,930 $75,893 $31,170 $1,022,076 $61,325 $25,866
CLASS 14Wind Generation $0 $0 - $0 $0 $0 - $0Wind Generation New & Exp $0 $0 - $0 $0 $0 - $0 Class 14 Subtotal $0 $0 $0 $0 $0 $0
CLASS 15Carbon Dioxide and Liquid Pipeline $0 $0 - $0 $0 $0 - $0Carbon Dioxide and Liquid Pipeline (abated) $190,103,650 $2,531,438 387.839 $981,791 $151,127,227 $2,008,864 387.286 $778,005
Total $485,585,339 $15,289,433 382.755 $5,852,107 $443,004,805 $14,307,694 384.477 $5,500,978
ABATED PROPERTY
Current Values of Abated Property $0 $0 - $0 $0 $0 - $0Values Without the Property Abatement $0 $0 - $0 $0 $0 - $0Difference (Property Value Abated) $0 $0 $0 $0 $0 $0
Powder River County
TY 2018TY 2017
1 HILAND CRUDE LLC 2 DENBURY ONSHORE LLC 1 HILAND CRUDE LLC 2 BISON PIPELINE LLC
3 BISON PIPELINE LLC 4 BELLE FOURCHE PIPELINE COMPANY 3 DENBURY ONSHORE LLC 4 BELLE FOURCHE PIPELINE
COMPANY
5 BLACK HILLS POWER & LIGHT CO 6 TONGUE RIVER ELECTRIC COOP INC 5 BLACK HILLS POWER & LIGHT CO 6 TONGUE RIVER ELECTRIC COOP
INC
7 WBI ENERGY TRANSMISSION INC 8 DENBURY GREENCORE PIPELINE COMPANY LLC 7 WBI ENERGY TRANSMISSION INC 8 DENBURY GREENCORE PIPELINE
COMPANY LLC
9 RANGE TELEPHONE COOP INC 10 GAY RANCH INC 9 RANGE TELEPHONE COOP INC 10 GAY RANCH INC
Top 10 Property Owners by Taxable ValueTY 2017 TY 2018
Page 71
232revenue.mt.gov
Property Taxes Paid by County
Acres Assessed Taxable Avg. Mills Taxes Acres Assessed Taxable Avg. Mills TaxesCLASS 1 Net Proceeds $0 $0 - $0 $0 $0 - $0
CLASS 2 Gross Proceeds $0 $0 - $0 $0 $0 - $0
CLASS 3 Agricultural Land:Tillable Irrigated 45,601 $27,936,420 $603,432 563.335 $339,935 45,471 $27,858,403 $601,747 565.637 $340,370Tillable Non-Irrigated 0 $0 $0 - $0 0 $0 $0 - $0Grazing 345,417 $15,009,241 $324,207 547.168 $177,396 345,275 $14,991,835 $323,833 549.210 $177,852Wild Hay 4,383 $1,165,187 $25,168 550.278 $13,849 4,451 $1,175,836 $25,399 551.445 $14,006Non-Qualified Ag Land 20,484 $980,763 $148,322 548.334 $81,330 20,290 $971,444 $146,918 553.759 $81,357Eligible Mining Claims 10 $184 $4 560.741 $2 20 $677 $15 536.246 $8 Class 3 Subtotal $45,091,795 $1,101,133 556.256 $612,512 $44,998,195 $1,097,912 558.873 $613,594
CLASS 4 Land and Improvements:Residential $394,296,439 $5,363,950 602.904 $3,233,945 $398,675,501 $5,402,821 611.937 $3,306,188Residential Low Income $26,188,531 $123,683 649.173 $80,292 $27,914,252 $128,934 658.672 $84,925Mobile Homes $5,352,900 $72,259 566.619 $40,943 $5,736,000 $77,431 578.611 $44,802Mobile Homes Low Income $474,700 $2,113 626.042 $1,323 $928,808 $1,791 628.422 $1,126Commercial $118,758,493 $1,861,345 601.064 $1,118,787 $121,270,742 $1,903,302 610.627 $1,162,208Industrial $604,148 $11,419 547.764 $6,255 $604,148 $11,419 554.637 $6,333New Manufacturing $3,688,250 $69,708 598.917 $41,749 $3,705,400 $70,032 608.022 $42,581Qualified Golf Courses $19,492,550 $185,180 601.146 $111,320 $19,394,368 $184,246 610.840 $112,545Remodeled Commercial $0 $0 - $0 $0 $0 - $0Extended Prop Tax Relief Program (Res Only) $0 $0 - $0 $0 $0 - $0 Class 4 Subtotal $568,856,011 $7,689,657 602.708 $4,634,614 $578,229,219 $7,779,976 611.918 $4,760,709
CLASS 5Rural Electric and Telephone Co-Op $11,171,932 $335,159 534.639 $179,189 $10,716,702 $321,506 536.718 $172,558Qualified New Industrial $0 $0 - $0 $0 $0 - $0Pollution Control $0 $0 - $0 $0 $0 - $0Gasohol Related $0 $0 - $0 $0 $0 - $0Research and Development $0 $0 - $0 $0 $0 - $0Aluminum Electrolytic Equipment $0 $0 - $0 $0 $0 - $0 Class 5 Subtotal $11,171,932 $335,159 534.639 $179,189 $10,716,702 $321,506 536.718 $172,558
CLASS 7Non-Centrally Assessed Public Util. $0 $0 - $0 $0 $0 - $0
CLASS 8Machinery $8,932,736 $135,792 571.925 $77,663 $8,718,079 $132,479 585.193 $77,526Farm Implements $3,350,982 $51,722 560.843 $29,008 $3,965,307 $60,696 566.078 $34,359Furniture and Fixtures $2,387,795 $38,907 639.756 $24,891 $2,386,915 $38,233 627.646 $23,997Other Business Equipment $1,048,795 $15,825 564.899 $8,940 $694,485 $12,025 588.506 $7,077 Class 8 Subtotal $15,720,308 $242,247 579.994 $140,502 $15,764,786 $243,433 587.258 $142,958
CLASS 9Utilities $54,298,736 $6,515,843 567.342 $3,696,713 $53,129,586 $6,375,545 576.790 $3,677,350
CLASS 10Timber Land 197,020 $56,879,005 $210,458 532.765 $112,125 197,259 $56,974,572 $210,812 534.143 $112,604
CLASS 12Railroads $42,906,297 $1,317,222 541.922 $713,832 $39,464,366 $1,231,286 550.043 $677,261Airlines $0 $0 - $0 $0 $0 - $0 Class 12 Subtotal $42,906,297 $1,317,222 $713,832 $39,464,366 $1,231,286 $677,261
CLASS 13Electrical Generation Property $0 $0 - $0 $0 $0 - $0Telecommunication Property $6,132,939 $367,978 583.667 $214,776 $5,326,980 $319,618 593.875 $189,813Elect Gen/Tele Real Prop New & Exp $0 $0 - $0 $356,061 $0 - $0 Class 13 Subtotal $6,132,939 $367,978 $214,776 $5,683,041 $319,618 $189,813
CLASS 14Wind Generation $0 $0 - $0 $0 $0 - $0Wind Generation New & Exp $0 $0 - $0 $0 $0 - $0 Class 14 Subtotal $0 $0 $0 $0 $0 $0
CLASS 15Carbon Dioxide and Liquid Pipeline $0 $0 - $0 $0 $0 - $0Carbon Dioxide and Liquid Pipeline (abated) $0 $0 - $0 $0 $0 - $0
Total $801,057,023 $17,779,697 579.552 $10,304,263 $804,960,467 $17,580,088 588.555 $10,346,846
ABATED PROPERTY
Current Values of Abated Property $0 $0 - $0 $0 $0 - $0Values Without the Property Abatement $0 $0 - $0 $0 $0 - $0Difference (Property Value Abated) $0 $0 $0 $0 $0 $0
Powell County
TY 2018TY 2017
1 NORTHWESTERN ENERGY-T & D 2 MONTANA RAIL LINK 1 NORTHWESTERN ENERGY-T & D 2 MONTANA RAIL LINK
3 PORTLAND GENERAL ELECTRIC COMPANY - TRANSMISSION 4 BNSF RAILWAY CO 3 PORTLAND GENERAL ELECTRIC
COMPANY - TRANSMISSION 4 ROCK CREEK CATTLE COMPANY LTD
5 ROCK CREEK CATTLE COMPANY LTD 6 PACIFICORP - ELECTRIC
TRANSMISSION 5 PACIFICORP - ELECTRIC TRANSMISSION 6 YELLOWSTONE PIPELINE CO
7 YELLOWSTONE PIPELINE CO 8 PUGET SOUND ENERGY INC - TRANSMISSION PROPERTY 7 BNSF RAILWAY CO 8 PUGET SOUND ENERGY INC -
TRANSMISSION PROPERTY
9 MISSOULA ELECTRIC COOPERATIVE INC 10 BLACKFOOT TELEPHONE COOP INC 9 MISSOULA ELECTRIC COOPERATIVE
INC 10 SUN MOUNTAIN LUMBER INC
Top 10 Property Owners by Taxable ValueTY 2017 TY 2018
Page 72
233revenue.mt.gov
Property Taxes Paid by County
Acres Assessed Taxable Avg. Mills Taxes Acres Assessed Taxable Avg. Mills TaxesCLASS 1 Net Proceeds $0 $0 - $0 $0 $0 - $0
CLASS 2 Gross Proceeds $0 $0 - $0 $0 $0 - $0
CLASS 3 Agricultural Land:Tillable Irrigated 14,239 $13,385,474 $289,123 559.888 $161,876 14,230 $13,363,753 $288,654 570.731 $164,744Tillable Non-Irrigated 81,180 $23,030,295 $497,457 558.461 $277,810 81,180 $23,030,290 $497,456 569.302 $283,202Grazing 465,715 $21,817,265 $471,242 558.546 $263,210 465,741 $21,818,307 $471,263 569.386 $268,331Wild Hay 11,901 $2,444,532 $52,806 558.498 $29,492 11,901 $2,444,532 $52,806 569.339 $30,065Non-Qualified Ag Land 649 $31,215 $4,719 558.885 $2,637 649 $31,215 $4,719 569.726 $2,689Eligible Mining Claims 0 $0 $0 - $0 0 $0 $0 - $0 Class 3 Subtotal $60,708,781 $1,315,347 558.808 $735,027 $60,688,097 $1,314,898 569.649 $749,030
CLASS 4 Land and Improvements:Residential $30,673,636 $418,071 681.169 $284,777 $31,005,767 $417,673 694.834 $290,213Residential Low Income $2,453,264 $11,690 698.200 $8,162 $2,224,894 $10,490 707.925 $7,426Mobile Homes $1,622,710 $21,905 566.462 $12,408 $1,589,840 $21,461 594.228 $12,753Mobile Homes Low Income $135,750 $694 689.529 $479 $123,456 $694 715.616 $497Commercial $29,794,710 $416,092 589.329 $245,215 $30,564,702 $428,023 601.189 $257,323Industrial $48,204 $911 609.265 $555 $48,204 $911 621.320 $566New Manufacturing $297,050 $5,614 696.742 $3,912 $297,050 $5,614 710.880 $3,991Qualified Golf Courses $0 $0 - $0 $0 $0 - $0Remodeled Commercial $0 $0 - $0 $0 $0 - $0Extended Prop Tax Relief Program (Res Only) $0 $0 - $0 $0 $0 - $0 Class 4 Subtotal $65,025,324 $874,977 634.882 $555,508 $65,853,913 $884,866 647.294 $572,769
CLASS 5Rural Electric and Telephone Co-Op $4,829,988 $144,898 574.359 $83,223 $5,131,852 $153,955 585.420 $90,128Qualified New Industrial $0 $0 - $0 $0 $0 - $0Pollution Control $0 $0 - $0 $0 $0 - $0Gasohol Related $0 $0 - $0 $0 $0 - $0Research and Development $0 $0 - $0 $0 $0 - $0Aluminum Electrolytic Equipment $0 $0 - $0 $0 $0 - $0 Class 5 Subtotal $4,829,988 $144,898 574.359 $83,223 $5,131,852 $153,955 585.420 $90,128
CLASS 7Non-Centrally Assessed Public Util. $0 $0 - $0 $0 $0 - $0
CLASS 8Machinery $746,680 $12,520 589.734 $7,383 $885,739 $14,315 595.582 $8,526Farm Implements $9,416,564 $142,579 537.459 $76,630 $10,261,539 $157,532 559.592 $88,154Furniture and Fixtures $146,965 $2,287 617.084 $1,411 $122,856 $1,948 633.606 $1,234Other Business Equipment $397,925 $9,049 547.868 $4,957 $423,091 $9,510 562.005 $5,344 Class 8 Subtotal $10,708,134 $166,434 543.051 $90,382 $11,693,225 $183,305 563.315 $103,258
CLASS 9Utilities $7,628,877 $915,464 575.381 $526,740 $7,664,650 $919,758 587.882 $540,709
CLASS 10Timber Land 0 $0 $0 - $0 0 $0 $0 - $0
CLASS 12Railroads $61,788,368 $1,896,904 567.442 $1,076,382 $54,720,367 $1,707,276 578.549 $987,742Airlines $0 $0 - $0 $0 $0 - $0 Class 12 Subtotal $61,788,368 $1,896,904 $1,076,382 $54,720,367 $1,707,276 $987,742
CLASS 13Electrical Generation Property $0 $0 - $0 $0 $0 - $0Telecommunication Property $1,657,825 $99,471 575.557 $57,251 $1,871,112 $112,267 582.326 $65,376Elect Gen/Tele Real Prop New & Exp $0 $0 - $0 $0 $0 - $0 Class 13 Subtotal $1,657,825 $99,471 $57,251 $1,871,112 $112,267 $65,376
CLASS 14Wind Generation $0 $0 - $0 $0 $0 - $0Wind Generation New & Exp $0 $0 - $0 $0 $0 - $0 Class 14 Subtotal $0 $0 $0 $0 $0 $0
CLASS 15Carbon Dioxide and Liquid Pipeline $0 $0 - $0 $0 $0 - $0Carbon Dioxide and Liquid Pipeline (abated) $0 $0 - $0 $0 $0 - $0
Total $212,347,297 $5,413,495 577.171 $3,124,514 $207,623,216 $5,276,325 589.238 $3,109,013
ABATED PROPERTY
Current Values of Abated Property $1,425,590 $9,694 657.775 $6,376 $1,425,590 $9,694 668.615 $6,482Values Without the Property Abatement $1,425,590 $19,495 657.775 $12,823 $1,425,590 $19,245 668.615 $12,868Difference (Property Value Abated) $0 -$9,801 -$6,447 $0 -$9,551 -$6,386
Prairie County
TY 2018TY 2017
1 BNSF RAILWAY CO 2 CENEX PIPELINE LLC 1 BNSF RAILWAY CO 2 CENEX PIPELINE LLC
3 WBI ENERGY TRANSMISSION INC 4 MONTANA DAKOTA UTILITIES - ELECTRIC DISTRIBUTION 3 WBI ENERGY TRANSMISSION INC 4 MONTANA DAKOTA UTILITIES -
ELECTRIC DISTRIBUTION
5 TONGUE RIVER ELECTRIC COOP INC 6 EATON FRANK & SONS 5 TONGUE RIVER ELECTRIC COOP
INC 6 EATON FRANK & SONS
7 MID RIVERS TELEPHONE COOPERATIVE 8 BEEFLAND INC 7 MID RIVERS TELEPHONE
COOPERATIVE 8 BEEFLAND INC
9 BRIDGER PIPELINE LLC 10 SACKMAN INC 9 SACKMAN INC 10 BRIDGER PIPELINE LLC
Top 10 Property Owners by Taxable ValueTY 2017 TY 2018
Page 73
234revenue.mt.gov
Property Taxes Paid by County
Acres Assessed Taxable Avg. Mills Taxes Acres Assessed Taxable Avg. Mills TaxesCLASS 1 Net Proceeds $0 $0 - $0 $0 $0 - $0
CLASS 2 Gross Proceeds $0 $0 - $0 $0 $0 - $0
CLASS 3 Agricultural Land:Tillable Irrigated 44,281 $27,928,319 $603,227 516.879 $311,795 43,936 $27,711,032 $598,531 514.814 $308,132Tillable Non-Irrigated 3,030 $1,126,864 $24,340 530.403 $12,910 3,030 $1,145,176 $24,736 528.257 $13,067Grazing 116,056 $5,314,032 $114,915 514.005 $59,067 116,100 $5,326,663 $115,184 508.210 $58,538Wild Hay 516 $113,603 $2,452 528.710 $1,296 511 $112,453 $2,428 523.780 $1,272Non-Qualified Ag Land 42,630 $2,051,749 $310,274 515.294 $159,882 42,602 $2,050,423 $310,078 509.945 $158,123Eligible Mining Claims 0 $0 $0 - $0 0 $0 $0 - $0 Class 3 Subtotal $36,534,567 $1,055,208 516.439 $544,951 $36,345,747 $1,050,957 512.991 $539,131
CLASS 4 Land and Improvements:Residential $3,658,980,923 $49,577,733 534.195 $26,484,173 $3,780,122,240 $50,752,423 530.533 $26,925,856Residential Low Income $267,272,152 $1,246,009 553.984 $690,269 $271,785,435 $1,250,004 548.086 $685,110Mobile Homes $23,874,350 $321,940 528.967 $170,296 $23,839,710 $321,840 520.071 $167,380Mobile Homes Low Income $3,906,390 $14,711 548.359 $8,067 $15,193,011 $13,428 541.657 $7,273Commercial $934,025,793 $14,977,056 575.606 $8,620,881 $935,717,700 $15,054,152 569.215 $8,569,048Industrial $2,308,710 $43,637 567.749 $24,775 $2,460,062 $46,498 567.064 $26,367New Manufacturing $49,619,501 $937,808 700.564 $656,994 $46,050,801 $870,360 685.479 $596,614Qualified Golf Courses $7,984,509 $75,853 506.350 $38,408 $7,984,509 $75,853 526.672 $39,950Remodeled Commercial $0 $0 - $0 $0 $0 - $0Extended Prop Tax Relief Program (Res Only) $0 $0 - $0 $0 $0 - $0 Class 4 Subtotal $4,947,972,328 $67,194,747 546.082 $36,693,863 $5,083,153,468 $68,384,558 541.315 $37,017,598
CLASS 5Rural Electric and Telephone Co-Op $25,324,314 $759,733 514.065 $390,552 $26,531,903 $795,957 511.250 $406,933Qualified New Industrial $0 $0 - $0 $0 $0 - $0Pollution Control $0 $0 - $0 $0 $0 - $0Gasohol Related $0 $0 - $0 $0 $0 - $0Research and Development $0 $0 - $0 $0 $0 - $0Aluminum Electrolytic Equipment $0 $0 - $0 $0 $0 - $0 Class 5 Subtotal $25,324,314 $759,733 514.065 $390,552 $26,531,903 $795,957 511.250 $406,933
CLASS 7Non-Centrally Assessed Public Util. $0 $0 - $0 $0 $0 - $0
CLASS 8Machinery $51,274,122 $1,227,945 707.598 $868,892 $52,025,397 $1,211,577 686.535 $831,790Farm Implements $2,322,661 $37,212 512.610 $19,075 $2,755,474 $42,249 498.839 $21,075Furniture and Fixtures $13,327,148 $248,603 623.543 $155,015 $14,456,538 $268,522 610.602 $163,960Other Business Equipment $6,413,119 $145,012 687.457 $99,690 $8,456,812 $183,760 662.853 $121,806 Class 8 Subtotal $73,337,050 $1,658,773 688.866 $1,142,672 $77,694,221 $1,706,108 667.386 $1,138,632
CLASS 9Utilities $52,617,261 $6,314,065 561.311 $3,544,154 $53,500,807 $6,420,091 556.259 $3,571,236
CLASS 10Timber Land 96,523 $31,180,968 $115,388 496.360 $57,274 96,420 $30,991,357 $114,687 487.905 $55,956
CLASS 12Railroads $25,365,347 $778,715 523.442 $407,612 $23,719,788 $740,060 517.419 $382,921Airlines $9,563 $294 751.808 $221 $9,379 $293 738.670 $216 Class 12 Subtotal $25,374,910 $779,009 $407,833 $23,729,167 $740,353 $383,138
CLASS 13Electrical Generation Property $0 $0 - $0 $0 $0 - $0Telecommunication Property $26,788,342 $1,607,305 574.809 $923,894 $25,463,209 $1,527,794 558.968 $853,987Elect Gen/Tele Real Prop New & Exp $0 $0 - $0 $0 $0 - $0 Class 13 Subtotal $26,788,342 $1,607,305 $923,894 $25,463,209 $1,527,794 $853,987
CLASS 14Wind Generation $0 $0 - $0 $0 $0 - $0Wind Generation New & Exp $0 $0 - $0 $0 $0 - $0 Class 14 Subtotal $0 $0 $0 $0 $0 $0
CLASS 15Carbon Dioxide and Liquid Pipeline $0 $0 - $0 $0 $0 - $0Carbon Dioxide and Liquid Pipeline (abated) $0 $0 - $0 $0 $0 - $0
Total $5,219,129,740 $79,484,228 549.860 $43,705,192 $5,357,409,879 $80,740,505 544.542 $43,966,612
ABATED PROPERTY
Current Values of Abated Property $0 $0 - $0 $0 $0 - $0Values Without the Property Abatement $0 $0 - $0 $0 $0 - $0Difference (Property Value Abated) $0 $0 $0 $0 $0 $0
Ravalli County
TY 2018TY 2017
1 NORTHWESTERN ENERGY-T & D 2 GLAXO SMITH KLINE BIOLOGICALS 1 NORTHWESTERN ENERGY-T & D 2 GLAXO SMITH KLINE BIOLOGICALS
3 MONTANA RAIL LINK 4 VERIZON WIRELESS 3 MONTANA RAIL LINK 4 RAVALLI COUNTY ELECTRIC COOP INC
5 RAVALLI COUNTY ELECTRIC COOP INC 6 CENTURYLINK INC 5 VERIZON WIRELESS 6 CHARTER COMMUNICATIONS INC
7 CHARTER COMMUNICATIONS INC 8 DOUBLE FORK LLC 7 QWEST CORPORATION AND OR CENTURYLINK INC - 8 STOCK FARM CLUB
9 MD-CDW LLC 10 STOCK FARM CLUB 9 CENTURYLINK INC 10 DOUBLE FORK LLC
Top 10 Property Owners by Taxable ValueTY 2017 TY 2018
Page 74
235revenue.mt.gov
Property Taxes Paid by County
Acres Assessed Taxable Avg. Mills Taxes Acres Assessed Taxable Avg. Mills TaxesCLASS 1 Net Proceeds $0 $0 - $0 $0 $0 - $0
CLASS 2 Gross Proceeds $0 $0 - $0 $0 $0 - $0
CLASS 3 Agricultural Land:Tillable Irrigated 51,200 $39,967,250 $863,290 355.755 $307,119 51,088 $39,947,761 $862,868 438.452 $378,326Tillable Non-Irrigated 384,230 $124,497,173 $2,689,135 308.222 $828,852 383,874 $124,405,451 $2,687,154 392.447 $1,054,565Grazing 720,240 $31,082,282 $671,375 316.931 $212,780 720,834 $31,124,348 $672,287 403.941 $271,564Wild Hay 8,321 $1,729,559 $37,356 307.956 $11,504 8,168 $1,696,503 $36,642 396.849 $14,541Non-Qualified Ag Land 13,185 $634,584 $95,939 337.756 $32,404 13,167 $633,740 $95,809 424.500 $40,671Eligible Mining Claims 0 $0 $0 - $0 0 $0 $0 - $0 Class 3 Subtotal $197,910,848 $4,357,095 319.630 $1,392,659 $197,807,803 $4,354,760 404.079 $1,759,668
CLASS 4 Land and Improvements:Residential $703,747,757 $9,511,746 420.188 $3,996,722 $707,386,535 $9,541,577 475.792 $4,539,805Residential Low Income $12,069,660 $51,600 416.441 $21,488 $12,014,312 $44,036 475.567 $20,942Mobile Homes $28,696,560 $387,399 391.359 $151,612 $27,796,440 $375,245 419.463 $157,401Mobile Homes Low Income $165,080 $538 435.403 $234 $589,099 $652 461.196 $301Commercial $377,733,546 $6,448,517 403.618 $2,602,735 $363,496,562 $6,171,189 463.258 $2,858,852Industrial $9,573,236 $180,937 383.345 $69,361 $9,572,079 $180,915 456.329 $82,557New Manufacturing $75,825,526 $1,322,802 385.261 $509,624 $71,651,662 $1,286,775 455.563 $586,207Qualified Golf Courses $2,518,916 $23,930 371.500 $8,890 $2,518,916 $23,930 457.140 $10,939Remodeled Commercial $189,657 $1,441 601.910 $867 $189,657 $1,441 643.490 $927Extended Prop Tax Relief Program (Res Only) $0 $0 - $0 $0 $0 - $0 Class 4 Subtotal $1,210,519,938 $17,928,910 410.596 $7,361,535 $1,195,215,262 $17,625,760 468.515 $8,257,932
CLASS 5Rural Electric and Telephone Co-Op $51,463,945 $1,543,915 352.073 $543,570 $57,685,450 $1,730,563 429.401 $743,106Qualified New Industrial $11,250 $338 371.500 $126 $184,581 $338 457.140 $155Pollution Control $2,269,712 $68,091 371.500 $25,296 $15,341,338 $69,883 457.140 $31,946Gasohol Related $0 $0 - $0 $0 $0 - $0Research and Development $0 $0 - $0 $0 $0 - $0Aluminum Electrolytic Equipment $0 $0 - $0 $0 $0 - $0 Class 5 Subtotal $53,744,907 $1,612,344 352.897 $568,992 $73,211,369 $1,800,784 430.483 $775,206
CLASS 7Non-Centrally Assessed Public Util. $0 $0 - $0 $0 $0 - $0
CLASS 8Machinery $151,495,020 $3,844,060 329.909 $1,268,191 $170,840,810 $4,342,835 385.354 $1,673,527Farm Implements $22,458,893 $346,549 314.055 $108,835 $22,031,068 $342,537 376.865 $129,090Furniture and Fixtures $9,383,803 $169,558 420.491 $71,298 $9,515,119 $167,460 464.388 $77,766Other Business Equipment $174,709,296 $4,250,155 310.106 $1,317,997 $284,044,548 $7,472,963 361.427 $2,700,929 Class 8 Subtotal $358,047,012 $8,610,322 321.280 $2,766,321 $486,431,545 $12,325,795 371.685 $4,581,313
CLASS 9Utilities $300,072,084 $36,008,647 309.543 $11,146,207 $150,149,441 $18,017,934 419.504 $7,558,601
CLASS 10Timber Land 0 $0 $0 - $0 0 $0 $0 - $0
CLASS 12Railroads $30,788,440 $945,205 375.396 $354,826 $27,259,046 $850,482 445.986 $379,303Airlines $959,967 $29,470 371.328 $10,943 $1,113,657 $34,747 456.984 $15,879 Class 12 Subtotal $31,748,407 $974,675 $365,770 $28,372,703 $885,229 $395,182
CLASS 13Electrical Generation Property $48,359,314 $2,901,560 371.615 $1,078,264 $50,461,329 $3,027,679 457.192 $1,384,231Telecommunication Property $5,927,307 $355,639 381.741 $135,762 $5,985,106 $359,106 453.619 $162,897Elect Gen/Tele Real Prop New & Exp $0 $0 - $0 $0 $0 - $0 Class 13 Subtotal $54,286,621 $3,257,199 $1,214,026 $56,446,435 $3,386,785 $1,547,129
CLASS 14Wind Generation $0 $0 - $0 $0 $0 - $0Wind Generation New & Exp $0 $0 - $0 $0 $0 - $0 Class 14 Subtotal $0 $0 $0 $0 $0 $0
CLASS 15Carbon Dioxide and Liquid Pipeline $0 $0 - $0 $0 $0 - $0Carbon Dioxide and Liquid Pipeline (abated) $0 $0 - $0 $0 $0 - $0
Total $2,206,329,817 $72,749,192 341.110 $24,815,509 $2,187,634,558 $58,397,047 425.964 $24,875,030
ABATED PROPERTY
Current Values of Abated Property $11,924,027 $112,918 552.248 $62,359 $7,364,594 $69,603 594.228 $41,360Values Without the Property Abatement $11,924,027 $225,399 552.248 $124,476 $7,364,594 $139,191 594.228 $82,711Difference (Property Value Abated) $0 -$112,481 -$62,117 $0 -$69,588 -$41,351
Richland County
TY 2018TY 2017
1 HILAND CRUDE LLC 2 ONEOK BAKKEN PIPELINE LLC 1 HILAND CRUDE LLC 2 ONEOK BAKKEN PIPELINE LLC
3 PLAINS PIPELINE LP 4 MONTANA DAKOTA UTILITIES - ELECTRIC GENERATION 3 MONTANA DAKOTA UTILITIES -
ELECTRIC GENERATION 4 ONEOK ROCKIES MIDSTREAM LLC
5 ONEOK ROCKIES MIDSTREAM LLC 6 CONTINENTAL RESOURCES INC 5 XTO ENERGY INC 6 LOWER YELLOWSTONE RURAL ELEC
7 XTO ENERGY INC 8 LOWER YELLOWSTONE RURAL ELEC 7 CONTINENTAL RESOURCES INC 8 PLAINS PIPELINE LP
9 HILAND PARTNERS LLC 10 BRIDGER PIPELINE LLC 9 HILAND PARTNERS LLC 10 TESORO HIGH PLAINS PIPELINE COMPANY
Top 10 Property Owners by Taxable ValueTY 2017 TY 2018
Page 75
236revenue.mt.gov
Property Taxes Paid by County
Acres Assessed Taxable Avg. Mills Taxes Acres Assessed Taxable Avg. Mills TaxesCLASS 1 Net Proceeds $0 $0 - $0 $0 $0 - $0
CLASS 2 Gross Proceeds $0 $0 - $0 $0 $0 - $0
CLASS 3 Agricultural Land:Tillable Irrigated 18,689 $11,305,074 $244,187 528.072 $128,948 18,729 $11,279,477 $243,635 529.225 $128,938Tillable Non-Irrigated 565,710 $194,258,529 $4,196,020 569.145 $2,388,144 565,390 $194,119,141 $4,193,014 571.594 $2,396,702Grazing 435,178 $15,356,179 $331,859 541.244 $179,617 435,313 $15,395,784 $332,727 545.064 $181,357Wild Hay 17,431 $3,697,988 $79,873 547.012 $43,691 17,444 $3,703,282 $79,988 553.234 $44,252Non-Qualified Ag Land 13,861 $650,720 $98,405 558.161 $54,926 13,821 $652,722 $98,708 558.187 $55,098Eligible Mining Claims 0 $0 $0 - $0 0 $0 $0 - $0 Class 3 Subtotal $225,268,490 $4,950,344 564.673 $2,795,326 $225,150,406 $4,948,072 567.160 $2,806,347
CLASS 4 Land and Improvements:Residential $161,494,019 $2,189,598 690.037 $1,510,903 $162,905,550 $2,200,603 711.683 $1,566,131Residential Low Income $3,006,594 $15,375 730.724 $11,235 $3,310,725 $15,798 759.623 $12,001Mobile Homes $10,579,185 $142,816 594.694 $84,932 $9,435,740 $127,380 634.201 $80,784Mobile Homes Low Income $106,090 $431 739.452 $319 $132,560 $319 761.194 $243Commercial $122,600,208 $1,897,273 610.725 $1,158,712 $122,301,312 $1,891,754 622.899 $1,178,371Industrial $1,375,348 $25,992 602.727 $15,666 $1,375,348 $25,992 613.930 $15,957New Manufacturing $61,003,195 $1,082,813 606.431 $656,652 $63,635,890 $1,132,571 609.341 $690,121Qualified Golf Courses $245,550 $2,333 578.600 $1,350 $245,550 $2,333 576.000 $1,344Remodeled Commercial $1,090 $0 - $2 $1,090 $0 - $2Extended Prop Tax Relief Program (Res Only) $0 $0 - $0 $0 $0 - $0 Class 4 Subtotal $360,411,279 $5,356,631 642.152 $3,439,770 $363,343,765 $5,396,750 656.868 $3,544,954
CLASS 5Rural Electric and Telephone Co-Op $88,825,487 $2,206,223 569.738 $1,256,970 $95,676,583 $2,499,321 566.202 $1,415,120Qualified New Industrial $0 $0 - $0 $0 $0 - $0Pollution Control $0 $0 - $0 $0 $0 - $0Gasohol Related $0 $0 - $0 $0 $0 - $0Research and Development $0 $0 - $0 $0 $0 - $0Aluminum Electrolytic Equipment $0 $0 - $0 $0 $0 - $0 Class 5 Subtotal $88,825,487 $2,206,223 569.738 $1,256,970 $95,676,583 $2,499,321 566.202 $1,415,120
CLASS 7Non-Centrally Assessed Public Util. $0 $0 - $0 $0 $0 - $0
CLASS 8Machinery $50,289,460 $1,113,071 480.962 $535,345 $49,454,989 $1,087,492 496.450 $539,885Farm Implements $34,374,773 $539,332 536.061 $289,115 $33,745,359 $534,382 557.029 $297,667Furniture and Fixtures $3,402,441 $60,737 714.202 $43,378 $3,363,508 $57,753 748.041 $43,202Other Business Equipment $41,607,610 $980,025 456.149 $447,037 $44,535,838 $1,072,675 481.004 $515,960 Class 8 Subtotal $129,674,284 $2,693,164 488.227 $1,314,875 $131,099,694 $2,752,302 507.471 $1,396,714
CLASS 9Utilities $132,030,571 $15,843,665 546.307 $8,655,499 $123,063,362 $14,767,606 561.818 $8,296,714
CLASS 10Timber Land 0 $0 $0 - $0 0 $0 $0 - $0
CLASS 12Railroads $127,782,809 $3,922,932 542.580 $2,128,504 $113,070,108 $3,527,791 539.899 $1,904,649Airlines $1,992,159 $61,159 578.600 $35,387 $1,868,563 $58,298 576.000 $33,580 Class 12 Subtotal $129,774,968 $3,984,091 $2,163,891 $114,938,671 $3,586,089 $1,938,229
CLASS 13Electrical Generation Property $0 $0 - $0 $0 $0 - $0Telecommunication Property $9,544,496 $572,670 587.667 $336,539 $8,976,112 $538,563 589.405 $317,432Elect Gen/Tele Real Prop New & Exp $0 $0 - $0 $0 $0 - $0 Class 13 Subtotal $9,544,496 $572,670 $336,539 $8,976,112 $538,563 $317,432
CLASS 14Wind Generation $0 $0 - $0 $0 $0 - $0Wind Generation New & Exp $0 $0 - $0 $0 $0 - $0 Class 14 Subtotal $0 $0 $0 $0 $0 $0
CLASS 15Carbon Dioxide and Liquid Pipeline $0 $0 - $0 $0 $0 - $0Carbon Dioxide and Liquid Pipeline (abated) $0 $0 - $0 $0 $0 - $0
Total $1,075,529,575 $35,606,788 560.648 $19,962,870 $1,062,248,593 $34,488,703 571.651 $19,715,510
ABATED PROPERTY
Current Values of Abated Property $58,414,120 $1,140,863 588.232 $671,092 $69,293,328 $1,554,810 571.739 $888,945Values Without the Property Abatement $58,414,120 $1,669,599 588.232 $982,111 $69,293,328 $1,995,956 571.739 $1,141,165Difference (Property Value Abated) $0 -$528,736 -$311,019 $0 -$441,146 -$252,220
Roosevelt County
TY 2018TY 2017
1 NORTHERN BORDER PIPELINE COMPANY 2 BNSF RAILWAY CO 1 NORTHERN BORDER PIPELINE
COMPANY 2 BNSF RAILWAY CO
3 HILAND CRUDE LLC 4 BASIN ELECTRIC POWER COOPERATIVE 3 BASIN ELECTRIC POWER
COOPERATIVE 4 BRIDGER PIPELINE LLC
5 BRIDGER PIPELINE LLC 6 OASIS PETROLEUM NORTH AMERICA LLP 5 ONEOK BAKKEN PIPELINE LLC 6 MONTANA DAKOTA UTILITIES -
ELECTRIC DISTRIBUTION
7 ONEOK BAKKEN PIPELINE LLC 8 SHERIDAN ELECTRIC CO OP INC 7 SHERIDAN ELECTRIC CO OP INC 8 CENEX HARVEST STATES COOPERATIVES
9 MONTANA DAKOTA UTILITIES - ELECTRIC DISTRIBUTION 10 CENEX HARVEST STATES
COOPERATIVES 9 MONTANA DAKOTA UTILITIES - ELECTRIC TRANSMISSION 10 SAGEBRUSH CELLULAR INC
Top 10 Property Owners by Taxable ValueTY 2017 TY 2018
Page 76
237revenue.mt.gov
Property Taxes Paid by County
Acres Assessed Taxable Avg. Mills Taxes Acres Assessed Taxable Avg. Mills TaxesCLASS 1 Net Proceeds $0 $0 - $0 $0 $0 - $0
CLASS 2 Gross Proceeds $0 $0 - $0 $0 $0 - $0
CLASS 3 Agricultural Land:Tillable Irrigated 32,084 $26,767,092 $578,165 389.302 $225,081 32,087 $26,770,026 $578,229 414.285 $239,551Tillable Non-Irrigated 143,139 $34,544,441 $746,173 368.563 $275,012 142,033 $34,286,788 $740,607 407.302 $301,650Grazing 2,168,837 $80,982,512 $1,749,259 354.754 $620,557 2,169,874 $81,024,434 $1,750,162 380.820 $666,497Wild Hay 24,839 $5,661,040 $122,274 329.106 $40,241 24,753 $5,646,617 $121,963 354.330 $43,215Non-Qualified Ag Land 12,768 $613,705 $92,797 370.075 $34,342 12,916 $620,841 $93,875 399.379 $37,492Eligible Mining Claims 0 $0 $0 - $0 0 $0 $0 - $0 Class 3 Subtotal $148,568,790 $3,288,668 363.440 $1,195,232 $148,348,706 $3,284,836 392.228 $1,288,406
CLASS 4 Land and Improvements:Residential $203,274,901 $2,755,579 423.544 $1,167,110 $205,662,874 $2,778,257 448.151 $1,245,079Residential Low Income $3,327,252 $15,908 554.526 $8,821 $3,613,313 $16,832 567.998 $9,561Mobile Homes $9,750,685 $131,643 387.852 $51,058 $10,061,015 $135,833 374.412 $50,858Mobile Homes Low Income $66,460 $198 391.603 $78 $203,305 $336 390.550 $131Commercial $99,805,819 $1,557,771 427.289 $665,618 $100,109,456 $1,561,382 449.225 $701,411Industrial $13,096,401 $247,520 241.024 $59,658 $13,073,989 $247,096 259.471 $64,114New Manufacturing $26,321,000 $497,467 260.173 $129,428 $25,223,610 $476,726 280.035 $133,500Qualified Golf Courses $0 $0 - $0 $0 $0 - $0Remodeled Commercial $0 $0 - $0 $0 $0 - $0Extended Prop Tax Relief Program (Res Only) $0 $0 - $0 $0 $0 - $0 Class 4 Subtotal $355,642,518 $5,206,086 399.873 $2,081,771 $357,947,562 $5,216,462 422.634 $2,204,653
CLASS 5Rural Electric and Telephone Co-Op $17,054,373 $511,621 400.421 $204,864 $20,042,319 $601,279 428.231 $257,486Qualified New Industrial $0 $0 - $0 $0 $0 - $0Pollution Control $164,401,656 $4,932,049 269.451 $1,328,944 $227,499,487 $4,398,065 300.933 $1,323,524Gasohol Related $0 $0 - $0 $0 $0 - $0Research and Development $0 $0 - $0 $0 $0 - $0Aluminum Electrolytic Equipment $0 $0 - $0 $0 $0 - $0 Class 5 Subtotal $181,456,029 $5,443,670 281.760 $1,533,808 $247,541,806 $4,999,344 316.244 $1,581,010
CLASS 7Non-Centrally Assessed Public Util. $0 $0 - $0 $0 $0 - $0
CLASS 8Machinery $97,286,444 $2,625,216 268.729 $705,473 $101,740,636 $2,729,248 286.045 $780,687Farm Implements $7,066,612 $110,695 372.701 $41,256 $8,449,856 $135,454 382.203 $51,771Furniture and Fixtures $2,796,218 $50,796 407.349 $20,692 $2,386,821 $43,725 390.628 $17,080Other Business Equipment $15,790,415 $440,187 266.962 $117,513 $15,998,731 $447,059 284.486 $127,182 Class 8 Subtotal $122,939,689 $3,226,894 274.237 $884,933 $128,576,044 $3,355,487 291.082 $976,721
CLASS 9Utilities $51,308,867 $6,157,052 307.684 $1,894,427 $49,846,037 $5,981,518 335.883 $2,009,092
CLASS 10Timber Land 43,359 $4,849,114 $17,940 279.706 $5,018 43,359 $4,850,138 $17,945 294.913 $5,292
CLASS 12Railroads $81,076,027 $2,489,038 398.558 $992,026 $71,970,969 $2,245,494 423.934 $951,941Airlines $0 $0 - $0 $0 $0 - $0 Class 12 Subtotal $81,076,027 $2,489,038 $992,026 $71,970,969 $2,245,494 $951,941
CLASS 13Electrical Generation Property $1,142,084,512 $68,525,071 272.814 $18,694,604 $1,084,017,388 $65,041,046 305.221 $19,851,902Telecommunication Property $5,669,657 $340,179 405.813 $138,049 $5,207,990 $312,485 426.435 $133,254Elect Gen/Tele Real Prop New & Exp $0 $0 - $0 $0 $0 - $0 Class 13 Subtotal $1,147,754,169 $68,865,250 $18,832,654 $1,089,225,378 $65,353,531 $19,985,157
CLASS 14Wind Generation $0 $0 - $0 $0 $0 - $0Wind Generation New & Exp $0 $0 - $0 $0 $0 - $0 Class 14 Subtotal $0 $0 $0 $0 $0 $0
CLASS 15Carbon Dioxide and Liquid Pipeline $0 $0 - $0 $0 $0 - $0Carbon Dioxide and Liquid Pipeline (abated) $0 $0 - $0 $0 $0 - $0
Total $2,093,595,203 $94,694,598 289.561 $27,419,870 $2,098,306,640 $90,454,617 320.628 $29,002,272
ABATED PROPERTY
Current Values of Abated Property $0 $0 - $0 $0 $0 - $0Values Without the Property Abatement $0 $0 - $0 $0 $0 - $0Difference (Property Value Abated) $0 $0 $0 $0 $0 $0
Rosebud County
TY 2018TY 2017
1 PUGET SOUND ENERGY INC - ELECTRIC GENERATION 2 AVISTA CORPORATION - ELECTRIC
GENERATION 1 PUGET SOUND ENERGY INC - ELECTRIC GENERATION 2 AVISTA CORPORATION - ELECTRIC
GENERATION
3 PORTLAND GENERAL ELECTRIC COMPANY - ELECTRIC GENERATION 4 NORTHWESTERN ENERGY -
ELECTRIC GENERATION 3 PORTLAND GENERAL ELECTRIC COMPANY - ELECTRIC GENERATION 4 NORTHWESTERN ENERGY -
ELECTRIC GENERATION
5 PACIFICORP - ELECTRIC GENERATION 6 WESTERN ENERGY CO 5 PACIFICORP - ELECTRIC
GENERATION 6 WESTERN ENERGY CO
7 BNSF RAILWAY CO 8 TALEN MONTANA LLC 7 NORTHWESTERN ENERGY-T & D 8 BNSF RAILWAY CO
9 NORTHWESTERN ENERGY-T & D 10 PUGET SOUND ENERGY INC - POLLUTION CONTROL 9 PUGET SOUND ENERGY INC -
POLLUTION CONTROL 10 CENEX PIPELINE LLC
Top 10 Property Owners by Taxable ValueTY 2017 TY 2018
Page 77
238revenue.mt.gov
Property Taxes Paid by County
Acres Assessed Taxable Avg. Mills Taxes Acres Assessed Taxable Avg. Mills TaxesCLASS 1 Net Proceeds $0 $0 - $0 $0 $0 - $0
CLASS 2 Gross Proceeds $0 $0 - $0 $0 $0 - $0
CLASS 3 Agricultural Land:Tillable Irrigated 11,909 $7,762,532 $167,672 924.540 $155,019 11,635 $7,675,237 $165,785 894.680 $148,325Tillable Non-Irrigated 1,139 $682,853 $14,750 540.193 $7,968 1,156 $709,505 $15,326 525.676 $8,057Grazing 120,354 $5,777,697 $124,824 876.121 $109,361 119,779 $5,753,394 $124,299 864.032 $107,398Wild Hay 9,981 $1,707,481 $36,883 784.506 $28,935 9,865 $1,689,772 $36,501 755.774 $27,586Non-Qualified Ag Land 24,896 $1,185,688 $179,279 587.350 $105,300 25,155 $1,201,316 $181,645 580.668 $105,475Eligible Mining Claims 0 $0 $0 - $0 0 $0 $0 - $0 Class 3 Subtotal $17,116,251 $523,408 776.799 $406,583 $17,029,224 $523,556 757.973 $396,841
CLASS 4 Land and Improvements:Residential $858,841,686 $11,594,247 517.994 $6,005,749 $877,388,389 $11,685,442 513.738 $6,003,253Residential Low Income $75,668,324 $324,635 566.898 $184,035 $80,997,395 $337,512 571.414 $192,859Mobile Homes $5,848,900 $78,971 487.876 $38,528 $6,103,680 $82,414 567.224 $46,747Mobile Homes Low Income $565,800 $2,353 538.532 $1,267 $4,242,275 $2,021 671.560 $1,357Commercial $159,620,384 $2,644,114 623.678 $1,649,077 $164,000,426 $2,726,198 619.236 $1,688,160Industrial $383,144 $7,242 472.596 $3,423 $383,144 $7,242 467.981 $3,389New Manufacturing $4,421,090 $83,559 472.596 $39,490 $4,547,290 $85,944 467.981 $40,220Qualified Golf Courses $0 $0 - $0 $0 $0 - $0Remodeled Commercial $0 $0 - $0 $0 $0 - $0Extended Prop Tax Relief Program (Res Only) $0 $0 - $0 $0 $0 - $0 Class 4 Subtotal $1,105,349,328 $14,735,121 537.598 $7,921,568 $1,137,662,599 $14,926,773 534.341 $7,975,986
CLASS 5Rural Electric and Telephone Co-Op $18,132,988 $543,991 499.458 $271,701 $17,945,596 $538,365 507.432 $273,183Qualified New Industrial $0 $0 - $0 $0 $0 - $0Pollution Control $0 $0 - $0 $0 $0 - $0Gasohol Related $0 $0 - $0 $0 $0 - $0Research and Development $0 $0 - $0 $0 $0 - $0Aluminum Electrolytic Equipment $0 $0 - $0 $0 $0 - $0 Class 5 Subtotal $18,132,988 $543,991 499.458 $271,701 $17,945,596 $538,365 507.432 $273,183
CLASS 7Non-Centrally Assessed Public Util. $0 $0 - $0 $0 $0 - $0
CLASS 8Machinery $8,215,132 $125,872 453.400 $57,071 $9,009,192 $137,212 487.879 $66,943Farm Implements $589,090 $9,006 659.787 $5,942 $868,124 $13,986 848.920 $11,873Furniture and Fixtures $1,682,708 $30,910 584.986 $18,082 $1,788,405 $31,000 657.889 $20,394Other Business Equipment $863,729 $13,076 501.604 $6,559 $717,159 $10,793 662.559 $7,151 Class 8 Subtotal $11,350,659 $178,863 490.055 $87,653 $12,382,880 $192,990 551.121 $106,361
CLASS 9Utilities $44,067,875 $5,288,137 486.432 $2,572,318 $48,144,882 $5,777,384 487.597 $2,817,037
CLASS 10Timber Land 264,277 $163,067,605 $603,376 454.469 $274,216 263,996 $159,498,146 $590,174 449.204 $265,109
CLASS 12Railroads $82,967,401 $2,547,099 507.279 $1,292,090 $77,587,242 $2,420,721 509.772 $1,234,015Airlines $2,583 $79 685.716 $54 $2,789 $87 685.881 $60 Class 12 Subtotal $82,969,984 $2,547,178 $1,292,145 $77,590,031 $2,420,808 $1,234,075
CLASS 13Electrical Generation Property $273,786,335 $16,427,179 409.052 $6,719,577 $280,994,585 $16,859,675 403.926 $6,810,053Telecommunication Property $7,621,353 $457,283 571.732 $261,443 $6,899,183 $413,956 562.460 $232,834Elect Gen/Tele Real Prop New & Exp $0 $0 - $0 $0 $0 - $0 Class 13 Subtotal $281,407,688 $16,884,462 $6,981,020 $287,893,768 $17,273,631 $7,042,887
CLASS 14Wind Generation $0 $0 - $0 $0 $0 - $0Wind Generation New & Exp $0 $0 - $0 $0 $0 - $0 Class 14 Subtotal $0 $0 $0 $0 $0 $0
CLASS 15Carbon Dioxide and Liquid Pipeline $0 $0 - $0 $0 $0 - $0Carbon Dioxide and Liquid Pipeline (abated) $0 $0 - $0 $0 $0 - $0
Total $1,723,462,378 $41,304,536 479.541 $19,807,203 $1,758,147,126 $42,243,681 476.083 $20,111,479
ABATED PROPERTY
Current Values of Abated Property $0 $0 - $0 $0 $0 - $0Values Without the Property Abatement $0 $0 - $0 $0 $0 - $0Difference (Property Value Abated) $0 $0 $0 $0 $0 $0
Sanders County
TY 2018TY 2017
1 AVISTA CORPORATION - ELECTRIC GENERATION 2 NORTHWESTERN ENERGY -
ELECTRIC GENERATION 1 AVISTA CORPORATION - ELECTRIC GENERATION 2 NORTHWESTERN ENERGY -
ELECTRIC GENERATION
3 AVISTA CORPORATION - ELECTRIC TRANSMISSION 4 MONTANA RAIL LINK 3 AVISTA CORPORATION - ELECTRIC
TRANSMISSION 4 MONTANA RAIL LINK
5 NORTHWESTERN ENERGY-T & D 6 YELLOWSTONE PIPELINE CO 5 NORTHWESTERN ENERGY-T & D 6 YELLOWSTONE PIPELINE CO
7 BLACKFOOT TELEPHONE COOP INC 8 VERIZON WIRELESS 7 BLACKFOOT TELEPHONE COOP INC 8 NORTHERN LIGHTS INC
9 NORTHERN LIGHTS INC 10 PACIFICORP - ELECTRIC TRANSMISSION 9 VERIZON WIRELESS 10 WEYERHAEUSER COMPANY
Top 10 Property Owners by Taxable ValueTY 2017 TY 2018
Page 78
239revenue.mt.gov
Property Taxes Paid by County
Acres Assessed Taxable Avg. Mills Taxes Acres Assessed Taxable Avg. Mills TaxesCLASS 1 Net Proceeds $0 $0 - $0 $0 $0 - $0
CLASS 2 Gross Proceeds $0 $0 - $0 $0 $0 - $0
CLASS 3 Agricultural Land:Tillable Irrigated 5,833 $4,282,571 $92,505 548.476 $50,737 6,472 $4,706,024 $101,650 562.314 $57,159Tillable Non-Irrigated 598,636 $210,204,162 $4,540,432 588.078 $2,670,127 598,180 $210,157,069 $4,539,415 629.888 $2,859,324Grazing 342,072 $17,868,753 $385,966 586.874 $226,513 342,132 $17,861,667 $385,817 628.880 $242,633Wild Hay 5,001 $1,190,258 $25,717 594.855 $15,298 5,001 $1,190,258 $25,717 639.544 $16,447Non-Qualified Ag Land 3,889 $170,060 $25,713 585.190 $15,047 3,826 $167,042 $25,257 623.393 $15,745Eligible Mining Claims 0 $0 $0 - $0 0 $0 $0 - $0 Class 3 Subtotal $233,715,804 $5,070,333 587.283 $2,977,722 $234,082,060 $5,077,856 628.475 $3,191,308
CLASS 4 Land and Improvements:Residential $148,226,826 $2,010,683 744.648 $1,497,251 $148,987,610 $2,019,149 800.880 $1,617,095Residential Low Income $4,765,509 $20,183 753.882 $15,216 $5,049,246 $20,664 809.124 $16,720Mobile Homes $6,577,180 $88,794 642.976 $57,092 $6,686,773 $90,273 695.021 $62,742Mobile Homes Low Income $32,710 $88 694.930 $61 $79,883 $88 758.835 $67Commercial $113,813,815 $1,712,994 652.010 $1,116,889 $119,283,281 $1,789,321 699.394 $1,251,440Industrial $754,920 $14,265 647.141 $9,231 $761,575 $14,391 684.574 $9,852New Manufacturing $29,469,384 $420,342 854.334 $359,112 $34,008,363 $522,281 892.129 $465,942Qualified Golf Courses $0 $0 - $0 $0 $0 - $0Remodeled Commercial $0 $0 - $0 $0 $0 - $0Extended Prop Tax Relief Program (Res Only) $0 $0 - $0 $0 $0 - $0 Class 4 Subtotal $303,640,344 $4,267,349 715.867 $3,054,852 $314,856,731 $4,456,167 768.341 $3,423,857
CLASS 5Rural Electric and Telephone Co-Op $29,114,328 $873,423 605.000 $528,421 $26,723,837 $801,714 637.802 $511,334Qualified New Industrial $0 $0 - $0 $0 $0 - $0Pollution Control $0 $0 - $0 $0 $0 - $0Gasohol Related $0 $0 - $0 $0 $0 - $0Research and Development $0 $0 - $0 $0 $0 - $0Aluminum Electrolytic Equipment $0 $0 - $0 $0 $0 - $0 Class 5 Subtotal $29,114,328 $873,423 605.000 $528,421 $26,723,837 $801,714 637.802 $511,334
CLASS 7Non-Centrally Assessed Public Util. $0 $0 - $0 $0 $0 - $0
CLASS 8Machinery $8,406,183 $148,458 542.298 $80,508 $6,402,634 $130,044 603.558 $78,489Farm Implements $56,609,524 $850,802 554.621 $471,872 $54,274,199 $816,008 608.684 $496,691Furniture and Fixtures $840,948 $13,197 716.786 $9,459 $896,844 $14,326 772.649 $11,069Other Business Equipment $18,346,482 $285,253 509.432 $145,317 $17,179,601 $317,618 585.426 $185,942 Class 8 Subtotal $84,203,137 $1,297,709 544.927 $707,157 $78,753,278 $1,277,996 604.220 $772,191
CLASS 9Utilities $42,515,321 $5,101,846 607.878 $3,101,302 $34,568,978 $4,148,278 662.245 $2,747,175
CLASS 10Timber Land 0 $0 $0 - $0 0 $0 $0 - $0
CLASS 12Railroads $38,076,548 $1,168,951 609.943 $712,993 $33,638,162 $1,049,512 651.588 $683,850Airlines $826 $25 499.412 $12 $0 $0 - $0 Class 12 Subtotal $38,077,374 $1,168,976 $713,006 $33,638,162 $1,049,512 $683,850
CLASS 13Electrical Generation Property $0 $0 - $0 $0 $0 - $0Telecommunication Property $4,724,720 $283,484 608.312 $172,447 $4,119,877 $247,194 667.027 $164,885Elect Gen/Tele Real Prop New & Exp $0 $0 - $0 $0 $0 - $0 Class 13 Subtotal $4,724,720 $283,484 $172,447 $4,119,877 $247,194 $164,885
CLASS 14Wind Generation $0 $0 - $0 $0 $0 - $0Wind Generation New & Exp $0 $0 - $0 $0 $0 - $0 Class 14 Subtotal $0 $0 $0 $0 $0 $0
CLASS 15Carbon Dioxide and Liquid Pipeline $0 $0 - $0 $0 $0 - $0Carbon Dioxide and Liquid Pipeline (abated) $0 $0 - $0 $0 $0 - $0
Total $735,991,028 $18,063,120 623.088 $11,254,907 $726,742,923 $17,058,717 673.826 $11,494,600
ABATED PROPERTY
Current Values of Abated Property $22,829,888 $275,245 842.667 $231,940 $14,059,862 $143,456 807.517 $115,843Values Without the Property Abatement $22,829,888 $439,725 842.667 $370,542 $14,059,862 $264,876 807.517 $213,892Difference (Property Value Abated) $0 -$164,480 -$138,602 $0 -$121,420 -$98,049
Sheridan County
TY 2018TY 2017
1 PLAINS PIPELINE LP 2 BNSF RAILWAY CO 1 PLAINS PIPELINE LP 2 BNSF RAILWAY CO
3 SHERIDAN ELECTRIC CO OP INC 4 NORTH DAKOTA PIPELINE COMPANY LLC 3 SHERIDAN ELECTRIC CO OP INC 4 NORTH DAKOTA PIPELINE COMPANY
LLC
5 BRIDGER PIPELINE LLC 6 HILAND CRUDE LLC 5 BRIDGER PIPELINE LLC 6 NEW CENTURY AG
7 NEMONT TELEPHONE COOPERATIVE INC 8 NEW CENTURY AG 7 MONTANA DAKOTA UTILITIES -
ELECTRIC DISTRIBUTION 8 NEMONT TELEPHONE COOPERATIVE INC
9 MONTANA DAKOTA UTILITIES - ELECTRIC DISTRIBUTION 10 SAGEBRUSH CELLULAR INC 9 MONTANA DAKOTA UTILITIES -
ELECTRIC TRANSMISSION 10 SAGEBRUSH CELLULAR INC
Top 10 Property Owners by Taxable ValueTY 2017 TY 2018
Page 79
240revenue.mt.gov
Property Taxes Paid by County
Acres Assessed Taxable Avg. Mills Taxes Acres Assessed Taxable Avg. Mills TaxesCLASS 1 Net Proceeds $0 $0 - $0 $0 $0 - $0
CLASS 2 Gross Proceeds $183,671,608 $5,510,148 782.560 $4,312,021 $238,223,021 $7,146,691 804.710 $5,751,014
CLASS 3 Agricultural Land:Tillable Irrigated 3,264 $2,271,918 $49,079 735.411 $36,093 3,259 $2,268,780 $49,011 758.255 $37,163Tillable Non-Irrigated 0 $0 $0 - $0 0 $0 $0 - $0Grazing 99,721 $3,960,022 $85,699 686.213 $58,808 99,389 $3,944,381 $85,361 716.999 $61,204Wild Hay 847 $343,637 $7,424 685.096 $5,086 847 $343,637 $7,424 713.575 $5,298Non-Qualified Ag Land 29,821 $1,409,363 $213,099 703.897 $150,000 29,874 $1,411,654 $213,443 743.289 $158,650Eligible Mining Claims 7,684 $318,771 $6,901 746.039 $5,148 7,716 $318,314 $6,890 777.446 $5,357 Class 3 Subtotal $8,303,711 $362,202 704.400 $255,135 $8,286,766 $362,129 739.158 $267,671
CLASS 4 Land and Improvements:Residential $1,673,333,728 $22,589,369 771.307 $17,423,341 $1,694,952,912 $22,778,789 796.007 $18,132,083Residential Low Income $96,135,335 $432,942 778.170 $336,902 $100,925,519 $458,338 801.617 $367,411Mobile Homes $11,430,100 $154,315 740.740 $114,307 $11,486,580 $155,078 752.704 $116,728Mobile Homes Low Income $903,540 $3,396 735.331 $2,497 $2,747,671 $3,003 752.020 $2,258Commercial $628,614,370 $11,136,911 774.968 $8,630,748 $624,667,571 $11,080,798 799.110 $8,854,772Industrial $4,017,656 $75,932 761.681 $57,836 $4,013,658 $75,857 788.400 $59,806New Manufacturing $106,817,060 $2,018,833 702.666 $1,418,565 $106,542,447 $2,013,654 746.969 $1,504,137Qualified Golf Courses $3,929,083 $37,327 729.030 $27,213 $3,929,083 $37,327 767.559 $28,651Remodeled Commercial $1,399,197 $5,317 1189.858 $6,326 $8,855,997 $67,306 957.110 $64,419Extended Prop Tax Relief Program (Res Only) $0 $0 - $0 $0 $0 - $0 Class 4 Subtotal $2,526,580,069 $36,454,342 768.571 $28,017,737 $2,558,121,438 $36,670,150 794.386 $29,130,265
CLASS 5Rural Electric and Telephone Co-Op $3,374,944 $101,247 693.732 $70,238 $3,544,890 $106,345 713.266 $75,852Qualified New Industrial $0 $0 - $0 $0 $0 - $0Pollution Control $3,844,253 $115,328 669.730 $77,239 $3,462,038 $103,862 723.080 $75,101Gasohol Related $0 $0 - $0 $0 $0 - $0Research and Development $217,450 $5,871 793.952 $4,661 $0 $0 - $0Aluminum Electrolytic Equipment $0 $0 - $0 $0 $0 - $0 Class 5 Subtotal $7,436,647 $222,446 683.933 $152,138 $7,006,928 $210,207 718.115 $150,953
CLASS 7Non-Centrally Assessed Public Util. $0 $0 - $0 $0 $0 - $0
CLASS 8Machinery $259,556,760 $7,220,474 719.820 $5,197,444 $240,003,050 $6,659,687 761.112 $5,068,771Farm Implements $148,236 $2,362 678.475 $1,603 $177,601 $3,076 754.773 $2,322Furniture and Fixtures $29,012,587 $553,918 750.284 $415,596 $26,683,505 $479,277 762.854 $365,618Other Business Equipment $15,195,912 $402,365 727.316 $292,647 $14,812,305 $398,365 761.955 $303,536 Class 8 Subtotal $303,913,495 $8,179,120 722.240 $5,907,290 $281,676,461 $7,540,406 761.265 $5,740,247
CLASS 9Utilities $121,148,604 $14,537,816 770.767 $11,205,271 $123,474,715 $14,816,967 795.746 $11,790,546
CLASS 10Timber Land 32,651 $6,464,672 $23,923 687.281 $16,442 32,620 $6,462,242 $23,913 723.822 $17,309
CLASS 12Railroads $22,336,379 $685,728 698.778 $479,172 $20,164,301 $629,125 740.887 $466,110Airlines $1,654,310 $50,788 782.560 $39,745 $2,032,716 $63,421 804.710 $51,036 Class 12 Subtotal $23,990,689 $736,516 $518,917 $22,197,017 $692,546 $517,146
CLASS 13Electrical Generation Property $10,733,913 $644,035 782.560 $503,996 $9,346,978 $560,819 804.710 $451,297Telecommunication Property $23,725,732 $1,423,543 771.361 $1,098,065 $22,680,285 $1,360,819 791.658 $1,077,303Elect Gen/Tele Real Prop New & Exp $0 $0 - $0 $0 $0 - $0 Class 13 Subtotal $34,459,645 $2,067,578 $1,602,061 $32,027,263 $1,921,638 $1,528,600
CLASS 14Wind Generation $0 $0 - $0 $0 $0 - $0Wind Generation New & Exp $0 $0 - $0 $0 $0 - $0 Class 14 Subtotal $0 $0 $0 $0 $0 $0
CLASS 15Carbon Dioxide and Liquid Pipeline $0 $0 - $0 $0 $0 - $0Carbon Dioxide and Liquid Pipeline (abated) $0 $0 - $0 $0 $0 - $0
Total $3,215,969,140 $68,094,091 763.458 $51,987,012 $3,277,475,851 $69,384,647 791.151 $54,893,750
ABATED PROPERTY
Current Values of Abated Property $1,621,977 $11,279 980.581 $11,060 $8,855,997 $67,306 957.110 $64,419Values Without the Property Abatement $1,621,977 $33,073 980.581 $32,431 $8,855,997 $167,378 957.110 $160,199Difference (Property Value Abated) $0 -$21,794 -$21,371 $0 -$100,072 -$95,780
Silver Bow County
TY 2018TY 2017
1 NORTHWESTERN ENERGY-T & D 2 MONTANA RESOURCES 1 NORTHWESTERN ENERGY-T & D 2 MONTANA RESOURCES
3 REC ADVANCED SILICON MATERIALS LLC 4 BASIN CREEK EQUITY PARTNERS
LLC 3 REC ADVANCED SILICON MATERIALS LLC 4 PRAXAIR INC
5 PRAXAIR INC 6 CHARTER COMMUNICATIONS INC 5 BASIN CREEK EQUITY PARTNERS LLC 6 CHARTER COMMUNICATIONS INC
7 CENTURYLINK INC 8 BNSF RAILWAY CO 7 VERIZON WIRELESS 8 QWEST CORPORATION AND OR CENTURYLINK INC -
9 VERIZON WIRELESS 10 WAL MART STORES INC 9 BNSF RAILWAY CO 10 WAL MART STORES INC
Top 10 Property Owners by Taxable ValueTY 2017 TY 2018
Page 80
241revenue.mt.gov
Property Taxes Paid by County
Acres Assessed Taxable Avg. Mills Taxes Acres Assessed Taxable Avg. Mills TaxesCLASS 1 Net Proceeds $0 $0 - $0 $0 $0 - $0
CLASS 2 Gross Proceeds $195,181,750 $5,855,452 527.049 $3,086,112 $230,837,014 $6,925,109 493.552 $3,417,902
CLASS 3 Agricultural Land:Tillable Irrigated 19,181 $11,753,860 $253,870 501.359 $127,280 19,444 $11,914,777 $257,345 487.652 $125,495Tillable Non-Irrigated 141,250 $28,992,597 $626,233 460.634 $288,464 139,300 $28,471,238 $614,973 456.020 $280,440Grazing 583,402 $27,857,096 $601,793 484.430 $291,526 583,093 $27,843,246 $601,510 470.473 $282,994Wild Hay 41,177 $8,680,430 $187,480 483.850 $90,712 41,188 $8,681,093 $187,495 467.707 $87,693Non-Qualified Ag Land 30,741 $1,478,556 $223,629 503.594 $112,618 30,755 $1,479,240 $223,726 480.151 $107,422Eligible Mining Claims 0 $0 $0 - $0 0 $0 $0 - $0 Class 3 Subtotal $78,762,539 $1,893,005 481.035 $910,601 $78,389,594 $1,885,049 468.977 $884,044
CLASS 4 Land and Improvements:Residential $743,188,363 $10,043,386 522.706 $5,249,737 $760,194,238 $10,223,159 504.886 $5,161,529Residential Low Income $31,526,807 $139,233 541.151 $75,346 $33,250,930 $162,194 523.961 $84,983Mobile Homes $8,291,870 $111,933 504.967 $56,523 $8,898,150 $120,119 522.794 $62,797Mobile Homes Low Income $546,610 $3,378 535.150 $1,808 $1,593,435 $3,127 547.831 $1,713Commercial $211,418,387 $3,168,837 515.840 $1,634,614 $215,801,349 $3,243,134 498.715 $1,617,399Industrial $3,436,837 $64,954 551.885 $35,847 $3,090,325 $58,406 517.261 $30,211New Manufacturing $36,345,540 $686,931 585.243 $402,022 $36,905,470 $697,513 552.096 $385,094Qualified Golf Courses $674,025 $6,403 520.191 $3,331 $674,025 $6,403 486.230 $3,113Remodeled Commercial $0 $0 - $0 $0 $0 - $0Extended Prop Tax Relief Program (Res Only) $0 $0 - $0 $0 $0 - $0 Class 4 Subtotal $1,035,428,439 $14,225,055 524.372 $7,459,227 $1,060,407,922 $14,514,055 506.188 $7,346,840
CLASS 5Rural Electric and Telephone Co-Op $20,040,760 $601,226 488.931 $293,958 $20,135,943 $604,085 471.016 $284,533Qualified New Industrial $0 $0 - $0 $0 $0 - $0Pollution Control $3,684,804 $110,543 527.050 $58,262 $3,670,410 $110,111 493.552 $54,346Gasohol Related $0 $0 - $0 $0 $0 - $0Research and Development $0 $0 - $0 $0 $0 - $0Aluminum Electrolytic Equipment $0 $0 - $0 $0 $0 - $0 Class 5 Subtotal $23,725,564 $711,769 494.851 $352,220 $23,806,353 $714,196 474.490 $338,879
CLASS 7Non-Centrally Assessed Public Util. $0 $0 - $0 $0 $0 - $0
CLASS 8Machinery $191,621,807 $5,528,061 544.681 $3,011,031 $188,247,732 $5,464,440 518.099 $2,831,119Farm Implements $5,439,849 $93,247 500.031 $46,626 $5,110,552 $84,693 495.551 $41,970Furniture and Fixtures $3,431,501 $71,569 579.286 $41,459 $3,033,190 $63,711 584.535 $37,242Other Business Equipment $15,581,108 $430,520 559.894 $241,046 $19,871,168 $554,649 524.103 $290,694 Class 8 Subtotal $216,074,265 $6,123,397 545.475 $3,340,162 $216,262,642 $6,167,493 519.015 $3,201,023
CLASS 9Utilities $80,475,629 $9,657,064 482.949 $4,663,867 $90,278,336 $10,833,387 478.448 $5,183,209
CLASS 10Timber Land 57,646 $6,586,908 $24,390 504.482 $12,304 57,632 $6,586,395 $24,387 480.905 $11,728
CLASS 12Railroads $21,687,885 $665,819 533.525 $355,231 $20,312,837 $633,760 514.451 $326,039Airlines $1,292 $40 627.631 $25 $1,394 $43 602.310 $26 Class 12 Subtotal $21,689,177 $665,859 $355,256 $20,314,231 $633,803 $326,065
CLASS 13Electrical Generation Property $27,390,205 $1,643,412 405.931 $667,111 $26,595,514 $1,595,732 398.760 $636,314Telecommunication Property $7,855,402 $471,315 537.640 $253,398 $7,911,570 $474,691 516.860 $245,349Elect Gen/Tele Real Prop New & Exp $0 $0 - $0 $0 $0 - $0 Class 13 Subtotal $35,245,607 $2,114,727 $920,509 $34,507,084 $2,070,423 $881,663
CLASS 14Wind Generation $0 $0 - $0 $0 $0 - $0Wind Generation New & Exp $0 $0 - $0 $0 $0 - $0 Class 14 Subtotal $0 $0 $0 $0 $0 $0
CLASS 15Carbon Dioxide and Liquid Pipeline $0 $0 - $0 $0 $0 - $0Carbon Dioxide and Liquid Pipeline (abated) $0 $0 - $0 $0 $0 - $0
Total $1,693,169,878 $41,270,718 511.265 $21,100,259 $1,761,389,571 $43,767,902 493.315 $21,591,353
ABATED PROPERTY
Current Values of Abated Property $0 $0 - $0 $0 $0 - $0Values Without the Property Abatement $0 $0 - $0 $0 $0 - $0Difference (Property Value Abated) $0 $0 $0 $0 $0 $0
Stillwater County
TY 2018TY 2017
1 STILLWATER MINING COMPANY 2 NORTHWESTERN ENERGY-T & D 1 STILLWATER MINING COMPANY 2 NORTHWESTERN ENERGY-T & D
3 EXPRESS PIPELINE LLC 4 NORTHWESTERN ENERGY - ELECTRIC GENERATION 3 EXPRESS PIPELINE LLC 4 NORTHWESTERN ENERGY -
ELECTRIC GENERATION
5 MONTANA RAIL LINK 6 FRONT RANGE PIPELINE LLC 5 MONTANA RAIL LINK 6 FRONT RANGE PIPELINE LLC
7 PUGET SOUND ENERGY INC - TRANSMISSION PROPERTY 8 YELLOWSTONE PIPELINE CO 7 YELLOWSTONE PIPELINE CO 8 PUGET SOUND ENERGY INC -
TRANSMISSION PROPERTY
9 PORTLAND GENERAL ELECTRIC COMPANY - TRANSMISSION 10 VERIZON WIRELESS 9 PORTLAND GENERAL ELECTRIC
COMPANY - TRANSMISSION 10 VERIZON WIRELESS
Top 10 Property Owners by Taxable ValueTY 2017 TY 2018
Page 81
242revenue.mt.gov
Property Taxes Paid by County
Acres Assessed Taxable Avg. Mills Taxes Acres Assessed Taxable Avg. Mills TaxesCLASS 1 Net Proceeds $0 $0 - $0 $0 $0 - $0
CLASS 2 Gross Proceeds $172,841,779 $5,185,252 494.414 $2,563,660 $220,125,203 $6,603,756 476.236 $3,144,945
CLASS 3 Agricultural Land:Tillable Irrigated 33,037 $19,911,485 $430,095 487.046 $209,476 33,442 $20,134,906 $434,919 470.297 $204,541Tillable Non-Irrigated 6,680 $1,157,200 $24,996 525.211 $13,128 6,680 $1,157,200 $24,996 501.705 $12,541Grazing 667,825 $44,622,106 $963,847 489.503 $471,806 667,445 $44,592,906 $963,219 472.578 $455,196Wild Hay 19,476 $4,821,504 $104,149 501.525 $52,233 19,401 $4,795,585 $103,588 483.343 $50,069Non-Qualified Ag Land 10,772 $518,457 $78,399 497.571 $39,009 10,702 $515,112 $77,894 477.918 $37,227Eligible Mining Claims 0 $0 $0 - $0 0 $0 $0 - $0 Class 3 Subtotal $71,030,752 $1,601,486 490.578 $785,653 $71,195,709 $1,604,616 473.368 $759,573
CLASS 4 Land and Improvements:Residential $243,259,025 $3,293,676 534.441 $1,760,275 $249,133,584 $3,354,915 516.527 $1,732,903Residential Low Income $14,393,402 $66,726 564.427 $37,662 $13,900,086 $61,285 547.088 $33,528Mobile Homes $3,570,980 $48,209 514.074 $24,783 $3,600,510 $48,606 517.148 $25,137Mobile Homes Low Income $125,270 $375 595.250 $223 $356,390 $338 596.120 $201Commercial $203,620,691 $3,026,956 508.868 $1,540,321 $205,378,731 $3,053,185 492.247 $1,502,922Industrial $2,227,261 $42,097 537.304 $22,619 $2,237,788 $42,296 516.320 $21,838New Manufacturing $12,022,470 $227,224 529.178 $120,242 $12,006,340 $226,799 510.267 $115,728Qualified Golf Courses $923,445 $8,773 505.920 $4,438 $923,445 $8,773 486.330 $4,267Remodeled Commercial $0 $0 - $0 $0 $0 - $0Extended Prop Tax Relief Program (Res Only) $0 $0 - $0 $0 $0 - $0 Class 4 Subtotal $480,142,544 $6,714,036 522.869 $3,510,563 $487,536,874 $6,796,197 505.654 $3,436,524
CLASS 5Rural Electric and Telephone Co-Op $15,225,138 $456,758 508.976 $232,479 $14,577,552 $437,328 491.680 $215,026Qualified New Industrial $0 $0 - $0 $0 $0 - $0Pollution Control $0 $0 - $0 $0 $0 - $0Gasohol Related $0 $0 - $0 $0 $0 - $0Research and Development $0 $0 - $0 $0 $0 - $0Aluminum Electrolytic Equipment $0 $0 - $0 $0 $0 - $0 Class 5 Subtotal $15,225,138 $456,758 508.976 $232,479 $14,577,552 $437,328 491.680 $215,026
CLASS 7Non-Centrally Assessed Public Util. $0 $0 - $0 $0 $0 - $0
CLASS 8Machinery $57,513,934 $1,670,793 521.683 $871,624 $57,234,325 $1,596,931 506.381 $808,656Farm Implements $3,993,143 $61,523 483.575 $29,751 $3,806,129 $58,638 474.991 $27,853Furniture and Fixtures $1,262,160 $25,655 553.976 $14,212 $1,281,117 $26,241 539.358 $14,153Other Business Equipment $4,579,031 $132,411 521.149 $69,006 $4,917,657 $138,974 501.973 $69,761 Class 8 Subtotal $67,348,268 $1,890,382 520.844 $984,594 $67,239,228 $1,820,784 505.509 $920,423
CLASS 9Utilities $17,377,190 $2,085,247 519.425 $1,083,130 $19,600,787 $2,352,099 497.886 $1,171,076
CLASS 10Timber Land 96,826 $12,642,063 $46,794 485.498 $22,718 96,879 $12,652,346 $46,833 469.393 $21,983
CLASS 12Railroads $21,652,509 $664,734 486.472 $323,375 $20,242,630 $631,571 469.362 $296,435Airlines $1,292 $40 596.770 $24 $1,394 $43 580.840 $25 Class 12 Subtotal $21,653,801 $664,774 $323,398 $20,244,024 $631,614 $296,460
CLASS 13Electrical Generation Property $0 $0 - $0 $0 $0 - $0Telecommunication Property $3,572,407 $214,345 512.558 $109,864 $3,725,648 $223,534 495.358 $110,729Elect Gen/Tele Real Prop New & Exp $0 $0 - $0 $0 $0 - $0 Class 13 Subtotal $3,572,407 $214,345 $109,864 $3,725,648 $223,534 $110,729
CLASS 14Wind Generation $0 $0 - $0 $0 $0 - $0Wind Generation New & Exp $0 $0 - $0 $24,820,594 $372,309 587.330 $218,668 Class 14 Subtotal $0 $0 $0 $24,820,594 $372,309 $218,668
CLASS 15Carbon Dioxide and Liquid Pipeline $0 $0 - $0 $0 $0 - $0Carbon Dioxide and Liquid Pipeline (abated) $0 $0 - $0 $0 $0 - $0
Total $861,833,942 $18,859,074 509.890 $9,616,059 $941,717,965 $20,889,070 492.861 $10,295,408
ABATED PROPERTY
Current Values of Abated Property $0 $0 - $0 $28,112,498 $416,069 594.920 $247,528Values Without the Property Abatement $0 $0 - $0 $28,112,498 $832,137 594.920 $495,055Difference (Property Value Abated) $0 $0 $0 $0 -$416,068 -$247,527
Sweet Grass County
TY 2018TY 2017
1 STILLWATER MINING COMPANY 2 NORTHWESTERN ENERGY-T & D 1 STILLWATER MINING COMPANY 2 NORTHWESTERN ENERGY-T & D
3 MONTANA RAIL LINK 4 YELLOWSTONE PIPELINE CO 3 MONTANA RAIL LINK 4 BIG TIMBER WIND LLC
5 TRIANGLE TELEPHONE COOPERATIVE ASSOC INC 6 PARK ELECTRIC CO OP INC 5 YELLOWSTONE PIPELINE CO 6 TRIANGLE TELEPHONE
COOPERATIVE ASSOC INC
7 CREMER RODEO LAND & LIVESTOCK 8 VERIZON WIRELESS 7 CREMER RODEO LAND &
LIVESTOCK 8 BROWNING MICHAEL J TRUSTEE ETAL
9 LEGACY RANCHES PARTNERS LP 10 BURCH ROBERT L & SUSAN S 9 PARK ELECTRIC CO OP INC 10 VERIZON WIRELESS
Top 10 Property Owners by Taxable ValueTY 2017 TY 2018
Page 82
243revenue.mt.gov
Property Taxes Paid by County
Acres Assessed Taxable Avg. Mills Taxes Acres Assessed Taxable Avg. Mills TaxesCLASS 1 Net Proceeds $0 $0 - $0 $0 $0 - $0
CLASS 2 Gross Proceeds $0 $0 - $0 $0 $0 - $0
CLASS 3 Agricultural Land:Tillable Irrigated 120,213 $80,911,304 $1,747,683 522.513 $913,187 120,215 $80,968,895 $1,748,932 541.696 $947,389Tillable Non-Irrigated 394,696 $115,474,651 $2,494,233 465.048 $1,159,937 394,491 $115,420,805 $2,493,070 474.376 $1,182,653Grazing 483,523 $26,566,148 $573,845 485.471 $278,585 483,484 $26,564,871 $573,816 491.160 $281,835Wild Hay 21,924 $7,711,166 $166,561 476.206 $79,317 21,966 $7,722,736 $166,812 479.509 $79,988Non-Qualified Ag Land 9,488 $456,676 $69,048 501.573 $34,633 9,807 $471,999 $71,364 515.892 $36,816Eligible Mining Claims 0 $0 $0 - $0 0 $0 $0 - $0 Class 3 Subtotal $231,119,945 $5,051,370 488.117 $2,465,660 $231,149,306 $5,053,994 500.333 $2,528,681
CLASS 4 Land and Improvements:Residential $271,728,306 $3,683,180 566.218 $2,085,481 $276,524,122 $3,714,905 578.560 $2,149,297Residential Low Income $13,725,215 $65,967 575.505 $37,964 $13,575,831 $60,383 585.076 $35,329Mobile Homes $5,729,290 $76,780 539.186 $41,399 $5,588,260 $74,875 545.022 $40,809Mobile Homes Low Income $396,730 $2,094 518.234 $1,085 $931,182 $1,988 521.917 $1,038Commercial $218,012,737 $3,216,844 527.859 $1,698,041 $222,892,223 $3,289,083 540.873 $1,778,976Industrial $1,491,399 $28,184 551.533 $15,544 $1,352,199 $25,554 573.150 $14,646New Manufacturing $44,034,881 $817,471 536.414 $438,503 $43,925,452 $812,744 550.477 $447,397Qualified Golf Courses $1,136,682 $10,799 580.561 $6,269 $1,136,682 $10,799 591.452 $6,387Remodeled Commercial $0 $0 - $0 $0 $0 - $0Extended Prop Tax Relief Program (Res Only) $0 $0 - $0 $0 $0 - $0 Class 4 Subtotal $556,255,240 $7,901,319 547.287 $4,324,287 $565,925,951 $7,990,331 559.912 $4,473,878
CLASS 5Rural Electric and Telephone Co-Op $25,838,410 $775,143 567.104 $439,586 $27,957,903 $838,739 572.032 $479,785Qualified New Industrial $0 $0 - $0 $0 $0 - $0Pollution Control $0 $0 - $0 $0 $0 - $0Gasohol Related $0 $0 - $0 $0 $0 - $0Research and Development $0 $0 - $0 $0 $0 - $0Aluminum Electrolytic Equipment $0 $0 - $0 $0 $0 - $0 Class 5 Subtotal $25,838,410 $775,143 567.104 $439,586 $27,957,903 $838,739 572.032 $479,785
CLASS 7Non-Centrally Assessed Public Util. $0 $0 - $0 $0 $0 - $0
CLASS 8Machinery $5,704,020 $103,767 532.713 $55,278 $6,269,983 $115,123 528.844 $60,882Farm Implements $23,411,459 $375,117 495.768 $185,971 $24,933,198 $402,904 499.924 $201,421Furniture and Fixtures $1,060,415 $17,897 624.476 $11,177 $754,275 $13,725 642.261 $8,815Other Business Equipment $1,976,191 $31,081 485.399 $15,087 $1,055,236 $16,323 514.286 $8,395 Class 8 Subtotal $32,152,085 $527,862 506.784 $267,512 $33,012,692 $548,075 509.991 $279,513
CLASS 9Utilities $27,756,749 $3,330,801 535.775 $1,784,561 $28,486,753 $3,418,403 543.858 $1,859,124
CLASS 10Timber Land 5,889 $1,276,750 $4,718 477.277 $2,252 5,889 $1,277,031 $4,719 479.712 $2,264
CLASS 12Railroads $52,570,445 $1,613,912 512.456 $827,059 $46,498,514 $1,450,752 527.093 $764,681Airlines $0 $0 - $0 $0 $0 - $0 Class 12 Subtotal $52,570,445 $1,613,912 $827,059 $46,498,514 $1,450,752 $764,681
CLASS 13Electrical Generation Property $0 $0 - $0 $0 $0 - $0Telecommunication Property $2,555,921 $153,361 533.096 $81,756 $2,826,704 $169,607 545.294 $92,486Elect Gen/Tele Real Prop New & Exp $4,223,412 $168,841 643.080 $108,578 $4,080,606 $187,600 637.245 $119,547 Class 13 Subtotal $6,779,333 $322,202 $190,334 $6,907,310 $357,207 $212,033
CLASS 14Wind Generation $17,135,947 $514,078 491.515 $252,677 $16,696,412 $500,892 496.560 $248,723Wind Generation New & Exp $67,114,496 $1,006,717 547.628 $551,307 $65,654,456 $984,817 576.890 $568,131 Class 14 Subtotal $84,250,443 $1,520,795 $803,983 $82,350,868 $1,485,709 $816,854
CLASS 15Carbon Dioxide and Liquid Pipeline $0 $0 - $0 $0 $0 - $0Carbon Dioxide and Liquid Pipeline (abated) $0 $0 - $0 $0 $0 - $0
Total $1,017,999,400 $21,048,122 527.612 $11,105,235 $1,023,566,328 $21,147,929 539.855 $11,416,814
ABATED PROPERTY
Current Values of Abated Property $48,351,239 $821,517 609.521 $500,732 $47,476,449 $828,020 638.543 $528,726Values Without the Property Abatement $48,351,239 $1,559,273 609.521 $950,409 $47,476,449 $1,525,489 638.543 $974,091Difference (Property Value Abated) $0 -$737,755 -$449,677 $0 -$697,469 -$445,364
Teton County
TY 2018TY 2017
1 NORTHWESTERN ENERGY-T & D 2 BNSF RAILWAY CO 1 NORTHWESTERN ENERGY-T & D 2 BNSF RAILWAY CO
3 GREENFIELD WIND LLC 4 FAIRFIELD WIND OWNER LLC 3 GREENFIELD WIND LLC 4 PHILLIPS 66 CARRIER LLC
5 3 RIVERS TELEPHONE COOPERATIVE INC 6 PHILLIPS 66 CARRIER LLC 5 3 RIVERS TELEPHONE
COOPERATIVE INC 6 FAIRFIELD WIND OWNER LLC
7 FRONT RANGE PIPELINE LLC 8 MILLERCOORS LLC 7 MOUNTAIN VIEW CO-OP 8 MILLERCOORS USA LLC
9 MONTANA ALBERTA TIE LIMITED (M.A.T.L.) 10 MOUNTAIN VIEW CO-OP 9 MONTANA ALBERTA TIE LIMITED
(M.A.T.L.) 10 FRONT RANGE PIPELINE LLC
Top 10 Property Owners by Taxable ValueTY 2017 TY 2018
Page 83
244revenue.mt.gov
Property Taxes Paid by County
Acres Assessed Taxable Avg. Mills Taxes Acres Assessed Taxable Avg. Mills TaxesCLASS 1 Net Proceeds $0 $0 - $0 $0 $0 - $0
CLASS 2 Gross Proceeds $0 $0 - $0 $0 $0 - $0
CLASS 3 Agricultural Land:Tillable Irrigated 2,110 $1,283,946 $27,732 589.362 $16,344 2,110 $1,283,946 $27,732 593.520 $16,459Tillable Non-Irrigated 700,804 $213,492,185 $4,611,447 558.493 $2,575,459 700,744 $213,474,919 $4,611,071 560.736 $2,585,595Grazing 363,410 $18,554,250 $400,890 552.420 $221,459 362,968 $18,530,561 $400,375 554.042 $221,824Wild Hay 7,602 $2,001,697 $43,235 542.652 $23,462 7,640 $2,012,607 $43,470 543.705 $23,635Non-Qualified Ag Land 6,221 $308,572 $46,646 585.821 $27,326 6,191 $307,123 $46,428 591.292 $27,452Eligible Mining Claims 0 $0 $0 - $0 0 $0 $0 - $0 Class 3 Subtotal $235,640,650 $5,129,950 558.300 $2,864,050 $235,609,156 $5,129,076 560.523 $2,874,966
CLASS 4 Land and Improvements:Residential $142,711,115 $1,932,426 799.349 $1,544,682 $143,351,978 $1,932,032 806.043 $1,557,301Residential Low Income $4,789,848 $19,147 847.282 $16,223 $4,884,521 $20,445 855.411 $17,489Mobile Homes $2,595,630 $35,041 637.159 $22,327 $2,673,060 $36,087 706.674 $25,502Mobile Homes Low Income $93,090 $404 767.997 $310 $213,035 $404 854.832 $345Commercial $180,342,804 $2,921,070 723.149 $2,112,368 $190,351,770 $3,058,756 724.160 $2,215,029Industrial $344,189 $6,505 634.798 $4,129 $344,189 $6,505 638.604 $4,154New Manufacturing $24,777,211 $383,373 754.005 $289,065 $24,777,211 $383,373 759.706 $291,251Qualified Golf Courses $0 $0 - $0 $0 $0 - $0Remodeled Commercial $0 $0 - $0 $0 $0 - $0Extended Prop Tax Relief Program (Res Only) $0 $0 - $0 $0 $0 - $0 Class 4 Subtotal $355,653,887 $5,297,966 752.950 $3,989,104 $366,595,764 $5,437,602 756.045 $4,111,070
CLASS 5Rural Electric and Telephone Co-Op $17,658,835 $529,769 641.777 $339,993 $16,820,547 $504,615 646.911 $326,441Qualified New Industrial $0 $0 - $0 $0 $0 - $0Pollution Control $0 $0 - $0 $0 $0 - $0Gasohol Related $0 $0 - $0 $0 $0 - $0Research and Development $0 $0 - $0 $0 $0 - $0Aluminum Electrolytic Equipment $0 $0 - $0 $0 $0 - $0 Class 5 Subtotal $17,658,835 $529,769 641.777 $339,993 $16,820,547 $504,615 646.911 $326,441
CLASS 7Non-Centrally Assessed Public Util. $0 $0 - $0 $39,451 $3,156 871.953 $2,752
CLASS 8Machinery $6,295,616 $99,193 588.380 $58,363 $8,848,779 $137,154 668.153 $91,640Farm Implements $26,152,124 $408,333 525.441 $214,555 $25,762,765 $399,595 562.612 $224,817Furniture and Fixtures $2,694,465 $52,188 757.942 $39,556 $2,604,024 $49,677 837.701 $41,615Other Business Equipment $5,484,446 $83,561 554.549 $46,339 $5,411,810 $83,119 591.477 $49,163 Class 8 Subtotal $40,626,651 $643,275 557.790 $358,812 $42,627,378 $669,544 608.225 $407,234
CLASS 9Utilities $25,100,422 $3,012,050 543.336 $1,636,554 $24,117,854 $2,894,136 545.044 $1,577,430
CLASS 10Timber Land 0 $0 $0 - $0 0 $0 $0 - $0
CLASS 12Railroads $92,971,687 $2,854,231 604.256 $1,724,687 $82,363,080 $2,569,727 608.832 $1,564,531Airlines $3,105 $96 863.853 $83 $1,394 $43 871.953 $37 Class 12 Subtotal $92,974,792 $2,854,327 $1,724,770 $82,364,474 $2,569,770 $1,564,569
CLASS 13Electrical Generation Property $0 $0 - $0 $0 $0 - $0Telecommunication Property $3,623,837 $217,423 689.495 $149,912 $3,757,214 $225,435 668.422 $150,686Elect Gen/Tele Real Prop New & Exp $0 $0 - $0 $0 $0 - $0 Class 13 Subtotal $3,623,837 $217,423 $149,912 $3,757,214 $225,435 $150,686
CLASS 14Wind Generation $0 $0 - $0 $62,000,001 $1,859,999 666.045 $1,238,843Wind Generation New & Exp $315,631,994 $6,150,113 655.885 $4,033,764 $188,321,408 $3,609,027 617.163 $2,227,358 Class 14 Subtotal $315,631,994 $6,150,113 $4,033,764 $250,321,409 $5,469,026 $3,466,201
CLASS 15Carbon Dioxide and Liquid Pipeline $0 $0 - $0 $0 $0 - $0Carbon Dioxide and Liquid Pipeline (abated) $0 $0 - $0 $0 $0 - $0
Total $1,086,911,068 $23,834,873 633.398 $15,096,961 $1,022,253,247 $22,902,360 632.308 $14,481,349
ABATED PROPERTY
Current Values of Abated Property $324,665,776 $6,235,934 655.608 $4,088,327 $197,355,190 $3,694,848 617.609 $2,281,972Values Without the Property Abatement $324,665,776 $9,639,723 655.608 $6,319,877 $197,355,190 $5,820,381 617.609 $3,594,720Difference (Property Value Abated) $0 -$3,403,789 -$2,231,551 $0 -$2,125,533 -$1,312,748
Toole County
TY 2018TY 2017
1 BNSF RAILWAY CO 2 NATURENER RIM ROCK WIND ENERGY LLC 1 NATURENER RIM ROCK WIND
ENERGY LLC 2 BNSF RAILWAY CO
3 NORTHWESTERN ENERGY-T & D 4 NATURENER GLACIER WIND ENERGY 1 LLC 3 NORTHWESTERN ENERGY-T & D 4 NATURENER GLACIER WIND
ENERGY 1 LLC
5 NATURENER GLACIER WIND ENERGY 2 LLC 6 CORRECTIONS CORPORATION OF
AMERICA 5 NATURENER GLACIER WIND ENERGY 2 LLC 6 CORRECTIONS CORPORATION OF
AMERICA
7 FRONT RANGE PIPELINE LLC 8 MARIAS RIVER ELEC COOP 7 FRONT RANGE PIPELINE LLC 8 MARIAS RIVER ELEC COOP
9 NORTHERN TELEPHONE COOPERATIVE INC 10 CHS INC 9 BIG ROSE COLONY INC 10 CHS INC
Top 10 Property Owners by Taxable ValueTY 2017 TY 2018
Page 84
245revenue.mt.gov
Property Taxes Paid by County
Acres Assessed Taxable Avg. Mills Taxes Acres Assessed Taxable Avg. Mills TaxesCLASS 1 Net Proceeds $0 $0 - $0 $0 $0 - $0
CLASS 2 Gross Proceeds $0 $0 - $0 $0 $0 - $0
CLASS 3 Agricultural Land:Tillable Irrigated 22,061 $20,821,342 $449,745 442.232 $198,891 22,062 $20,780,664 $448,865 467.545 $209,865Tillable Non-Irrigated 11,956 $2,581,453 $55,769 442.291 $24,666 11,960 $2,580,986 $55,759 467.598 $26,073Grazing 524,221 $20,327,497 $439,079 442.541 $194,311 524,213 $20,325,972 $439,045 467.831 $205,399Wild Hay 6,395 $1,494,788 $32,292 441.171 $14,246 6,362 $1,487,932 $32,143 466.556 $14,997Non-Qualified Ag Land 1,446 $69,594 $10,522 442.422 $4,655 1,535 $73,900 $11,173 467.651 $5,225Eligible Mining Claims 0 $0 $0 - $0 0 $0 $0 - $0 Class 3 Subtotal $45,294,674 $987,407 442.340 $436,770 $45,249,454 $986,985 467.644 $461,558
CLASS 4 Land and Improvements:Residential $15,755,109 $216,554 675.038 $146,182 $15,654,029 $215,209 700.582 $150,772Residential Low Income $559,390 $4,022 805.355 $3,239 $749,070 $5,020 835.970 $4,197Mobile Homes $1,910,360 $25,791 520.524 $13,425 $1,961,580 $26,483 552.573 $14,634Mobile Homes Low Income $41,270 $111 403.115 $45 $66,900 $180 578.566 $104Commercial $26,301,760 $372,615 482.098 $179,637 $27,685,513 $391,034 506.065 $197,889Industrial $69,491 $1,314 441.165 $580 $69,491 $1,314 466.550 $613New Manufacturing $1,192,615 $22,540 441.165 $9,944 $1,192,615 $22,540 466.550 $10,516Qualified Golf Courses $0 $0 - $0 $0 $0 - $0Remodeled Commercial $0 $0 - $0 $0 $0 - $0Extended Prop Tax Relief Program (Res Only) $0 $0 - $0 $0 $0 - $0 Class 4 Subtotal $45,829,995 $642,947 549.114 $353,051 $47,379,198 $661,780 572.281 $378,724
CLASS 5Rural Electric and Telephone Co-Op $4,647,264 $139,419 505.976 $70,543 $5,959,903 $178,797 535.333 $95,716Qualified New Industrial $0 $0 - $0 $0 $0 - $0Pollution Control $0 $0 - $0 $0 $0 - $0Gasohol Related $0 $0 - $0 $0 $0 - $0Research and Development $0 $0 - $0 $0 $0 - $0Aluminum Electrolytic Equipment $0 $0 - $0 $0 $0 - $0 Class 5 Subtotal $4,647,264 $139,419 505.976 $70,543 $5,959,903 $178,797 535.333 $95,716
CLASS 7Non-Centrally Assessed Public Util. $0 $0 - $0 $0 $0 - $0
CLASS 8Machinery $1,288,003 $20,052 426.773 $8,558 $1,315,338 $20,554 453.368 $9,318Farm Implements $7,497,480 $119,397 416.095 $49,680 $7,713,767 $122,198 449.117 $54,881Furniture and Fixtures $123,963 $1,905 538.569 $1,026 $144,633 $2,201 562.617 $1,239Other Business Equipment $397,813 $5,977 503.148 $3,007 $192,722 $2,890 611.154 $1,766 Class 8 Subtotal $9,307,259 $147,331 422.664 $62,271 $9,366,460 $147,843 454.566 $67,204
CLASS 9Utilities $15,126,860 $1,815,222 441.165 $800,812 $14,144,634 $1,697,355 466.550 $791,901
CLASS 10Timber Land 1,840 $155,474 $575 441.165 $254 1,840 $155,474 $575 466.550 $268
CLASS 12Railroads $51,166,864 $1,570,822 441.165 $692,991 $45,330,277 $1,414,305 466.550 $659,844Airlines $0 $0 - $0 $0 $0 - $0 Class 12 Subtotal $51,166,864 $1,570,822 $692,991 $45,330,277 $1,414,305 $659,844
CLASS 13Electrical Generation Property $0 $0 - $0 $0 $0 - $0Telecommunication Property $810,503 $48,629 449.274 $21,848 $890,636 $53,439 483.295 $25,827Elect Gen/Tele Real Prop New & Exp $0 $0 - $0 $0 $0 - $0 Class 13 Subtotal $810,503 $48,629 $21,848 $890,636 $53,439 $25,827
CLASS 14Wind Generation $0 $0 - $0 $0 $0 - $0Wind Generation New & Exp $0 $0 - $0 $0 $0 - $0 Class 14 Subtotal $0 $0 $0 $0 $0 $0
CLASS 15Carbon Dioxide and Liquid Pipeline $0 $0 - $0 $0 $0 - $0Carbon Dioxide and Liquid Pipeline (abated) $0 $0 - $0 $0 $0 - $0
Total $172,338,893 $5,352,352 455.601 $2,438,539 $168,476,036 $5,141,079 482.592 $2,481,042
ABATED PROPERTY
Current Values of Abated Property $0 $0 - $0 $0 $0 - $0Values Without the Property Abatement $0 $0 - $0 $0 $0 - $0Difference (Property Value Abated) $0 $0 $0 $0 $0 $0
Treasure County
TY 2018TY 2017
1 BNSF RAILWAY CO 2 CENEX PIPELINE LLC 1 BNSF RAILWAY CO 2 CENEX PIPELINE LLC
3 NORTHWESTERN ENERGY-T & D 4 PUGET SOUND ENERGY INC - TRANSMISSION PROPERTY 3 NORTHWESTERN ENERGY-T & D 4 PUGET SOUND ENERGY INC -
TRANSMISSION PROPERTY
5 PORTLAND GENERAL ELECTRIC COMPANY - TRANSMISSION 6 AVISTA CORPORATION - ELECTRIC
TRANSMISSION 5 PORTLAND GENERAL ELECTRIC COMPANY - TRANSMISSION 6 AVISTA CORPORATION - ELECTRIC
TRANSMISSION
7 PACIFICORP - ELECTRIC TRANSMISSION 8 CIRCLE B LLC 7 MID YELLOWSTONE ELECTRIC
COOP INC 8 PACIFICORP - ELECTRIC TRANSMISSION
9 MID YELLOWSTONE ELECTRIC COOP INC 10 PV RANCH COMPANY LLC 9 CIRCLE B LLC 10 RANGE TELEPHONE COOP INC
Top 10 Property Owners by Taxable ValueTY 2017 TY 2018
Page 85
246revenue.mt.gov
Acres Assessed Taxable Avg. Mills Taxes Acres Assessed Taxable Avg. Mills TaxesCLASS 1 Net Proceeds $0 $0 - $0 $0 $0 - $0
CLASS 2 Gross Proceeds $0 $0 - $0 $0 $0 - $0
CLASS 3 Agricultural Land:Tillable Irrigated 45,255 $32,147,095 $694,364 519.892 $360,994 45,254 $32,146,974 $694,361 521.434 $362,064Tillable Non-Irrigated 654,316 $184,056,689 $3,975,646 509.608 $2,026,022 653,483 $183,868,565 $3,971,584 531.934 $2,112,619Grazing 746,896 $34,582,284 $747,099 510.862 $381,665 748,013 $34,628,352 $748,097 521.781 $390,343Wild Hay 7,480 $1,763,114 $38,084 507.525 $19,329 7,480 $1,763,114 $38,084 518.997 $19,765Non-Qualified Ag Land 8,087 $374,183 $56,573 543.415 $30,743 7,848 $362,674 $54,833 547.015 $29,994Eligible Mining Claims 0 $0 $0 - $0 0 $0 $0 - $0 Class 3 Subtotal $252,923,365 $5,511,766 511.406 $2,818,752 $252,769,679 $5,506,959 529.291 $2,914,786
CLASS 4 Land and Improvements:Residential $385,875,192 $5,219,445 653.676 $3,411,824 $391,158,965 $5,280,554 658.827 $3,478,973Residential Low Income $12,192,228 $56,074 711.254 $39,883 $13,520,919 $62,854 700.765 $44,046Mobile Homes $3,756,300 $50,711 551.836 $27,984 $3,728,170 $50,330 553.922 $27,879Mobile Homes Low Income $81,640 $426 634.700 $270 $222,190 $356 594.437 $212Commercial $185,761,855 $2,975,828 620.958 $1,847,864 $189,066,411 $3,021,449 629.707 $1,902,627Industrial $385,104 $7,279 693.732 $5,050 $416,181 $7,866 688.226 $5,414New Manufacturing $18,275,820 $345,413 505.920 $174,751 $18,106,517 $342,212 517.645 $177,144Qualified Golf Courses $806,034 $7,326 559.603 $4,100 $806,034 $7,326 562.498 $4,121Remodeled Commercial $0 $0 - $0 $0 $0 - $0Extended Prop Tax Relief Program (Res Only) $0 $0 - $0 $0 $0 - $0 Class 4 Subtotal $607,134,173 $8,662,502 636.274 $5,511,726 $617,025,387 $8,772,947 642.933 $5,640,415
CLASS 5Rural Electric and Telephone Co-Op $30,230,284 $906,915 569.430 $516,425 $27,186,300 $815,585 577.514 $471,012Qualified New Industrial $0 $0 - $0 $0 $0 - $0Pollution Control $0 $0 - $0 $0 $0 - $0Gasohol Related $0 $0 - $0 $0 $0 - $0Research and Development $0 $0 - $0 $0 $0 - $0Aluminum Electrolytic Equipment $0 $0 - $0 $0 $0 - $0 Class 5 Subtotal $30,230,284 $906,915 569.430 $516,425 $27,186,300 $815,585 577.514 $471,012
CLASS 7Non-Centrally Assessed Public Util. $0 $0 - $0 $0 $0 - $0
CLASS 8Machinery $9,686,649 $187,129 513.004 $95,998 $8,286,179 $126,306 527.593 $66,638Farm Implements $36,281,730 $569,949 502.975 $286,670 $35,340,853 $551,934 510.308 $281,657Furniture and Fixtures $4,564,932 $91,009 672.177 $61,174 $5,641,871 $109,979 676.141 $74,362Other Business Equipment $3,007,945 $50,067 556.016 $27,838 $2,182,909 $37,037 557.033 $20,631 Class 8 Subtotal $53,541,256 $898,154 525.166 $471,680 $51,451,812 $825,256 537.151 $443,287
CLASS 9Utilities $97,613,190 $11,713,575 549.619 $6,438,009 $98,133,521 $11,776,021 553.034 $6,512,544
CLASS 10Timber Land 0 $0 $0 - $0 0 $0 $0 - $0
CLASS 12Railroads $95,059,148 $2,918,316 552.444 $1,612,205 $84,230,821 $2,628,001 553.795 $1,455,373Airlines $396,165 $12,162 559.603 $6,806 $443,150 $13,826 558.030 $7,715 Class 12 Subtotal $95,455,313 $2,930,478 $1,619,011 $84,673,971 $2,641,827 $1,463,088
CLASS 13Electrical Generation Property $0 $0 - $0 $0 $0 - $0Telecommunication Property $18,438,986 $1,106,350 677.127 $749,140 $17,985,590 $1,079,129 672.926 $726,174Elect Gen/Tele Real Prop New & Exp $0 $0 - $0 $0 $0 - $0 Class 13 Subtotal $18,438,986 $1,106,350 $749,140 $17,985,590 $1,079,129 $726,174
CLASS 14Wind Generation $0 $0 - $0 $0 $0 - $0Wind Generation New & Exp $0 $0 - $0 $0 $0 - $0 Class 14 Subtotal $0 $0 $0 $0 $0 $0
CLASS 15Carbon Dioxide and Liquid Pipeline $0 $0 - $0 $0 $0 - $0Carbon Dioxide and Liquid Pipeline (abated) $0 $0 - $0 $0 $0 - $0
Total $1,155,336,567 $31,729,740 571.223 $18,124,743 $1,149,226,260 $31,417,724 578.378 $18,171,306
ABATED PROPERTY
Current Values of Abated Property $0 $0 - $0 $174,930 $1,329 582.660 $774Values Without the Property Abatement $0 $0 - $0 $174,930 $1,653 582.660 $963Difference (Property Value Abated) $0 $0 $0 $0 -$324 -$189
Valley County
TY 2018TY 2017
1 NORTHERN BORDER PIPELINE COMPANY 2 BNSF RAILWAY CO 1 NORTHERN BORDER PIPELINE
COMPANY 2 BNSF RAILWAY CO
3 WBI ENERGY TRANSMISSION INC 4 NORTHWESTERN ENERGY-T & D 3 WBI ENERGY TRANSMISSION INC 4 NORTHWESTERN ENERGY-T & D
5 SAGEBRUSH CELLULAR INC 6 NORVAL ELECTRIC COOPERATIVE INC 5 SAGEBRUSH CELLULAR INC 6 NORVAL ELECTRIC COOPERATIVE
INC
7 NEMONT TELEPHONE COOPERATIVE INC 8 MONTANA AVIATION RESEARCH
COMPANY 7 NEMONT TELEPHONE COOPERATIVE INC 8 MONTANA AVIATION RESEARCH
COMPANY
9 EGT LLC 10 WBI ENERGY MIDSTREAM LLC 9 EGT LLC 10 MONTANA DAKOTA UTILITIES - GAS DISTRIBUTION
Top 10 Property Owners by Taxable ValueTY 2017 TY 2018
Property Taxes Paid by County
Page 86
247revenue.mt.gov
Acres Assessed Taxable Avg. Mills Taxes Acres Assessed Taxable Avg. Mills TaxesCLASS 1 Net Proceeds $0 $0 - $0 $0 $0 - $0
CLASS 2 Gross Proceeds $0 $0 - $0 $0 $0 - $0
CLASS 3 Agricultural Land:Tillable Irrigated 26,046 $15,790,189 $341,066 452.829 $154,445 26,681 $16,171,717 $349,306 447.749 $156,402Tillable Non-Irrigated 102,204 $22,386,164 $483,546 439.971 $212,746 101,799 $22,283,596 $481,330 430.270 $207,102Grazing 582,500 $30,254,857 $653,498 446.111 $291,532 582,177 $30,237,515 $653,122 438.597 $286,457Wild Hay 27,328 $6,549,585 $141,470 434.580 $61,480 27,078 $6,489,046 $140,163 422.839 $59,266Non-Qualified Ag Land 6,587 $317,049 $47,945 449.194 $21,537 6,814 $327,970 $49,596 442.503 $21,946Eligible Mining Claims 0 $0 $0 - $0 0 $0 $0 - $0 Class 3 Subtotal $75,297,844 $1,667,525 444.815 $741,740 $75,509,844 $1,673,517 436.908 $731,174
CLASS 4 Land and Improvements:Residential $63,467,315 $859,746 538.324 $462,822 $65,423,274 $880,056 536.188 $471,875Residential Low Income $3,372,048 $18,897 561.302 $10,607 $2,953,087 $13,232 557.825 $7,381Mobile Homes $996,550 $13,452 462.110 $6,216 $1,347,610 $18,193 469.209 $8,536Mobile Homes Low Income $14,650 $40 512.657 $21 $82,100 $40 520.710 $21Commercial $64,080,607 $930,037 477.438 $444,035 $63,209,106 $921,381 475.153 $437,797Industrial $84,842 $1,604 457.357 $734 $84,842 $1,604 453.680 $728New Manufacturing $206,660 $3,906 457.357 $1,786 $206,660 $3,906 453.680 $1,772Qualified Golf Courses $0 $0 - $0 $0 $0 - $0Remodeled Commercial $0 $0 - $0 $0 $0 - $0Extended Prop Tax Relief Program (Res Only) $0 $0 - $0 $0 $0 - $0 Class 4 Subtotal $132,222,672 $1,827,682 506.773 $926,221 $133,306,679 $1,838,412 504.844 $928,110
CLASS 5Rural Electric and Telephone Co-Op $6,497,129 $194,912 467.134 $91,050 $7,592,278 $227,768 455.450 $103,737Qualified New Industrial $0 $0 - $0 $0 $0 - $0Pollution Control $0 $0 - $0 $0 $0 - $0Gasohol Related $0 $0 - $0 $0 $0 - $0Research and Development $0 $0 - $0 $0 $0 - $0Aluminum Electrolytic Equipment $0 $0 - $0 $0 $0 - $0 Class 5 Subtotal $6,497,129 $194,912 467.134 $91,050 $7,592,278 $227,768 455.450 $103,737
CLASS 7Non-Centrally Assessed Public Util. $0 $0 - $0 $0 $0 - $0
CLASS 8Machinery $2,681,066 $40,668 453.151 $18,429 $2,910,286 $38,237 459.512 $17,570Farm Implements $6,499,185 $99,044 435.797 $43,163 $6,795,379 $105,193 439.842 $46,268Furniture and Fixtures $407,733 $6,346 561.365 $3,562 $604,619 $9,372 518.729 $4,862Other Business Equipment $884,869 $13,296 455.436 $6,055 $627,245 $9,409 460.182 $4,330 Class 8 Subtotal $10,472,853 $159,354 446.864 $71,210 $10,937,529 $162,211 450.216 $73,030
CLASS 9Utilities $61,421,921 $7,370,619 445.219 $3,281,539 $66,862,569 $8,023,513 435.306 $3,492,685
CLASS 10Timber Land 17,414 $3,804,868 $14,079 442.246 $6,226 17,388 $3,799,125 $14,057 433.377 $6,092
CLASS 12Railroads $19,154,882 $588,055 431.616 $253,814 $16,941,718 $528,580 417.216 $220,532Airlines $0 $0 - $0 $0 $0 - $0 Class 12 Subtotal $19,154,882 $588,055 $253,814 $16,941,718 $528,580 $220,532
CLASS 13Electrical Generation Property $0 $0 - $0 $0 $0 - $0Telecommunication Property $1,883,785 $113,029 463.823 $52,425 $1,758,870 $105,530 437.835 $46,205Elect Gen/Tele Real Prop New & Exp $0 $0 - $0 $0 $0 - $0 Class 13 Subtotal $1,883,785 $113,029 $52,425 $1,758,870 $105,530 $46,205
CLASS 14Wind Generation $110,732,609 $3,321,978 427.726 $1,420,896 $101,735,938 $3,052,078 413.942 $1,263,384Wind Generation New & Exp $54,629,096 $819,437 551.906 $452,252 $53,066,366 $907,225 532.444 $483,046 Class 14 Subtotal $165,361,705 $4,141,415 $1,873,149 $154,802,304 $3,959,303 $1,746,430
CLASS 15Carbon Dioxide and Liquid Pipeline $0 $0 - $0 $0 $0 - $0Carbon Dioxide and Liquid Pipeline (abated) $0 $0 - $0 $0 $0 - $0
Total $476,117,659 $16,076,670 453.911 $7,297,373 $471,510,916 $16,532,891 444.447 $7,347,995
ABATED PROPERTY
Current Values of Abated Property $54,629,096 $819,437 551.906 $452,252 $53,066,366 $907,225 532.444 $483,046Values Without the Property Abatement $54,629,096 $1,638,873 551.906 $904,504 $53,066,366 $1,591,991 532.444 $847,646Difference (Property Value Abated) $0 -$819,436 -$452,252 $0 -$684,766 -$364,600
Wheatland County
TY 2018TY 2017
1 INVENERGY LLC 2 EXPRESS PIPELINE LLC 1 EXPRESS PIPELINE LLC 2 INVENERGY LLC
3 NORTHWESTERN ENERGY-T & D 4 FRONT RANGE PIPELINE LLC 3 NORTHWESTERN ENERGY-T & D 4 MUSSELSHELL WIND PROJECT LLC
5 BNSF RAILWAY CO 6 MUSSELSHELL WIND PROJECT LLC 5 FRONT RANGE PIPELINE LLC 6 BNSF RAILWAY CO
7 PUGET SOUND ENERGY INC - TRANSMISSION PROPERTY 8 PHILLIPS 66 CARRIER LLC 7 PHILLIPS 66 CARRIER LLC 8 PUGET SOUND ENERGY INC -
TRANSMISSION PROPERTY
9 PORTLAND GENERAL ELECTRIC COMPANY - TRANSMISSION 10 NJR CLEAN ENERGY VENTURES 9 PORTLAND GENERAL ELECTRIC
COMPANY - TRANSMISSION 10 NJR CLEAN ENERGY VENTURES
Top 10 Property Owners by Taxable ValueTY 2017 TY 2018
Property Taxes Paid by County
Page 87
248revenue.mt.gov
Acres Assessed Taxable Avg. Mills Taxes Acres Assessed Taxable Avg. Mills TaxesCLASS 1 Net Proceeds $0 $0 - $0 $0 $0 - $0
CLASS 2 Gross Proceeds $0 $0 - $0 $0 $0 - $0
CLASS 3 Agricultural Land:Tillable Irrigated 0 $0 $0 - $0 0 $0 $0 - $0Tillable Non-Irrigated 96,084 $32,078,042 $692,892 344.939 $239,005 95,625 $31,996,402 $691,128 345.945 $239,093Grazing 406,555 $18,551,760 $400,722 344.970 $138,237 407,059 $18,531,694 $400,288 345.983 $138,493Wild Hay 0 $0 $0 - $0 0 $0 $0 - $0Non-Qualified Ag Land 752 $36,192 $5,473 352.959 $1,932 752 $36,192 $5,473 354.254 $1,939Eligible Mining Claims 0 $0 $0 - $0 0 $0 $0 - $0 Class 3 Subtotal $50,665,994 $1,099,087 344.990 $379,174 $50,564,288 $1,096,889 346.000 $379,524
CLASS 4 Land and Improvements:Residential $24,022,204 $328,208 422.803 $138,767 $24,042,125 $328,289 426.436 $139,994Residential Low Income $1,147,103 $5,614 428.335 $2,405 $1,167,559 $6,279 429.452 $2,697Mobile Homes $2,665,350 $35,979 362.939 $13,058 $2,730,320 $36,856 382.144 $14,084Mobile Homes Low Income $3,450 $9 422.570 $4 $3,450 $9 443.841 $4Commercial $35,255,685 $505,117 361.883 $182,793 $35,590,888 $509,749 363.415 $185,250Industrial $79,800 $1,508 344.931 $520 $79,800 $1,508 345.938 $522New Manufacturing $673,990 $12,738 344.931 $4,394 $673,990 $12,738 345.938 $4,407Qualified Golf Courses $0 $0 - $0 $0 $0 - $0Remodeled Commercial $0 $0 - $0 $0 $0 - $0Extended Prop Tax Relief Program (Res Only) $0 $0 - $0 $0 $0 - $0 Class 4 Subtotal $63,847,582 $889,173 384.561 $341,941 $64,288,132 $895,428 387.477 $346,958
CLASS 5Rural Electric and Telephone Co-Op $4,804,490 $144,135 366.821 $52,872 $7,004,193 $210,128 368.419 $77,415Qualified New Industrial $0 $0 - $0 $0 $0 - $0Pollution Control $0 $0 - $0 $0 $0 - $0Gasohol Related $0 $0 - $0 $0 $0 - $0Research and Development $0 $0 - $0 $0 $0 - $0Aluminum Electrolytic Equipment $0 $0 - $0 $0 $0 - $0 Class 5 Subtotal $4,804,490 $144,135 366.821 $52,872 $7,004,193 $210,128 368.419 $77,415
CLASS 7Non-Centrally Assessed Public Util. $0 $0 - $0 $0 $0 - $0
CLASS 8Machinery $9,311,540 $162,090 326.915 $52,990 $5,128,196 $94,230 345.382 $32,545Farm Implements $7,736,701 $121,772 335.964 $40,911 $7,048,800 $110,717 345.394 $38,241Furniture and Fixtures $256,832 $4,000 397.980 $1,592 $192,698 $3,021 414.658 $1,253Other Business Equipment $6,024,753 $142,245 326.027 $46,376 $5,519,621 $129,377 344.837 $44,614 Class 8 Subtotal $23,329,826 $430,107 329.844 $141,868 $17,889,315 $337,345 345.797 $116,653
CLASS 9Utilities $103,122,960 $12,374,757 345.504 $4,275,532 $108,534,580 $13,024,148 346.591 $4,514,056
CLASS 10Timber Land 0 $0 $0 - $0 0 $0 $0 - $0
CLASS 12Railroads $20,210,872 $620,474 352.353 $218,626 $17,875,684 $557,721 353.625 $197,224Airlines $0 $0 - $0 $0 $0 - $0 Class 12 Subtotal $20,210,872 $620,474 $218,626 $17,875,684 $557,721 $197,224
CLASS 13Electrical Generation Property $0 $0 - $0 $0 $0 - $0Telecommunication Property $634,968 $38,099 374.941 $14,285 $618,659 $37,120 409.760 $15,210Elect Gen/Tele Real Prop New & Exp $0 $0 - $0 $0 $0 - $0 Class 13 Subtotal $634,968 $38,099 $14,285 $618,659 $37,120 $15,210
CLASS 14Wind Generation $0 $0 - $0 $0 $0 - $0Wind Generation New & Exp $0 $0 - $0 $0 $0 - $0 Class 14 Subtotal $0 $0 $0 $0 $0 $0
CLASS 15Carbon Dioxide and Liquid Pipeline $0 $0 - $0 $0 $0 - $0Carbon Dioxide and Liquid Pipeline (abated) $0 $0 - $0 $0 $0 - $0
Total $266,616,692 $15,595,832 347.804 $5,424,297 $266,774,851 $16,158,779 349.472 $5,647,041
ABATED PROPERTY
Current Values of Abated Property $0 $0 - $0 $0 $0 - $0Values Without the Property Abatement $0 $0 - $0 $0 $0 - $0Difference (Property Value Abated) $0 $0 $0 $0 $0 $0
Wibaux County
TY 2018TY 2017
1 ONEOK BAKKEN PIPELINE LLC 2 HILAND CRUDE LLC 1 ONEOK BAKKEN PIPELINE LLC 2 HILAND CRUDE LLC
3 BELLE FOURCHE PIPELINE COMPANY 4 BNSF RAILWAY CO 3 BELLE FOURCHE PIPELINE
COMPANY 4 BNSF RAILWAY CO
5 BRIDGER PIPELINE LLC 6 WBI ENERGY TRANSMISSION INC 5 WBI ENERGY TRANSMISSION INC 6 BRIDGER PIPELINE LLC
7 DENBURY ONSHORE LLC 8 BUTTE PIPE LINE CO 7 DENBURY ONSHORE LLC 8 GOLDENWEST ELECTRIC COOP INC
9 BERGER JEFFREY W & TAMI M 10 BLACK DIAMOND ENERGY SERVICES INC 9 MONTANA DAKOTA UTILITIES -
ELECTRIC TRANSMISSION 10 BUTTE PIPE LINE CO
Top 10 Property Owners by Taxable ValueTY 2017 TY 2018
Property Taxes Paid by County
Page 88
249revenue.mt.gov
Acres Assessed Taxable Avg. Mills Taxes Acres Assessed Taxable Avg. Mills TaxesCLASS 1 Net Proceeds $0 $0 - $0 $0 $0 - $0
CLASS 2 Gross Proceeds $0 $0 - $0 $0 $0 - $0
CLASS 3 Agricultural Land:Tillable Irrigated 59,225 $49,982,266 $1,079,604 579.258 $625,369 58,874 $49,285,285 $1,064,550 599.072 $637,742Tillable Non-Irrigated 201,048 $40,023,313 $864,537 518.662 $448,402 199,340 $39,697,655 $857,502 526.746 $451,686Grazing 940,998 $37,685,513 $814,084 574.101 $467,367 941,107 $37,684,304 $814,049 582.213 $473,950Wild Hay 21,834 $4,187,724 $90,454 524.015 $47,399 21,852 $4,193,326 $90,575 529.320 $47,943Non-Qualified Ag Land 60,502 $2,906,349 $439,448 558.032 $245,226 61,419 $2,952,398 $446,393 580.427 $259,098Eligible Mining Claims 0 $0 $0 - $0 0 $0 $0 - $0 Class 3 Subtotal $134,785,165 $3,288,127 557.692 $1,833,764 $133,812,968 $3,273,069 571.458 $1,870,420
CLASS 4 Land and Improvements:Residential $10,934,980,667 $147,689,275 662.557 $97,852,573 $11,148,719,694 $150,022,186 678.797 $101,834,683Residential Low Income $378,707,638 $1,857,844 672.708 $1,249,787 $383,240,882 $1,842,430 689.468 $1,270,296Mobile Homes $153,190,405 $2,067,600 628.581 $1,299,653 $153,302,540 $2,069,118 594.594 $1,230,285Mobile Homes Low Income $11,438,310 $50,909 654.548 $33,322 $24,298,783 $53,709 625.635 $33,602Commercial $4,900,703,380 $87,342,284 650.674 $56,831,346 $4,898,221,091 $87,028,777 666.945 $58,043,408Industrial $75,176,949 $1,420,846 581.155 $825,731 $72,266,903 $1,365,575 616.145 $841,392New Manufacturing $321,303,146 $5,920,272 578.464 $3,424,666 $333,027,688 $6,146,368 617.368 $3,794,569Qualified Golf Courses $31,881,086 $302,870 603.921 $182,910 $30,139,841 $286,328 610.158 $174,705Remodeled Commercial $26,082,681 $0 - $50,529 $25,021,219 $0 - $48,472Extended Prop Tax Relief Program (Res Only) $0 $0 - $0 $0 $0 - $0 Class 4 Subtotal $16,833,464,262 $246,651,900 655.785 $161,750,516 $17,068,238,641 $248,814,491 672.274 $167,271,412
CLASS 5Rural Electric and Telephone Co-Op $60,086,236 $1,802,594 572.827 $1,032,575 $61,810,663 $1,854,319 587.169 $1,088,799Qualified New Industrial $0 $0 - $0 $171,823,915 $0 - $0Pollution Control $73,580,454 $2,207,413 567.867 $1,253,516 $69,731,616 $2,082,746 622.091 $1,295,658Gasohol Related $0 $0 - $0 $0 $0 - $0Research and Development $0 $0 - $0 $0 $0 - $0Aluminum Electrolytic Equipment $0 $0 - $0 $0 $0 - $0 Class 5 Subtotal $133,666,690 $4,010,007 570.097 $2,286,091 $303,366,194 $3,937,065 605.643 $2,384,457
CLASS 7Non-Centrally Assessed Public Util. $0 $0 - $0 $0 $0 - $0
CLASS 8Machinery $1,705,269,362 $48,619,690 554.909 $26,979,499 $1,769,440,080 $42,811,820 603.908 $25,854,404Farm Implements $17,657,833 $281,423 534.071 $150,300 $19,148,493 $302,773 552.045 $167,144Furniture and Fixtures $172,624,075 $2,968,620 654.595 $1,943,243 $177,826,804 $3,016,706 649.459 $1,959,227Other Business Equipment $128,056,594 $3,349,344 564.221 $1,889,770 $164,354,285 $4,456,182 592.810 $2,641,669 Class 8 Subtotal $2,023,607,864 $55,219,077 560.727 $30,962,812 $2,130,769,662 $50,587,481 605.336 $30,622,445
CLASS 9Utilities $338,343,564 $40,601,213 603.007 $24,482,810 $341,491,399 $40,978,960 617.041 $25,285,689
CLASS 10Timber Land 39,220 $3,955,278 $14,631 606.730 $8,877 39,235 $3,957,626 $14,641 615.744 $9,015
CLASS 12Railroads $314,527,403 $9,655,991 528.834 $5,106,415 $266,680,395 $8,320,434 553.123 $4,602,221Airlines $47,729,794 $1,465,306 705.516 $1,033,797 $51,202,813 $1,597,529 714.270 $1,141,067 Class 12 Subtotal $362,257,197 $11,121,297 $6,140,211 $317,883,208 $9,917,963 $5,743,288
CLASS 13Electrical Generation Property $0 $0 - $0 $0 $0 - $0Telecommunication Property $158,387,778 $9,503,307 668.953 $6,357,262 $149,955,329 $8,997,301 680.380 $6,121,587Elect Gen/Tele Real Prop New & Exp $0 $0 - $0 $0 $0 - $0 Class 13 Subtotal $158,387,778 $9,503,307 $6,357,262 $149,955,329 $8,997,301 $6,121,587
CLASS 14Wind Generation $7,958,004 $238,740 499.256 $119,192 $0 $0 - $0Wind Generation New & Exp $0 $0 - $0 $0 $0 - $0 Class 14 Subtotal $7,958,004 $238,740 $119,192 $0 $0 $0
CLASS 15Carbon Dioxide and Liquid Pipeline $0 $0 - $0 $0 $0 - $0Carbon Dioxide and Liquid Pipeline (abated) $0 $0 - $0 $0 $0 - $0
Total $19,996,425,802 $370,648,299 631.169 $233,941,536 $20,449,475,027 $366,520,971 652.918 $239,308,313
ABATED PROPERTY
Current Values of Abated Property $60,853,887 $428,445 789.800 $338,386 $420,675,926 $3,693,984 815.261 $3,011,561Values Without the Property Abatement $60,853,887 $1,185,692 789.800 $936,459 $420,675,926 $11,978,057 815.261 $9,765,242Difference (Property Value Abated) $0 -$757,247 -$598,073 $0 -$8,284,073 -$6,753,681
Yellowstone County
TY 2018TY 2017
1 CHS INC 2 NORTHWESTERN ENERGY-T & D 1 NORTHWESTERN ENERGY-T & D 2 CHS INC
3 PHILLIPS 66 COMPANY 4 EXXON MOBIL CORPORATION 3 PHILLIPS 66 COMPANY 4 EXXON MOBIL CORPORATION
5 BNSF RAILWAY CO 6 MONTANA DAKOTA UTILITIES - GAS DISTRIBUTION 5 BNSF RAILWAY CO 6 MONTANA DAKOTA UTILITIES - GAS
DISTRIBUTION
7 CHARTER COMMUNICATIONS INC 8 PHILLIPS 66 CARRIER LLC 7 PHILLIPS 66 CARRIER LLC 8 CHARTER COMMUNICATIONS INC
9 CENTURYLINK INC 10 MONTANA RAIL LINK 9 MONTANA RAIL LINK 10 QWEST CORPORATION AND OR CENTURYLINK INC -
Top 10 Property Owners by Taxable ValueTY 2017 TY 2018
Property Taxes Paid by County