Boise State University Boise State University ScholarWorks ScholarWorks Early and Special Education Faculty Publications and Presentations Department of Early and Special Education 4-19-2021 Proportional Reasoning Interventions in Special Education Proportional Reasoning Interventions in Special Education Synthesis Coding Protocol Synthesis Coding Protocol Gena Nelson Boise State University References References Gersten, R., Fuchs, L. S., Compton, D., Coyne, M., Greenwood, C., & Innocenti, M. S. (2005). Quality indicators for group experimental and quasi-experimental research in special education. Exceptional Children, 71(2), 149-164. Horner, R. H., Carr, E. G., Halle, J., McGee, G., Odom, S., & Wolery, M. (2005). The use of single-subject research to identify evidence-based practice in special education. Exceptional Children, 71(2), 165-179. Nelson, G., Hunt, J. H., Martin, K., Patterson, B., & Khounmeuang, A. (2020). Current knowledge and future directions: proportional reasoning interventions for students with learning disabilities and mathematics difficulties. Learning Disability Quarterly. Advanced online publication. https://doi.org/10.1177/0731948720932850
Transcript
Boise State University Boise State University
ScholarWorks ScholarWorks
Early and Special Education Faculty Publications and Presentations Department of Early and Special Education
4-19-2021
Proportional Reasoning Interventions in Special Education Proportional Reasoning Interventions in Special Education
References References Gersten, R., Fuchs, L. S., Compton, D., Coyne, M., Greenwood, C., & Innocenti, M. S. (2005). Quality indicators for group experimental and quasi-experimental research in special education. Exceptional Children, 71(2), 149-164. Horner, R. H., Carr, E. G., Halle, J., McGee, G., Odom, S., & Wolery, M. (2005). The use of single-subject research to identify evidence-based practice in special education. Exceptional Children, 71(2), 165-179. Nelson, G., Hunt, J. H., Martin, K., Patterson, B., & Khounmeuang, A. (2020). Current knowledge and future directions: proportional reasoning interventions for students with learning disabilities and mathematics difficulties. Learning Disability Quarterly. Advanced online publication. https://doi.org/10.1177/0731948720932850
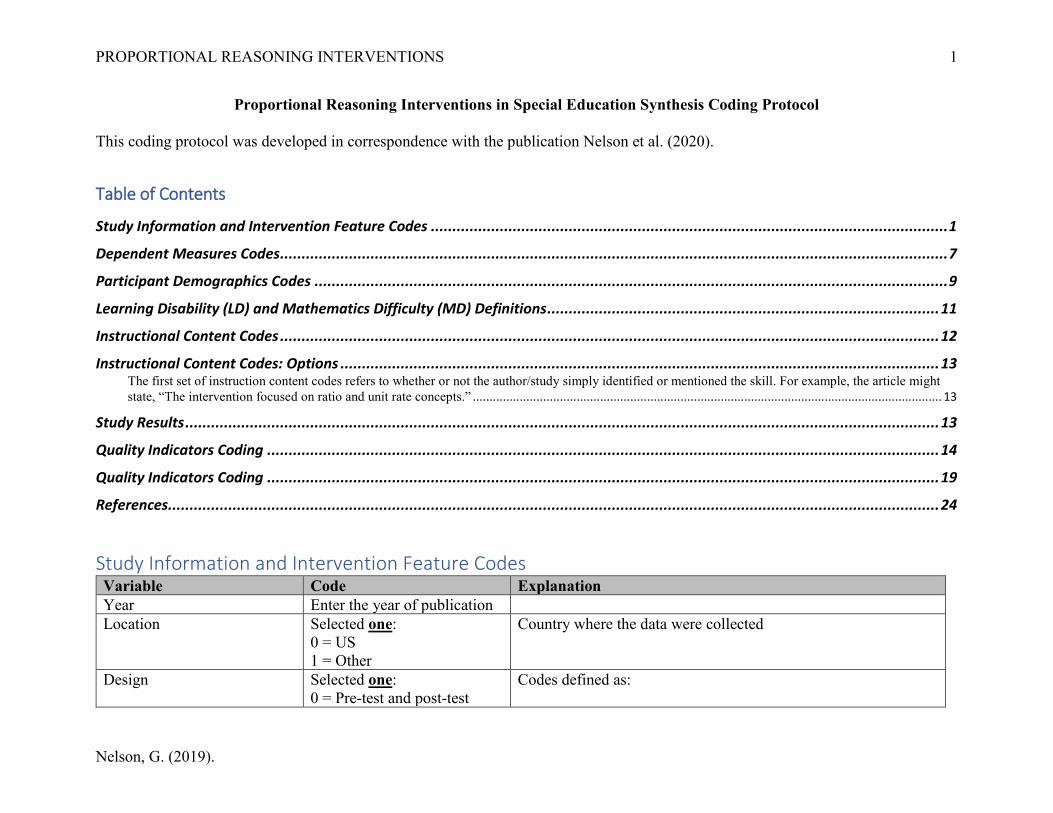
Proportional Reasoning Interventions in Special Education Synthesis Coding Protocol
This coding protocol was developed in correspondence with the publication Nelson et al. (2020).
Table of Contents
Study Information and Intervention Feature Codes ........................................................................................................................ 1
Instructional Content Codes: Options ........................................................................................................................................... 13 The first set of instruction content codes refers to whether or not the author/study simply identified or mentioned the skill. For example, the article might state, “The intervention focused on ratio and unit rate concepts.” ............................................................................................................................................ 13
Study Results ............................................................................................................................................................................... 13
Study Information and Intervention Feature Codes Variable Code Explanation Year Enter the year of publication Location Selected one:
0 = US 1 = Other
Country where the data were collected
Design Selected one: 0 = Pre-test and post-test
Codes defined as:
PROPORTIONAL REASONING INTERVENTIONS
Nelson, G. (2019).
2
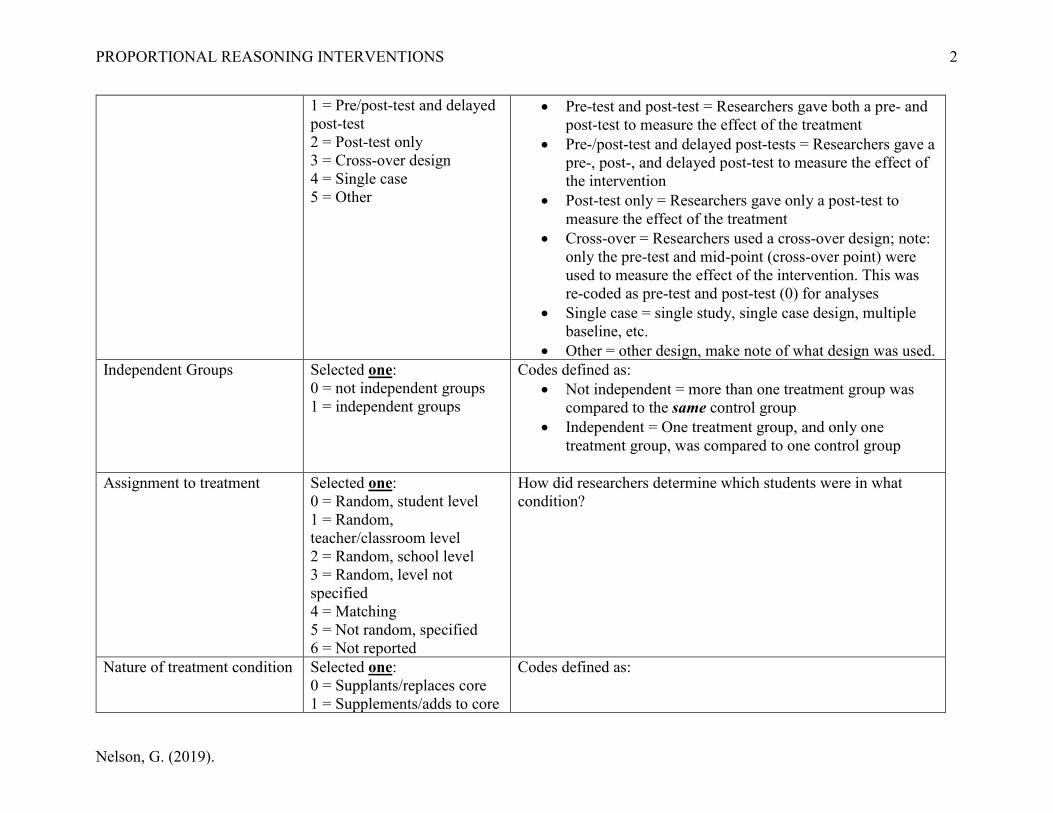
1 = Pre/post-test and delayed post-test 2 = Post-test only 3 = Cross-over design 4 = Single case 5 = Other
• Pre-test and post-test = Researchers gave both a pre- and post-test to measure the effect of the treatment
• Pre-/post-test and delayed post-tests = Researchers gave a pre-, post-, and delayed post-test to measure the effect of the intervention
• Post-test only = Researchers gave only a post-test to measure the effect of the treatment
• Cross-over = Researchers used a cross-over design; note: only the pre-test and mid-point (cross-over point) were used to measure the effect of the intervention. This was re-coded as pre-test and post-test (0) for analyses
• Single case = single study, single case design, multiple baseline, etc.
• Other = other design, make note of what design was used. Independent Groups Selected one:
0 = not independent groups 1 = independent groups
Codes defined as: • Not independent = more than one treatment group was
compared to the same control group • Independent = One treatment group, and only one
treatment group, was compared to one control group
Assignment to treatment Selected one: 0 = Random, student level 1 = Random, teacher/classroom level 2 = Random, school level 3 = Random, level not specified 4 = Matching 5 = Not random, specified 6 = Not reported
How did researchers determine which students were in what condition?
Nature of treatment condition Selected one: 0 = Supplants/replaces core 1 = Supplements/adds to core
Codes defined as:
PROPORTIONAL REASONING INTERVENTIONS
Nelson, G. (2019).
3
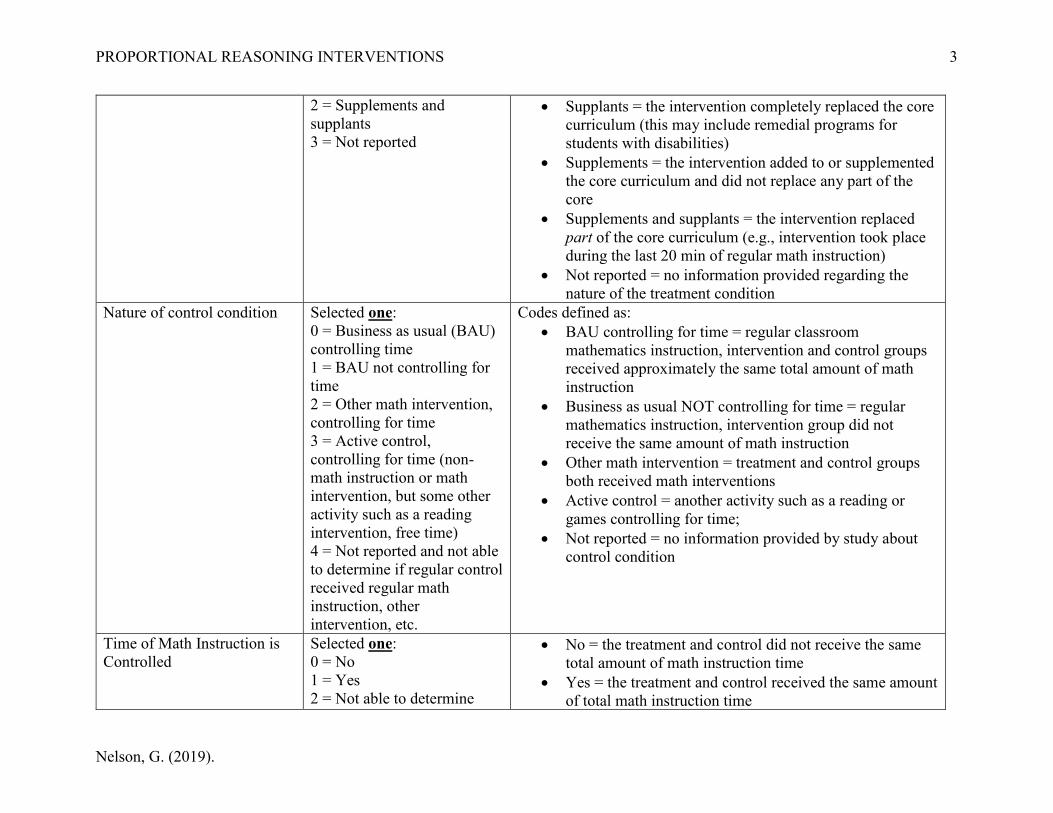
2 = Supplements and supplants 3 = Not reported
• Supplants = the intervention completely replaced the core curriculum (this may include remedial programs for students with disabilities)
• Supplements = the intervention added to or supplemented the core curriculum and did not replace any part of the core
• Supplements and supplants = the intervention replaced part of the core curriculum (e.g., intervention took place during the last 20 min of regular math instruction)
• Not reported = no information provided regarding the nature of the treatment condition
Nature of control condition Selected one: 0 = Business as usual (BAU) controlling time 1 = BAU not controlling for time 2 = Other math intervention, controlling for time 3 = Active control, controlling for time (non-math instruction or math intervention, but some other activity such as a reading intervention, free time) 4 = Not reported and not able to determine if regular control received regular math instruction, other intervention, etc.
Codes defined as: • BAU controlling for time = regular classroom
mathematics instruction, intervention and control groups received approximately the same total amount of math instruction
• Business as usual NOT controlling for time = regular mathematics instruction, intervention group did not receive the same amount of math instruction
• Other math intervention = treatment and control groups both received math interventions
• Active control = another activity such as a reading or games controlling for time;
• Not reported = no information provided by study about control condition
Time of Math Instruction is Controlled
Selected one: 0 = No 1 = Yes 2 = Not able to determine
• No = the treatment and control did not receive the same total amount of math instruction time
• Yes = the treatment and control received the same amount of total math instruction time
PROPORTIONAL REASONING INTERVENTIONS
Nelson, G. (2019).
4
• Not able to determine = not able to determine if the treatment and control received the same amount of math instruction time
Instructional arrangement Selected as many codes that apply: 0 = One-on-one instruction 1 = Small group 2 = Mixed, flexible grouping 3 = Whole Class 4 = Not reported
Codes defined as: • One-on-one instruction = students received instruction
individually, including computer-administered interventions
• Small group = students received instruction in a small group setting of ~2 to 5 students
• Mixed = students received instruction in flexible grouping (changed depending on lesson), including whole class, small groups, and individual
• Whole class = regular classroom instruction • Not reported = study did not report instructional
arrangement Intervention agent Selected one:
0 = Researcher 1 = Teacher 2 = Other school staff 3 = Mixed 4 = Computer-administered 5 = Not reported
Codes defined as: • Researcher = a trained researcher or assistant for the
specific purpose of conducting the study provided the intervention
• Teacher = Regular classroom teacher implemented the intervention
• Other school staff = Other school staff (not specified if intervention agent was the classroom teacher) implemented the intervention material; include staff hired by school to provide interventions such as retired school teachers; includes paraprofessionals
• Mix = mix of researchers, teachers, and school staff implemented the intervention
• Computer-administered = intervention content was delivered via computer or electronic device
• Not reported = not reported or not able to determine
PROPORTIONAL REASONING INTERVENTIONS
Nelson, G. (2019).
5
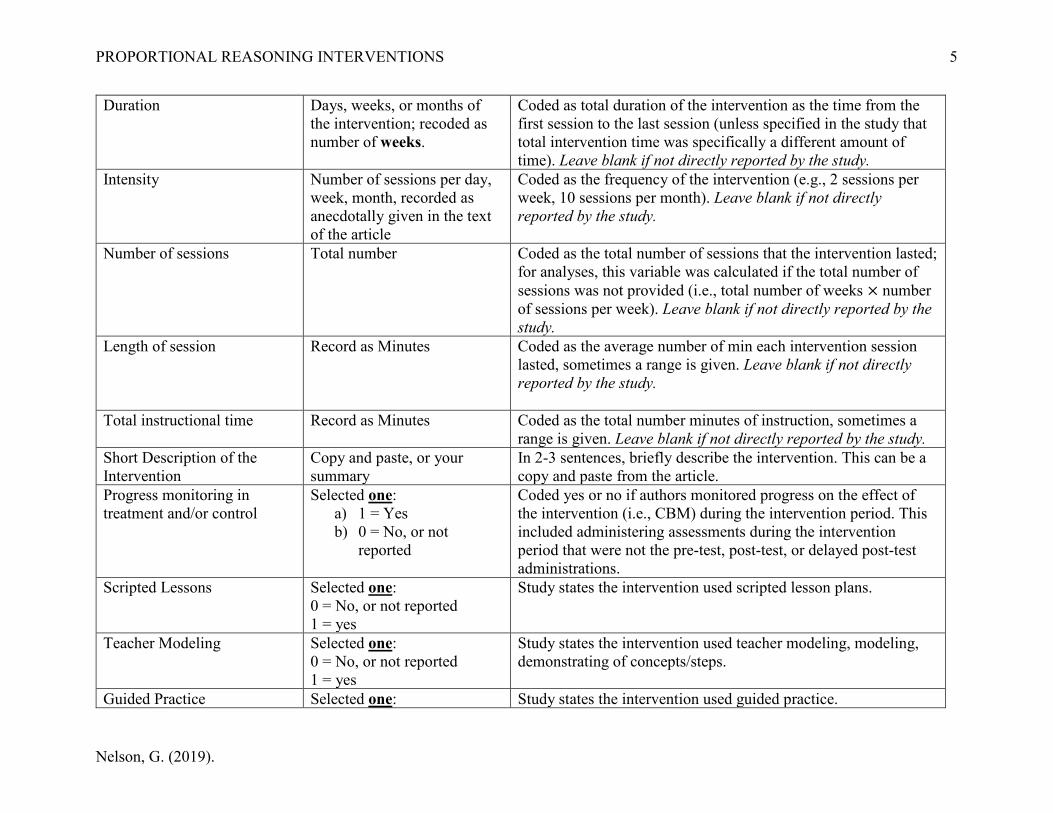
Duration Days, weeks, or months of the intervention; recoded as number of weeks.
Coded as total duration of the intervention as the time from the first session to the last session (unless specified in the study that total intervention time was specifically a different amount of time). Leave blank if not directly reported by the study.
Intensity Number of sessions per day, week, month, recorded as anecdotally given in the text of the article
Coded as the frequency of the intervention (e.g., 2 sessions per week, 10 sessions per month). Leave blank if not directly reported by the study.
Number of sessions Total number Coded as the total number of sessions that the intervention lasted; for analyses, this variable was calculated if the total number of sessions was not provided (i.e., total number of weeks × number of sessions per week). Leave blank if not directly reported by the study.
Length of session Record as Minutes Coded as the average number of min each intervention session lasted, sometimes a range is given. Leave blank if not directly reported by the study.
Total instructional time Record as Minutes Coded as the total number minutes of instruction, sometimes a range is given. Leave blank if not directly reported by the study.
Short Description of the Intervention
Copy and paste, or your summary
In 2-3 sentences, briefly describe the intervention. This can be a copy and paste from the article.
Progress monitoring in treatment and/or control
Selected one: a) 1 = Yes b) 0 = No, or not
reported
Coded yes or no if authors monitored progress on the effect of the intervention (i.e., CBM) during the intervention period. This included administering assessments during the intervention period that were not the pre-test, post-test, or delayed post-test administrations.
Scripted Lessons Selected one: 0 = No, or not reported 1 = yes
Study states the intervention used scripted lesson plans.
Teacher Modeling Selected one: 0 = No, or not reported 1 = yes
Study states the intervention used teacher modeling, modeling, demonstrating of concepts/steps.
Guided Practice Selected one: Study states the intervention used guided practice.
PROPORTIONAL REASONING INTERVENTIONS
Nelson, G. (2019).
6
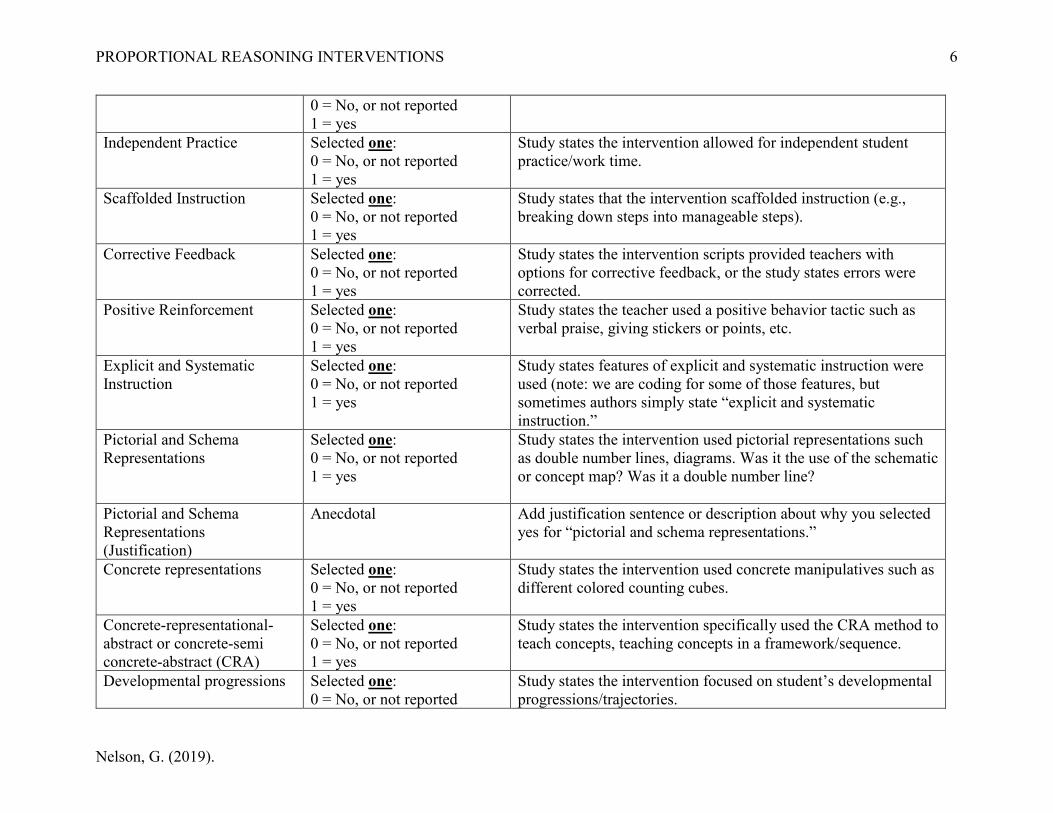
0 = No, or not reported 1 = yes
Independent Practice Selected one: 0 = No, or not reported 1 = yes
Study states the intervention allowed for independent student practice/work time.
Scaffolded Instruction Selected one: 0 = No, or not reported 1 = yes
Study states that the intervention scaffolded instruction (e.g., breaking down steps into manageable steps).
Corrective Feedback Selected one: 0 = No, or not reported 1 = yes
Study states the intervention scripts provided teachers with options for corrective feedback, or the study states errors were corrected.
Positive Reinforcement Selected one: 0 = No, or not reported 1 = yes
Study states the teacher used a positive behavior tactic such as verbal praise, giving stickers or points, etc.
Explicit and Systematic Instruction
Selected one: 0 = No, or not reported 1 = yes
Study states features of explicit and systematic instruction were used (note: we are coding for some of those features, but sometimes authors simply state “explicit and systematic instruction.”
Pictorial and Schema Representations
Selected one: 0 = No, or not reported 1 = yes
Study states the intervention used pictorial representations such as double number lines, diagrams. Was it the use of the schematic or concept map? Was it a double number line?
Pictorial and Schema Representations (Justification)
Anecdotal Add justification sentence or description about why you selected yes for “pictorial and schema representations.”
Concrete representations Selected one: 0 = No, or not reported 1 = yes
Study states the intervention used concrete manipulatives such as different colored counting cubes.
Concrete-representational-abstract or concrete-semi concrete-abstract (CRA)
Selected one: 0 = No, or not reported 1 = yes
Study states the intervention specifically used the CRA method to teach concepts, teaching concepts in a framework/sequence.
Developmental progressions Selected one: 0 = No, or not reported
Study states the intervention focused on student’s developmental progressions/trajectories.
PROPORTIONAL REASONING INTERVENTIONS
Nelson, G. (2019).
7
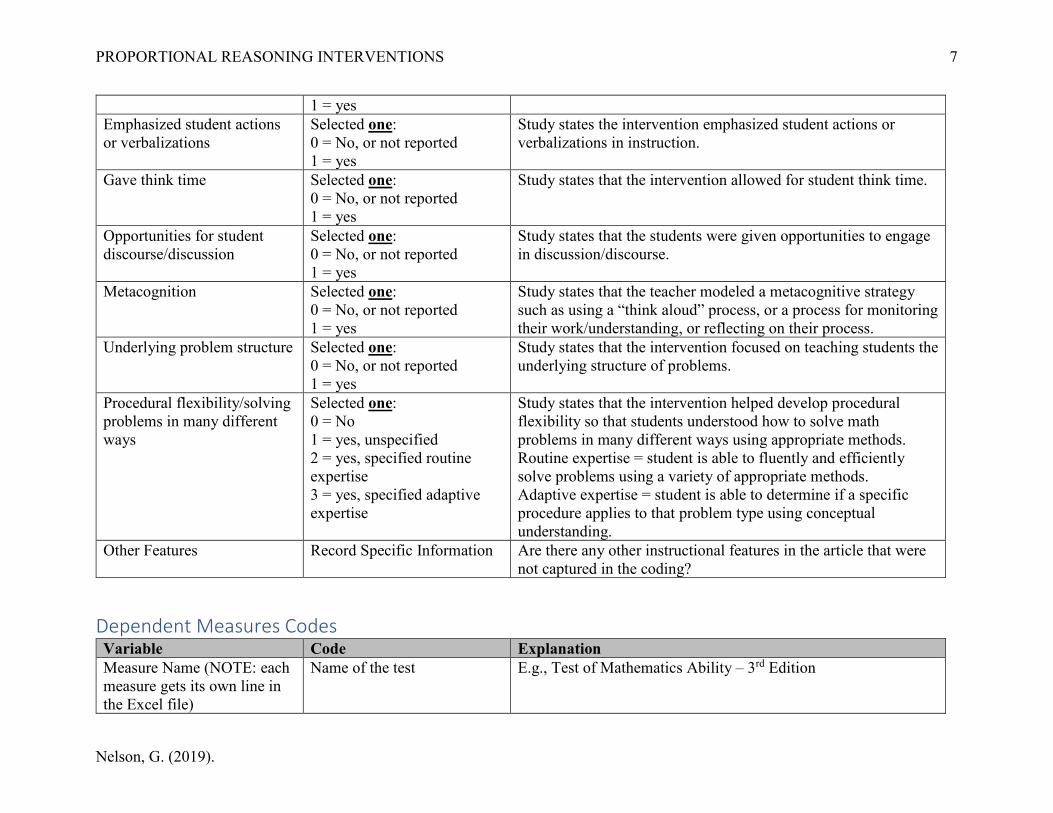
1 = yes Emphasized student actions or verbalizations
Selected one: 0 = No, or not reported 1 = yes
Study states the intervention emphasized student actions or verbalizations in instruction.
Gave think time Selected one: 0 = No, or not reported 1 = yes
Study states that the intervention allowed for student think time.
Opportunities for student discourse/discussion
Selected one: 0 = No, or not reported 1 = yes
Study states that the students were given opportunities to engage in discussion/discourse.
Metacognition Selected one: 0 = No, or not reported 1 = yes
Study states that the teacher modeled a metacognitive strategy such as using a “think aloud” process, or a process for monitoring their work/understanding, or reflecting on their process.
Underlying problem structure Selected one: 0 = No, or not reported 1 = yes
Study states that the intervention focused on teaching students the underlying structure of problems.
Procedural flexibility/solving problems in many different ways
Study states that the intervention helped develop procedural flexibility so that students understood how to solve math problems in many different ways using appropriate methods. Routine expertise = student is able to fluently and efficiently solve problems using a variety of appropriate methods. Adaptive expertise = student is able to determine if a specific procedure applies to that problem type using conceptual understanding.
Other Features Record Specific Information Are there any other instructional features in the article that were not captured in the coding?
Dependent Measures Codes Variable Code Explanation Measure Name (NOTE: each measure gets its own line in the Excel file)
Name of the test E.g., Test of Mathematics Ability – 3rd Edition
PROPORTIONAL REASONING INTERVENTIONS
Nelson, G. (2019).
8
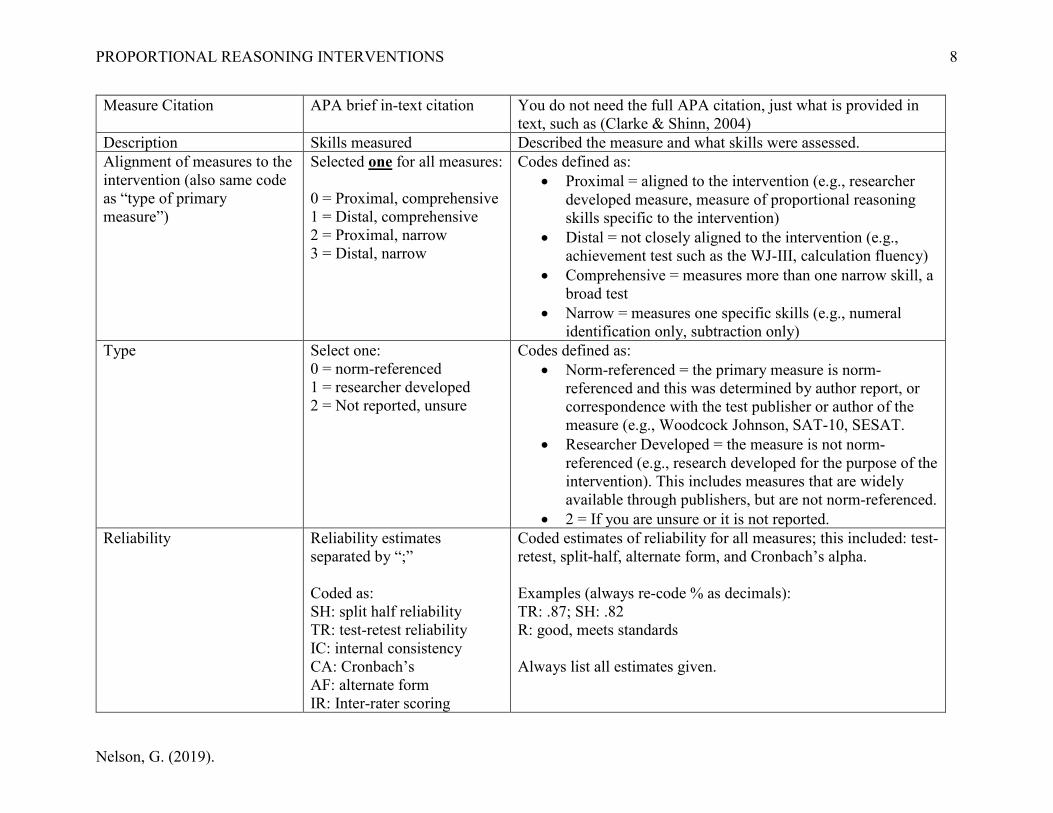
Measure Citation APA brief in-text citation You do not need the full APA citation, just what is provided in text, such as (Clarke & Shinn, 2004)
Description Skills measured Described the measure and what skills were assessed. Alignment of measures to the intervention (also same code as “type of primary measure”)
Selected one for all measures: 0 = Proximal, comprehensive 1 = Distal, comprehensive 2 = Proximal, narrow 3 = Distal, narrow
Codes defined as: • Proximal = aligned to the intervention (e.g., researcher
developed measure, measure of proportional reasoning skills specific to the intervention)
• Distal = not closely aligned to the intervention (e.g., achievement test such as the WJ-III, calculation fluency)
• Comprehensive = measures more than one narrow skill, a broad test
• Narrow = measures one specific skills (e.g., numeral identification only, subtraction only)
Type Select one: 0 = norm-referenced 1 = researcher developed 2 = Not reported, unsure
Codes defined as: • Norm-referenced = the primary measure is norm-
referenced and this was determined by author report, or correspondence with the test publisher or author of the measure (e.g., Woodcock Johnson, SAT-10, SESAT.
• Researcher Developed = the measure is not norm-referenced (e.g., research developed for the purpose of the intervention). This includes measures that are widely available through publishers, but are not norm-referenced.
• 2 = If you are unsure or it is not reported. Reliability Reliability estimates
Coded estimates of reliability for all measures; this included: test-retest, split-half, alternate form, and Cronbach’s alpha. Examples (always re-code % as decimals): TR: .87; SH: .82 R: good, meets standards Always list all estimates given.
PROPORTIONAL REASONING INTERVENTIONS
Nelson, G. (2019).
9
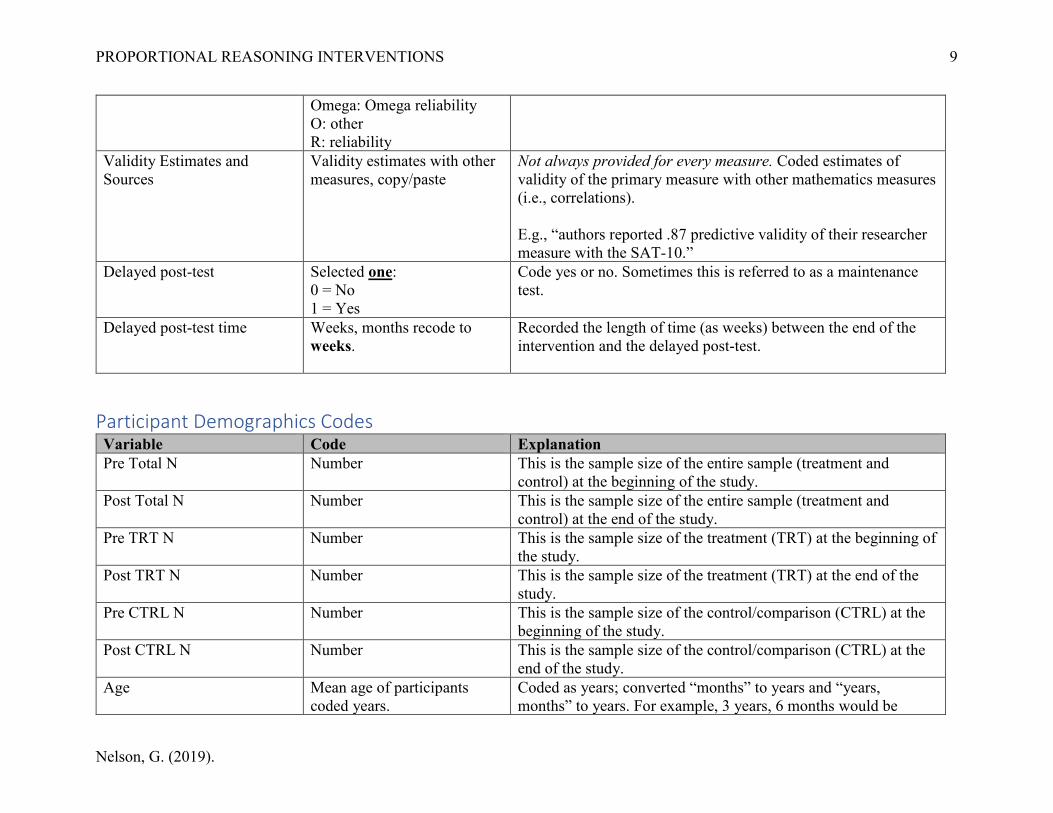
Omega: Omega reliability O: other R: reliability
Validity Estimates and Sources
Validity estimates with other measures, copy/paste
Not always provided for every measure. Coded estimates of validity of the primary measure with other mathematics measures (i.e., correlations). E.g., “authors reported .87 predictive validity of their researcher measure with the SAT-10.”
Delayed post-test Selected one: 0 = No 1 = Yes
Code yes or no. Sometimes this is referred to as a maintenance test.
Delayed post-test time Weeks, months recode to weeks.
Recorded the length of time (as weeks) between the end of the intervention and the delayed post-test.
Participant Demographics Codes Variable Code Explanation Pre Total N Number This is the sample size of the entire sample (treatment and
control) at the beginning of the study. Post Total N Number This is the sample size of the entire sample (treatment and
control) at the end of the study. Pre TRT N Number This is the sample size of the treatment (TRT) at the beginning of
the study. Post TRT N Number This is the sample size of the treatment (TRT) at the end of the
study. Pre CTRL N Number This is the sample size of the control/comparison (CTRL) at the
beginning of the study. Post CTRL N Number This is the sample size of the control/comparison (CTRL) at the
end of the study. Age Mean age of participants
coded years. Coded as years; converted “months” to years and “years, months” to years. For example, 3 years, 6 months would be
PROPORTIONAL REASONING INTERVENTIONS
Nelson, G. (2019).
10
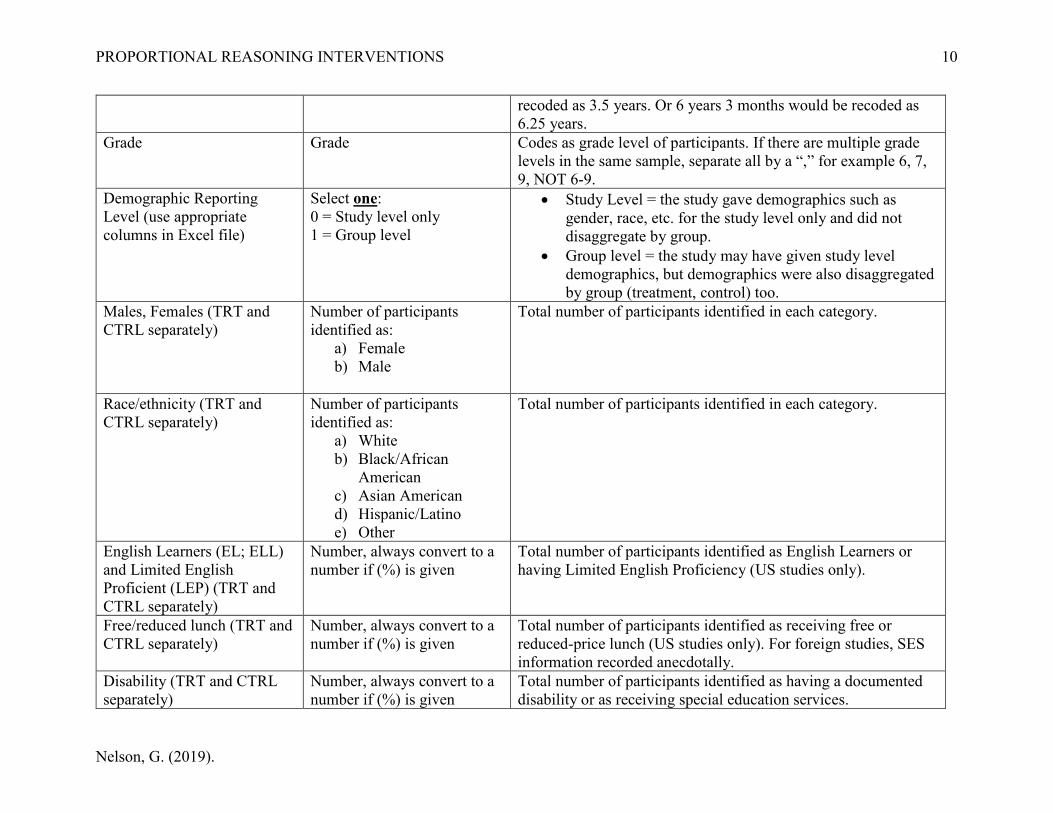
recoded as 3.5 years. Or 6 years 3 months would be recoded as 6.25 years.
Grade Grade Codes as grade level of participants. If there are multiple grade levels in the same sample, separate all by a “,” for example 6, 7, 9, NOT 6-9.
Demographic Reporting Level (use appropriate columns in Excel file)
Select one: 0 = Study level only 1 = Group level
• Study Level = the study gave demographics such as gender, race, etc. for the study level only and did not disaggregate by group.
• Group level = the study may have given study level demographics, but demographics were also disaggregated by group (treatment, control) too.
Males, Females (TRT and CTRL separately)
Number of participants identified as:
a) Female b) Male
Total number of participants identified in each category.
Race/ethnicity (TRT and CTRL separately)
Number of participants identified as:
a) White b) Black/African
American c) Asian American d) Hispanic/Latino e) Other
Total number of participants identified in each category.
English Learners (EL; ELL) and Limited English Proficient (LEP) (TRT and CTRL separately)
Number, always convert to a number if (%) is given
Total number of participants identified as English Learners or having Limited English Proficiency (US studies only).
Free/reduced lunch (TRT and CTRL separately)
Number, always convert to a number if (%) is given
Total number of participants identified as receiving free or reduced-price lunch (US studies only). For foreign studies, SES information recorded anecdotally.
Disability (TRT and CTRL separately)
Number, always convert to a number if (%) is given
Total number of participants identified as having a documented disability or as receiving special education services.
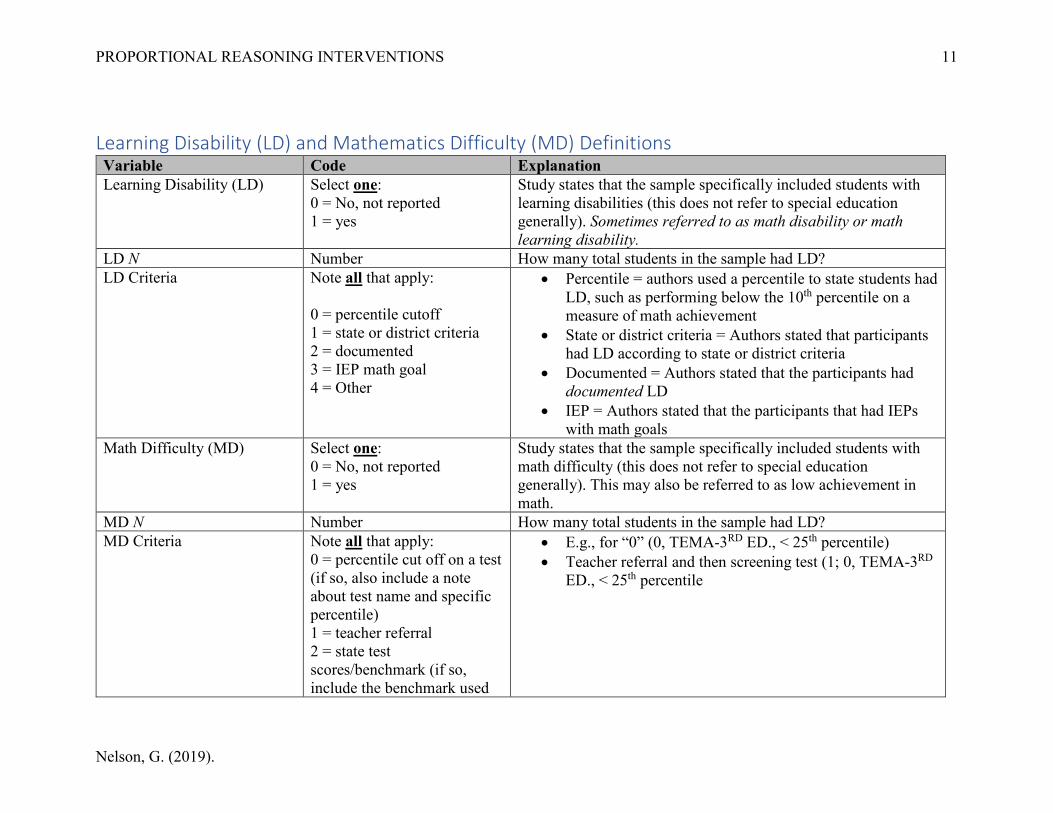
Study states that the sample specifically included students with learning disabilities (this does not refer to special education generally). Sometimes referred to as math disability or math learning disability.
LD N Number How many total students in the sample had LD? LD Criteria Note all that apply:
0 = percentile cutoff 1 = state or district criteria 2 = documented 3 = IEP math goal 4 = Other
• Percentile = authors used a percentile to state students had LD, such as performing below the 10th percentile on a measure of math achievement
• State or district criteria = Authors stated that participants had LD according to state or district criteria
• Documented = Authors stated that the participants had documented LD
• IEP = Authors stated that the participants that had IEPs with math goals
Math Difficulty (MD) Select one: 0 = No, not reported 1 = yes
Study states that the sample specifically included students with math difficulty (this does not refer to special education generally). This may also be referred to as low achievement in math.
MD N Number How many total students in the sample had LD? MD Criteria Note all that apply:
0 = percentile cut off on a test (if so, also include a note about test name and specific percentile) 1 = teacher referral 2 = state test scores/benchmark (if so, include the benchmark used
• E.g., for “0” (0, TEMA-3RD ED., < 25th percentile) • Teacher referral and then screening test (1; 0, TEMA-3RD
ED., < 25th percentile
PROPORTIONAL REASONING INTERVENTIONS
Nelson, G. (2019).
12
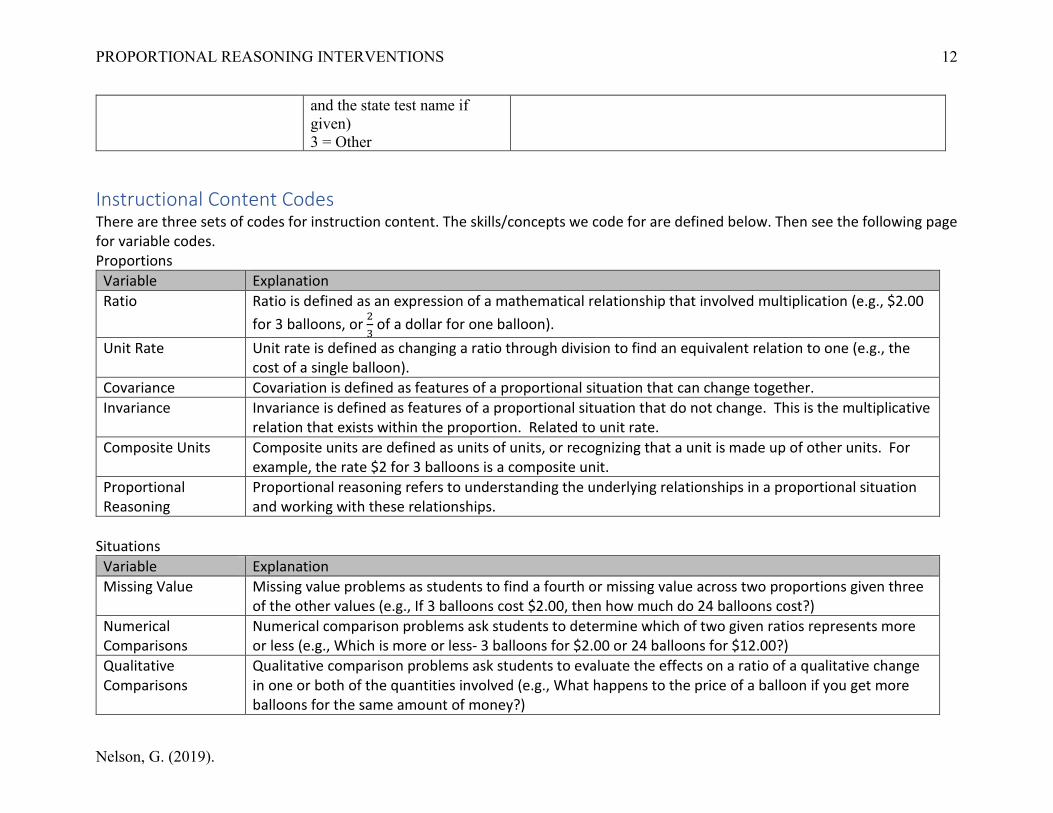
and the state test name if given) 3 = Other
Instructional Content Codes There are three sets of codes for instruction content. The skills/concepts we code for are defined below. Then see the following page for variable codes. Proportions
Variable Explanation Ratio Ratio is defined as an expression of a mathematical relationship that involved multiplication (e.g., $2.00
for 3 balloons, or 23 of a dollar for one balloon).
Unit Rate Unit rate is defined as changing a ratio through division to find an equivalent relation to one (e.g., the cost of a single balloon).
Covariance Covariation is defined as features of a proportional situation that can change together. Invariance Invariance is defined as features of a proportional situation that do not change. This is the multiplicative
relation that exists within the proportion. Related to unit rate. Composite Units Composite units are defined as units of units, or recognizing that a unit is made up of other units. For
example, the rate $2 for 3 balloons is a composite unit. Proportional Reasoning
Proportional reasoning refers to understanding the underlying relationships in a proportional situation and working with these relationships.
Situations
Variable Explanation Missing Value Missing value problems as students to find a fourth or missing value across two proportions given three
of the other values (e.g., If 3 balloons cost $2.00, then how much do 24 balloons cost?) Numerical Comparisons
Numerical comparison problems ask students to determine which of two given ratios represents more or less (e.g., Which is more or less- 3 balloons for $2.00 or 24 balloons for $12.00?)
Qualitative Comparisons
Qualitative comparison problems ask students to evaluate the effects on a ratio of a qualitative change in one or both of the quantities involved (e.g., What happens to the price of a balloon if you get more balloons for the same amount of money?)
PROPORTIONAL REASONING INTERVENTIONS
Nelson, G. (2019).
13
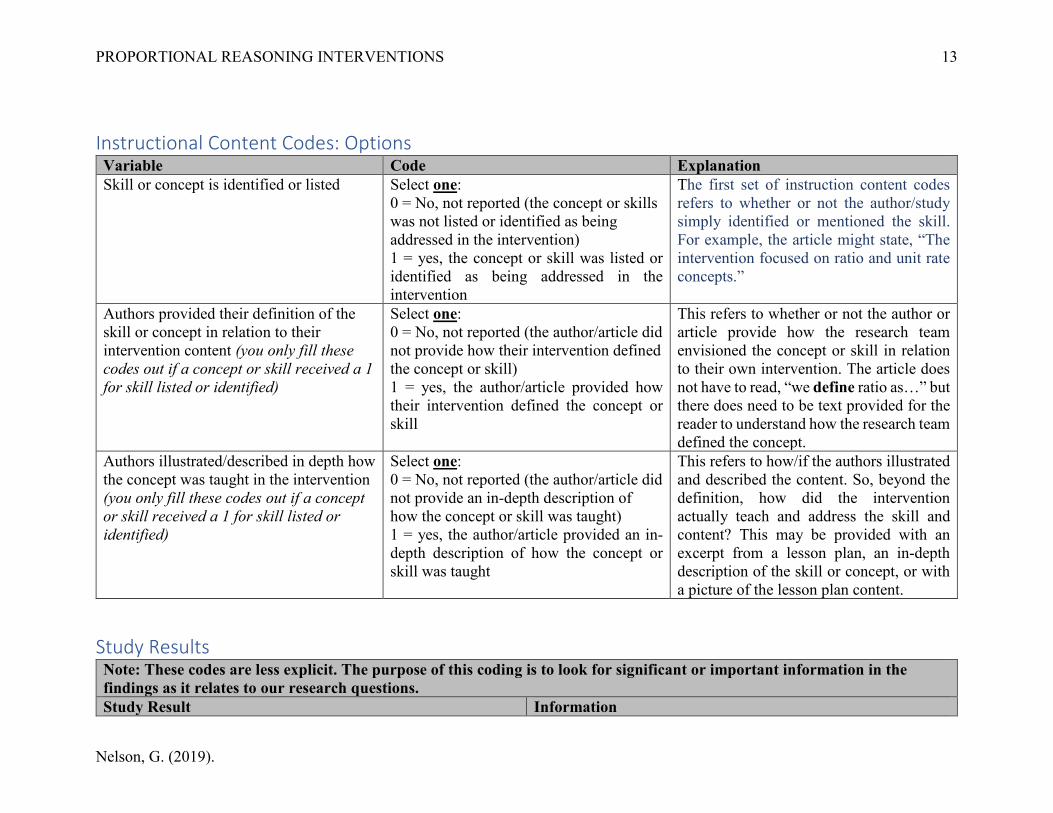
Instructional Content Codes: Options Variable Code Explanation Skill or concept is identified or listed Select one:
0 = No, not reported (the concept or skills was not listed or identified as being addressed in the intervention) 1 = yes, the concept or skill was listed or identified as being addressed in the intervention
The first set of instruction content codes refers to whether or not the author/study simply identified or mentioned the skill. For example, the article might state, “The intervention focused on ratio and unit rate concepts.”
Authors provided their definition of the skill or concept in relation to their intervention content (you only fill these codes out if a concept or skill received a 1 for skill listed or identified)
Select one: 0 = No, not reported (the author/article did not provide how their intervention defined the concept or skill) 1 = yes, the author/article provided how their intervention defined the concept or skill
This refers to whether or not the author or article provide how the research team envisioned the concept or skill in relation to their own intervention. The article does not have to read, “we define ratio as…” but there does need to be text provided for the reader to understand how the research team defined the concept.
Authors illustrated/described in depth how the concept was taught in the intervention (you only fill these codes out if a concept or skill received a 1 for skill listed or identified)
Select one: 0 = No, not reported (the author/article did not provide an in-depth description of how the concept or skill was taught) 1 = yes, the author/article provided an in-depth description of how the concept or skill was taught
This refers to how/if the authors illustrated and described the content. So, beyond the definition, how did the intervention actually teach and address the skill and content? This may be provided with an excerpt from a lesson plan, an in-depth description of the skill or concept, or with a picture of the lesson plan content.
Study Results Note: These codes are less explicit. The purpose of this coding is to look for significant or important information in the findings as it relates to our research questions. Study Result Information
PROPORTIONAL REASONING INTERVENTIONS
Nelson, G. (2019).
14
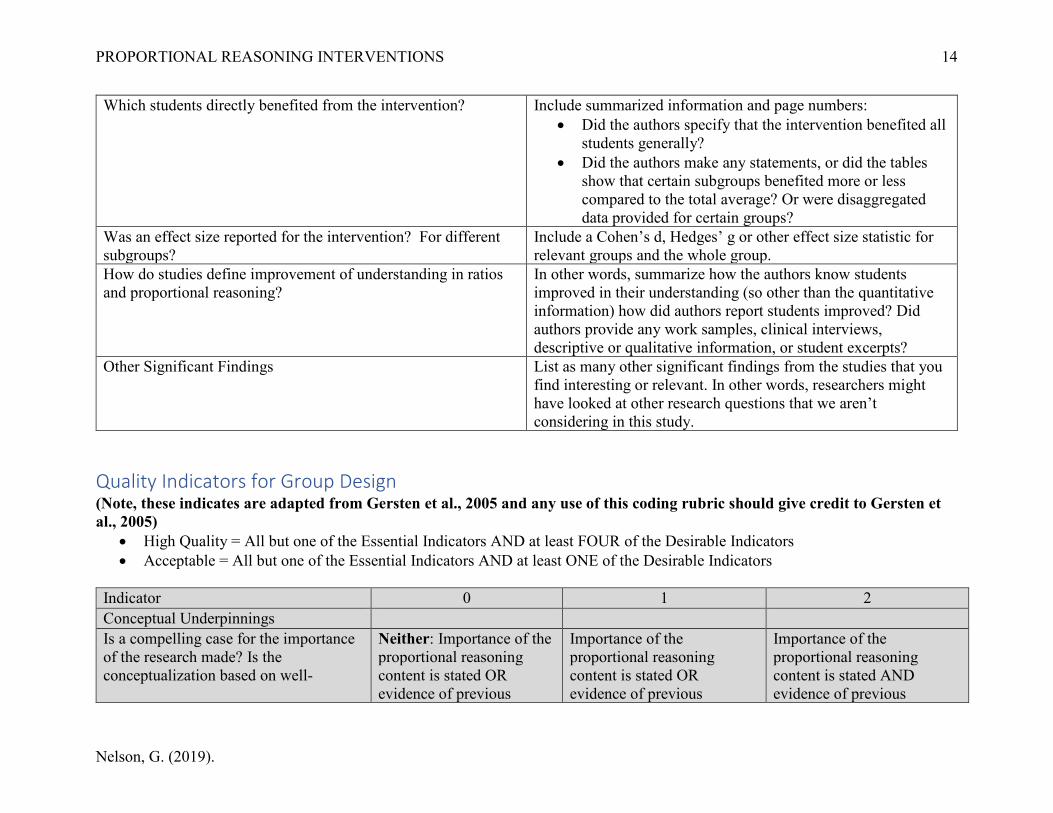
Which students directly benefited from the intervention? Include summarized information and page numbers: • Did the authors specify that the intervention benefited all
students generally? • Did the authors make any statements, or did the tables
show that certain subgroups benefited more or less compared to the total average? Or were disaggregated data provided for certain groups?
Was an effect size reported for the intervention? For different subgroups?
Include a Cohen’s d, Hedges’ g or other effect size statistic for relevant groups and the whole group.
How do studies define improvement of understanding in ratios and proportional reasoning?
In other words, summarize how the authors know students improved in their understanding (so other than the quantitative information) how did authors report students improved? Did authors provide any work samples, clinical interviews, descriptive or qualitative information, or student excerpts?
Other Significant Findings List as many other significant findings from the studies that you find interesting or relevant. In other words, researchers might have looked at other research questions that we aren’t considering in this study.
Quality Indicators for Group Design (Note, these indicates are adapted from Gersten et al., 2005 and any use of this coding rubric should give credit to Gersten et al., 2005)
• High Quality = All but one of the Essential Indicators AND at least FOUR of the Desirable Indicators • Acceptable = All but one of the Essential Indicators AND at least ONE of the Desirable Indicators
Indicator 0 1 2 Conceptual Underpinnings Is a compelling case for the importance of the research made? Is the conceptualization based on well-
Neither: Importance of the proportional reasoning content is stated OR evidence of previous
Importance of the proportional reasoning content is stated OR evidence of previous
Importance of the proportional reasoning content is stated AND evidence of previous
PROPORTIONAL REASONING INTERVENTIONS
Nelson, G. (2019).
15
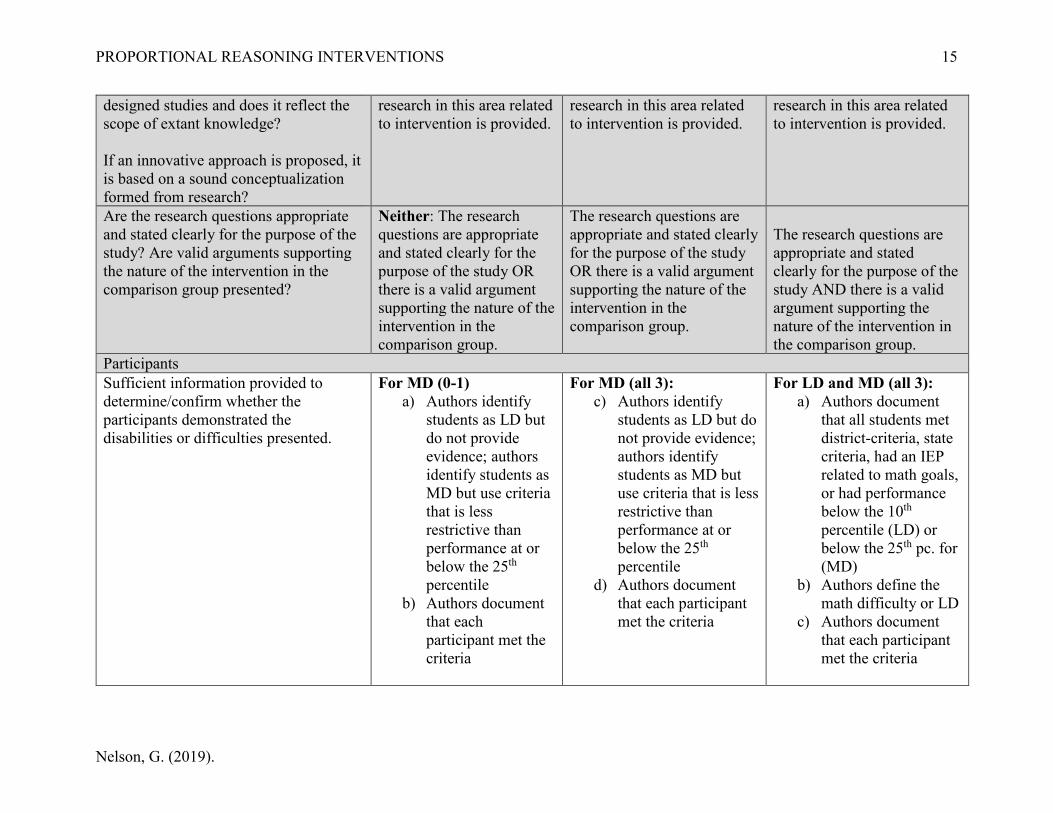
designed studies and does it reflect the scope of extant knowledge? If an innovative approach is proposed, it is based on a sound conceptualization formed from research?
research in this area related to intervention is provided.
research in this area related to intervention is provided.
research in this area related to intervention is provided.
Are the research questions appropriate and stated clearly for the purpose of the study? Are valid arguments supporting the nature of the intervention in the comparison group presented?
Neither: The research questions are appropriate and stated clearly for the purpose of the study OR there is a valid argument supporting the nature of the intervention in the comparison group.
The research questions are appropriate and stated clearly for the purpose of the study OR there is a valid argument supporting the nature of the intervention in the comparison group.
The research questions are appropriate and stated clearly for the purpose of the study AND there is a valid argument supporting the nature of the intervention in the comparison group.
Participants Sufficient information provided to determine/confirm whether the participants demonstrated the disabilities or difficulties presented.
For MD (0-1) a) Authors identify
students as LD but do not provide evidence; authors identify students as MD but use criteria that is less restrictive than performance at or below the 25th percentile
b) Authors document that each participant met the criteria
For MD (all 3): c) Authors identify
students as LD but do not provide evidence; authors identify students as MD but use criteria that is less restrictive than performance at or below the 25th percentile
d) Authors document that each participant met the criteria
For LD and MD (all 3): a) Authors document
that all students met district-criteria, state criteria, had an IEP related to math goals, or had performance below the 10th percentile (LD) or below the 25th pc. for (MD)
b) Authors define the math difficulty or LD
c) Authors document that each participant met the criteria
PROPORTIONAL REASONING INTERVENTIONS
Nelson, G. (2019).
16
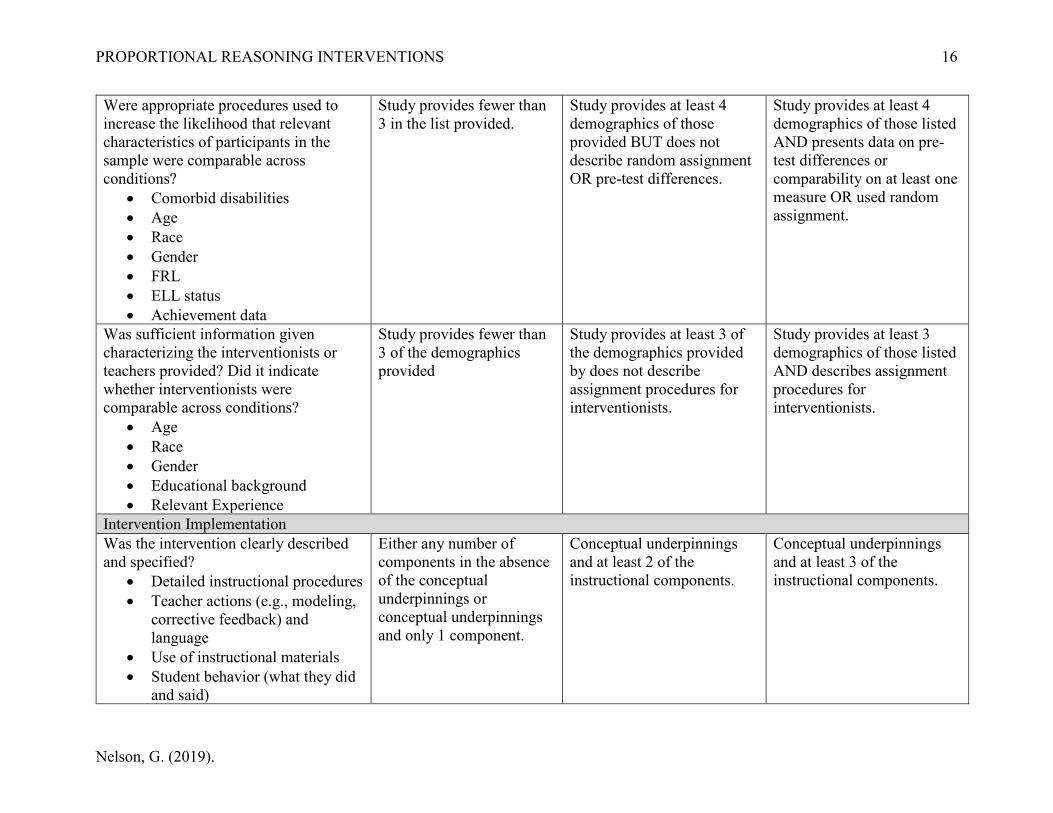
Were appropriate procedures used to increase the likelihood that relevant characteristics of participants in the sample were comparable across conditions?
• Comorbid disabilities • Age • Race • Gender • FRL • ELL status • Achievement data
Study provides fewer than 3 in the list provided.
Study provides at least 4 demographics of those provided BUT does not describe random assignment OR pre-test differences.
Study provides at least 4 demographics of those listed AND presents data on pre-test differences or comparability on at least one measure OR used random assignment.
Was sufficient information given characterizing the interventionists or teachers provided? Did it indicate whether interventionists were comparable across conditions?
• Use of instructional materials • Student behavior (what they did
and said)
Either any number of components in the absence of the conceptual underpinnings or conceptual underpinnings and only 1 component.
Conceptual underpinnings and at least 2 of the instructional components.
Conceptual underpinnings and at least 3 of the instructional components.
PROPORTIONAL REASONING INTERVENTIONS
Nelson, G. (2019).
17
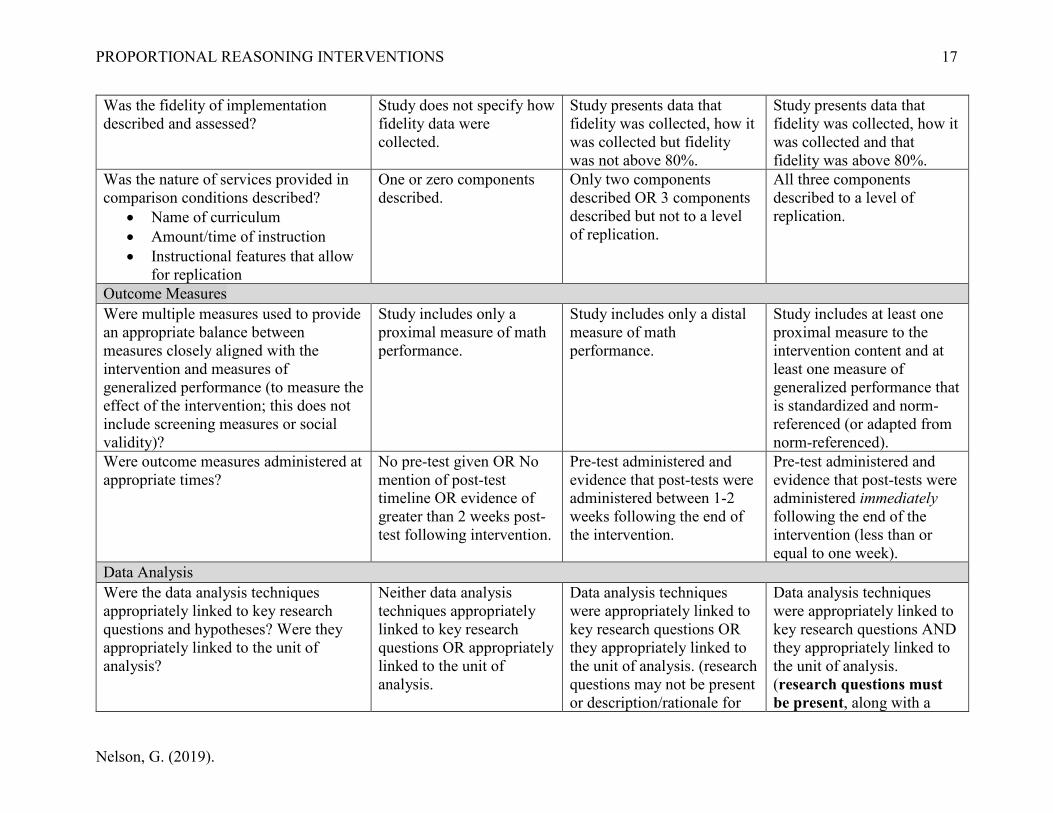
Was the fidelity of implementation described and assessed?
Study does not specify how fidelity data were collected.
Study presents data that fidelity was collected, how it was collected but fidelity was not above 80%.
Study presents data that fidelity was collected, how it was collected and that fidelity was above 80%.
Was the nature of services provided in comparison conditions described?
• Name of curriculum • Amount/time of instruction • Instructional features that allow
for replication
One or zero components described.
Only two components described OR 3 components described but not to a level of replication.
All three components described to a level of replication.
Outcome Measures Were multiple measures used to provide an appropriate balance between measures closely aligned with the intervention and measures of generalized performance (to measure the effect of the intervention; this does not include screening measures or social validity)?
Study includes only a proximal measure of math performance.
Study includes only a distal measure of math performance.
Study includes at least one proximal measure to the intervention content and at least one measure of generalized performance that is standardized and norm-referenced (or adapted from norm-referenced).
Were outcome measures administered at appropriate times?
No pre-test given OR No mention of post-test timeline OR evidence of greater than 2 weeks post-test following intervention.
Pre-test administered and evidence that post-tests were administered between 1-2 weeks following the end of the intervention.
Pre-test administered and evidence that post-tests were administered immediately following the end of the intervention (less than or equal to one week).
Data Analysis Were the data analysis techniques appropriately linked to key research questions and hypotheses? Were they appropriately linked to the unit of analysis?
Neither data analysis techniques appropriately linked to key research questions OR appropriately linked to the unit of analysis.
Data analysis techniques were appropriately linked to key research questions OR they appropriately linked to the unit of analysis. (research questions may not be present or description/rationale for
Data analysis techniques were appropriately linked to key research questions AND they appropriately linked to the unit of analysis. (research questions must be present, along with a
PROPORTIONAL REASONING INTERVENTIONS
Nelson, G. (2019).
18
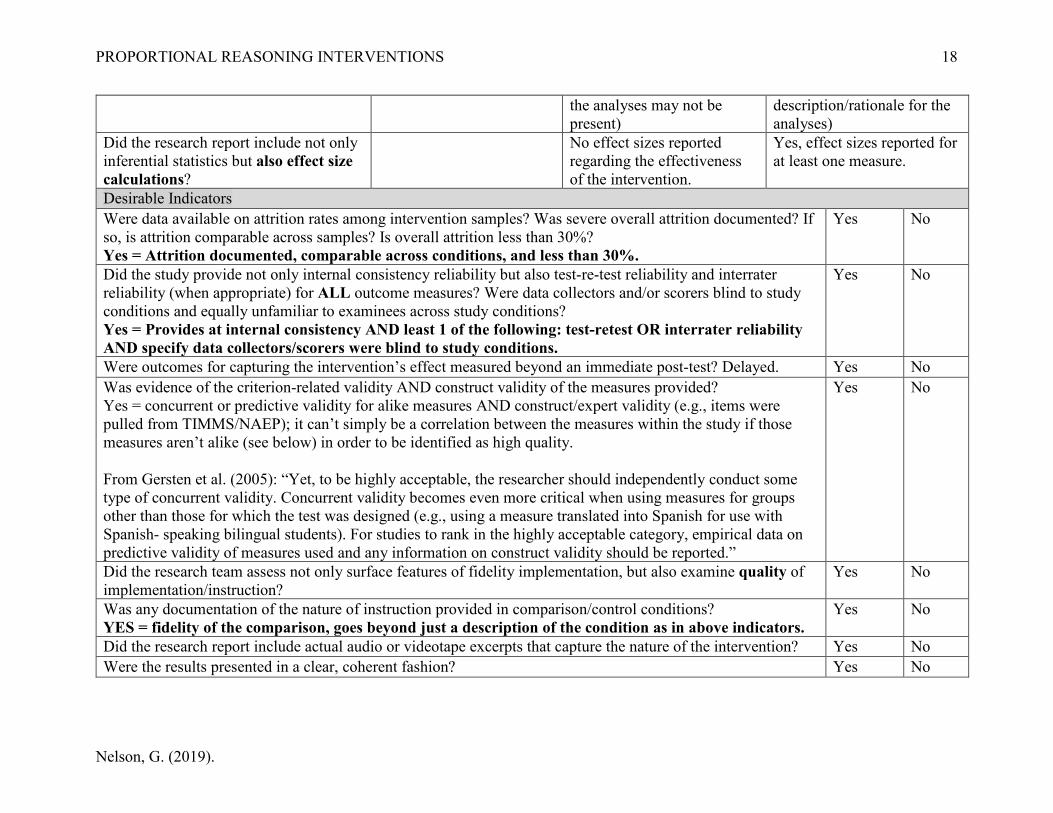
the analyses may not be present)
description/rationale for the analyses)
Did the research report include not only inferential statistics but also effect size calculations?
No effect sizes reported regarding the effectiveness of the intervention.
Yes, effect sizes reported for at least one measure.
Desirable Indicators Were data available on attrition rates among intervention samples? Was severe overall attrition documented? If so, is attrition comparable across samples? Is overall attrition less than 30%? Yes = Attrition documented, comparable across conditions, and less than 30%.
Yes No
Did the study provide not only internal consistency reliability but also test-re-test reliability and interrater reliability (when appropriate) for ALL outcome measures? Were data collectors and/or scorers blind to study conditions and equally unfamiliar to examinees across study conditions? Yes = Provides at internal consistency AND least 1 of the following: test-retest OR interrater reliability AND specify data collectors/scorers were blind to study conditions.
Yes No
Were outcomes for capturing the intervention’s effect measured beyond an immediate post-test? Delayed. Yes No Was evidence of the criterion-related validity AND construct validity of the measures provided? Yes = concurrent or predictive validity for alike measures AND construct/expert validity (e.g., items were pulled from TIMMS/NAEP); it can’t simply be a correlation between the measures within the study if those measures aren’t alike (see below) in order to be identified as high quality.
From Gersten et al. (2005): “Yet, to be highly acceptable, the researcher should independently conduct some type of concurrent validity. Concurrent validity becomes even more critical when using measures for groups other than those for which the test was designed (e.g., using a measure translated into Spanish for use with Spanish- speaking bilingual students). For studies to rank in the highly acceptable category, empirical data on predictive validity of measures used and any information on construct validity should be reported.”
Yes No
Did the research team assess not only surface features of fidelity implementation, but also examine quality of implementation/instruction?
Yes No
Was any documentation of the nature of instruction provided in comparison/control conditions? YES = fidelity of the comparison, goes beyond just a description of the condition as in above indicators.
Yes No
Did the research report include actual audio or videotape excerpts that capture the nature of the intervention? Yes No Were the results presented in a clear, coherent fashion? Yes No
PROPORTIONAL REASONING INTERVENTIONS
Nelson, G. (2019).
19
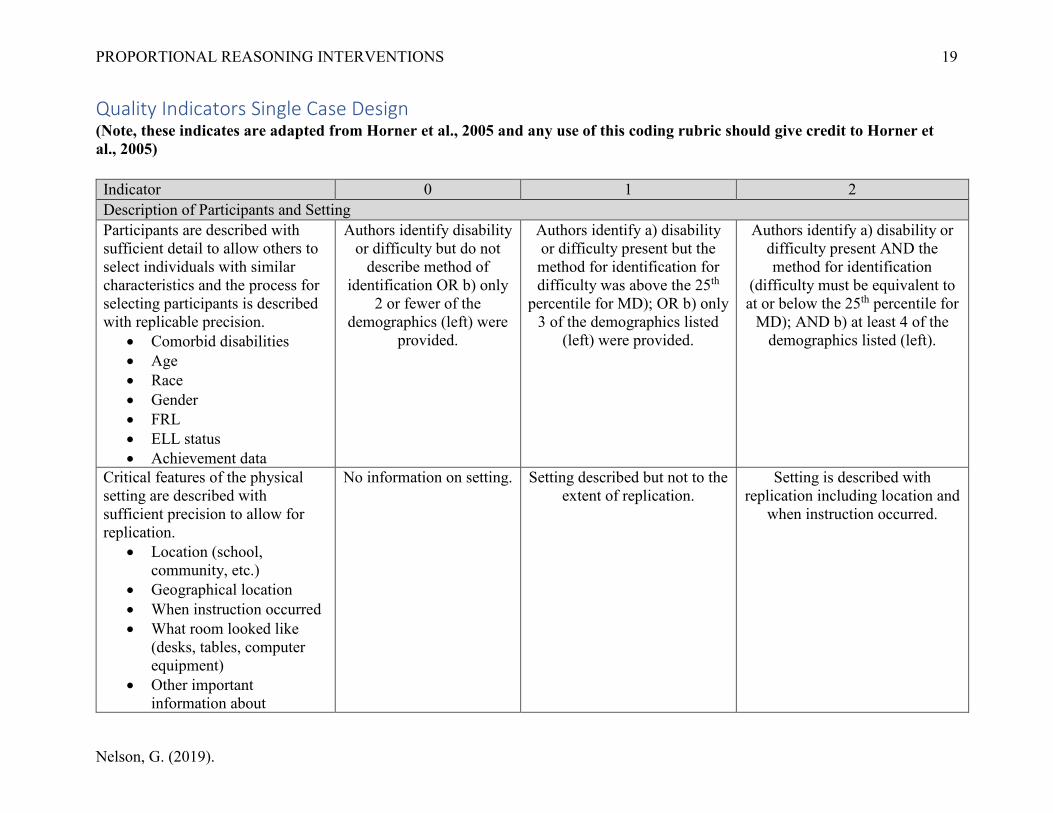
Quality Indicators Single Case Design (Note, these indicates are adapted from Horner et al., 2005 and any use of this coding rubric should give credit to Horner et al., 2005) Indicator 0 1 2 Description of Participants and Setting Participants are described with sufficient detail to allow others to select individuals with similar characteristics and the process for selecting participants is described with replicable precision.
• Comorbid disabilities • Age • Race • Gender • FRL • ELL status • Achievement data
Authors identify disability or difficulty but do not
describe method of identification OR b) only
2 or fewer of the demographics (left) were
provided.
Authors identify a) disability or difficulty present but the method for identification for difficulty was above the 25th
percentile for MD); OR b) only 3 of the demographics listed
(left) were provided.
Authors identify a) disability or difficulty present AND the method for identification
(difficulty must be equivalent to at or below the 25th percentile for
MD); AND b) at least 4 of the demographics listed (left).
Critical features of the physical setting are described with sufficient precision to allow for replication.
• Location (school, community, etc.)
• Geographical location • When instruction occurred • What room looked like
(desks, tables, computer equipment)
• Other important information about
No information on setting. Setting described but not to the extent of replication.
Setting is described with replication including location and
when instruction occurred.
PROPORTIONAL REASONING INTERVENTIONS
Nelson, G. (2019).
20
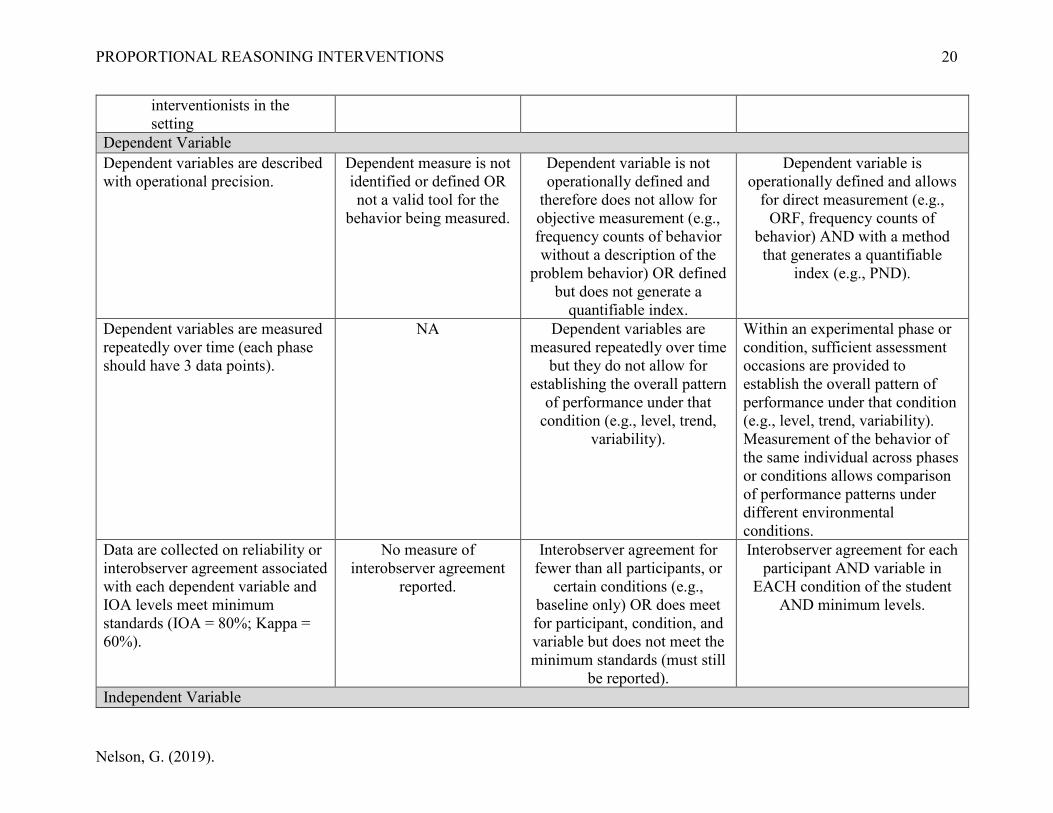
interventionists in the setting
Dependent Variable Dependent variables are described with operational precision.
Dependent measure is not identified or defined OR not a valid tool for the
behavior being measured.
Dependent variable is not operationally defined and
therefore does not allow for objective measurement (e.g., frequency counts of behavior without a description of the
problem behavior) OR defined but does not generate a
quantifiable index.
Dependent variable is operationally defined and allows
for direct measurement (e.g., ORF, frequency counts of
behavior) AND with a method that generates a quantifiable
index (e.g., PND).
Dependent variables are measured repeatedly over time (each phase should have 3 data points).
NA Dependent variables are measured repeatedly over time
but they do not allow for establishing the overall pattern
of performance under that condition (e.g., level, trend,
variability).
Within an experimental phase or condition, sufficient assessment occasions are provided to establish the overall pattern of performance under that condition (e.g., level, trend, variability). Measurement of the behavior of the same individual across phases or conditions allows comparison of performance patterns under different environmental conditions.
Data are collected on reliability or interobserver agreement associated with each dependent variable and IOA levels meet minimum standards (IOA = 80%; Kappa = 60%).
No measure of interobserver agreement
reported.
Interobserver agreement for fewer than all participants, or
certain conditions (e.g., baseline only) OR does meet for participant, condition, and variable but does not meet the minimum standards (must still
be reported).
Interobserver agreement for each participant AND variable in
EACH condition of the student AND minimum levels.
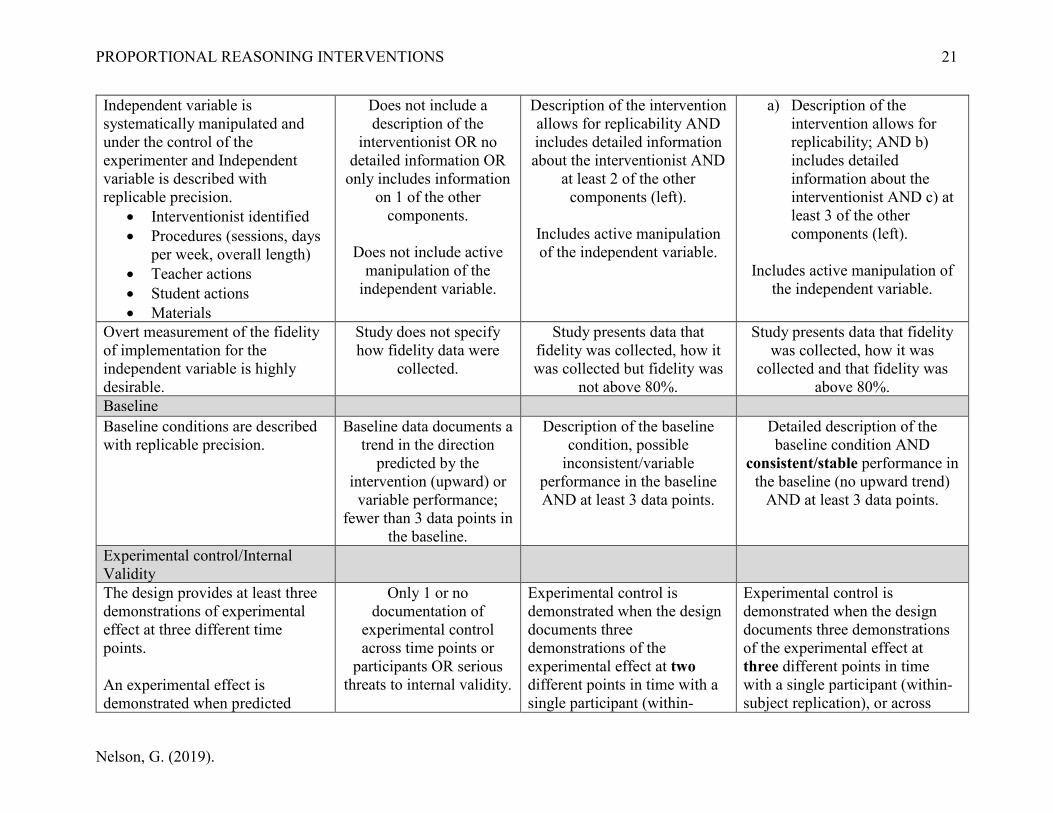
Independent Variable
PROPORTIONAL REASONING INTERVENTIONS
Nelson, G. (2019).
21
Independent variable is systematically manipulated and under the control of the experimenter and Independent variable is described with replicable precision.
• Interventionist identified • Procedures (sessions, days
Description of the intervention allows for replicability AND includes detailed information about the interventionist AND
at least 2 of the other components (left).
Includes active manipulation of the independent variable.
a) Description of the intervention allows for replicability; AND b) includes detailed information about the interventionist AND c) at least 3 of the other components (left).
Includes active manipulation of
the independent variable.
Overt measurement of the fidelity of implementation for the independent variable is highly desirable.
Study does not specify how fidelity data were
collected.
Study presents data that fidelity was collected, how it was collected but fidelity was
not above 80%.
Study presents data that fidelity was collected, how it was
collected and that fidelity was above 80%.
Baseline Baseline conditions are described with replicable precision.
Baseline data documents a trend in the direction
predicted by the intervention (upward) or
variable performance; fewer than 3 data points in
the baseline.
Description of the baseline condition, possible
inconsistent/variable performance in the baseline AND at least 3 data points.
Detailed description of the baseline condition AND
consistent/stable performance in the baseline (no upward trend)
AND at least 3 data points.
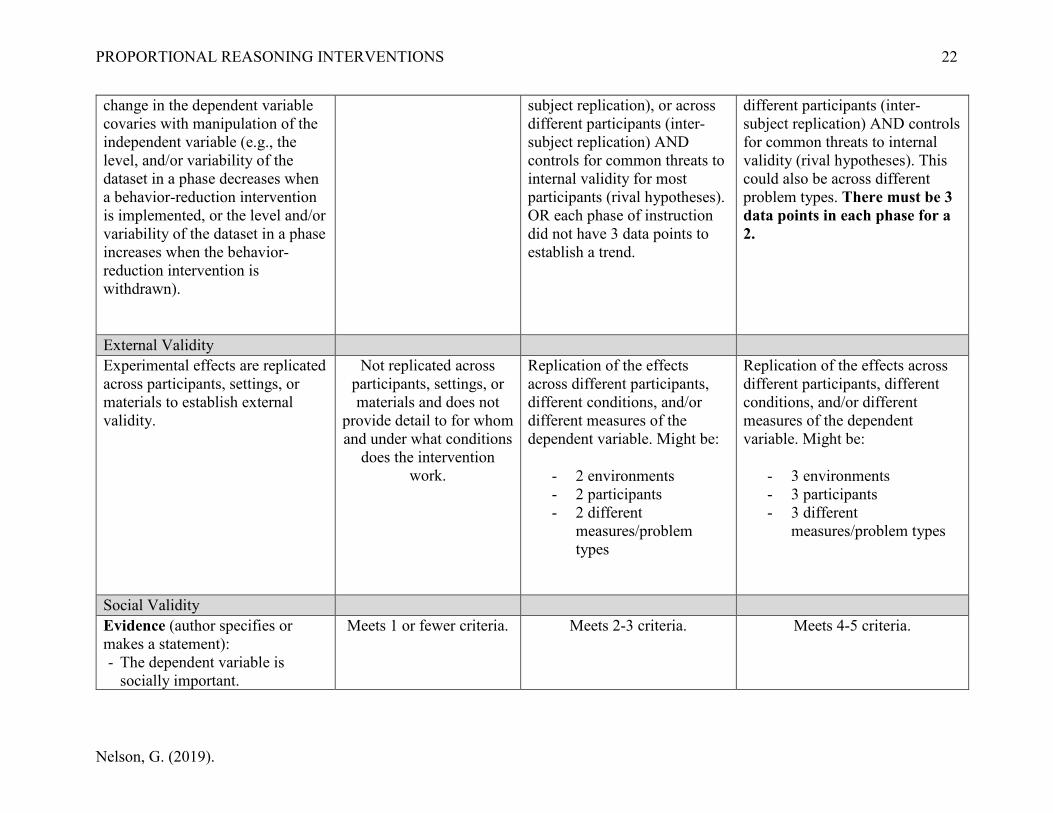
Experimental control/Internal Validity
The design provides at least three demonstrations of experimental effect at three different time points.
An experimental effect is demonstrated when predicted
Only 1 or no documentation of
experimental control across time points or
participants OR serious threats to internal validity.
Experimental control is demonstrated when the design documents three demonstrations of the experimental effect at two different points in time with a single participant (within-
Experimental control is demonstrated when the design documents three demonstrations of the experimental effect at three different points in time with a single participant (within-subject replication), or across
PROPORTIONAL REASONING INTERVENTIONS
Nelson, G. (2019).
22
change in the dependent variable covaries with manipulation of the independent variable (e.g., the level, and/or variability of the dataset in a phase decreases when a behavior-reduction intervention is implemented, or the level and/or variability of the dataset in a phase increases when the behavior-reduction intervention is withdrawn).
subject replication), or across different participants (inter-subject replication) AND controls for common threats to internal validity for most participants (rival hypotheses). OR each phase of instruction did not have 3 data points to establish a trend.
different participants (inter-subject replication) AND controls for common threats to internal validity (rival hypotheses). This could also be across different problem types. There must be 3 data points in each phase for a 2.
External Validity Experimental effects are replicated across participants, settings, or materials to establish external validity.
Not replicated across participants, settings, or materials and does not
provide detail to for whom and under what conditions
does the intervention work.
Replication of the effects across different participants, different conditions, and/or different measures of the dependent variable. Might be:
- 2 environments - 2 participants - 2 different
measures/problem types
Replication of the effects across different participants, different conditions, and/or different measures of the dependent variable. Might be:
- 3 environments - 3 participants - 3 different
measures/problem types
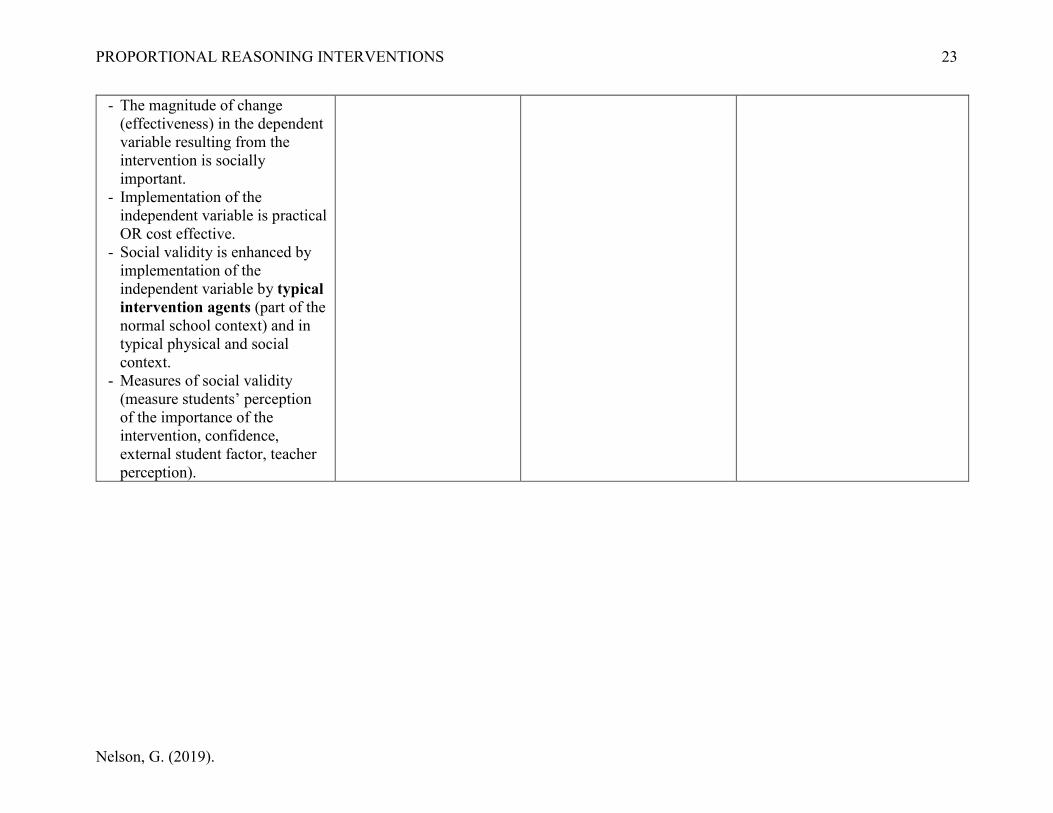
Social Validity Evidence (author specifies or makes a statement): - The dependent variable is
- The magnitude of change (effectiveness) in the dependent variable resulting from the intervention is socially important.
- Implementation of the independent variable is practical OR cost effective.
- Social validity is enhanced by implementation of the independent variable by typical intervention agents (part of the normal school context) and in typical physical and social context.
- Measures of social validity (measure students’ perception of the importance of the intervention, confidence, external student factor, teacher perception).
PROPORTIONAL REASONING INTERVENTIONS
Nelson, G. (2019).
24
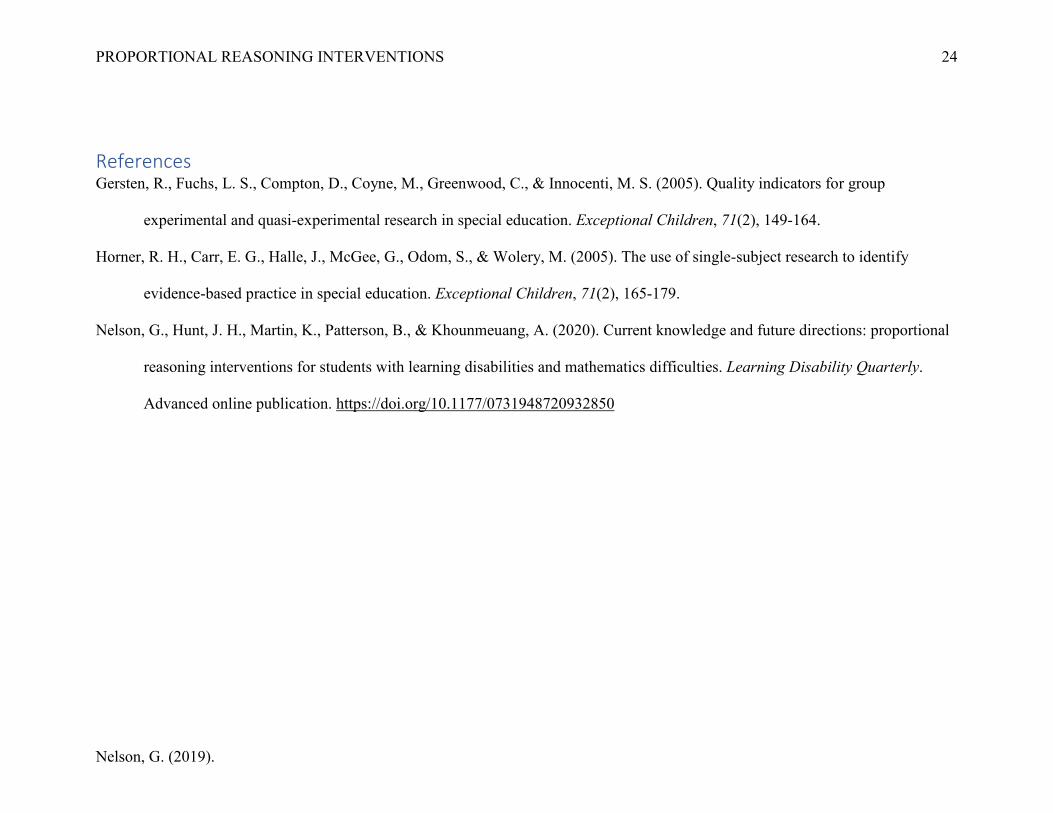
References Gersten, R., Fuchs, L. S., Compton, D., Coyne, M., Greenwood, C., & Innocenti, M. S. (2005). Quality indicators for group
experimental and quasi-experimental research in special education. Exceptional Children, 71(2), 149-164.
Horner, R. H., Carr, E. G., Halle, J., McGee, G., Odom, S., & Wolery, M. (2005). The use of single-subject research to identify
evidence-based practice in special education. Exceptional Children, 71(2), 165-179.
Nelson, G., Hunt, J. H., Martin, K., Patterson, B., & Khounmeuang, A. (2020). Current knowledge and future directions: proportional
reasoning interventions for students with learning disabilities and mathematics difficulties. Learning Disability Quarterly.