Proposal E-mobility Readiness Plan Chile To be presented as a Nationally Appropriate Mitigation Action (NAMA) to the UNFCCC Developed by Ministerio del Medio Ambiente del Gobierno de Chile Ministerio de Transporte y Telecomunicaciones del Gobierno de Chile With support from International Climate Initiative of the German Government ECOFYS Germany Fundación Chile Sistemas Sustentables Chile February 2012
Transcript
Proposal E-mobility Readiness Plan Chile
To be presented as a Nationally Appropriate Mitigation Action (NAMA) to the UNFCCC
Developed by
Ministerio del Medio Ambiente del Gobierno de Chile Ministerio de Transporte y Telecomunicaciones del Gobierno de
Chile
With support from
International Climate Initiative of the German Government ECOFYS Germany Fundación Chile
Sistemas Sustentables Chile
February 2012
Proposal for a Nationally Appropriate Mitigation Action (NAMA) in the transport sector in Chile
2
Table of contents
1 Context and strategic assessment ............................................................................................................................7
1.1 The climate policy context .................................................................................................................................8
1.2 Emissions situation in Chile ..............................................................................................................................8
1.3 Electric mobility .................................................................................................................................................. 10
1.3.1 International developments ................................................................................................................. 12
1.3.2 E-mobility in Chile to-date .................................................................................................................... 13
2.3.1 Phase I ........................................................................................................................................................... 16
2.3.2 Phase II .......................................................................................................................................................... 17
2.4.1 Pilot programmes ..................................................................................................................................... 18
2.4.2 Market study ............................................................................................................................................... 21
2.4.3 Business plan for a car sharing service ........................................................................................... 22
2.5.2 Solar charger pilot .................................................................................................................................... 27
2.6.2 Education and training ........................................................................................................................... 31
2.7 Communication and Public Diffusion ........................................................................................................ 32
2.8 Total financing requirements for Phase I ................................................................................................. 34
3.1.2 Co benefits ................................................................................................................................................... 37
4 Implementation plan .................................................................................................................................................. 39
Proposal for a Nationally Appropriate Mitigation Action (NAMA) in the transport sector in Chile
3
4.1 Timelines and milestones ............................................................................................................................... 39
4.1.1 Phase I ........................................................................................................................................................... 39
4.1.2 Phase II .......................................................................................................................................................... 40
4.2 Institutional arrangement for implementation ..................................................................................... 41
Appendix I – GHG Reduction Calculations .................................................................................................................. 55
Proposal for a Nationally Appropriate Mitigation Action (NAMA) in the transport sector in Chile
4
List of tables Table 1 Activities under the Market Creation pillar in Phase I ........................................................................... 18 Table 2 Activities under the Market Creation pillar in Phase II ......................................................................... 23 Table 3 Activities under the Charging Infrastructure pillar in Phase I ........................................................... 25 Table 4 Activities under the Charging Infrastructure pillar in Phase II .......................................................... 28 Table 5 Activities under the Research and Development pillar in Phase I .................................................... 30 Table 6 Budget for the E-Mobility Readiness Plan .................................................................................................. 34 Table 7 Key assumptions for emission calculations ............................................................................................... 36 Table 8 Overall programme evaluation indicators .................................................................................................. 44 Table 9 Evaluation indicators and targets for the Market Creation pillar ..................................................... 45 Table 10 Measurement and reporting details for the Market Creation pillar .............................................. 46 Table 11 Evaluation indicators and targets for the Charging Infrastructure pillar ................................... 47 Table 12 Measurement and reporting details for the Charging Infrastructure pillar............................... 47 Table 13 Evaluation indicators and targets for the Research and Development pillar ........................... 49 Table 14 Measurement and reporting details for the Research and Development pillar ....................... 49 Table 15 Evaluation indicators and targets for communication and public diffusion activities .......... 50 Table 16 Measurement and reporting details for communication and public diffusion activities ..... 50
Proposal for a Nationally Appropriate Mitigation Action (NAMA) in the transport sector in Chile
5
List of figures Figure 1-1: Planned Transport Policy Framework .....................................................................................................7 Figure 1-2: GHG emissions by sector - year 2006 .......................................................................................................9 Figure 1-3: Projected GHG emissions in the Chilean transport sector. ..............................................................9 Figure 1-4: Projected GHG emissions in Chilean road transport by type of vehicle. ....................................9 Figure 1-5: Well-to-wheel scenarios for electric vehicles .................................................................................... 11 Figure 1-6: Breakeven cost of electric batteries vs. gasoline (US$) (Deloitte, 2010) ................................ 14 Figure 2-1: E-mobility Plan overview ........................................................................................................................... 16 Figure 2-2: E-mobility Readiness Plan budget share .............................................................................................. 34 Figure 3-1: Forecast of number of grid enabled vehicles by 2020.................................................................... 36 Figure 3-2: CO2 emissions reduction until 2035....................................................................................................... 37 Figure 4-1: Implementation plan for Phase I (2012 to 2014) ............................................................................. 39 Figure 4-2: Implementation plan for Phase II (2015 to 2020) ........................................................................... 40 Figure 4-3: Institutional arrangement for the NAMA ............................................................................................. 41 Figure 4-4: Dimensions of MRV ....................................................................................................................................... 43 Figure 4-5: OECD/DAC Results Chain Framework .................................................................................................. 44
Proposal for a Nationally Appropriate Mitigation Action (NAMA) in the transport sector in Chile
6
List of abbreviations
BEV Battery electric vehicles EV Electric vehicle ICE Internal combustion engine MoE Chilean Ministry of Environment NAMA Nationally appropriate mitigation action PHEV Plug-in hybrid electric vehicle PIU Programme Implementation Unit, the entity responsible for
implementation of the NAMA. REEV Range-extended electric vehicle UNFCCC United Nations Framework Convention on Climate Change
Proposal for a Nationally Appropriate Mitigation Action (NAMA) in the transport sector in Chile
7
“E-Mobility Readiness Plan”
This document presents a proposal for a Nationally Appropriate Mitigation Action (NAMA) in Chile. The NAMA will facilitate the deployment of e-mobility technologies to reach a target of 70.000 electric vehicles on the road by 2020. The NAMA is expected to contribute to the ambitious greenhouse gas (GHG) reduction target of the Chilean government and help put the country on a path towards a low carbon economy.
Nationally Appropriate Mitigation Actions (NAMAs) refer to government-backed activities that countries undertake as part of a pledge to reduce greenhouse gas emissions. The term recognizes that countries have a shared, but differentiated responsibility to combat climate change. All countries should undertake activities to reduce their greenhouse gas emissions but some countries should carry more of a burden than others due to their historical responsibility. International agreements state that developed countries will provide support to developing countries through financing, technology transfer and capacity building to undertake NAMAs. As a developing country, Chile seeks support to undertake the NAMA specified in this proposal. The proposal is organized into four chapters. The first chapter presents the general policy context and emissions scenarios in Chile, the second describes the proposed activities in detail, the third shows expected impacts and the last sets out the implementation and monitoring indicators.
1 Context and strategic assessment
The E-mobility Readiness Plan that is being proposed as a NAMA is part of a wider government policy aimed at increasing the share of low and zero emission vehicles in the national vehicle fleet. The policy is targeted at the passenger, commercial and public transport fleets and incorporates highly efficient vehicles, low emission vehicles, hybrids and grid-enabled electric vehicles.
Figure 1-1: Planned Transport Policy Framework
Proposal for a Nationally Appropriate Mitigation Action (NAMA) in the transport sector in Chile
8
The policy will include the introduction of a feebate system as well as normative changes to introduce more stringent regulations to the vehicle fleet.
• Feebate system: The feebate system imposes a fee on new, high-emitting vehicles and simultaneously provides a rebate for low-emitting vehicles. The policy is designed to be fiscally neutral, so that revenues and outlays are equal.
• Improvements to the regulatory framework will include a review of current emission standard as well as the introduction of minimum emission standards for vehicle fleets.
The feebate system and normative changes will provide an enabling framework for programmes targeted at specific technologies, subsectors and regions.
The E-mobility Readiness Plan fits within this policy and is designed to promote the introduction of electric vehicles on a large scale and incentivize their use in private and public transportation systems. The Plan will undertake measures to stimulate electric vehicle demand, establish charging infrastructure and transfer e-mobility technologies and capacities to the country.
Given the transformative nature of the programme and the high potential for international technology and knowledge transfer, it was decided to develop the E-mobility Readiness Plan as a NAMA and seek international financial, technology and capacity-building support. International support is necessary to enable the implementation of the Plan and achieve the expected benefits.
1.1 The climate policy context
Chile is very active in the international climate policy debate and has set itself an ambitious GHG reduction target. It was officially submitted to the Copenhagen Accord on August 23rd, 2010 stating that Chile “will take nationally appropriate mitigation actions to achieve a 20% deviation below the ‘Business-as-Usual’ (BAU) emission growth trajectory by 2020, as projected from the year 2007. To accomplish this objective Chile will need a relevant level of international support.”
The Government of Chile, through the Ministry of Environment published the Second National Communication of Chile to the United Nations Framework Convention on Climate Change (UNFCCC), fulfilling the primary commitment of the country with the signing of the Convention. This document compiles a decade of activities, initiatives and information generated in the country on various issues related to climate change.
1.2 Emissions situation in Chile
From the last National Communication under the UNFCCC(Figure 1-2), GHG emissions in Chile in 2006 were 79.057 Gg CO2eq, of which transport accounts for 22% (17.062 Gg CO2eq) of GHG emissions. Per capita emissions are still below those of industrialized countries but above most countries in the Latin America region.
Proposal for a Nationally Appropriate Mitigation Action (NAMA) in the transport sector in Chile
9
Figure 1-2: GHG emissions by sector - year 2006
Source: (Ministerio del Medio Ambiente, 2011)
*CPR (commercial, public and residential) Within the transport sector, the contribution of individual sub-sectors highlights the dominance of road transport in the overall share (20% of GHG emissions). Projections for the transport sector show that under a business-as-usual (BAU) scenario, emissions would grow by 40% between 2010 and 2020 (Figure 1-3). This is equivalent to a total of 25.000 Gg CO2eq/year in 2020. The road transport sub-sector represents 90% of all emissions and within that, private vehicles have the largest share (Figure 1-4).
Environmental transport policy to date has focused on local air pollution control. Significant efforts have been made to reduce air pollution impacts, particularly in Santiago, by introducing fuel emission standards across all new vehicle categories following the EURO and EPA systems.
Given the rising impact of the transport sector in terms of GHG emissions, the government identified a clear need to put a policy in place to reduce transport-related GHG emissions.
Figure 1-3: Projected GHG emissions in the Chilean
transport sector. Source: (Ministerio del Medio Ambiente, 2011)
Figure 1-4: Projected GHG emissions in Chilean road
transport by type of vehicle. Source: (Ministerio del Medio Ambiente, 2011)
Electric Generation27%
Manufacture, construction, mining
17%
CPR 5%
Other5%
Industrial processes7%
Agriculture17%
National Road Transp.20%
National Air Transp.1%
Other1%
National Transport22%
Proposal for a Nationally Appropriate Mitigation Action (NAMA) in the transport sector in Chile
10
There are three types of strategies generally considered to reduce GHG emissions and reduce the environmental impact of the transport sector. These can be categorized using the Avoid-Shift-Improve approach1:
• Avoid – refers to the need to reduce transport needs. Through integrated land-use planning and transport demand management, the need to travel and the trip length may be reduced.
• Shift – seek to change from the most energy consuming transport modes towards more environmentally-friendly options e.g. non-motorized transport and public transport.
• Improve – focuses on vehicle and fuel efficiency and the optimization of transport infrastructure. It aims to improve the technology and the use of alternative energy is acknowledged.
1.3 Electric mobility
Electric mobility has gained attention as a strategy to mitigate GHG emissions and decrease petroleum dependency in the context of increasing world-wide vehicle demand. Transport is a major energy consumer and among the largest sources of GHG emissions. It is also one of the principal sources of urban air pollution, which impacts the local environment and human health. Trends in Chile and internationally signal that ownership of passenger vehicles will continue to grow in the coming decades. At the same time, the world will have to undertake measures to reduce total GHG emissions by 35-50% below 1990 levels by 2050 in order to limit the worst impacts from global climate change2.
Car ownership is expected to continue growing. Forecasts predict an increase in the worldwide vehicle stock to 2,08 billion by 2030 compared to 812 million in 20023. Approximately 77% of this growth will happen in developing countries. Vehicle ownership is strongly linked to increases in welfare and as countries become wealthier, their vehicle fleet will grow. Chile currently has 172 vehicles per 1000 people and if it were to reach levels comparable to the United States, its fleet would grow 470%4. Even the Netherlands, the country with the best bicycle infrastructure in the world and an extensive rail network, has 3 times more cars per person than Chile. Chile will need to manage the expected growth in the vehicle fleet through better urban planning, public transport, modal shift and also improvements in vehicle technology. All of these strategies will play a role in a sustainable transport future.
Electric vehicles can improve the efficiency of the vehicle fleet, providing environmental and energy gains compared to conventional vehicles. A study of passenger vehicles with electric motors showed better well-to-wheel energy efficiency and GHG performance than internal combustion
1 (GIZ, 2012) 2 (UNEP, 2011) 3 (Dargay, Gately, & Sommer, 2007) 4 (The World Bank, 2008)
Proposal for a Nationally Appropriate Mitigation Action (NAMA) in the transport sector in Chile
11
engines. Figure 1-5 shows an assessment of plug-in hybrid electric vehicles and conventional vehicles under various assumptions for electricity generation in the United States. Even under a scenario of electricity being generated with 100% old coal technologies, a plug-in hybrid had approximately 25% less emissions than a conventional vehicle5. Using gas turbines, combined cycle gas turbines and renewables yielded considerably fewer well-to-wheel emissions. As a reference, Chile uses approximately 34% hydro, 30% natural gas, 20% coal, 13% petroleum derivatives, 2% biomass and 1% wind in its current electricity mix6.
Figure 1-5: Well-to-wheel scenarios for electric vehicles
Source: Electrification Coalition, 2009 Another advantage of electric vehicles is that electricity can be produced with a variety of fuels and renewable resources which can help a country diversify its energy mix away from imported petroleum. Chile imports around 95% of its crude oil supply7. At the same time, it has one of the most productive solar regions in the world, which starts 300km north of Santiago and extends past Antofagasta and towards the border with Peru and Bolivia8. Chile also has significant wind resources.
Other benefits of electric vehicles include9:
● Electric vehicles produce zero local pollution and less noise. ● Electric miles are cheaper than gasoline miles due to the high efficiency of electric motors. ● The power sector has spare capacity, especially at night when consumers require less
electricity than the system is capable of delivering. ● The network of infrastructure already exists and therefore, the main requirements are the
deployment of charging infrastructure and grid reliability.
Proposal for a Nationally Appropriate Mitigation Action (NAMA) in the transport sector in Chile
12
However, there are still significant uncertainties over the future of electric mobility. Its ability to win a large market share will depend on future technological developments. Electric vehicles (EVs) carry premiums in the order of 20-40% over conventional vehicles. Prices will have to substantially decrease in order to achieve mass market penetration. EVs also do not have comparable performance to internal combustion (ICE) vehicles. There is a much lesser range per charge and significantly longer refuelling (charging) times which make them less effective for long-distance travel. Technological developments in batteries which achieve cost reductions and performance improvements are needed for the EV to have a realistic opportunity to reach the mass market.
1.3.1 International developments
Despite the many uncertainties about the future of electric vehicles, governments and companies are cautiously moving forward. Several countries have plans to promote electric vehicles and build charging infrastructure. Among these are (Lesser and Traube 2011):
● United States - the “EV Project” started in 2009 with an investment of US$ 230 million for deploying approximately 14.000 chargers in 18 major cities.10
● Portugal - the Mobi.e Network is a pilot plan which sets to build 1.300 public charging stations and 50 fast charging stations.11
● Germany - the National Electromobility Development Plan12 launched in 2010 seeks to reach 1 million EVs on the road by 2020.
● Taiwan - the Ministry of Economic Affairs13 is piloting an electric car research consortium. ● United Kingdom - The country seeks to create a network of charging stations and establish
“electric car cities”14 around the country. ● Australia - Clean Driving15 is an initiative to promote the benefits of EVs, as well as educate
on sustainable options for transport. ● Ireland - The Sustainable Energy Authority of Ireland (SEAI)16 has implemented a grant
scheme where all vehicles with CO2 emissions of less than 75g CO2 per km are eligible for a purchase subsidy of up to €5.000. All-electric cars will be eligible for the grant scheme.
● Spain - the “Movele Project”17 invests €10 million in EVs, of which €8 million are for car purchases, €1,5 are for deployment of charging infrastructure and €0,5 million are for technical assistance.
● There is a joint initiative between China and USA called the “U.S.-China Electric Vehicles Initiative”18 to accelerate the deployment of electric vehicles. The joint activities include standard development, demonstrations, creating a technical roadmap, and public awareness and engagement.
Proposal for a Nationally Appropriate Mitigation Action (NAMA) in the transport sector in Chile
13
● Car sharing systems have been implemented with full electric cars in different cities as a way of reducing CO2 emissions and congestion in big cities. Some examples of this are the “Car2Go”19 in Austin, Texas “CityHop”20 in Auckland, Wellington and Christchurch-New Zealand and “Autolib”21 in Paris-France.
The market for EVs has also grown considerably and several manufacturers are announcing large investments to meet expected vehicle demand. Among the largest is Renault-Nissan with a €4 billion investment targeting cumulative sales of 1,5 million electric vehicles by 201722,23 and Chevrolet, which is planning cumulative production of the Chevy Volt at 745.000 by 201724. Others include Ford, Mercedes Benz, BMW, Toyota, Mitsubishi, Citroen, Peugeot, Honda and Tesla which are either currently producing grid-enabled EVs or are set to start production within the next two years.
1.3.2 E-mobility in Chile to-date
In 2008 the General Treasury of Chile promulgated a hybrid vehicles law (Law 20.259) designed to promote the use of hybrid electric vehicles. The law grants a refund to vehicle owners of the cost of the annual registration certificate for four years. As a consequence, between 2008 and 2010 around 400 hybrid vehicles were registered in Chile.
In addition, some municipalities have changed their administrative fleets to hybrid electric vehicles and battery electric vehicles. For example, the Municipality of Vitacura in Santiago purchased hybrid electric vehicles for their fleet and the Municipality of Providencia is planning to buy 20 full electric vehicles (BEVs) by the end of 2011 to replace their gasoline fleet. In April 2011, the president of Chile inaugurated the first charging station in Latin America in the City of Santiago. The station is owned by Chilectra, a major electricity company in Chile. It allows the fast-charging of electric vehicles at up to 80% of battery capacity in 30 minutes, yielding a driving range of approximately 130km. Chilectra has stated that with current generating capacity, around 200.000 electric vehicles, representing a consumption of about 436 GWh/ year, could be supplied without additional capacity. A study by the University of Chile concluded the following25:
● There are no significant barriers to the introduction of medium loading chargers in the country. Easy access in residences to single-phase power at 220V at up to 40A allows charging at medium speed.
● It is expected that the electric vehicle industry will evolve gradually. The speed of this transition will depend on the cost of electricity, the cost of lithium-ion batteries, the price of oil and the range and power of EVs compared to internal combustion vehicles.
Proposal for a Nationally Appropriate Mitigation Action (NAMA) in the transport sector in Chile
14
● Municipalities play a key role in the implementation of the infrastructure through the provision of funding and licenses.
● A subsidy system for companies that create and host charging networks for private/public use (e.g. highways, parking lots) would be helpful, if not required.
Nonetheless, e-mobility will still face several barriers. The most significant being the comparatively high cost of vehicles. A study by Deloitte projects that battery costs will have to decrease by as much as 40% for EVs to be on par with internal combustion vehicles. The breakeven point will also depend on the cost of fuel, with higher gasoline prices lowering the threshold for electric vehicles to become competitive, as shown in Figure 1-6 below:
Figure 1-6: Breakeven cost of electric batteries vs. gasoline (US$) (Deloitte, 2010) Other barriers for e-mobility in Chile include:
● Technological barriers: EVs require a reliable infrastructure for vehicle charging, technical services and spare parts to be in place. Currently the infrastructure in Chile is very limited with few companies operating in the market and some services (technical support) lacking completely.
● Knowledge barrier: Consumers and the market in general need to learn about these new technologies to ensure proper use and maintenance of EVs.
● Risk perception: Many consumers are unsure about the new electric vehicle technology especially regarding the reliability and safety of vehicles.
The E-mobility Readiness Plan considers e-mobility as part of a long-term strategy for decreasing the environmental impact of the transport sector. The Plan seeks to address barriers by introducing a series of activities and interventions which will enable the widespread expansion of the technology, build up the required infrastructure and supply chains and increase consumer confidence in the technology.
Proposal for a Nationally Appropriate Mitigation Action (NAMA) in the transport sector in Chile
15
2 Proposed programme & activities
The E-mobility Readiness Plan NAMA aims to prepare Chile for the widespread introduction of electric vehicles. Through an integral set of activities, the Plan seeks to kick start the electric vehicle market in Chile and reach a target of 70.000 grid-enabled vehicles on the road by 2020.
The E-Mobility Readiness Plan supports the Low and Zero Emission Vehicle Policy to increase awareness and start a rethinking process with regards to travel patterns, traffic and city planning and, at the same time, produce measurable reductions in CO2 emissions as well as noise and pollution from the vehicle fleet. Residents and stakeholders will have the opportunity to test alternative clean technologies for individual travel, public transport and paratransit (taxi). This is expected to “open the minds” and contribute to the long term transformation of the urban transport sector.
2.1 Scope
The first phase of the plan will focus on Santiago as the main urban centre in Chile with the highest concentration of inhabitants. The second phase will begin a national scale-up to reach the overall target by the year 2020.
The target groups of this NAMA are owners of transit, fleet and passenger vehicles as well as electricity companies, municipalities, and others engaged in the ownership and operation of electricity and charging infrastructure.
Grid-enabled vehicles considered under this Plan include:
● Plug-in hybrid electric vehicles (PHEV) which use an internal combustion engine combined with an electric motor and a grid-chargeable battery.
● Range-extended electric vehicles (REEV), which use an electric motor with a grid-chargeable battery and a modified low-performance internal combustion engine or fuel cell. The engine is used to charge the battery and does not provide motive power for the vehicle.
● Battery electric vehicles (BEV), which use an electric motor with a grid-chargeable battery only.
Vehicle types considered include both light and heavy-duty vehicles which draw a significant portion of their motive power from a battery.
2.2 Programme overview
Activities within the E-mobility Readiness Plan are grouped into three pillars: Market Creation, Charging Infrastructure and Research and Development (Figure 2.1). The pillars work together to overcome existing barriers and help reach the mentioned target. Cross-cutting activities support the pillars. One is communication and public diffusion and the other is a monitoring, reporting and verification plan.
Proposal for a Nationally Appropriate Mitigation Action (NAMA) in the transport sector in Chile
16
The activities form part of an integrated plan which will enable Chile to implement a number of pilot projects and to build structures and know-how to prepare for a bigger roll-out of electric mobility.
Figure 2-1: E-mobility Plan overview
2.3 Timeframe
The Plan is designed to run from 2012 to 2020 and is divided into two main phases. Phase I, from 2012 to 2014, is the preparatory phase. Phase II, from 2015 to 2020, is the scaling-up phase.
2.3.1 Phase I
The first phase prepares the grounds for a mass-market penetration of electric vehicles and charging infrastructure in Chile. Activities in this phase will work towards creating the knowledge necessary to implement incentives schemes, demonstrate the technology and start building the human resources to supply and support the electric vehicle fleet in Chile. A central element in Phase I is the implementation of pilots with government and commercial fleets as well as taxis in order which will already lead to emission reductions in the short term.
E-mobility Readiness Plan “70.000 grid-enabled vehicles running in Chile by 2020”
“Stimulate demand to
reach 70.000 EVs by 2020 and foster a
national supply chain”
“Support R&D activities to
establish Chile as a centre of excellence for
e-mobility”
“Establish a reliable and
effective charging
infrastructure to service
70.000 vehicles by 2020”
Market Creation Research & Development
Charging Infraestruture
Communication & Public Diffusion
Monitoring, Reporting and Verification (MRV)
Proposal for a Nationally Appropriate Mitigation Action (NAMA) in the transport sector in Chile
17
2.3.2 Phase II
The second phase aims at scaling-up the entry of electric vehicles. The main output will be the deployment of policy packages to incentivize the electric vehicle market and foster investments in charging infrastructure.
Details on the activities planned for the two phases will be given in the following sections. More detail is given for activities in the first phase with the expectation that activities in the second phase will be largely shaped by the results of the first. However, the overall aim of reaching the 70.000 EV target will remain constant.
2.4 Market Creation
Activities under “Market Creation” aim to increase the demand for electric vehicles to at least 70.000 by 2020 as well as to ensure that supply chains are in place to provide vehicles and accessories in the country. As the electric vehicle market is in its infancy, a wide range of activities are needed to create the right set of incentives to establish a national market for the technology.
Activities in the first phase (2012-2014) will centre on an investment in two pilots which seek to demonstrate the technology and create initial demand. It will also include a research study that explores demand and supply scenarios of the electric vehicle market in Chile. Additionally, a business case will be explored to establish a car-sharing scheme in Santiago. These activities will help stakeholders become acquainted with electric vehicles and will provide the necessary experience to create policy instruments for the second phase.
The second phase (2015-2020) will aim for a rollout of policy instruments nationwide which will be embedded in the Government’s Low and Zero Emission Vehicle Policy. These will help break down existing barriers and stimulate enough demand to reach the target. The NAMA will provide funding for technical support to the policy process. Co-financing of policy instruments could also be considered.
Phase I
Component & Objective
Type of
Measure Activity Budget
(US$)
Stimulate
demand to reach 70.000 EVs by 2020 and foster a
national supply chain
Ph
ase
I
Pilots
• Set up and run a pilot scheme with the goal of 100 electric taxis on the road by 2014.
• Set up and run a pilot scheme for government & commercial fleets which include at least 90 vans and light-duty fleet vehicles.
$3.150.000
Market study
Market study of demand and supply in Chile
• Create scenarios of the growth of the EV market in Chile and forecast prices of vehicles and components.
$300.000
Proposal for a Nationally Appropriate Mitigation Action (NAMA) in the transport sector in Chile
18
Component & Objective
Type of
Measure Activity Budget
(US$)
• Identify national and international actors in the supply chain of vehicles and components.
• Identify target groups/ potential early adopters.
• Conduct a consumer choice survey and willingness-to-pay analysis.
• Develop usage scenarios for EVs as passenger cars, taxis, buses and light and heavy duty fleet vehicles. Specify net present values of electric vehicles under the various usage cases and pricing scenarios.
• Perform an economic analysis of possible financial support instruments and specify options for non-financial incentives.
• Based on the outputs of the study, provide recommendations for the incentive and regulatory schemes needed to achieve a target of 70.000 EVs by 2020.
Business plan for a
car sharing service
• Finance the development of a business plan for a future EV car sharing service in Santiago. This can be based on other similar schemes, for example Autolib in Paris.
$50.000
Table 1 Activities under the Market Creation pillar in Phase I
2.4.1 Pilot programmes
The NAMA will implement two electric vehicle pilots in Santiago. The NAMA will co-finance vehicles and charging infrastructure up to a total amount of US$ 3,35 million. These investments are expected to be supported by the private sector and the Government of Chile where appropriate.
The pilots will serve two functions. One is to demonstrate EV technology and the feasibility of its implementation. The second is to jump-start demand and encourage the private sector to develop the market.
Proposal for a Nationally Appropriate Mitigation Action (NAMA) in the transport sector in Chile
19
Pilot I – Collective taxis (“Colectivos”)
The first pilot will focus on collective taxis in Santiago. A collective taxi is a service with fixed or semi-fixed routes which usually departs when all the seats in the vehicle are filled. The types of vehicles used are mainly light-duty vehicles with similar characteristics in terms of seating and cabin space to some electric vehicles already on the market26.
Focusing on collective taxis has several advantages. A collective taxi will operate much more than a private vehicle and this can help investments reach a breakeven point quicker as the lower operating costs of electric vehicles offset their higher investment costs. Additionally, because collective taxis run on fixed routes, drivers are better-able to manage the range of the battery. When they reach their destination, drivers wait for a period of time for their vehicles to fill again with passengers. This provides an opportunity to plug-in and recharge.
The pilot aims to incorporate 100 electric collective taxis in the Santiago metropolitan area and to install charging points to supply them. The pilot will reach these objectives by providing monetary incentives and technology support to taxi owners. The pilot will include a strict monitoring system to draw out key data on mileage, passenger numbers and emission reductions achieved. The pilot will also incorporate consumer research, targeted at drivers as well as passengers, to evaluate the experiences with the new technology and the pilot programme in general. Experience from this pilot will feed into the market study and provide input for the second phase of the Plan.
The financial support needed to undertake the collective taxi pilot is estimated at US$ 1,65 million. These funds will be used to provide a rebate of approximately US$ 8.000 to taxi owners wishing to purchase a qualifying electric vehicle. The final number will be determined in further consultations. Taxi operators would also be eligible to receive a rebate of up to US$ 1.500 for the purchase and installation of home chargers. In addition, grants of up to US$ 20.000 per charger will be made available to private and public entities who wish to install “fast”chargers (Levels II and III) at strategic points along the routes of the taxis. In addition, an allowance of US$ 300.000 would be made for the administrative costs of the pilot and the costs of measurement, reporting and verification.
Activity Estimated Costs 1. Rebate of as much as US$ 8.000 per vehicle for up to
100 electric vehicles. US$800.000
2. Rebate of as much as US$ 1.500 for the purchase and installation of home chargers for up to 100 chargers.
US$ 150.000
3. Grants of up to US$ 20.000 towards the installation of Level II and III chargers.
US$ 400.000
4. Other costs, including administrative costs to the programme and MRV.
US$ 300.000
Total US$ 1,65 million 26 For example, the Nissan Leaf or the Opel Ampera
Proposal for a Nationally Appropriate Mitigation Action (NAMA) in the transport sector in Chile
20
Pilot II – Government and commercial fleets
Government and commercial fleets are important potential customers. Fleet operations are well-suited for electric vehicles as mileage and travel patterns are stable and predictable, allowing the range of the battery to be better-managed. EVs can offer fleet managers an estimated 50% reduction in operating costs due to the lower maintenance costs of simpler drivetrains and lower fuel costs compared to internal combustion engines27. In addition, fleet owners can use electric vehicle fleets to demonstrate leadership and gain reputational benefits from better environmental performance.
The introduction of a pilot scheme with both government and commercial fleets will provide useful insights into the logistics of electric fleet operations and help open the market to these important consumer groups. There is already useful experience to draw from in Chile. The Municipality of Providencia in Santiago has announced the purchase of 20 electric vehicles for roadwork and park inspections. The initial investment of CLP$ 300 million is estimated to be offset by savings in maintenance and fuel costs28.
The proposed pilot will provide rebates of approximately US$ 10.000 for vans and light-trucks for uses such as urban deliveries and passenger transport. A rebate of up to US$ 8.000 would also be made available for light-duty passenger vehicles.
The pilot would also provide allowances for the installation of charging infrastructure at the vehicles’ home base and along strategic points in the city. These strategic points would be decided by vehicle owners and an allowance for chargers would be made depending on the size of fleet.
Activity Estimated Costs 1. Rebate of as much as US$ 10.000 for
vans and light-duty trucks. US$500.000
2. Rebate of as much as US$ 8.000 for light-duty passenger vehicles.
US$ 400.000
3. Grants of up to US$ 20.000 towards the installation of Level I, II and III chargers.
US$ 300.000
4. Other costs, including administrative costs to the programme and MRV.
Proposal for a Nationally Appropriate Mitigation Action (NAMA) in the transport sector in Chile
21
2.4.2 Market study
The goal of the market study is to gain a better understanding of the electric vehicle market and use this information to define financial incentives and other policy tools for the second phase.
The market study focuses on both the supply and demand of electric vehicles. The supply part will seek to gain a better understanding of the main actors involved in the supply of vehicles and components and explore possible price scenarios for electric vehicles. These will be used to set financial incentives in the future. The study should also explore whether other forms of intervention are needed to close critical gaps in the supply chain.
The demand side seeks to understand the consumer and the potential early adopters of EVs through usage cases and consumer research. Consumer groups will include members of the general public as well as commercial and public fleet operators. The needs of fleet operators should be analysed through actual in-use data on investments and operating costs to understand which types of fleets are more likely to use electrics vehicles profitably. Willingness-to-pay will be an important aspect to explore for all consumer groups and should be undertaken through consumer surveys.
The market study should also seek to understand consumer needs and explore user behaviour and travel patterns of the potential target groups to define the basics, such as optimal charger locations and the potential for using different business models to sell electric vehicles and services, such as battery leasing, among others.
Drawing on the conclusions of the market study, tangible outputs are expected to inform the Government of Chile on the options for policy instruments to achieve the named target and to integrate the NAMA with the Low and Zero Emissions Vehicle Policy. Outputs should include the following:
• Overview of policy instruments which could be used to promote investments, innovation and business development in electric mobility in Chile.
• Recommendations on a preferred policy strategy to achieve the objectives under this NAMA, including:
o Best-practice policy package specific to the Chilean context. o Details describing the process of implementation. o Funding requirements, including details on expected revenues and outlays. o Recommendations for raising funds for implementation, including domestic and
international sources.
This study will be carried out over a period of 1,5 years. The aim is to begin in 2012 and to finalize it no later than December 2013.
An important element is that the study achieves broad buy-in from government and other stakeholders because it will provide input to the policy process. In this context, experts from
Proposal for a Nationally Appropriate Mitigation Action (NAMA) in the transport sector in Chile
22
academia, government and industry will be asked to join the review board and to approve of material decisions regarding the objectives and direction of the study.
An estimated US$ 300.000 will be needed to undertake the three parts of the study.
2.4.3 Business plan for a car sharing service
An additional activity that falls under this pillar is a business development study on a car sharing scheme for EVs in Santiago. The total cost estimated for undertaking these activities is US$ 50.000. Activities will include, for example:
• Business plan creation. • Identification of potential partners including suppliers and implementing parties.
Identification of options to integrate with public transport. • Technical support for implementation.
The car sharing scheme would draw from experiences in other countries with similar programmes. An example is the Autolib scheme currently being implemented in Paris.
Electric vehicle car sharing schemes can reduce the “credibility barrier”, helping to familiarize consumers with electric vehicles by providing first-hand experience. In addition, car sharing can be an effective element of an integrated urban transport system which can lead to an overall reduction of vehicles on the road. Depending on the outcome of the study, partial funding for the implementation of a car sharing pilot could be included in the second phase of the Plan.
Proposal for a Nationally Appropriate Mitigation Action (NAMA) in the transport sector in Chile
23
Phase II The second phase of the NAMA is expected to begin by the end of 2014. This phase will aim at reaching mass market penetration of electric vehicles to achieve the target of 70.000 EVs. Financing requirements for the second phase will be determined at a later stage once the outcome of the market study and the pilots is available. A basic framework of the potential activities in the second phase is given below:
Component & Objective
Type of
Measure Activity Budget
(US$)
Stimulate demand to
reach 70.000 EVs by 2020 and foster a
national supply chain
Ph
ase
II
Incentive Schemes
Introduction of non financial incentives for EVs, including:
• Exclusive parking/ parking space management combined with charging.
• Use of exclusive lanes (bus/ taxi lanes).
• Additional taxi licenses for electric or hybrid taxis.
Introduction of financial incentive schemes, including:
• Direct incentives and disincentives (e.g. feebate, soft loan scheme via CORFO).
TBD
Table 2 Activities under the Market Creation pillar in Phase II
2.4.4 Incentive schemes
An important part of the Plan will be to set the right incentives, both financial and otherwise. The specification of incentive schemes as well as the timeframe will be an output of the market study to be undertaken during Phase I.
In terms of non-financial incentives, several options are available:
• No circulation restrictions or annual emissions verifications for electric vehicles. • The introduction of obligatory energy efficiency labelling as part of the wider Low and Zero
Emissions Vehicle policy. • Implementation of exclusive parking spaces for grid-enabled vehicles in cooperation with
municipalities and businesses. • Expansion of segregated bus and taxi lanes to include electric vehicles.
Proposal for a Nationally Appropriate Mitigation Action (NAMA) in the transport sector in Chile
24
As mentioned previously, the most significant barrier for consumers is the cost of electric vehicles. Experience shows that support will be necessary until economies of scale reduce costs and enable EVs to compete with conventional vehicles. The Chilean market will need initial support to stimulate demand. It is proposed to introduce financial incentives embedded in the government’s Low and Zero Emissions Vehicle policy.
Financial incentives could include:
● Direct incentives and disincentives through the planned Feebate system. ● Soft loan schemes through CORFO. ● Provision of additional taxi licenses for grid-enabled taxis (The number of taxi licenses is
fixed in Santiago and there is a high cost associated with the purchase of taxi licenses).
2.5 Charging Infrastructure
The second pillar of the Plan aims at the establishment of a reliable and effective charging infrastructure to support the growing number of grid-enabled vehicles on the road. Of key importance is the linking of the E-mobility Plan with a clean electricity supply. Pilots and other activities will be undertaken to help link the development of electric vehicles in Chile to clean and renewable electricity.
Phase I
Component & Objective
Type of
Measure Activity Budget
(US$)
Establish a reliable and
effective charging
infrastructure to service
70.000 vehicles by
2020
Phas
e I
Charging infrastructure
study
Study on the distribution and implementation of charging infrastructure.
• Create growth scenarios for the vehicle fleet and estimate the capacity needed and costs of various types of charging installations in Chile.
• Identify suitable equipment suppliers.
• Research the driving patterns of target consumer groups and identify optimal locations to install charging points in the city.
• Suggest options for business models and payment systems.
• Based on the study, create investment plans and develop and recommend financial incentives for the private sector with the aim of establishing charging infrastructure that is appropriate for 70.000 vehicles by 2020.
$150.000
Proposal for a Nationally Appropriate Mitigation Action (NAMA) in the transport sector in Chile
25
Component & Objective
Type of
Measure Activity Budget
(US$)
Electricity supply system
study
Study on integration with the electricity supply system:
• Model electricity demand patterns from electric vehicles.
• Specify impacts of additional demand on the electricity supply system and model the effects of this on the marginal electricity mix. Provide results that can be integrated with the methodology for GHG accounting.
• Recommend technical standards for charging equipment and associated installations.
• Recommend regulatory measures needed to ensure safety and security of electricity supply in the context of mass-market entry of EVs in Chile.
• Specify options to link the E-mobility Readiness Plan with renewable energy activities in Chile and smart grid initiatives.
$250.000
Pilots
Implement a pilot focused on solar chargers:
• Grant of up to 50% for solar charging systems with a PV capacity greater than 2kW. The grant may be used for the purchase of solar panels, batteries and other balance of system components as well as vehicle chargers (Level II and III).
• Provision for maintenance costs and other operational expenses.
• Develop methodology for MRV of solar charging systems.
$1,3 million
Table 3 Activities under the Charging Infrastructure pillar in Phase I
2.5.1 Studies
Two research studies are proposed in the first phase of the Plan:
a) Distribution and implementation of charging infrastructure
Chargers are one of the key variables to enable a wider deployment of electric vehicles. In general, there are three types of chargers that can be considered:
Proposal for a Nationally Appropriate Mitigation Action (NAMA) in the transport sector in Chile
26
• A slow (low-voltage) charger which is typically installed at home or workplaces. The slow charger costs <US$2000 and allows a vehicle to charge in 6-8 hours depending on the voltage.
• A fast charger which operates at very high voltages and can charge a vehicle in less than 30 minutes. Placing fast chargers at strategic points helps relieve “range-anxiety”. The costs are between US$30.000 to US$60.000 per charger. Battery swapping stations which replace batteries instead of charging them. The time to change a battery is < 5 minutes but the downside is the very high cost which approaches US$ 1,5 million per station29. Battery-swapping can only be performed on specially adapted vehicles.
Additional research is needed to understand how to deploy charging infrastructure most effectively and how to incentivise private investment. A study is proposed that will help answer the following questions:
• What is the right mix of slow and fast charging stations? • What are the strategic locations in the city to install fast chargers? • What should be the distribution of public (e.g. on street) and private (e.g. households,
parking lots, shopping centres, gas stations) charging stations? • What are appropriate targets for scaling-up charging stations according to the expected
fleet growth and driver needs? • What are costs of charging infrastructure and the potential distribution of cost between the
private and public sector? • What types and amounts of incentives are required to encourage investments in charging
infrastructure?
As a subset of the study on charging infrastructure, options for different payment and business models will be developed based on the experiences in other countries. The study will include a review of the technical options available as well as a review of pricing structures and models building on existing experience in Chile. For example, Chilectra currently offer their customers a dynamic residential tariff for peak and off peak hours. Private sector stakeholders, in particular electricity companies, are expected to play a central role in the development of pricing and payment models.
Results from this study will play a key role in the creation of incentive frameworks for the second phase of the Plan.
b) Implications on the electricity supply system
A second study will explore the implications of the E-mobility Readiness Plan on the electricity supply system. In addition, it will seek to identify opportunities for linking the E-Mobility Readiness Plan with a wider deployment of renewable energy in the country. This will help draw additional 29 (Wiederer & Philip, 2010)
Proposal for a Nationally Appropriate Mitigation Action (NAMA) in the transport sector in Chile
27
GHG benefits from decreasing emissions intensity in the generating mix. The following activities will form part of the study:
• Modelling of expected electricity demand patterns from electric vehicles. • Identify the impact of additional electricity demand on generators and transmission
infrastructure and the associated effects of an increasing number of interconnection points on the grid (involving local distribution companies).
• Identify the impact of additional electricity demand on the marginal electricity mix and associated CO2 impacts.
• Identify potential linkages of the Plan with the current expansion of renewable energy capacities.
• Identify the potential for smart grid applications (see also R&D).
2.5.2 Solar charger pilot
A pilot scheme to explore the integration of photovoltaics with battery charging stations will be implemented in the first phase of the Plan (e.g. solar car ports in office buildings, shopping centres and other public locations). The results will be used as a basis for further integration of electric vehicles with renewable energy initiatives in the country. Aspects such as technology performance, reliability and costs will be assessed. There will also be an MRV methodology developed for battery charging stations based on solar power. This methodology can form the basis for further expansion of solar charging stations in the country and for obtaining scale-up funding.
The solar charger pilot will deploy and test solar charging stations, which will operate in conjunction with the taxi and fleet pilots that form part of the Market Creation pillar. The funds specified for this pilot can be accessed by fleet operators, electricity companies, real-estate holders and others who are interested in co-financing the installation of solar charging infrastructure.
The budget for the pilot would be as follows:
Activity Estimated Costs
1. Grant of up to 50% for solar charging systems with a PV capacity greater than 2kW. The grant may be used for the purchase of solar panels, batteries and other balance of system components when used in conjunction with electric vehicle chargers (Level II and III).
US$ 1 mio
2. Grants towards maintenance costs and other operational expenses.
US$ 200.000
3. Develop a methodology for measurement, reporting and verification of charging systems based on solar power.
US$ 100.000
Total US$ 1,3 million
Proposal for a Nationally Appropriate Mitigation Action (NAMA) in the transport sector in Chile
28
Phase II
Component & Objective
Type of
Measure Activity Budget
(US$)
Establish a
reliable and effective charging
infrastructure to service
70.000 vehicles by 2020
Ph
ase
II
Incentive schemes
Stimulate investment in public and private charging infrastructure through activities such as:
• Tax rebates and other financial incentives
• Credit instruments and guarantees
• CORFO instruments
• Regulatory requirements
• Urban planning and zoning laws
TBD
Table 4 Activities under the Charging Infrastructure pillar in Phase II
2.5.3 Incentive schemes
Financial incentives are essential to stimulate investment in public and private charging infrastructure. The definition of the level and type of incentive will be based on the results of the studies undertaken during the initial phase of the Plan.
An incentive scheme for public charging infrastructure may include the provision of tax rebates and the application of CORFO instruments. This is likely to be targeted at the implementation of fast charging technology.
Incentive schemes for the private sector will include instruments targeted at households as well as private sector companies. One option will be to link the purchase of the vehicle to the provision of a slow charging station in the home (e.g. see Movele Programme in Spain www.movele.es).
For private sector companies CORFO instruments are likely to be applicable focusing on slow and fast charging points.
2.6 Research & Development (R&D)
The E-mobility Readiness Plan will include a number of R&D activities with the aim to establish Chile as a regional centre of excellence for e-mobility. Only few countries in Latin America have experience with e-mobility. Chile, with its advanced research base and ambitious government plans, is well positioned to establish itself as a knowledge hub in the region.
The first phase of the R&D pillar will support scoping studies which will help set an agenda for research and development activities in the second phase. It will also support the creation of a
Proposal for a Nationally Appropriate Mitigation Action (NAMA) in the transport sector in Chile
29
centre for capacity building in e-mobility to help build the human resources needed to support the E-mobility Readiness Plan.
The second phase has not been specified in this proposal. It will undertake applied research and development activities which seek to:
• Strengthen the position of e-mobility nationally and internationally through technology development.
• Transfer e-mobility technologies to Chile.
• Increase human resources and capacity in the technical, economic and social aspects of electric vehicle technologies and policy.
R&D activities are expected to be strongly supported by the private sector, both nationally and internationally. It is also expected that a wide range of activities will accompany the Plan, such as academic exchanges and international seminars.
Phase I
Component & Objective
Type of
Measure Activity Budget
(US$)
Support R&D activities to
establish Chile as a centre of excellence for
e-mobility
Ph
ase
I
Scoping study: “Opportunities
for the development
of lithium-based
technologies in Chile”
The study shall explore the following topics:
• What is the potential to develop lithium-based industries with high added value in Chile?
• Explore options to initiate technology transfer and establish networks of international knowledge and cooperation.
• Stakeholder mapping and identification of key actors in the Chilean market.
• Develop a research and development plan based on the outcomes of the study and specify short and long term objectives.
$80.000
Scoping study: “Demand
scenarios for copper in electric
vehicles and components”
The copper demand study explores how trends in electric vehicles might impact the Chilean copper industry and how this industry can contribute to the future development of electric mobility.
• Global demand scenarios for copper from electric vehicles and components.
• What is the potential to develop industries with high added value in Chile?
$80.000
Proposal for a Nationally Appropriate Mitigation Action (NAMA) in the transport sector in Chile
30
Component & Objective
Type of
Measure Activity Budget
(US$)
• Explore options to initiate technology transfer and establish networks of international knowledge and cooperation.
• Stakeholder mapping and identification of key actors in the Chilean market.
• Develop a research and development plan based on the outcomes of the study and specify short and long term objectives.
Ph
ase
I
Study & seed funding:
“Development of IT
applications to support the
Plan”
This study will seed the development of software and Smartphone applications to support electric vehicle owners with services such as:
• Information on the location of charging stations
• Statistics on the use of electricity and associated costs.
• Links to intelligent payment systems.
$100.000
Education and training
Human resources will be necessary to maintain the fleet of vehicles and charging infrastructure. The Plan places a high importance on training and education initiatives and will seek to support them through:
• Grant of up to $250.000 to start a centre for capacity building in e-mobility.
• Grant of up to $100.000 to train emergency responders (firemen, police) in safely managing incidents with electric vehicles and high voltage batteries.
$350.000
Table 5 Activities under the Research and Development pillar in Phase I
2.6.1 Scoping studies
Several scoping studies will be conducted to explore various possibilities and help set a research agenda for the second phase of the Plan. The themes of these studies were selected based on the following:
1. Technology and capacity needs which have been identified as important for the overall success of the Plan.
2. Possibilities to connect electric vehicle technologies with Chilean industry, promoting technology transfer and providing opportunities for economic development.
Proposal for a Nationally Appropriate Mitigation Action (NAMA) in the transport sector in Chile
31
a) Scoping study: “Opportunities for the development of lithium-based technologies in Chile.”
Chile has the second-largest lithium reserves in the world and a share of 40% of the global lithium market. Linking this important natural resource with the development of national industries based on electric mobility should be an important priority. This will help strengthen the position of e-mobility in Chile and provide opportunities for economic development.
The scoping study will be used to identify priorities and possibilities for a comprehensive research and development component in the second phase of the plan. Given the strong mining industry in Chile, it is expected that the private sector will help support this research as well as many of the other research and development activities within this pillar.
b) Scoping study: “Demand scenarios for copper in electric vehicles and components”
The copper industry is also a very important industry in the country. Chilean mines contributed approximately 1/3 of global copper output in 2009, representing 16% of the country’s GDP30. The copper industry is a very important stakeholder in the country and a potentially important partner in the rollout of the E-mobility Readiness Plan. This scoping study will explore the relationship between electric vehicles and global copper demand with the aim of identifying opportunities for value-added industries in e-mobility based on this resource. This study will seek to identify opportunities and initiate public-private dialogue and cooperation aiming to increase the amount of technology, capacity and financial resources to meet the objectives of the E-mobility Readiness Plan.
C) Development of software and smartphone applications
Smartphone apps and IT interfaces can become key elements of smart city and modern traffic management systems. Smart apps which provide real time information on, for example, availability and location of charging points, can strengthen consumer confidence in e-mobility. This component will focus on the development and testing of IT tools for electric vehicle owners. The Plan will provide funding of up to US$100.000 to seed the development of software and smartphone applications.
2.6.2 Education and training
New education and training initiatives will be needed for the specialists and technicians who will maintain the fleet of electric vehicles and the charging infrastructure. This will help ensure the long term sustainability of the E-mobility Readiness Plan and help embed new technologies within Chilean institutions, providing direct benefits and skills to workers in an emerging global industry.
30 (Diaz herrera, 2011)
Proposal for a Nationally Appropriate Mitigation Action (NAMA) in the transport sector in Chile
32
The first phase of the Plan will provide a grant of up to $250.000 for the creation of a centre for capacity-building on e-mobility. This centre will be housed in a Chilean institution such as a university or a foundation and will provide suitable training for workers through vocational careers, technical courses, etc. The centre will continue expanding after the first phase ends. Co-financing from the government, universities and the private sector would be sought to expand operations.
The first phase will also provide grant financing of up to $100.000 for training emergency personnel (e.g. road side assistance, fire brigade, police) in Santiago. This is needed to help personnel handle emergency situations safely when a vehicle is equipped with high voltage batteries.
2.7 Communication and Public Diffusion
The Plan will be supported by a number of communication and public diffusion activities. These activities are important to increase the visibility of the Plan and to inform and educate consumers about the benefits of electric vehicles and e-mobility in general. The following activities will be undertaken:
a) Development and operation of a website
A website will be developed which will provide information to interested stakeholders and consumers on e-mobility and will specify how funds under the Plan can be accessed. There will be the possibility to track the progress of activities under the Plan. It will also include a forum, providing opportunities for direct information exchange and feedback.
b) Public information campaign
This will include a series of activities to educate the public about aspects of e-mobility and its benefits. Activities will include education programmes in schools, awareness raising events at the municipality level and awareness campaigns using the whole spectrum of media (print, TV, Internet).
c) Vehicle road shows
A number of road shows will be organized in municipalities in and around Santiago. Road shows are an excellent way to demonstrate the technology and provide consumers with hands-on experience. Road shows can be organized by interested municipalities with private sector support. Experience in other countries has shown that hands-on driving experience is very effective for reaching consumers and informing on the benefits of electric vehicles.
Proposal for a Nationally Appropriate Mitigation Action (NAMA) in the transport sector in Chile
33
d) Organisation of seminars
National and international seminars will link R&D activities described in the previous section. The seminars will be used to further promote the programme and provide a platform for exchange of experiences to advance e-mobility in Chile.
e) Stakeholder Groups
Setting up and running a number of stakeholder groups on specific topics related to the implementation of the E-mobility Readiness Plan. Stakeholder groups will include public and private sector representatives with an interest and expertise in the topic. Topics may include public transport, grid integration, regulatory standards etc.
The communication activities are expected to be strongly supported by private sector companies with an interest in the Chilean e-mobility market, including electricity companies, vehicle manufacturers and manufacturers of charging infrastructure. Other stakeholders, such as research institutions, leading municipalities and international organisations are expected to contribute to the activities with financial and in-kind support.
Proposal for a Nationally Appropriate Mitigation Action (NAMA) in the transport sector in Chile
34
2.8 Total financing requirements for Phase I
Table 6 Budget for the E-Mobility Readiness Plan shows the total amount that is being requested from international climate finance donors to undertake the first phase of the Plan. A total of 69% of the budget is allocated to the implementation of the vehicle and charging infrastructure pilots, 15% will go towards studies, 6% will be spent on education and training on e-mobility and the remainder will be used for communication activities, monitoring and administrative expenses (Figure 2-2).
Activity Financing requirements (US$) Component 1: Market creation 3,5 mio Component 2: Charging infrastructure 1,7 mio Component 3: Research and development 0,61 mio
Communication and public diffusion 0,3 mio Monitoring 0,15 mio Other administrative 0,2 mio
Total US$ 6,46 million
Table 6 Budget for the E-Mobility Readiness Plan
Figure 2-2: E-mobility Readiness Plan budget share
Pilot implementation
69%Education and
training programmes
6%
Market studies5%
Charging studies6%
R&D studies4%
Communication and public diffusion
5%Monitoring
2%
Other administrative
3%
Budget share
Proposal for a Nationally Appropriate Mitigation Action (NAMA) in the transport sector in Chile
35
3 Impact assessment
The NAMA is expected to reduce GHG emissions and improve urban air quality, which impacts human health. Additionally, the NAMA will help transfer technology to Chile for electric vehicles and lithium-ion batteries which can benefit economic and social development in the country. Chile has the second-largest lithium reserves in the world and significant copper resources. Transferring knowledge and technologies can help spur value-added industries based on these resources.
This section will provide an assessment of the expected impacts of the E-Mobility Readiness Plan for both GHG and non-GHG impacts. Non-GHG impacts include changes to the mitigative capacity of the country and also economic, social and environmental co-benefits.
3.1 GHG impacts
Estimating emission reductions from the E-mobility Readiness Plan is challenging because the NAMA is an integrated strategy with a wide range of activities deemed necessary to achieve the target of 70.000 EVs. The challenge comes from the fact that it is not possible to allocate all of the potential impacts to activities in the project. We cannot quantify the emissions impact of studies, capacity building, technology transfer and others. These are crucial to remove barriers and to accelerate the entrance of electric vehicles in Chile but they do not have any direct emission impacts. For this reason, we present scenarios based on simplified assumptions and through both quantitative and qualitative analysis.
3.1.1 Cumulative emission reductions
To calculate emission reductions we assume that the target of 70.000 electric vehicles is met in the year 2020 and all financial incentives from this NAMA stop in that year. The number of electric vehicles could continue growing; however the emission reductions from new vehicles would no longer be allocated to the NAMA. The vehicles that were purchased prior to 2020 will continue to accrue emission reductions until their end-of-life, which is estimated at 15 years.
Using growth factors from similar studies we calculated growth rates until the year 2020. The number of grid-enabled vehicles grows through the first phase of the Plan and into the second as financial incentives after the year 2014 take effect. This continues exponentially until grid enabled vehicles reach approximately 1% of the total fleet in 2020.
Proposal for a Nationally Appropriate Mitigation Action (NAMA) in the transport sector in Chile
36
Figure 3-1: Forecast of number of grid enabled vehicles by 2020
The GHG impact of 70.000 electric vehicles is estimated at 183,5 ktons/yr by 2020. This takes into account that several types of vehicles will be used to fulfil the target. We have modelled various types of taxi services, passenger vehicles and commercial fleets. Table 7 shows the types of vehicles modelled along with basic assumptions. The emission factors shown are average factors for an electric vehicle using best-available technology and an emission factor for electricity of 367gCO2/kWh. This is the average emission factor for the “Sistema Interconectado Central” (SIC), which is the main power grid in Chile and serves 93% of Chile’s population31. The types of vehicles used include a mixture of plug-in hybrids, range-extended vehicles and 100% electric vehicles. Taxis have a lower emission factor because it is assumed that the taxi fleet is better able to absorb 100% electric vehicles (no-auxiliary ICE). Taxis have a very high utilization rate and a better possibility to offset higher technology investments through lower operational costs.
Proposal for a Nationally Appropriate Mitigation Action (NAMA) in the transport sector in Chile
37
Cumulative emission reductions by 2035 are estimated at 2,8 million tons of CO2. This figure does not allocate any emission reductions from vehicles bought after 2020 so emission reductions allocated to the Plan fall sharply as the majority of vehicles reach their end of life around 2032.
Figure 3-2: CO2 emissions reduction until 2035
However, emission reductions from electric vehicles will continue. The main goal of this NAMA is to kick-start the market for EVs. Several studies predict that in a ten year time frame, the cost of batteries and thus electric vehicles will fall and become comparable to conventional vehicles32. At this point, it would no longer be necessary to provide incentives to promote demand. Electric vehicles should continue growing exponentially and in line with standard technology adoption curves.
At the same time, the share of renewable electricity, in particular, wind and solar will continue to grow. This will increase the potential for emission reductions. Chile has a target of 10% renewable energy by 2024 and this has not been factored into the calculations.
3.1.2 Co benefits
Environmental benefits of this project include reductions in local emissions of NOx, the most important precursor to ozone formation and of particulate matter due to diesel and gasoline combustion.
In terms of economic benefits, the E-mobility Plan will reduce Chile’s petroleum imports. Chile imports around 95% of its crude oil supply33. Based on our estimates, 70.000 electric vehicles would reduce annual gasoline consumption by 380 million litres and diesel by 150 million. This would have a positive contribution to the trade balance and help reduce exposure to the volatility of oil prices.
32 (Deloitte, 2010) 33 (IEA, 2008)
-
20,000
40,000
60,000
80,000
100,000
120,000
140,000
160,000
180,000
200,000
2012 2016 2020 2024 2028 2032
tCO
2Emissions reductions per year
Proposal for a Nationally Appropriate Mitigation Action (NAMA) in the transport sector in Chile
38
The most important economic benefit of this NAMA stems from the transfer of electric vehicle and battery technology to Chilean institutions. The development of local supply chains and services associated with e-mobility will enhance the skills of the workforce, create new employment opportunities and contribute to the economic development of the country as a whole. Chile has the second largest lithium reserves in the world and this NAMA can provide a starting point which could be further pursued by the Government of Chile into an industry with high added value. Lithium is mostly sold as a commodity and processed outside of Chile which fails to capture the greatest share of value from Chile’s reserves.
Proposal for a Nationally Appropriate Mitigation Action (NAMA) in the transport sector in Chile
39
4 Implementation plan
The following section sets out the implementation plan of the proposed NAMA, including the institutional arrangement, timelines, milestones and a framework for the monitoring, reporting and verification of the NAMA. Detailed implementation plans of individual components and activities will be developed as the development of the NAMA progresses.
4.1 Timelines and milestones
The NAMA is designed to run from 2012 to 2020 in two main phases. Phase I, from 2012 to 2014, is the preparatory phase and Phase II, from 2015 to 2020, is the scaling-up phase. The proposed launch of the activities in June 2012 will depend on international support being made available.
4.1.1 Phase I
The first phase of the NAMA works to prepare the grounds for a mass market penetration of electric vehicles and charging infrastructure in Chile. Activities in this phase will work towards creating the knowledge necessary to implement incentives schemes, demonstrate the technology and start building the human resources to supply and support the electric vehicle fleet in Chile.
Figure 4-1: Implementation plan for Phase I (2012 to 2014)
Major milestones include the launch of the EV market and grid and charging infrastructure studies around June of 2012. These studies are fundamental because they will provide input to the policy process, helping design the incentive schemes in the second phase. The launch will be a major event which will serve as the public launch of the EV Readiness Plan in Chile.
Charging infrastructure
R&D
Market creation
Jun 2012 Dec 2014
2013 2014
Phase IEV Market study
Taxi and fleet pilots
Charging infrastructure study
Solar EV charger pilotsScoping study for R&D in lithium-based technologiesScoping study on copper demand from EVs and components
Business plan for car sharing serv.
Centre for capacity building in e-mobility
Additional ad-hoc technical support to political process
Communication and public diffusion
Electricity supply system study
Seed funding for IT applications
Mar-13Publication of EV market and charging infrastructure studies
Jan-141st annual MRV of pilot projects
Begin electricity supplysystem study
2013Inauguration of centre for
capacity-buildingin e-mobility
Sep-12Launch of programme
website
Apr-141st annual MRV of
capacity-building activities
Jan-13Pilots launched
Proposal for a Nationally Appropriate Mitigation Action (NAMA) in the transport sector in Chile
40
Following the initial market studies, experts will provide ad hoc technical support to the political process. The objective is to provide support, wherever it may be needed, to government agencies in implementing the recommendations from the studies.
2013 sees the launch of the taxi and fleet pilots and the solar charger pilot. Another major milestone in 2013 will be the launch of the centre for capacity building in e-mobility. This programme will commence building the human resources needed to support the EV industry in Chile.
Other activities during Phase I include the lithium and copper studies (start in 2013) and a programme to provide seed funding for the development of software and smartphone apps to improve the experience of electric vehicle owners.
4.1.2 Phase II
The second phase aims at scaling up the market of electric vehicles in Chile. The main output will be the deployment of policy packages to incentivise the electric vehicle market and stimulate investment in charging infrastructure. Research and development activities will also continue to be funded in the second phase; however these are not yet defined. Since the 2nd phase will be highly dependent on the outcomes of the first, it is expected that specific timelines and milestones will change. Nonetheless, the target for electric vehicles in 2020 should remain the same.
Figure 4-2: Implementation plan for Phase II (2015 to 2020)
The major milestone would be the launch of a nationwide electric vehicle policy by early 2015 which will continue at least until 2020. This policy should incentivize demand for electric vehicles and investments in charging infrastructure through a best-practice package of policy instruments.
Jan 15 Dec 20
2016 2017 2018 2019 2020
Phase II
Financial, regulatory and other incentives to stimulate electric vehicle demand
Additional ad-hoc technical support to political process
Financial, regulatory and other incentives to stimulate charging infrastructure investments
Communication and public diffusion
Phase II research and development activities
Charging infrastructure
R&D
Market creation2015
Launch national electric vehicle policy
Proposal for a Nationally Appropriate Mitigation Action (NAMA) in the transport sector in Chile
41
4.2 Institutional arrangement for implementation
The institutional arrangement for the implementation of the NAMA is depicted in Figure 3-1 below.
Figure 4-3: Institutional arrangement for the NAMA
Overall responsibility for the implementation of the Programme lies with the Chilean Ministry of Environment (MoE) supported by the Ministry of Transport and Telecommunications. A Programme Implementation Unit will be established which will sit within the MoE and will be responsible for the overall coordination, management and monitoring of the Programme. The unit will also coordinate the implementation of the activities of each component (1 to 4).
The development and implementation of the Programme will be supported by a steering committee. The Steering Committee will have representatives from different organisations and stakeholder groups, including government, private sector and academia. The members of the Steering Group will be appointed formally by the Ministry of Environment and will accompany the Programme through all stages of implementation.
It is also planned to set up a number of stakeholder sub groups which will work on the implementation of specific areas and activities.
There is already a working group which formed in 2011 to discuss the proposal and the specific activities that could be undertaken by the NAMA. The group has members from the Ministry of the Environment, Ministry of Transport, electricity companies, auto manufacturers and experts in the field. It has helped draft this proposal and can continue working towards its implementation. The working group could evolve into a more formal role as the steering committee for implementation.
Programme Implementation Unit
Component 1„Market Creation“
Component 2„Infrastructure“
Component 3„R&D“
Component 4„Communication“
Programme Steering Group
Ministry ofEnvironment
Ministry ofTransport
Proposal for a Nationally Appropriate Mitigation Action (NAMA) in the transport sector in Chile
42
4.3 Key stakeholders - roles & responsibilities
The following table provides an overview of the key stakeholders and their respective roles in the implementation and delivery of the E-mobility NAMA.
Ministry of Environment Responsible for environmental and climate policy including e-mobility. Responsible for the overall delivery of the NAMA and presentation at international level.
Ministry of Transport Responsible for transport policy and co-coordinator of the NAMA at the national government level.
Ministry of Energy Responsible for energy policy, providing the institutional linkages to renewable energy development and e-mobility.
Superintendencia de Electricidad y Combustibles (SEC)
Energy regulator. Responsible for aspects of electric vehicle safety and operational standards for charging stations.
Comisión Nacional de Seguridad de Tránsito (CONASET)
Responsible for road safety and traffic law. Important in the context of privilege schemes for vehicles and vehicle safety standards.
Corporacion de Fomento de la Produccion (CORFO)
A government financing agency, central in the context of financial incentive schemes for e-mobility.
Customs Agency Responsible for the definition of rules and regulations for the import of vehicles and technology.
Municipalities Municipalities grant vehicle and driving licenses. They are central also for the operation of pilot schemes and battery charging points.
Chilectra Main energy distributor for wider Santiago area. Important in the context of setting up and implementing business models for charging points.
Vehicle Manufacturers Important for the promotion of the technology, securing the supply chain and implementation of pilots/ road shows.
Technology and Infrastructure Manufacturers
Important to ensure supply chain for the charging infrastructure and vehicle accessories as well as definition and setting up of charging network.
Academic & Research Institutions Supporting the research and investigation elements of the Programme.
It is envisaged that most of the institutions will be represented in the Steering Committee to guide the implementation of the Programme. The institutional arrangements will be defined in the first half of 2012.
Proposal for a Nationally Appropriate Mitigation Action (NAMA) in the transport sector in Chile
43
4.4 Monitoring framework
According to international climate agreements, supported NAMAs will be “subject to international measurement, reporting and verification (MRV) in accordance with guidelines adopted by the Conference of the Parties” (Cop13, 2007). So far, an international MRV framework has not emerged from the negotiations. There are no agreed-upon guidelines yet and many basic questions remain.
Against this background, the E-mobility Plan will be monitored along two dimensions: GHG impacts (direct and indirect) and co-benefits as depicted in Figure 3-1 below. At the same time, project implementation will be monitored on an ongoing basis according to specific milestones and other performance criteria. The aim is to conduct an integral assessment within a flexible and pragmatic framework which permits monitoring of activities and impacts at various levels.
Figure 4-4: Dimensions of MRV
4.4.1 Key indicators
Key indicators for the monitoring of the NAMA and its components are based on the OECD/DAC model of outputs, outcomes and impacts (Figure 3-2).
Outputs are tangible results that are strictly due to the activities under the NAMA. Outputs occur within the project boundaries, are achieved by the project directly and can be monitored. An example of an output indicator is “Number of EV taxis operating by 2014”.
Outcomes are the consequences of the outputs of the Project; these describe the effects of the project on its environment, most importantly on the target-group. An example of an output indicator is “The willingness to buy an EV for taxi owners under the pilot increases by 40% over the baseline”.
Impacts are positive and negative long-term effects produced by a given intervention. Impacts are affected by the outcomes of the project and by external factors.
Proj
ect
impl
emen
tatio
n
• Direct emissions• Indirect emissions
GHG impacts
• Economic• Social• Environmental
Co-benefits
Proposal for a Nationally Appropriate Mitigation Action (NAMA) in the transport sector in Chile
44
Figure 4-5: OECD/DAC Results Chain Framework
The tables in the following section present potential indicators for outputs and outcomes based on OECD/DAC model for the three pillars of the NAMA and the communication activities. In addition, a set of general indicators have been developed to measure the cumulative impact of the NAMA and track progress of implementation.
The indicators and targets proposed establish the general framework for MRV but many details still need to be defined such as the means of verification and the calculation and sampling methods. For Phase I these should be defined in consultation with funders and the implementing parties.
Phase II indicators and targets are given rather as “aims” and more detail is needed to make these measurable. This detail should emerge from the outcomes of Phase I, as specific activities become defined. Phase II should adopt an MRV framework that is compatible with the first.
If not stated otherwise, data will be verified internally and reported on an annual basis.
4.4.2 Overall programme evaluation
The following indicators will be used to monitor general programme implementation: Indicator Timing/ frequency Responsible entity
Number of new EVs registered (by type) Ongoing, quarterly MoE
CO2 Emissions reductions Ongoing, yearly MoE
Programme implementation costs Ongoing, quarterly MoE/ Steering Group
Completion of activities as outlined in the Plan Annual MoE/ Steering Group
Table 8 Overall programme evaluation indicators
Proposal for a Nationally Appropriate Mitigation Action (NAMA) in the transport sector in Chile
45
4.4.3 Evaluation – Market Creation
The following will be used to monitor the pillar of Market Creation: Phase I (2012-2014) Phase II (2015-2020)
Ou
tpu
ts
Market study
• Endorsed by major stakeholder groups including at least two ministries and 5 major companies.
Incentive schemes
• EV incentive schemes launched at the national level by 2015.
• Policy instruments used considered best practice.
Pilot projects
• At least 100 EV taxis and 90 fleet vehicles operating by the end of 2014.
• At least 100.000 passengers having used EV taxis by 2014.
• At least 5 million electric kilometres driven by pilot vehicles by the end of 201434.
• Reduce at least 1000 tons of CO2
from pilot projects.
Ou
tcom
es
• By 2014, willingness-to-buy an EV increases by:
o 10% from baseline for consumers in Santiago. o 20% from baseline for fleet and taxi owners in Santiago.
• Public awareness of EVs increases from baseline to 50%.
• At least 40% of Santiago residents have knowledge of EV Readiness plan.
• Number of electric vehicles registered
grows at a yearly rate of at least 100% between 2015 and 2020.
Imp
act
Increase market demand for electric vehicles in Chile in order to reach a target of 70.000 vehicles in the national fleet by the year 2020.
Table 9 Evaluation indicators and targets for the Market Creation pillar
34 Considering that a taxi runs 37.000 km/yr and a fleet vehicle runs 17.000 km/yr
Proposal for a Nationally Appropriate Mitigation Action (NAMA) in the transport sector in Chile
46
Reporting details – Market Creation The indicators should be reported in the following manner:
Indicators Timing/ frequency Responsible entity Reporting • Number of taxis
MOE with external verification/audit performed annually.
Annual results reported to funding parties. End results reported internationally.
• Consumer willingness-to-buy
• Public knowledge of EVs
• Public knowledge of readiness plan.
Once at the beginning of Phase I and once at the end.
External party, measured through consumer survey with a margin of error of less than 5%.
End results reported to funding parties and internationally.
Table 10 Measurement and reporting details for the Market Creation pillar
4.4.4 Evaluation – Charging infrastructure
The second pillar of the Plan – Charging Infrastructure will be evaluated as follows:
Phase I (2012-2014) Phase II (2015-2020)
Ou
tpu
ts
Charging study
• Endorsed by major stakeholder groups including at least two ministries and 5 major companies.
• Timely, relevant and actionable advice to political process in designing incentive schemes for charging infrastructure.
Incentive schemes
• Incentive schemes launched at the national level by 2015.
• Policy instruments used considered best practice.
Pilot projects
• Solar energy charging spots available for at least 100 vehicles per day in Santiago.
• At least 100 kW35 of solar capacity installed as part of integrated rooftops for vehicle charging sites.
• At least 800 tons of CO2 avoided per year through the use of solar electricity36.
35 Considering slow solar energy charging for 50 EV. Every solar energy charging installation is about 2kW. 36 Charge for 240 days per year, for about 5 hours per day.
Proposal for a Nationally Appropriate Mitigation Action (NAMA) in the transport sector in Chile
47
Phase I (2012-2014) Phase II (2015-2020) O
utc
omes
• Willingness to install charging infrastructure
on-site by municipalities, businesses, schools and other organizations increases by 25% from baseline
• Solar energy chargers gain prominence as a solution.
Imp
act
Establish a reliable and effective charging infrastructure to service 70.000 vehicles by 2020 and emphasise renewable electricity.
Table 11 Evaluation indicators and targets for the Charging Infrastructure pillar Reporting details – Charging Infrastructure The indicators should be reported in the following manner:
Indicators Timing/ frequency Responsible entity Reporting • Number of solar
charging ports • Aggregate capacity
of solar panels installed
• CO2 impact
Monthly, from beginning to end of Phase I
MOE with external verification/audit performed annually.
Annual results reported to funding parties.
• Willingness to install charging infrastructure
Once at the beginning of Phase I and once at the end.
External party, measured through survey with a margin of error of less than 4%.
End results reported to funding parties and internationally.
Table 12 Measurement and reporting details for the Charging Infrastructure pillar
Proposal for a Nationally Appropriate Mitigation Action (NAMA) in the transport sector in Chile
48
4.4.5 Evaluation – Research & Development
The following will be used to monitor the activities under the Research and Development pillar.
Phase I (2012-2014) Phase II (2015-2020)
Ou
tpu
ts
Lithium and copper studies
• Endorsed by major stakeholders including at least two ministries and 3 major companies or academic groups.
• Timely, relevant and actionable outputs that can lay the foundation for future R&D activities.
IT applications
• Number of downloads of Smartphone apps and other software.
• Customer satisfaction scores
EV centre for capacity
building
• Number of students trained • Number of students entering the
workforce • Cost efficiency as measured by
quality / cost per student trained • Leverage of other financing
sources.
EV centre for capacity
building
• Number of students trained • Number of students entering
the workforce • Cost efficiency as measured
by quality / cost per student trained
Training of emergency personnel
• Number trained • Mastery of concepts
Proposal for a Nationally Appropriate Mitigation Action (NAMA) in the transport sector in Chile
49
Phase I (2012-2014) Phase II (2015-2020) O
utc
omes
• Sufficient37 local capacity for mechanics and
other technical staff to maintain the EV fleet. • Sufficient local capacity for electricians and
other technical staff needed to maintain charging infrastructure.
• Sufficientlocal capacity for mechanics and
other technical staff to maintain the EV fleet.
• Sufficient local capacity for electricians and other technical staff needed to maintain charging infrastructure.
• Increased economic opportunities for workers in the EV sector in Chile.
• Technology transfer of batteries and other electric vehicle technologies to Chile
• Improved competitiveness of Chile in Lithium-ion batteries and other components.
Imp
act
Establish Chile as a regional centre of excellence for e-mobility and embed electric vehicle technologies in Chilean institutions.
Table 13 Evaluation indicators and targets for the Research and Development pillar Reporting details – Research & development The indicators should be reported in the following manner:
Indicators Timing/ frequency Responsible entity Reporting • Number of students
trained • Number of students
entering the workforce
• Number of emergency personnel trained.
Annually Programme implementation unit
Annual results reported to funding parties and internationally
Table 14 Measurement and reporting details for the Research and Development pillar
37 Sufficiency could be assessesed by surveying EV owners. For example “Do you have problems finding mechanics to service your vehicle?”
Proposal for a Nationally Appropriate Mitigation Action (NAMA) in the transport sector in Chile
50
4.4.6 Evaluation indicators – Communication and public diffusion
Phase I (2012-2014) Phase II (2015-2020)
Ou
tpu
ts
Website
• Launched within 3 months of start of activities.
• Receives at least 50.000 unique visitors by Jan 2014.
Website To be determined
Public education and road
shows
• At least 10 public events by 2014 informing about the Plan and displaying EVs.
• At least 3 press conferences held by 2014.
Public education and road
shows
To be determined
Seminars • At least 2 international seminars and
4 national seminars held in Chile by 2014.
Seminars To be determined
Ou
tcom
es
• % of people aware of EVs in Chile above
baseline • % of people aware of the Plan • % increase in national news articles about EVs
To be determined
Imp
act
Increase recognition and public acceptance of electric vehicles in Chile
Table 15 Evaluation indicators and targets for communication and public diffusion activities Reporting details – Communication and public diffusion The indicators should be reported in the following manner:
Indicators Timing/ frequency Responsible entity Reporting • % of people aware of
EVs in Chile above baseline
• % of people aware of Plan
• % increase in national news articles about EVs
Annually MOE with external party; measured through consumer survey with a margin of error of less than 4%.
Reported to funder annually.
Table 16 Measurement and reporting details for communication and public diffusion activities
Proposal for a Nationally Appropriate Mitigation Action (NAMA) in the transport sector in Chile
51
4.5 Risks and risk mitigation measures
The table below provides a general assessment of risks to the success of the proposed NAMA.
Risk Type Possible risks to project Risk mitigation measures
Risks that benefits proposed will not be met
The success of this NAMA and the likelihood of reaching a target of 70.000 electric vehicles by 2020 depends on many external factors which include:
• Technological developments of electric vehicle batteries, most importantly those affecting costs, battery capacity, and charging times.
• Continuation of policy incentives for EVs in other parts of the world. This will affect the scale up of EVs and related technologies and will impact costs of vehicles in Chile.
• Future petroleum prices; where a significant drop in the price of crude would decrease the competitiveness of electric vehicles vs. ICE
• Future prices of materials, most importantly lithium, iron and steel and other materials used in vehicle motors and batteries.
There is an additional risk to the mitigation potential of the NAMA due to the link of EVs with the source of electricity generation. The mitigation benefits specified use an average mix of the generating portfolio in Chile. However, mitigation benefits could decrease if the marginal electricity for EVs comes from carbon intensive sources like coal and petroleum. With current technology, the source of electricity cannot be determined unless it comes from a closed system (not from the grid) which is not feasible under most circumstances.
The main risk mitigation measure that has been taken is splitting the NAMA in two phases. This allows the majority of the investment to be deferred for two years, providing time to observe developments in the fast moving electric vehicle market. At the same time, the first phase will allow learning and set the stage for a larger deployment if the conditions are appropriate.
The NAMA will emphasize electricity supply from renewable energy sources and explore technological options for monitoring of electricity supply.
Risks that cost estimates will not be met
Risks for this category are only considered for Phase I of the NAMA since the second phase has not been budgeted.
The most important risk factors are already mentioned above. Negative developments in vehicle and battery costs will adversely affect the
(see above)
Proposal for a Nationally Appropriate Mitigation Action (NAMA) in the transport sector in Chile
52
Risk Type Possible risks to project Risk mitigation measures
programme, increasing the level of incentives required and the potential costs of reaching the targets for the EV pilot projects.
Other risks: physical, social, political, ex-change rate, etc.
We do not foresee physical or social risks.
Possible exchange rate risks exist because the majority of the vehicle market is supplied by foreign suppliers which are mostly located in Japan, the United States and the European Union. In this case adverse currency movements against the Chilean Peso will decrease the competitiveness of electric vehicles in Chile. This is also the case for ICE vehicles. However, it can be foreseen that consumer willingness to pay a premium for an EV would decrease under such a scenario.
The NAMA will try to source fleet vehicles from a diverse set of suppliers.
Chile is economically stable and we do not see fundamental reasons for an adverse movement in currency rates.
Proposal for a Nationally Appropriate Mitigation Action (NAMA) in the transport sector in Chile
53
5 Next steps
The next steps for the E-mobility Readiness Plan will involve setting up the instiutional structures needed to carry out activities and structuring and securing the necessary domestic and international (financial) support to implement the Plan.
There is already a strong base to build from to move the NAMA into the finance and implementation stage. The NAMA is supported by major stakeholders which already took part in the development of the proposal, including car companies, electricity companies, academic institutions, and civil society organisations. Chile has already undertaken some e-mobility initiatives, including the installation of battery-charging stations, a major study on charging infrastructure38 and significant academic research on lithium-based technologies. High-profile events with the President and ministers have raised e-mobility on the national agenda. There is also the umbrella framework of the Government’s Low and Zero Emission Vehicle Policy, which will provide legislative backing to carry out the activities of the Plan in the long term.
The following next steps are envisaged.
• Approach and convene international climate finance donors, national and international private sectors entities (e.g. automotive, electricity, mining companies) to assess the proposal and discuss support and finance options.
• Develop detailed finance and implementation plans (including detailed monitoring requirements) once funding pledges have been received. Finance and implementation plans could be developed in phases or by component with further finance depending on the achievement of set milestones.
• Establishment of the Programme Implementation Unit (PIU) by the Ministry of Environment and Ministry of Transport and Telecommunications which would assign staff to administer and manage the implementation of the Plan.
• Formlisation of the working group which has been operational during the NAMA proposal phase to establish an official Steering Group for the E-mobility Readiness Plan. The Steering Group should include additional organisations interested and willing to support the NAMA.
• Based on the task definitions in this proposal, and with further negotiations with the Steering Group and funders, the PIU would publish terms of reference (ToR) for the activities that have been proposed in the first phase of the Plan.
• The PIU would also begin consultations with interested municipalities in Santiago to host the pilot projects. A possibility is to link the pilots with another NAMA proposal being developed which seeks to establish a “Green Zone” in the Municipality of Santiago. There is a strong potential for synergies with this NAMA and there is political interest in this municipality to undertake e-mobility pilot projects.
38 (FCFM-Universidad de Chile, 2010)
Proposal for a Nationally Appropriate Mitigation Action (NAMA) in the transport sector in Chile
54
6 Bibliography
Central Energia. (2011). Central Energia - Centrales. Retrieved November 15, 2011, from http://centralenergia.cl/centrales/
CoP 13. (2007). Bali Action Plan.
Dargay, J., Gately, D., & Sommer, M. (2007). Vehicle Ownership and Income Growth , Worldwide : 1960-2030 (pp. 1-32). Leeds, England.
Deloitte. (2010). Gaining traction A customer view of electric vehicle mass adoption in the U . S . automotive market.
Diaz Herrera, P. P. (2011). CHILE’S MINING INDUSTRY ON A GLOBAL SCALE. Presentation. Retrieved from http://www.alabc.com.au/Portals/54/Content/Documents/News/Chile Presentation.pdf
EPRI. (2007). Environmental Assessment of Plug-In Hybrid Electric Vehicles Volume1: National Greenhouse Gas Emissions (Vol. 1).
FCFM-Universidad de Chile. (2010). Diagnóstico de necesidades de infraestructura energética de la Ciudad de Santiago (y Chile) para soportar/integrar vehículos eléctricos en escala comercial.
GENI. (2012). National Energy Grid Chile. Retrieved from http://www.geni.org/globalenergy/library/national_energy_grid/chile/index.shtml
IEA. (2008). IEA Energy Statistics - Energy Balances for Chile. Retrieved November 15, 2011, from http://www.iea.org/stats/balancetable.asp?COUNTRY_CODE=CL
Ministerio del Medio Ambiente. (2011). Comunicacion Nacional de Chile. Retrieved from http://www.mma.gob.cl/1257/articles-50880_docomunicadoCambioClimatico.pdf
The World Bank. (2008). Motor vehicles (per 1000 people). Retrieved January 11, 2011, from http://data.worldbank.org/indicator/IS.VEH.NVEH.P3
UNEP. (2011). Bridging the Emissions Gap. Synthesis.
UNEP/GRID. (2011). SWERA - Data for Solar and Wind Renewable Energy. Retrieved from http://swera.unep.net/
USPS-OIG. (2009). Electrification of Delivery Vehicles. Alternatives.
Wiederer, A., & Philip, R. (2010). Policy options for electric vehicle charging infrastructure in C40 cities For.
Proposal for a Nationally Appropriate Mitigation Action (NAMA) in the transport sector in Chile
55
Appendix I – GHG Reduction Calculations
The appendix provides the details and assumptions behind the GHG emission reductions as shown in the NAMA proposal document. The overall NAMA target of 70.000 electric vehicles by 2020 has an estimated potential impact of 183,4 ktCO2 per year in 2020 over business-as-usual and a cumulative impact over the lifetime of the vehicles of 2,76 MtCO2. The calculations were based on sharing the target of 70.000 electric vehicles amongst different types of vehicles with differing activity levels and potentials for market penetration. GHG reductions were calculated for all vehicle types on a well-to-wheel basis.
Electric vehicle target
The target of 70.000 electric vehicles in Chile was set by the Chilean Ministry of Environment and the Ministry of Transport in consultation with stakeholders. The target was considered in the context of the Report “Diagnóstico de necesidades en la infraestructura de Carga para Autos Eléctricos“ by the Energy Center of the University of Chile39. The research showed an expected penetration of electric vehicles around the world in the year 2020 of between 1% and 25%. A target of 70.000 vehicles would represent approximately 2-3% of the fleet in Chile in the year 2020, and this was considered a realistic target by the government.
The target was split amongst various types of vehicles and transport services. The main criteria for determining the split were:
1. Economic feasibility of electric vehicles according to usage scenarios for vehicles. 2. Types of vehicles which could potentially be available in the market in 2020 and the
technical characteristics of each. 3. Scale-up potential according to historical growth rates of the fleet.
Vehicle types were classified according to the Chilean National Institute of Statistics (INE)40 as shown in Tabel 1 below.
Table 17 Types of vehicles considered
Type of vehicle2 Definition Activity level (km/yr)41
Regular taxi Urban taxi service with a “regular” permit. 37.405
Collective taxi Taxi service that waits for passengers until all seats are filled. Routes are typically fixed and distances travelled longer.
43.731
Tourism taxi Urban taxi service with a “tourism” permit. 50.327
39 (FCFM-Universidad de Chile, 2010) 40 (Instituto Nacional de Estadisticas, 2010) 41 (Government of Chile, 2010)
Proposal for a Nationally Appropriate Mitigation Action (NAMA) in the transport sector in Chile
56
Collective transport ‘minibus’
Private vans and small buses which travel fixed routes. 17.462
Commercial fleet vehicles
Commercial fleet vehicles used to transport passengers or urban cargo.
17.462
Private vehicles Private cars and station wagons. 15.875
Considering that the purchase cost of an electric vehicle is likely to remain higher than a conventional vehicle in the timeframe of the NAMA, it is more likely to see a higher uptake of EVs in transport services with high activity levels.
Fuel costs and maintenance costs per kilometre are lower for electric vehicles than for internal combustion engines and this helps offset the higher purchase cost of the vehicle42. For this reason, taxis and fleet vehicles were considered as the most likely to achieve high market penetration rates in the given timeframe. In addition, taxis are tightly regulated in Chile through the permitting process and this provides an additional lever to incentivize the take-up of electric vehicles.
A target of 25% of their respective fleets was assumed for the three types of taxi services. The remaining target was divided amongst commercial fleet operators, minibuses and private vehicles.
All data presented here for taxis, minibuses and commercial fleets are for the Santiago Metropolitan Area because the majority of these vehicles operate there and because of limitations to collect data nationally. Private vehicles are considered at the national level.
Table 18 EV target split by type of vehicle
Category Number of
EVs in 2020
% EVs in respective
fleet in 2020
Taxis Regular* 5.280 25%
Taxis Collectives* 3.413 25%
Taxis Tourism* 1.434 25%
Minibus Collective Transport* 1.280 9%
Commercial* 17.920 16%
Private Cars** 40.700 1%
Total 70.000 -
42 (USPS-OIG, 2009) * Only Santiago Metropolitan Area ** National fleet
Proposal for a Nationally Appropriate Mitigation Action (NAMA) in the transport sector in Chile
57
Emission reduction estimates
Emissions were calculated by taking the sum of Vehicles*Activity level*Emissions factor, for each of the types of vehicles considered in the target. This was done on a yearly basis to reflect the scale-up of the electric vehicle fleet.
Emission reductions are the difference between business-as-usual emissions and the emissions under the NAMA on a well-to-wheel basis, assuming that the 70.000 electric vehicle target is met in 2020 with the given split. Cumulative emission reductions consider the lifetime of the 70.000 vehicles, estimated at 15 years.
Principal assumptions
Table 3 shows the emission factors and activity levels per vehicle type.
Table 3 Emission factors and activity levels per vehicle type
Items Taxis regular
Taxis collective
Taxis tourism
Minibus collective
Commercial Private vehicles
ICE CO2 [gr/lt] 2.378 2.378 2.378 2.730 2.730 2.378
ICE [km/lt]*** 12 12 12 10 12 12
ICE CO2 [g/km] 198 198 198 273 228 198,2
EV [km/kWh]* 6,7 6,7 6,7 4 4 4 EV CO2 SIC [g/kWh]** 367 367 367 367 367 367
EV CO2 [g/km] 54,8 54,8 54,8 83,4 83,4 83,4 Activity level [km/yr] a 37.405 43.731 50.327 17.462 17.462 15.875
ICE =Internal combustion engine vehicle EV = Electric vehicle * Annex 3, (FCFM-Universidad de Chile, 2010) ** (Chilectra, 2010) *** Ministry of Environment a(Government of Chile, 2010)
Two types of electric vehicles were considered:
• Plug-in hybrids – Electric vehicles with a supplementary internal combustion engine to be used when the battery runs out.
• Battery electric vehicles – Electric vehicles which rely solely on a battery for propulsion.
Due to presumed characteristics of the consumer market, where “range anxiety” pushes consumers to favour plug-in hybrid vehicles, we estimated a higher emission factor for private vehicles. This estimate assumes that private vehicles run 70% of the time on electric mode and 30% on gasoline.
Proposal for a Nationally Appropriate Mitigation Action (NAMA) in the transport sector in Chile
58
For fleet vehicles and taxi owners a greater penetration of Battery Electric Vehicles was assumed, and this lowered the emissions factor.
BAU growth of the vehicle fleet
The growth of the fleet to 2020 was estimated by taking the average growth rates of the vehicle types from 2005-2010 and projecting this into the future. One exception was for taxis in the Metropolitan Area of Santiago where the number of taxi licences is capped and no further growth can be expected. The next table shows the projections for the 6 fleets from 2005 to 2020. Data from 2005 to 2010 is real from INE43. Estimates for 2011 to 2020 show that the taxi fleet has no growth, for minibuses the growth rate is 12%44 and for commercial vehicles the growth rate is 4%.
Table 4 Projections of number of vehicles in the fleet 2005-2020
Year Taxis Regular*
Taxis Collective*
Taxis Tourism*
Minibus Collective*
Commercial* Private Cars
2005 25.827 14.264 812 2.675 60.726 1.406.796
2006 25.598 13.949 1.018 3.328 64.054 1.514.220
2007 25.648 14.011 1.398 3.820 67.610 1.615.458
2008 24.621 13.404 3.099 4.506 69.529 1.738.477
2009 21.519 13.659 6.230 4.919 70.940 1.816.143
2010 21.117 13.653 5.735 4.666 73.775 1.978.018
2011 21.117 13.653 5.735 5.237 76.711 2.117.736
2012 21.117 13.653 5.735 5.878 79.763 2.267.323
2013 21.117 13.653 5.735 6.597 82.937 2.427.476
2014 21.117 13.653 5.735 7.404 86.237 2.598.941
2015 21.117 13.653 5.735 8.310 89.669 2.782.518
2016 21.117 13.653 5.735 9.327 93.237 2.979.062
2017 21.117 13.653 5.735 10.468 96.947 3.189.489
2018 21.117 13.653 5.735 11.749 100.805 3.414.779
2019 21.117 13.653 5.735 13.186 104.816 3.655.983
2020 21.117 13.653 5.735 14.799 108.987 3.914.224
* Only Santiago Metropolitan Area
43 (Instituto Nacional de Estadisticas, 2010) 44 The growth rate is relatively high as this category includes a variety of transport services which in the past have grown significantly.
Proposal for a Nationally Appropriate Mitigation Action (NAMA) in the transport sector in Chile
59
BAU Emissions
Table 5 Year-by-year business-as-usual emissions for the project boundary
Figure 2 below shows how the total electric vehicle fleet is assumed to grow to reach the target.
Figure 2 Estimated growth of electric vehicle fleet
-
10,000
20,000
30,000
40,000
50,000
60,000
70,000
2012 2013 2014 2015 2016 2017 2018 2019 2020
# of
veh
icle
s
Electric vehicle growth per year
Proposal for a Nationally Appropriate Mitigation Action (NAMA) in the transport sector in Chile
61
NAMA Emissions impact
The following table presents the estimated CO2 emission reductions per category and fuel source. There is a 183,4 ktCO2 per year decrease from the BAU scenario in 2020.
Table 7 Year-by-year estimated emissions of conventional and electric vehicles in the NAMA (tCO2/yr) Year Taxis
The next figure shows the CO2 reductions for the period. The accumulated reductions expected are 2.76 m tons over the entire period, considering an assumed lifetime of the vehicles of 15 years.
Figure 3 Emission reductions per year for the NAMA
-
20,000
40,000
60,000
80,000
100,000
120,000
140,000
160,000
180,000
200,000
2012 2016 2020 2024 2028 2032
tCO
2e
Emissions reductions per year
Proposal for a Nationally Appropriate Mitigation Action (NAMA) in the transport sector in Chile
62
References
Chilectra. (2010). Chilectra: Informe de Sostenibilidad.
FCFM-Universidad de Chile. (2010). Diagnóstico de necesidades de infraestructura energética de la Ciudad de Santiago (y Chile) para soportar/integrar vehículos eléctricos en escala comercial.
Government of Chile. (2010). Inspection and Maintenance Database.
Instituto Nacional de Estadisticas. (2010). Parque de Vehículos en Circulacion 2010.
USPS-OIG. (2009). Electrification of Delivery Vehicles. Alternatives.
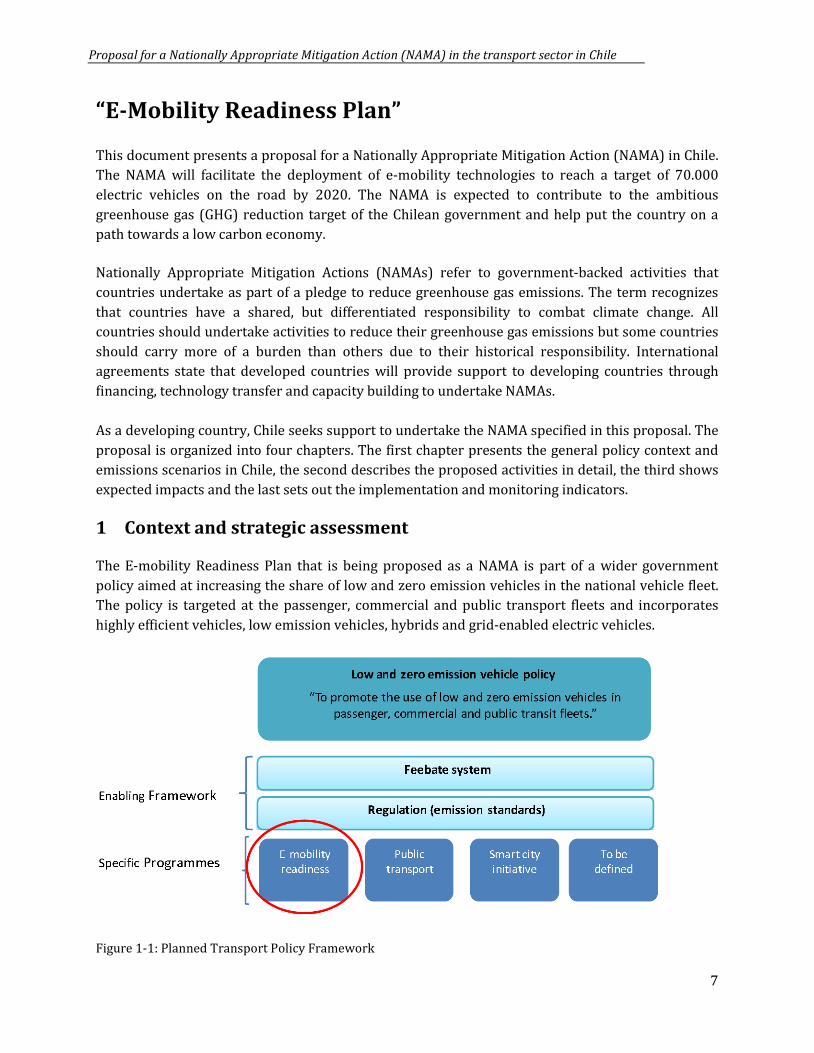

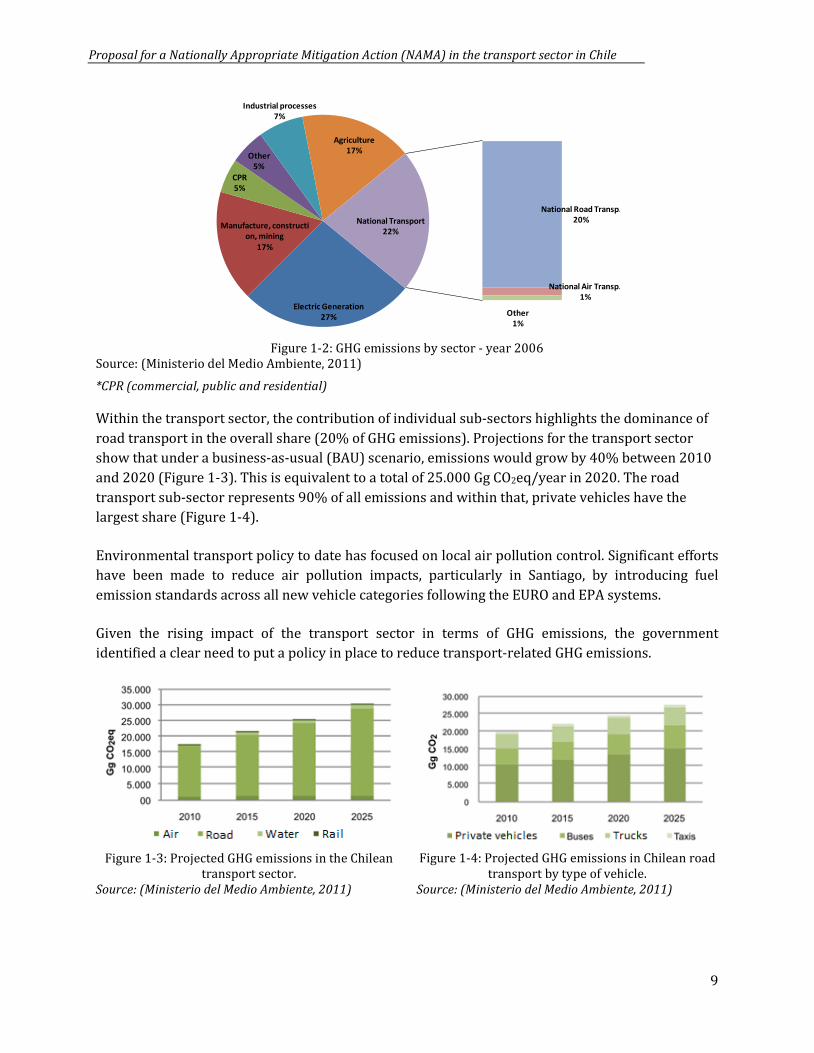
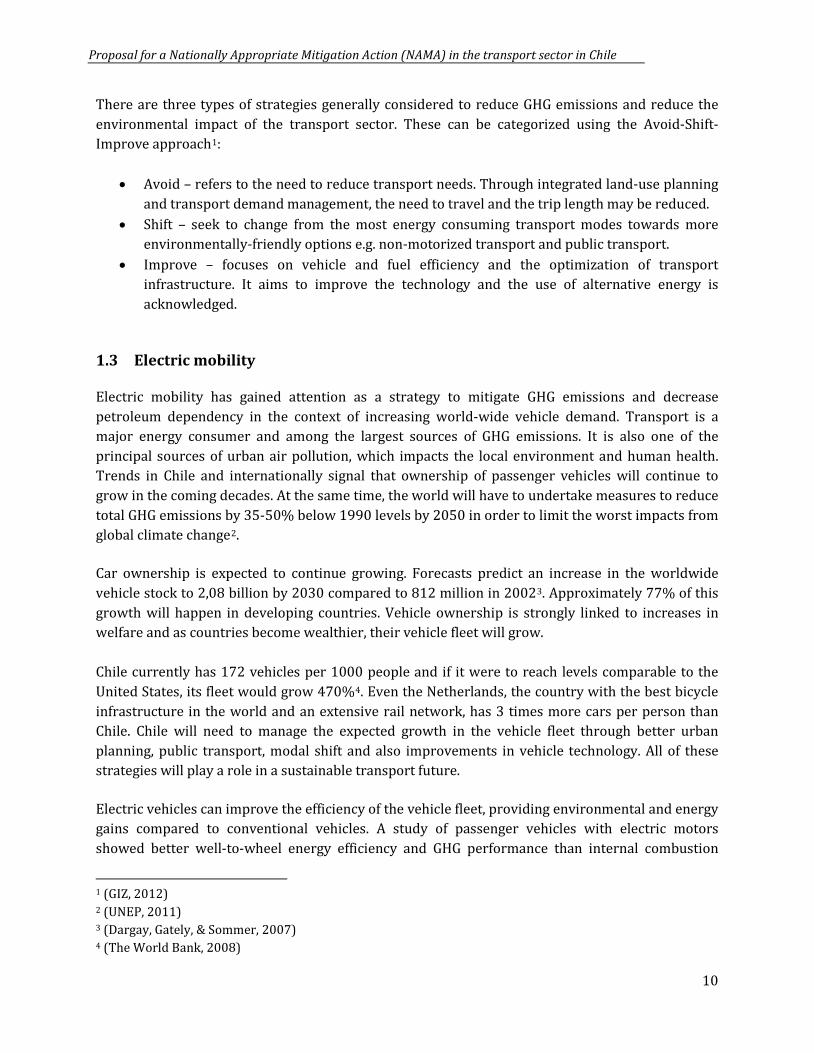
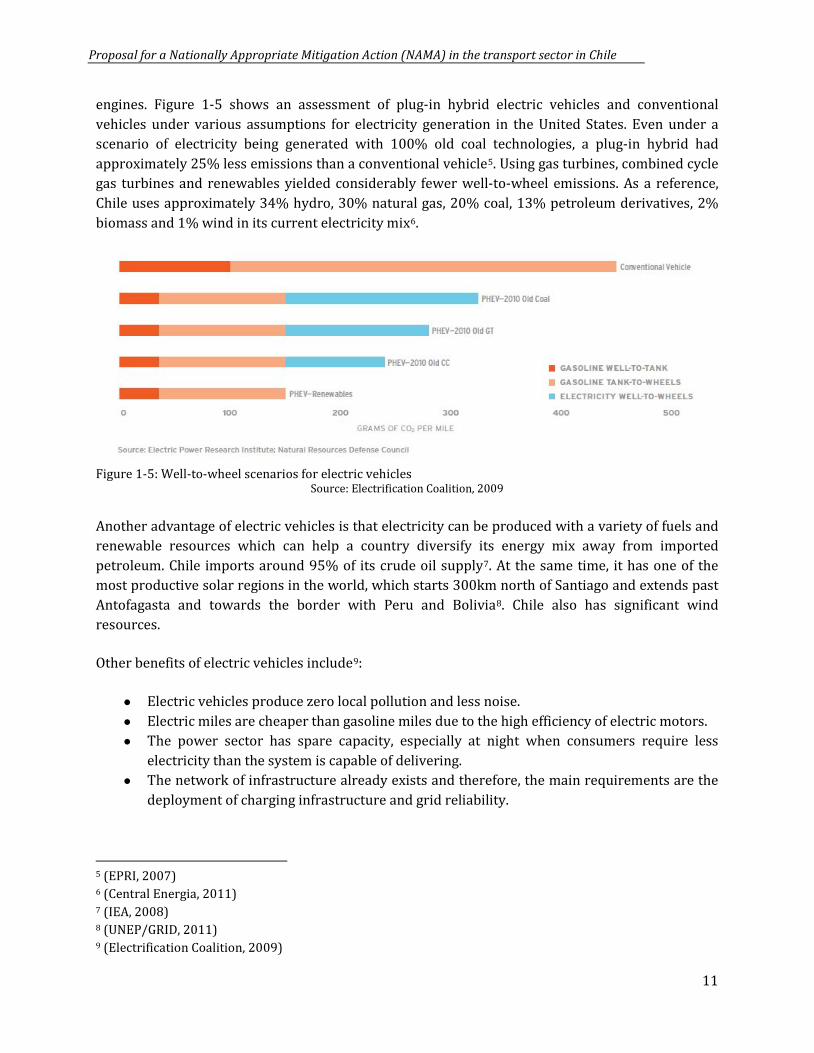
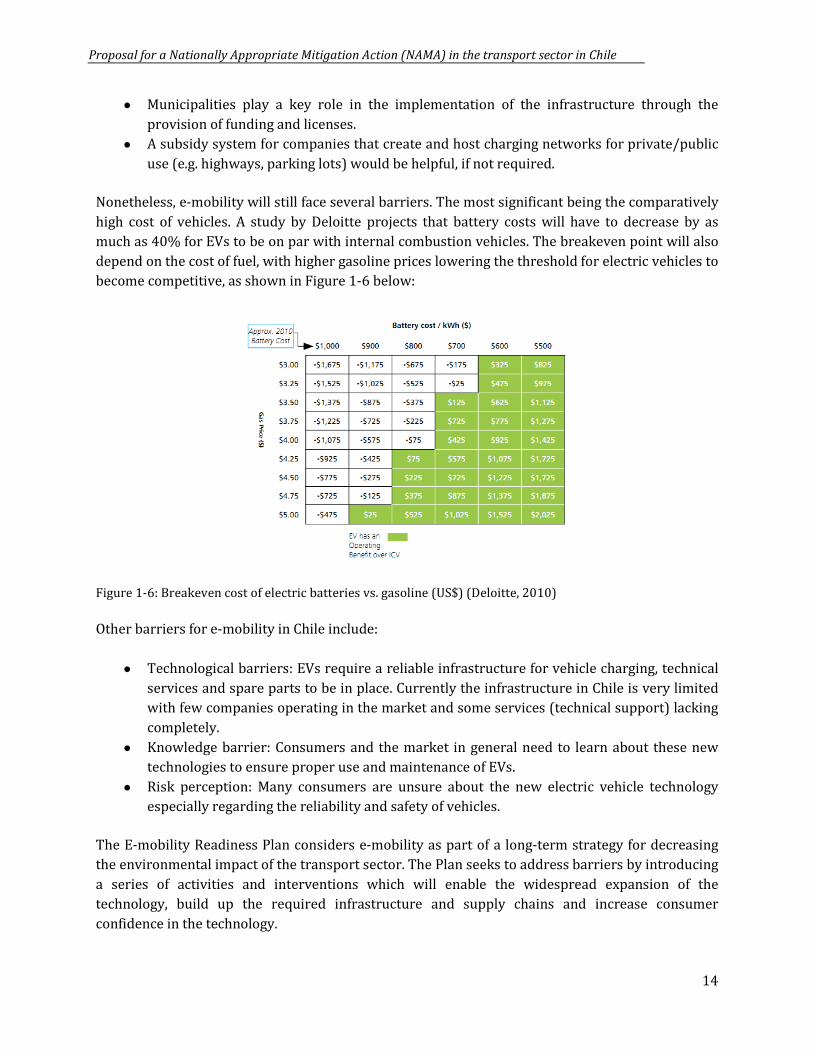
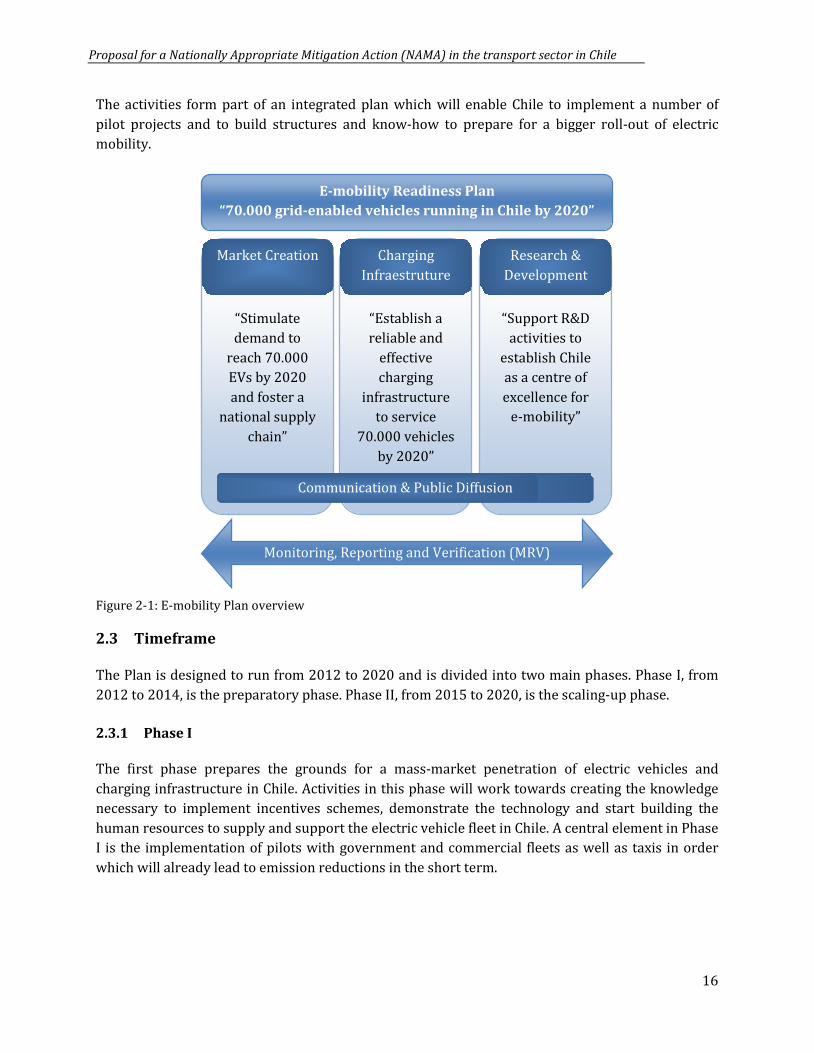
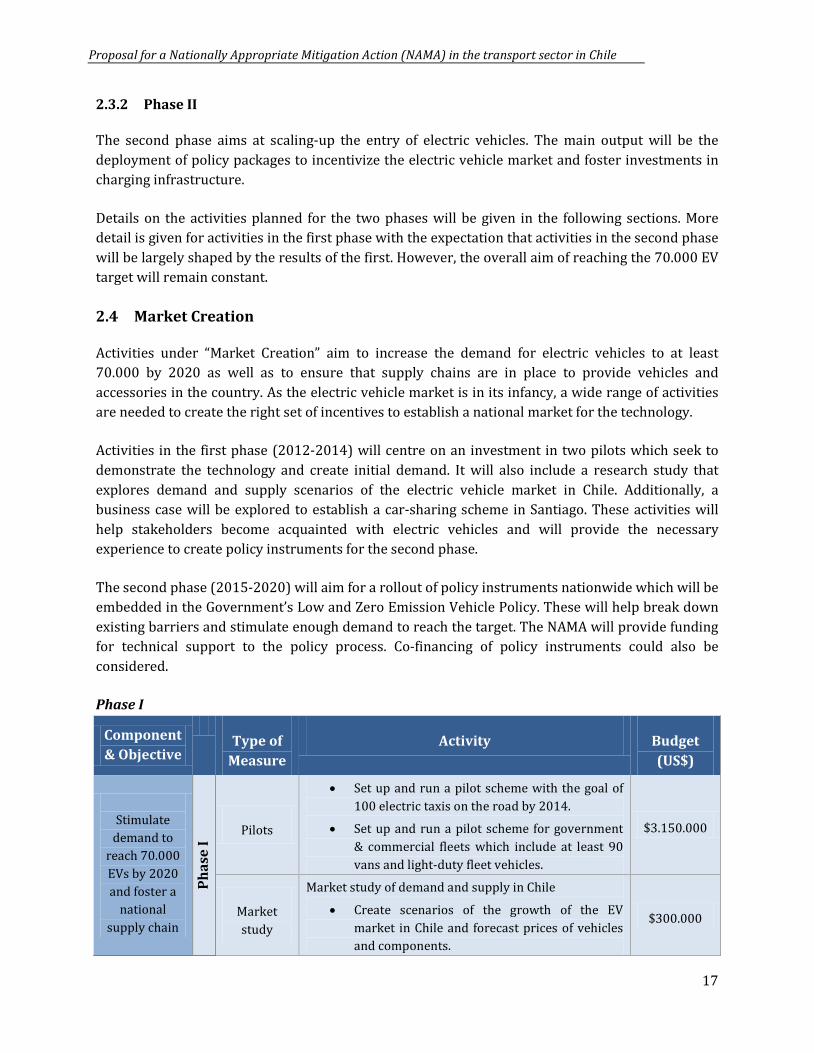
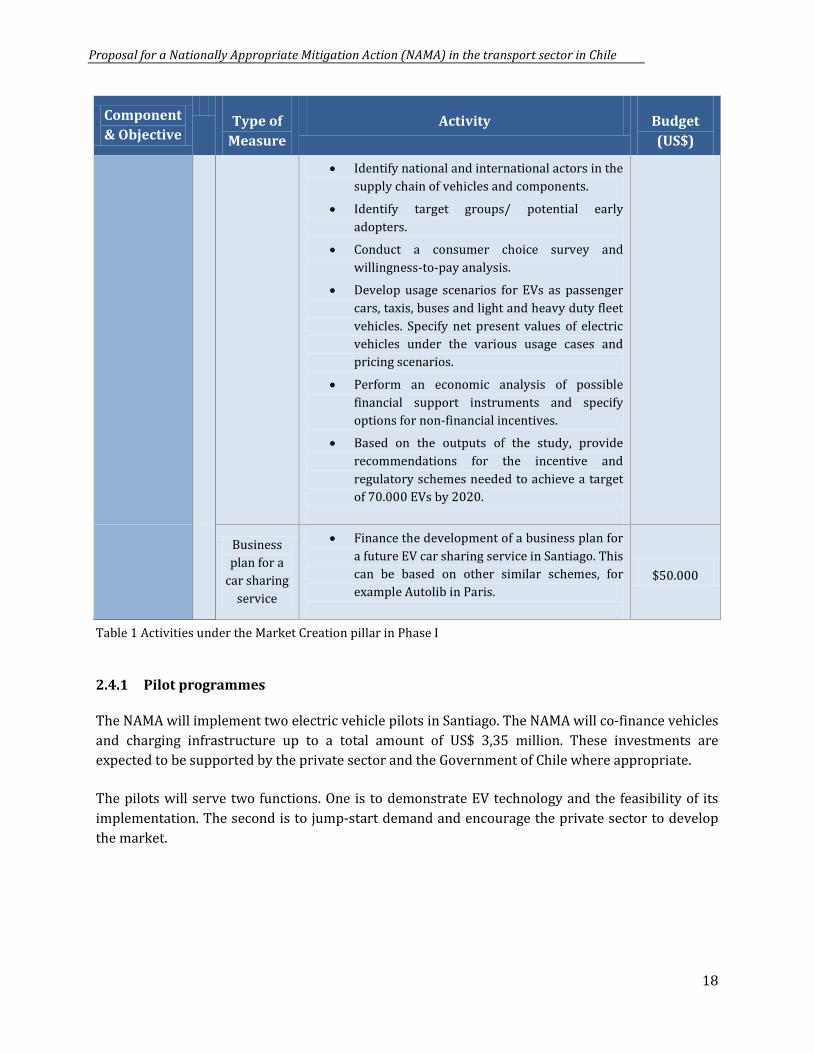
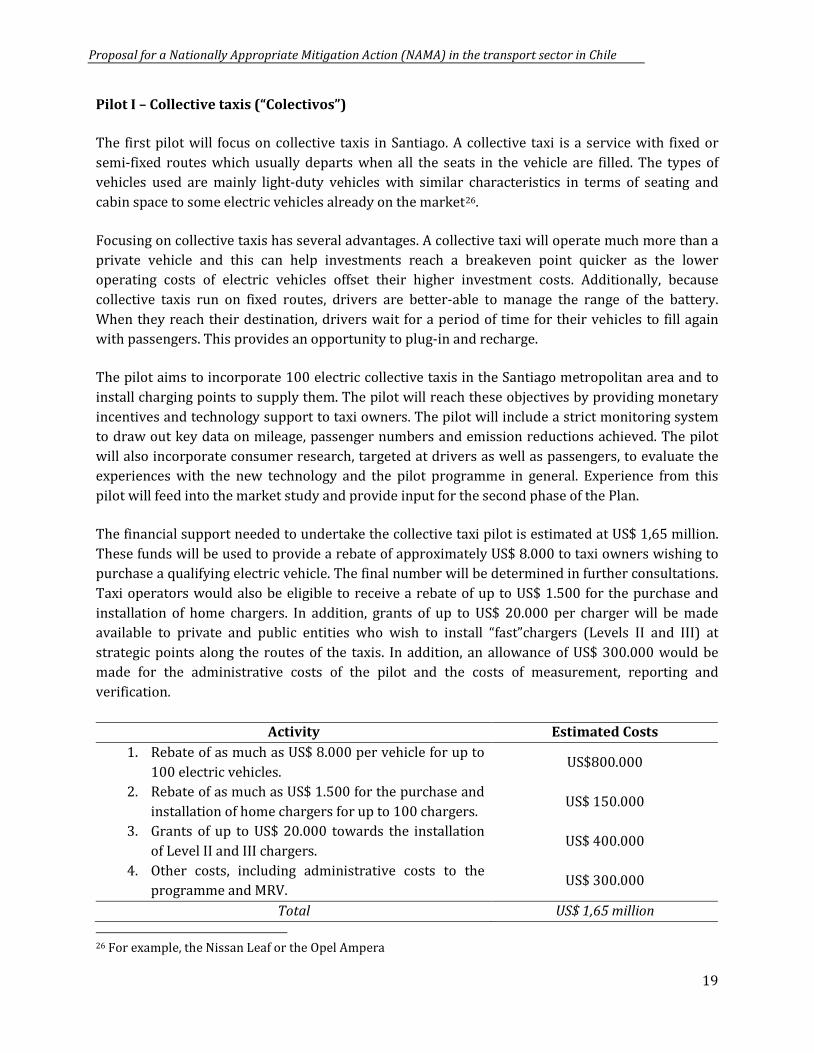
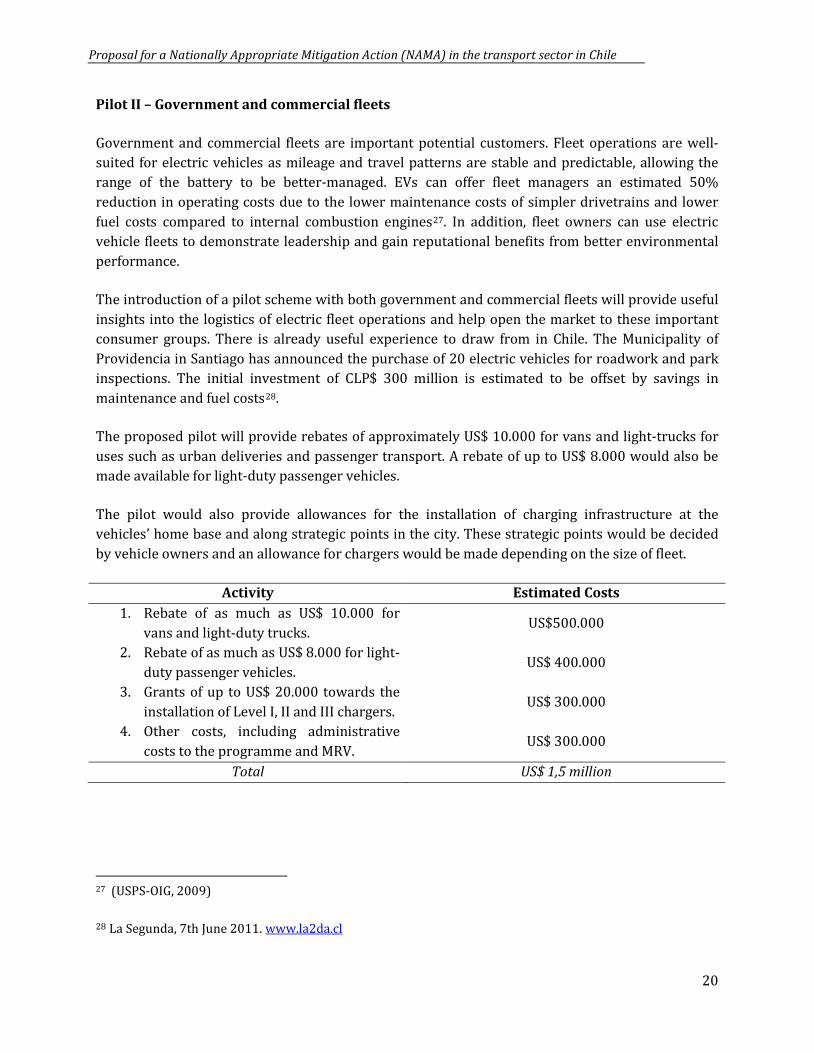
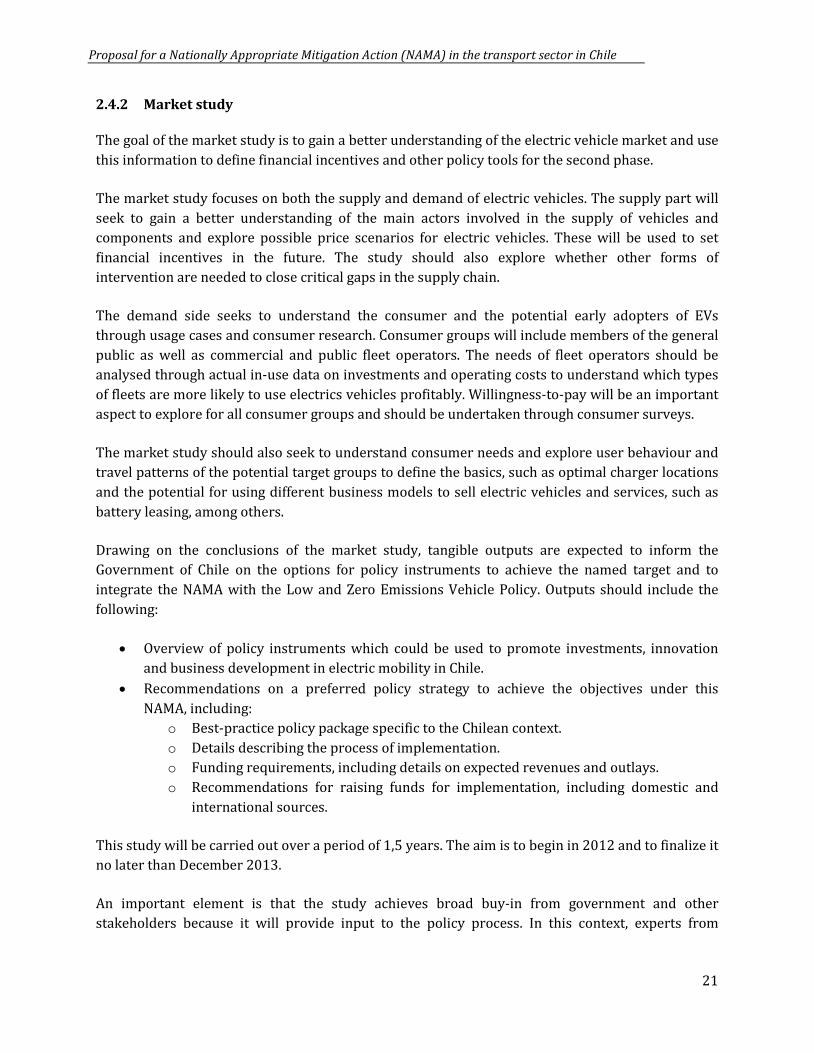
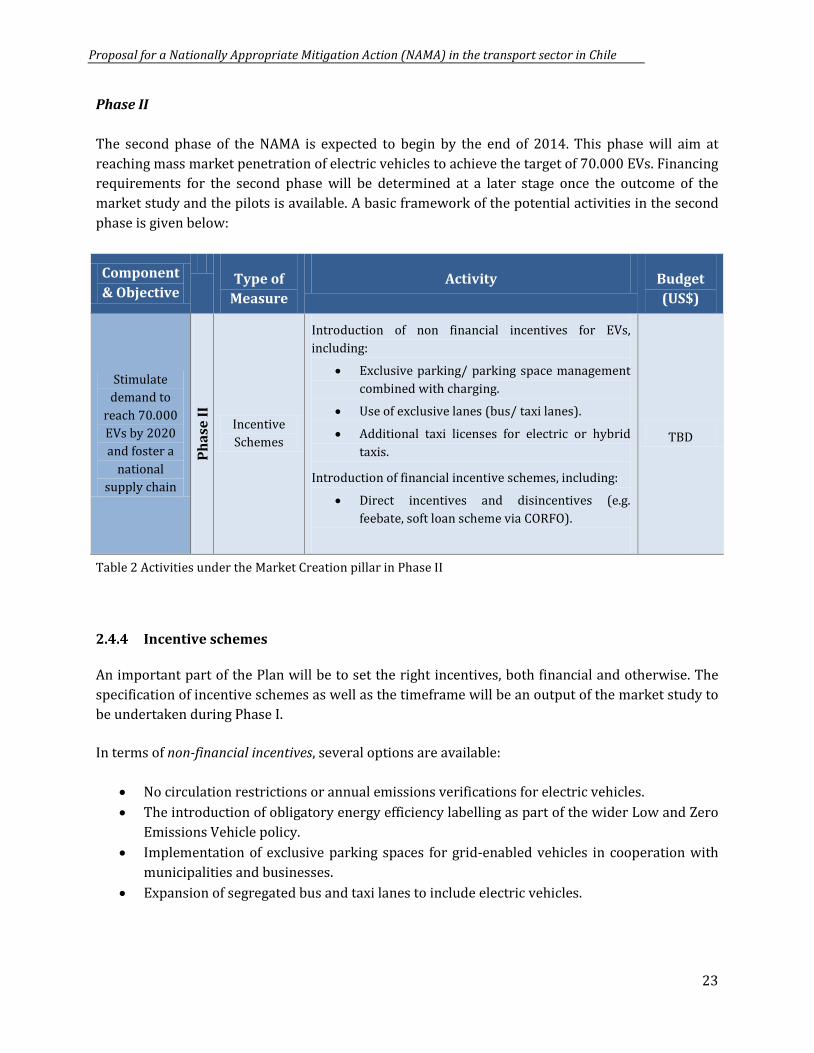
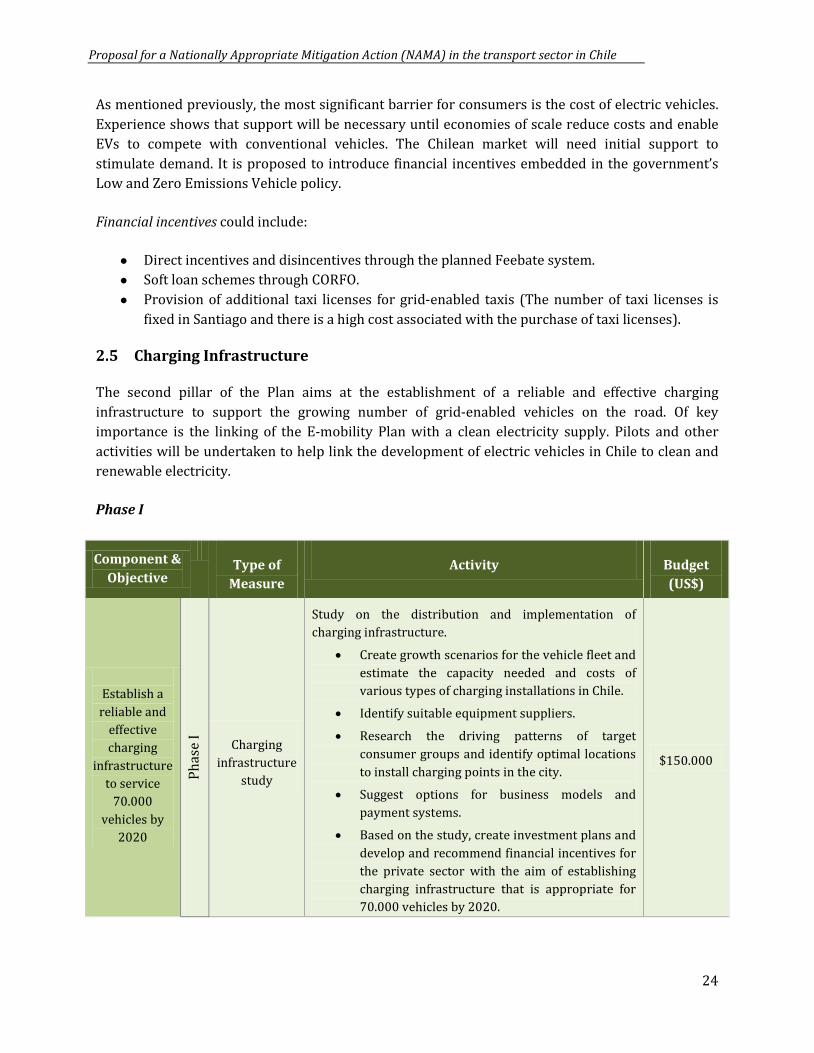
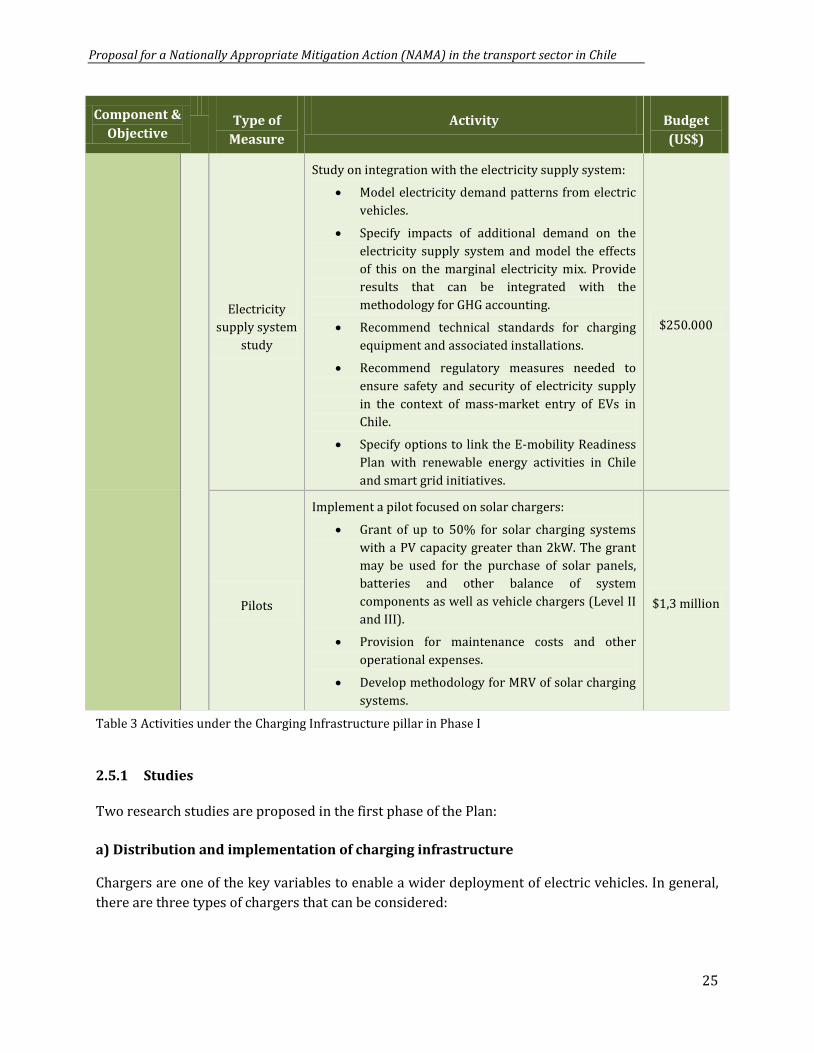
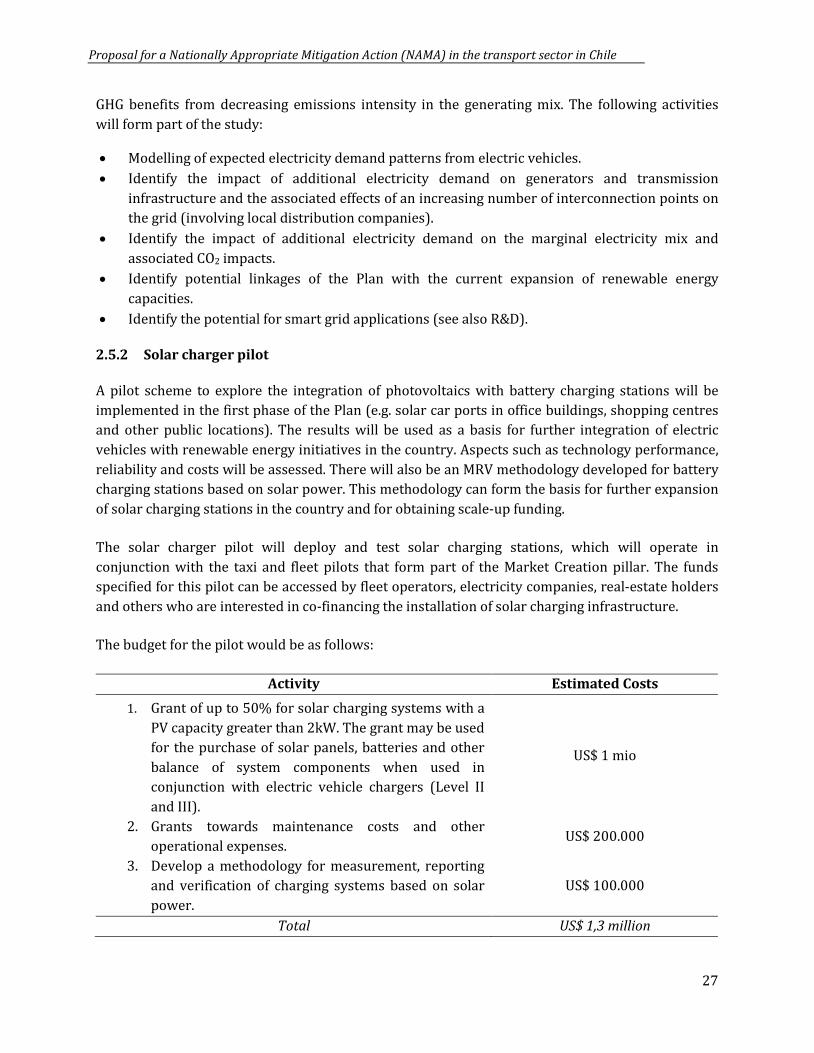
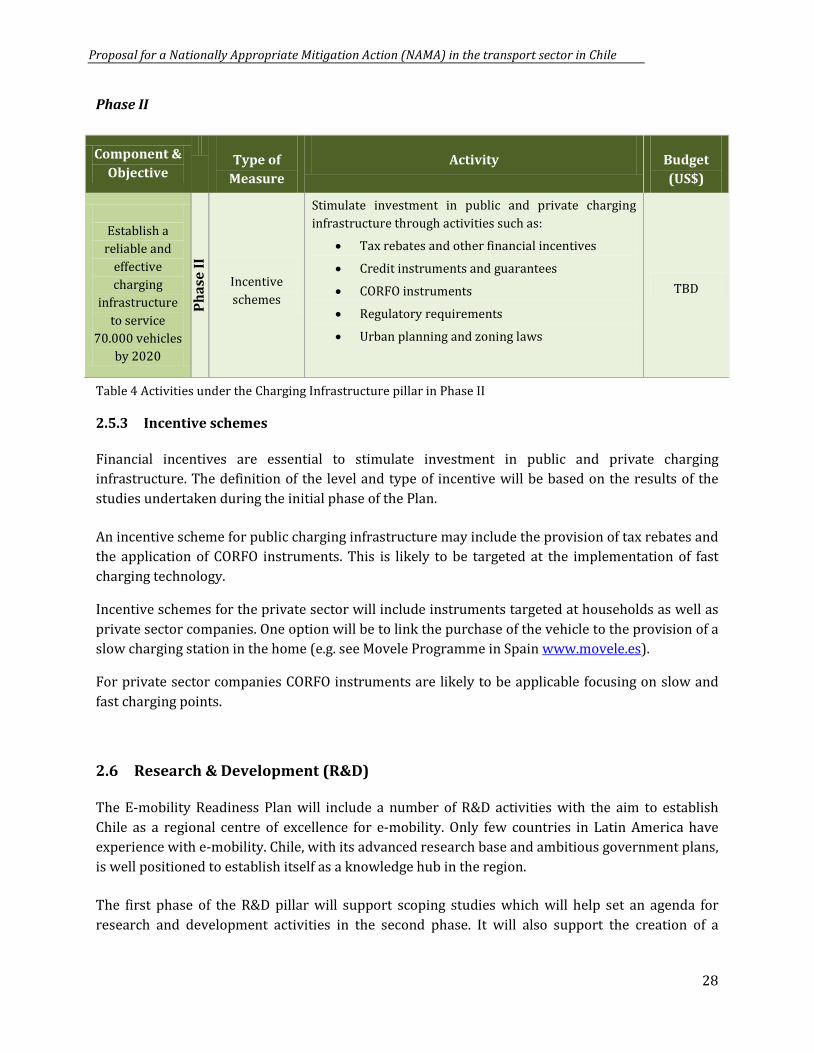
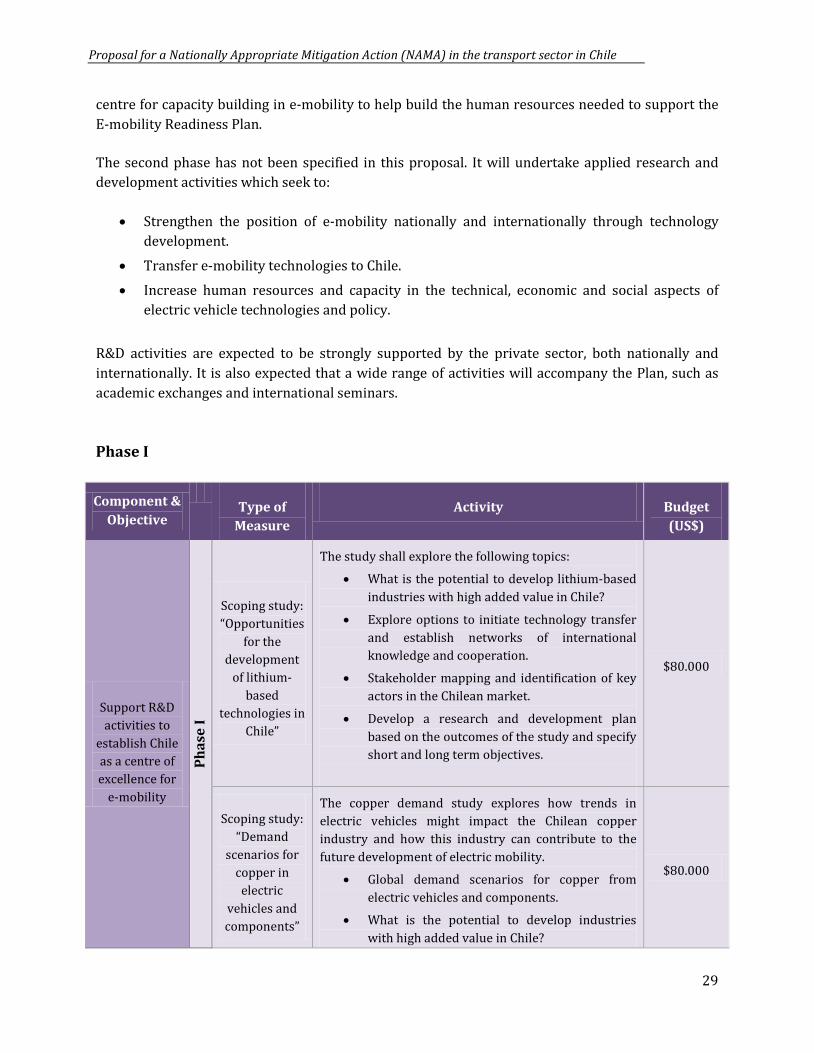
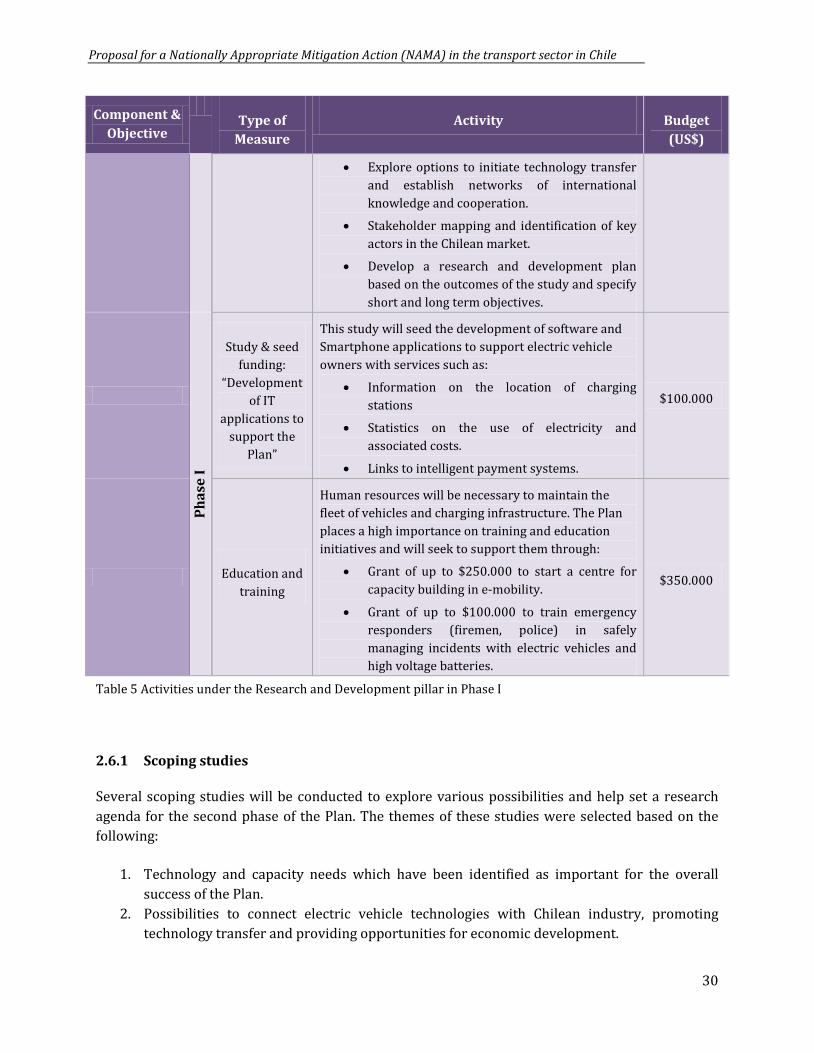

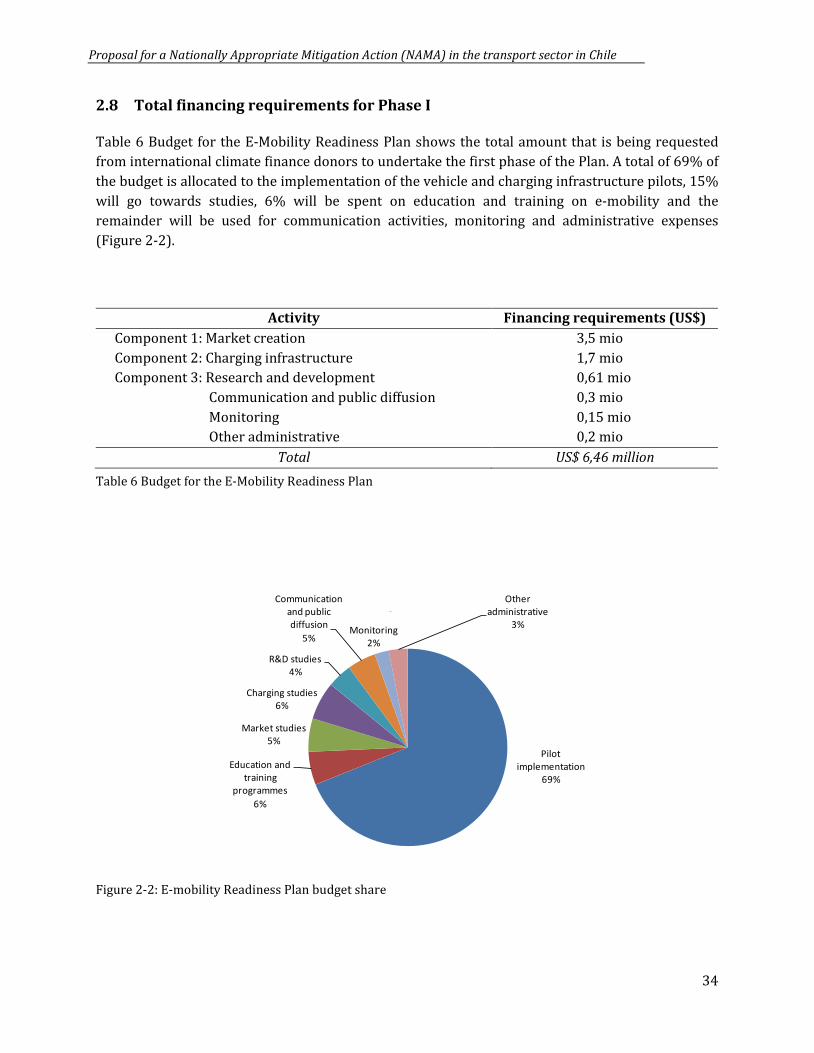
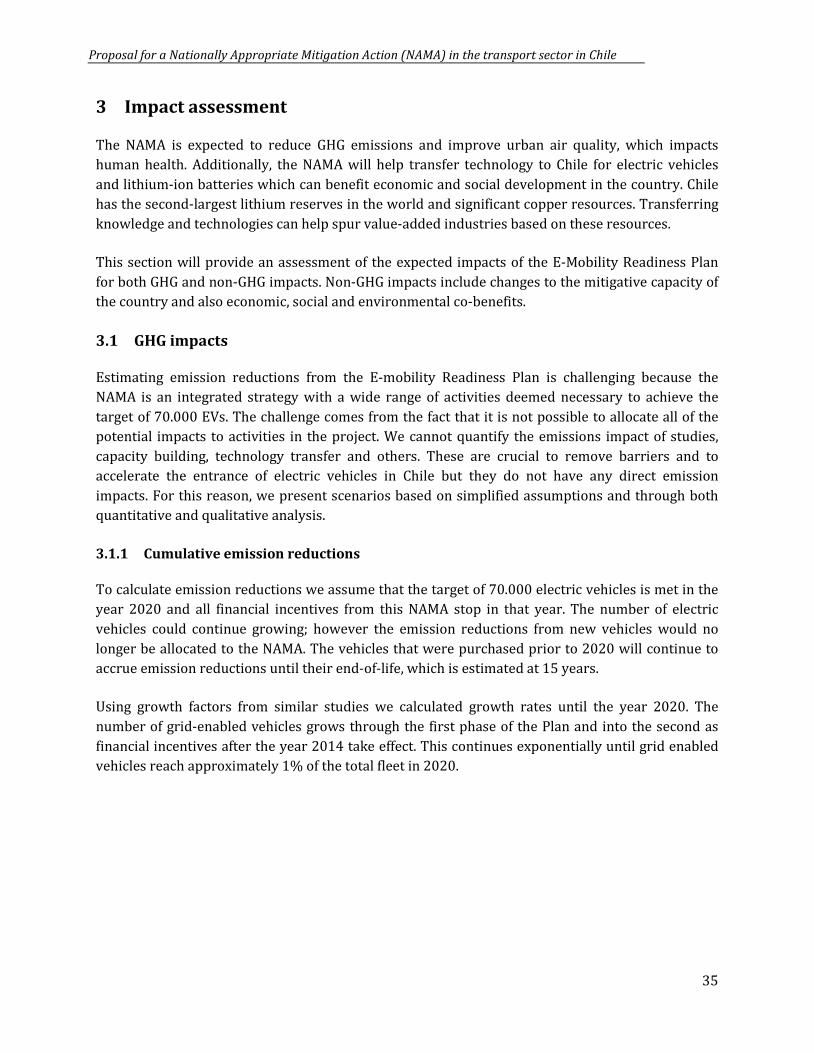
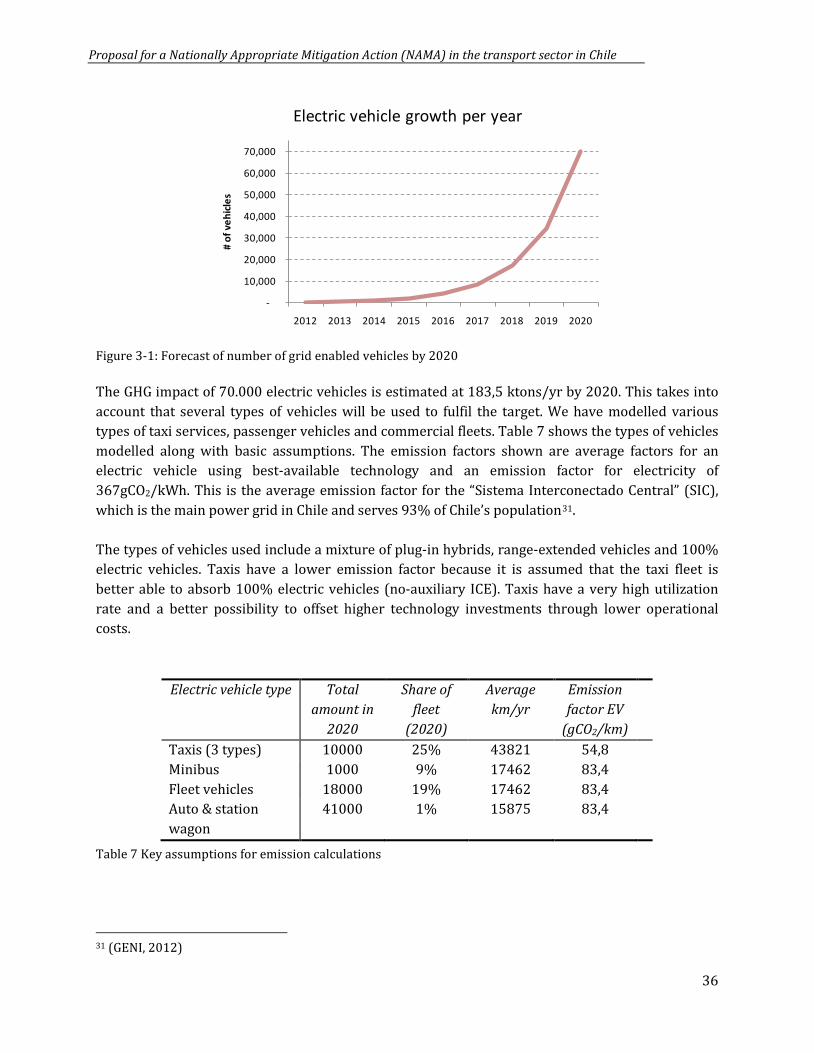
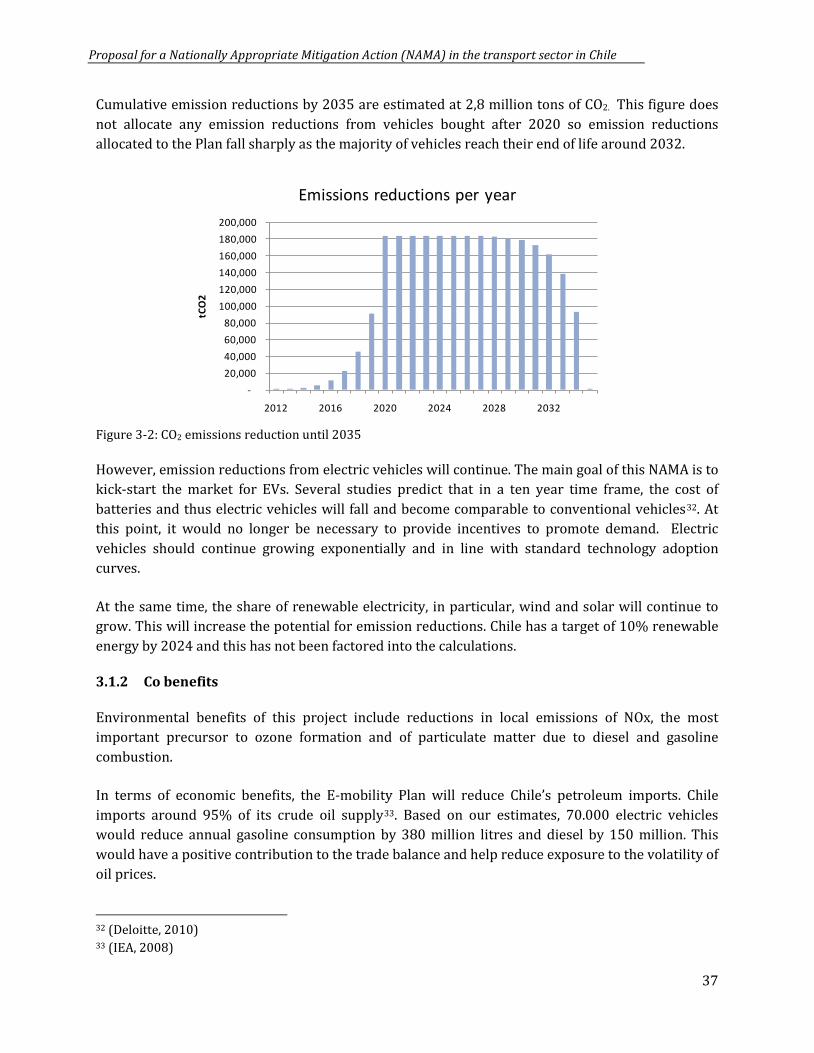
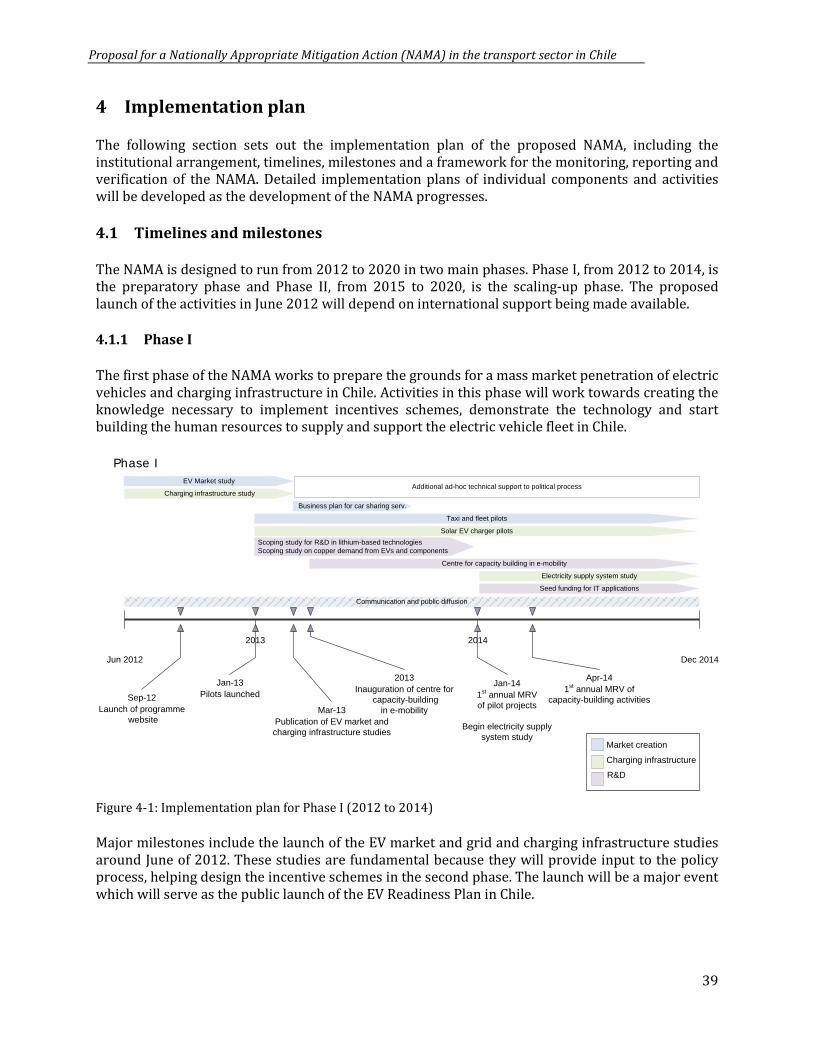
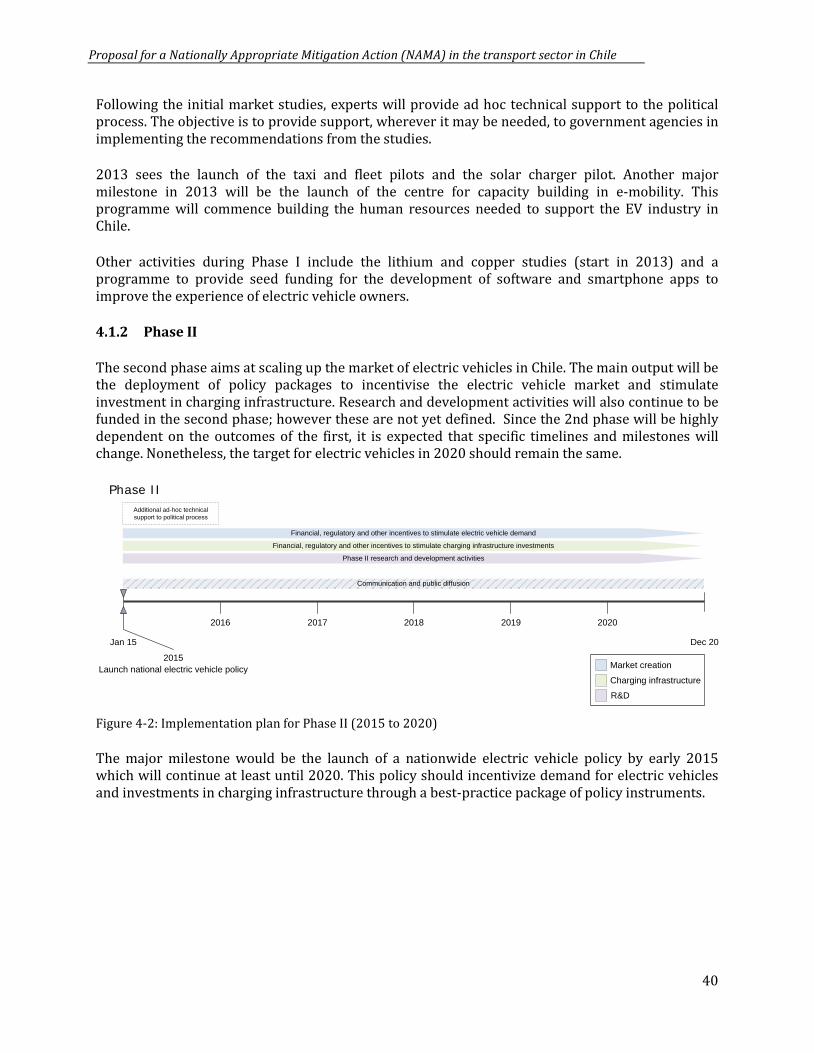
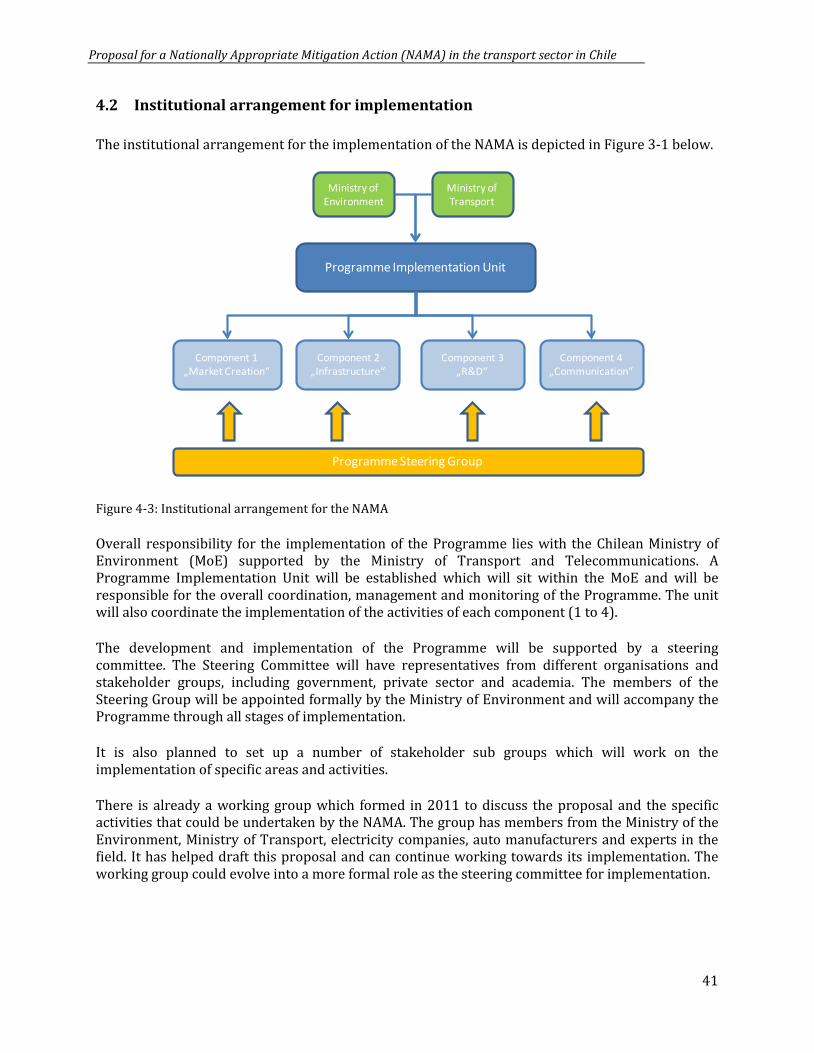
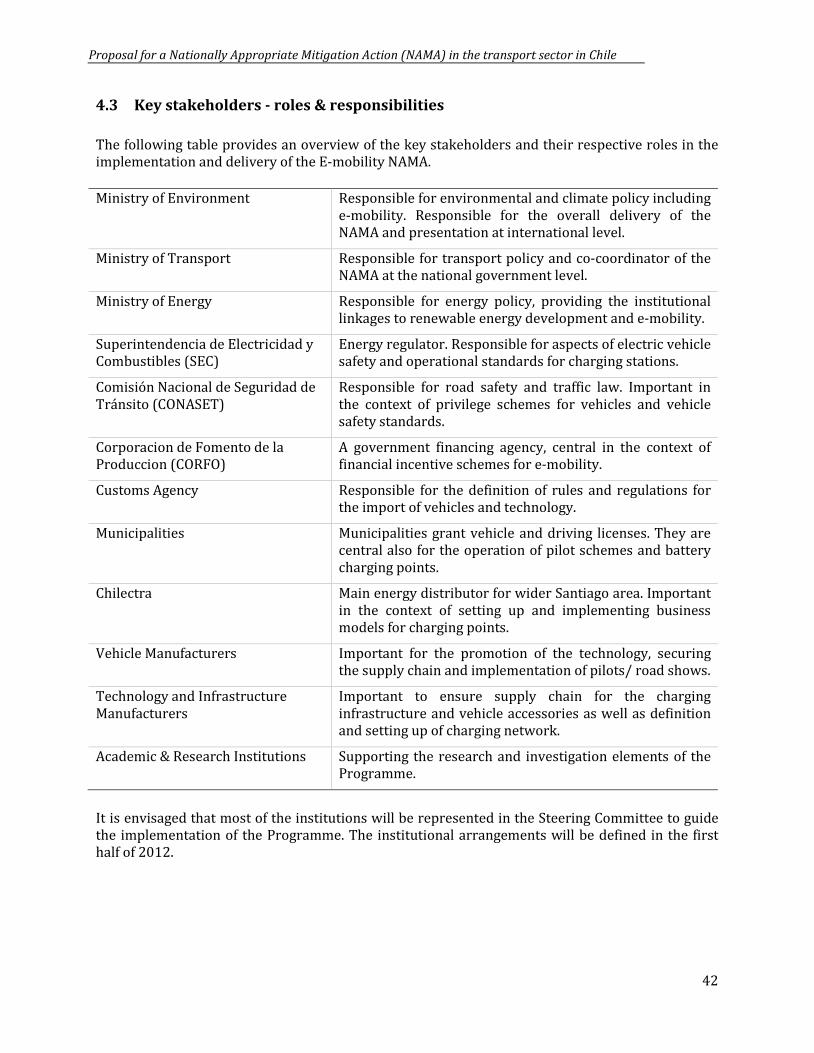
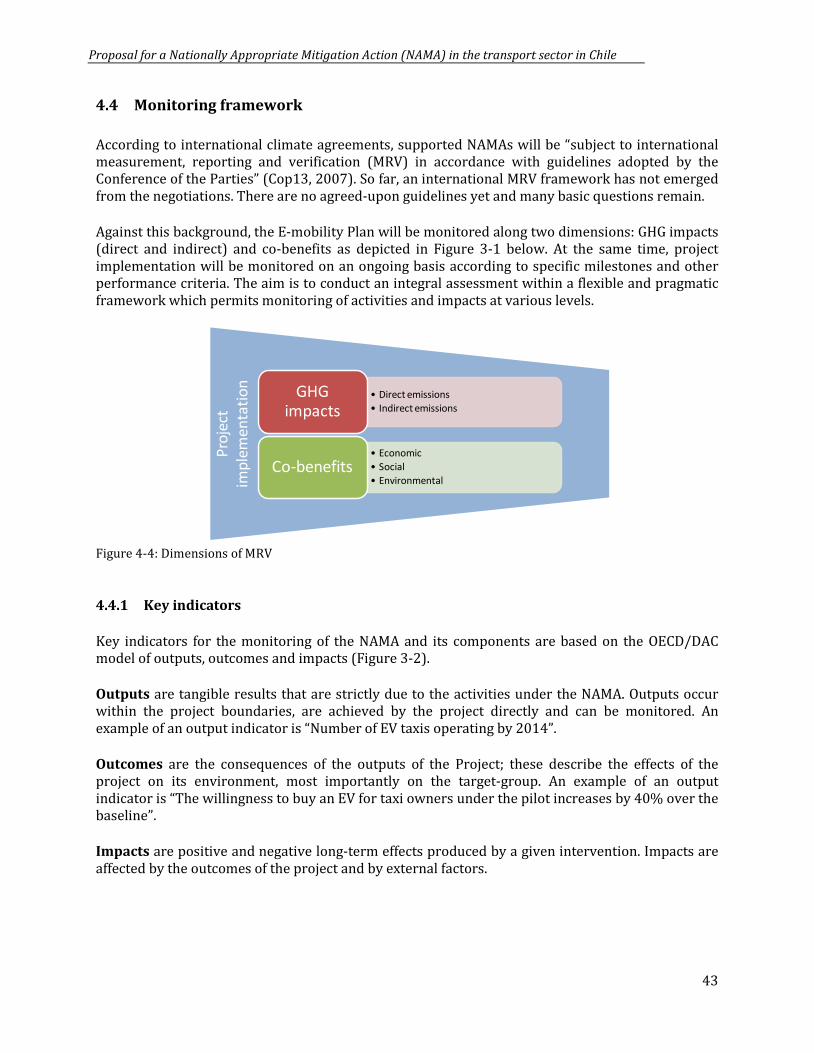
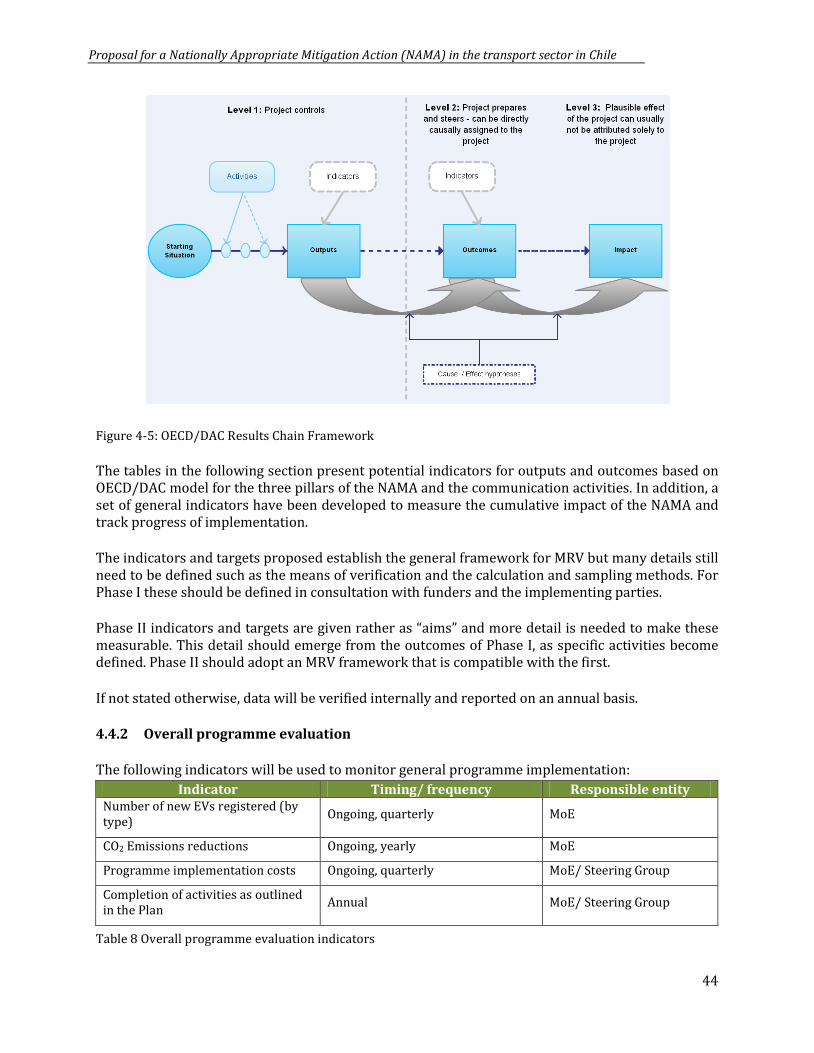
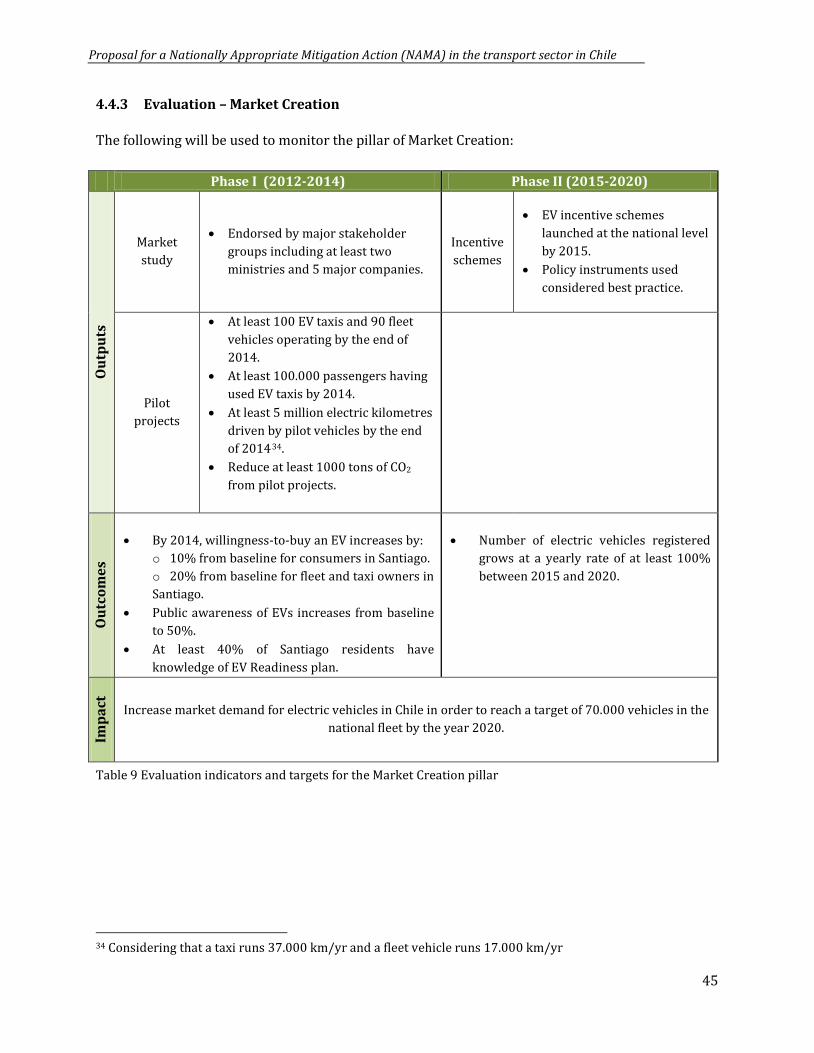
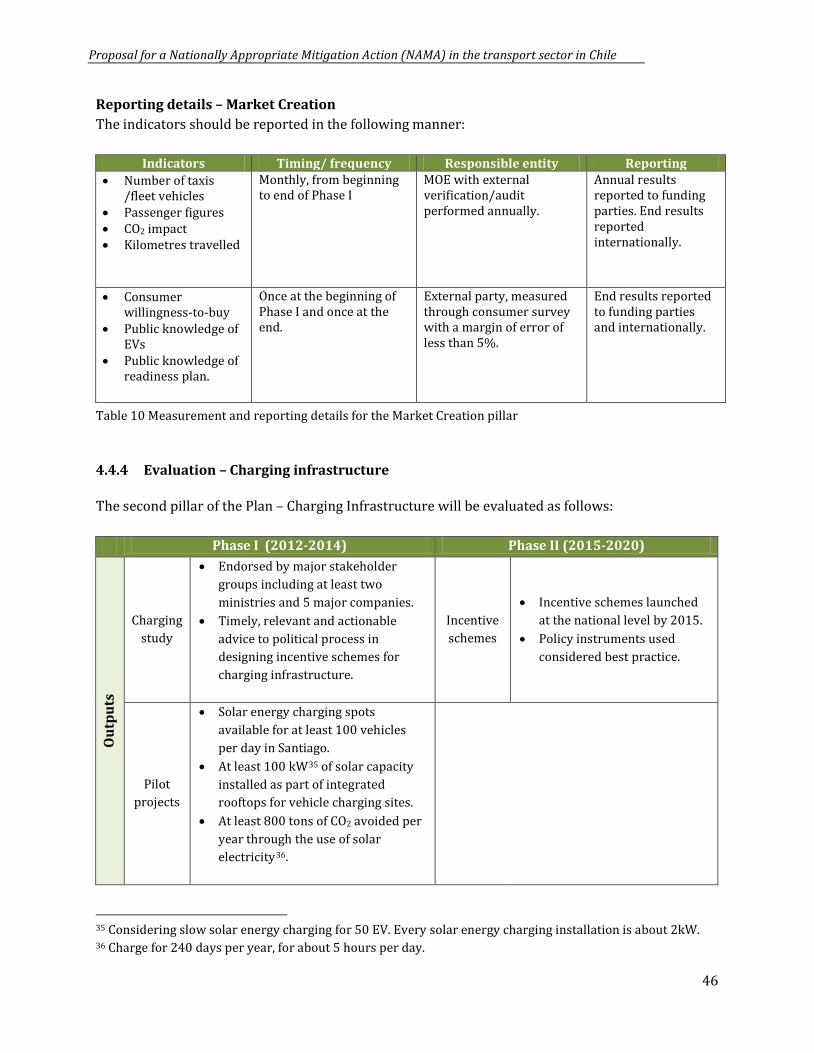
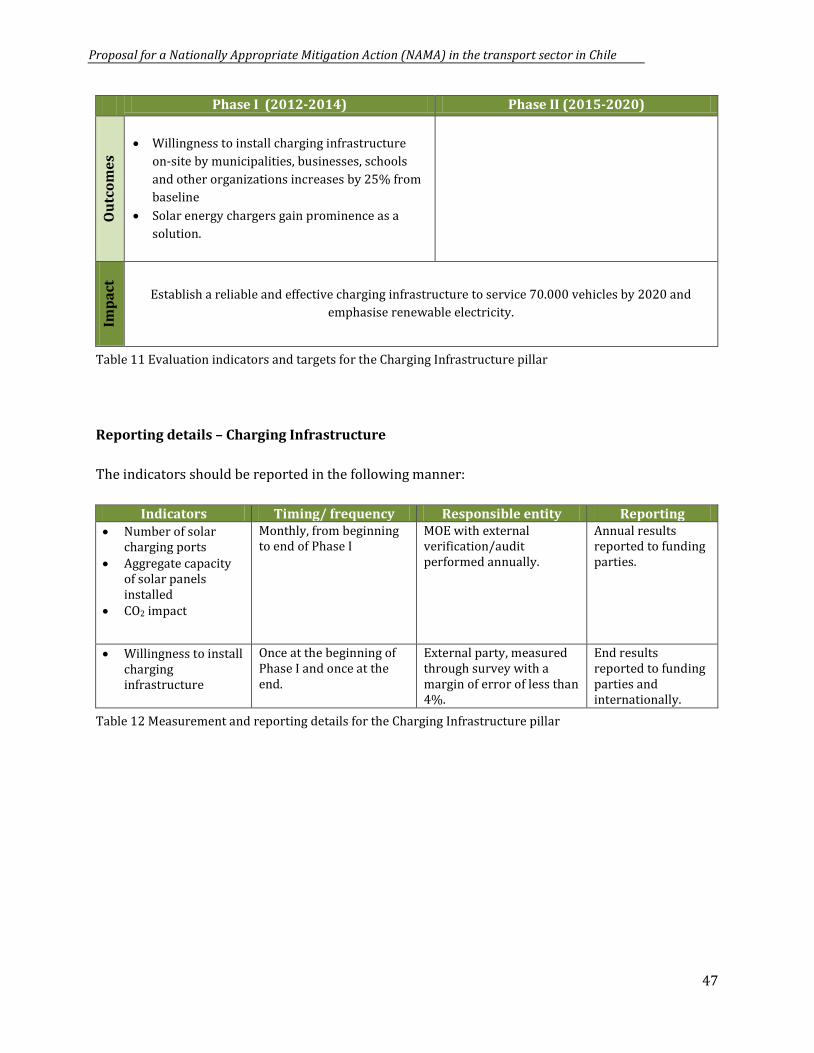
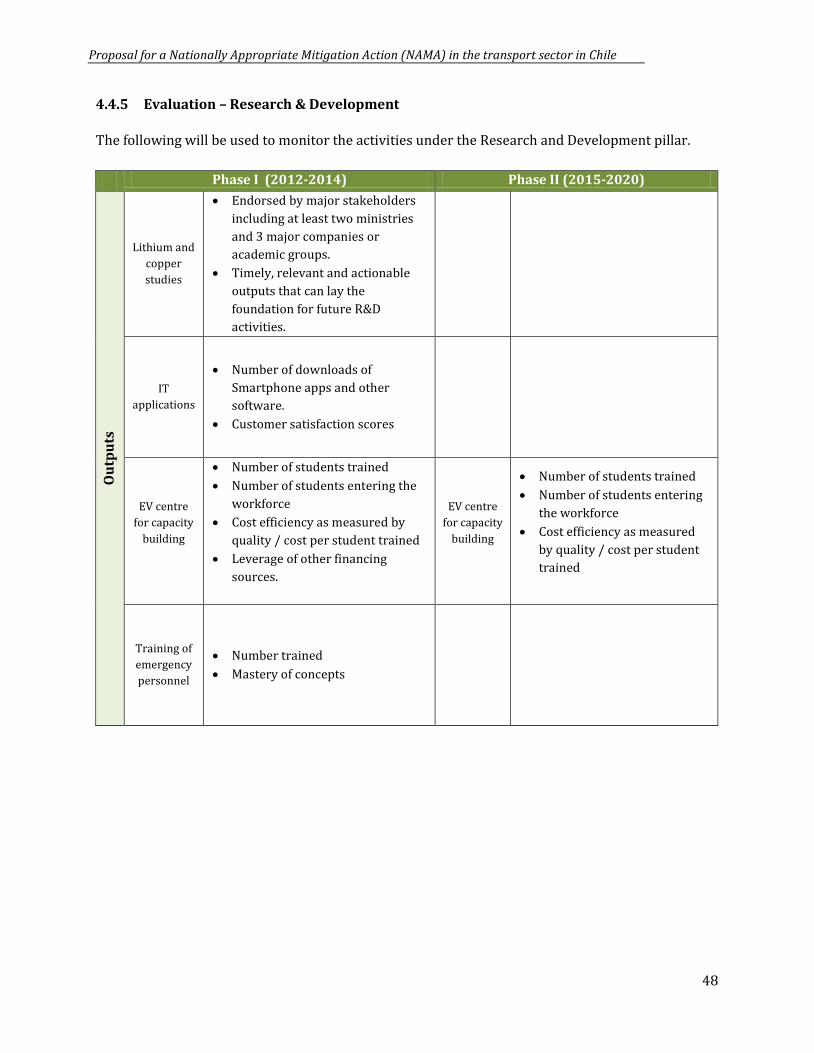
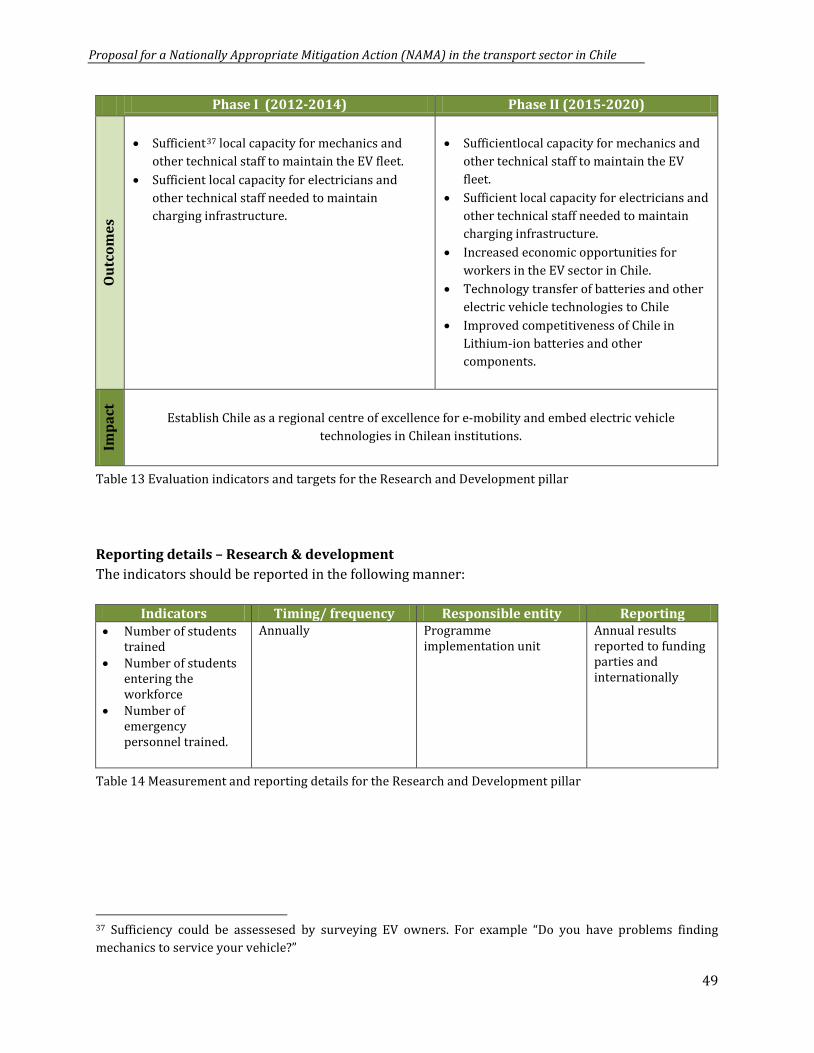
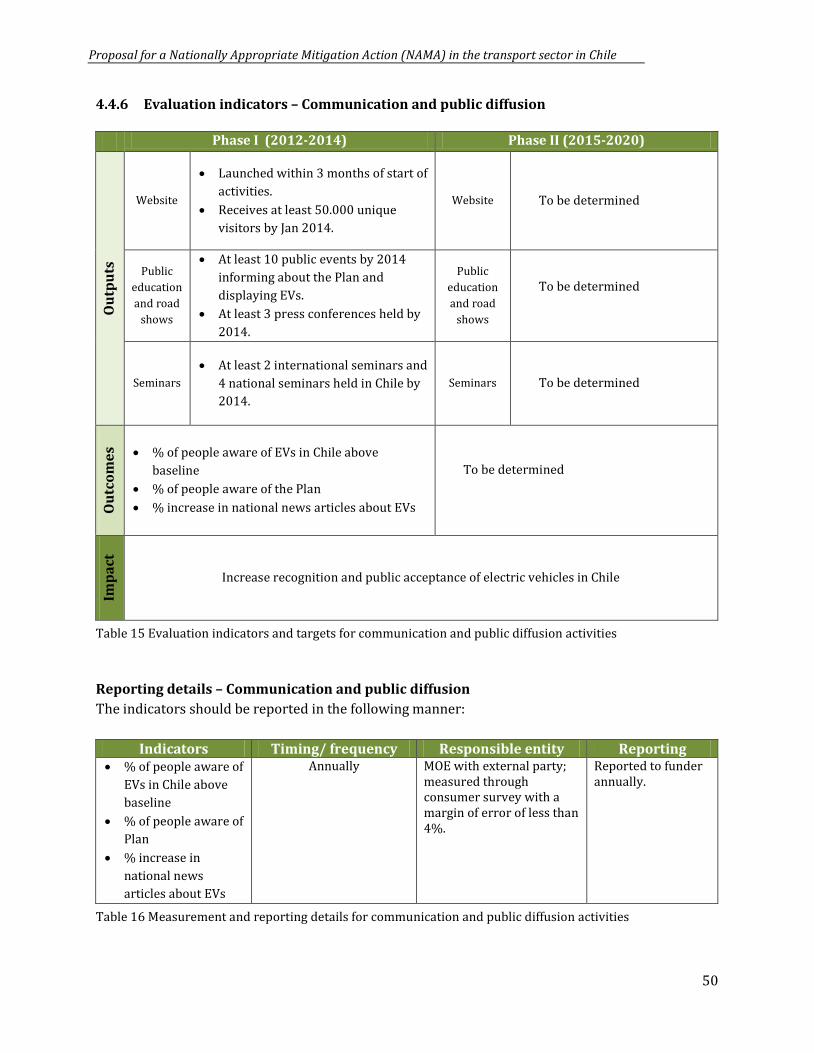
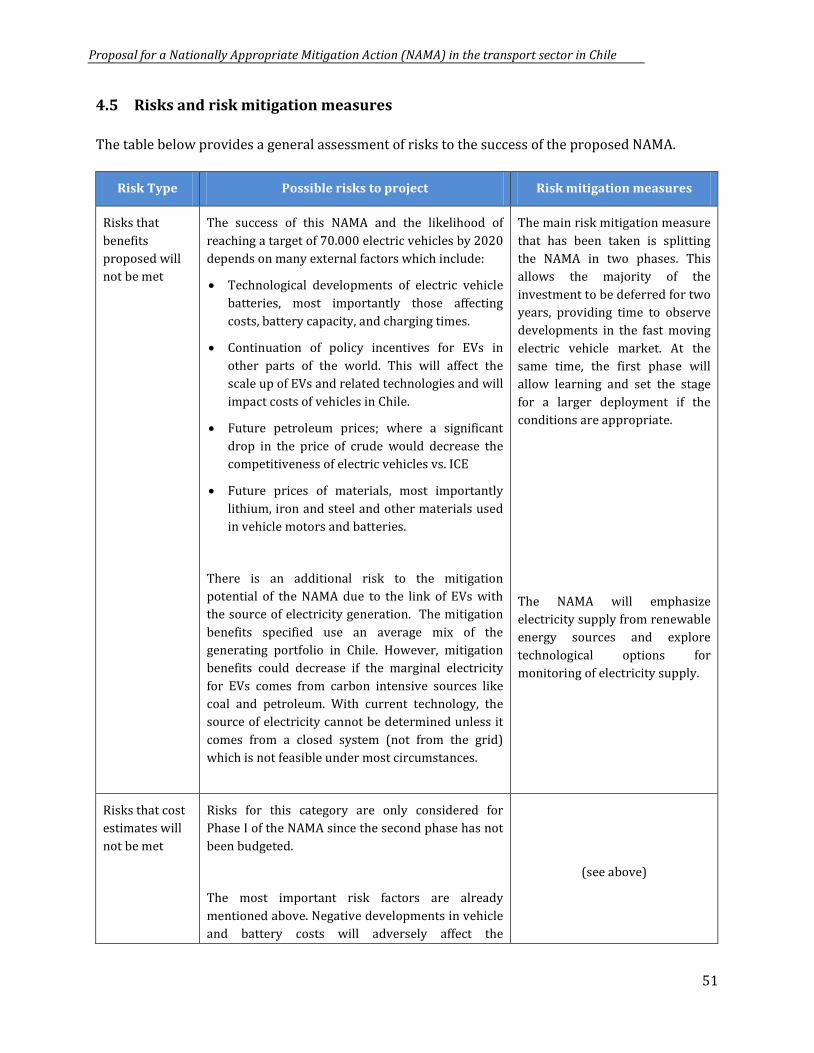
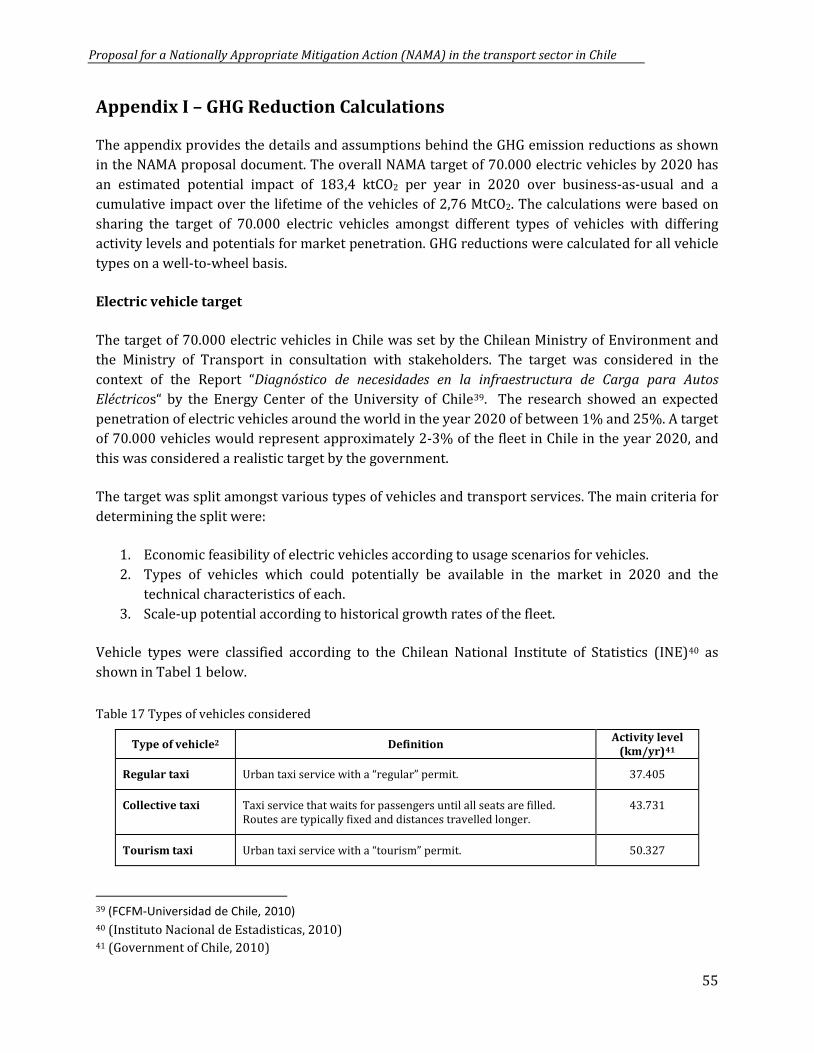
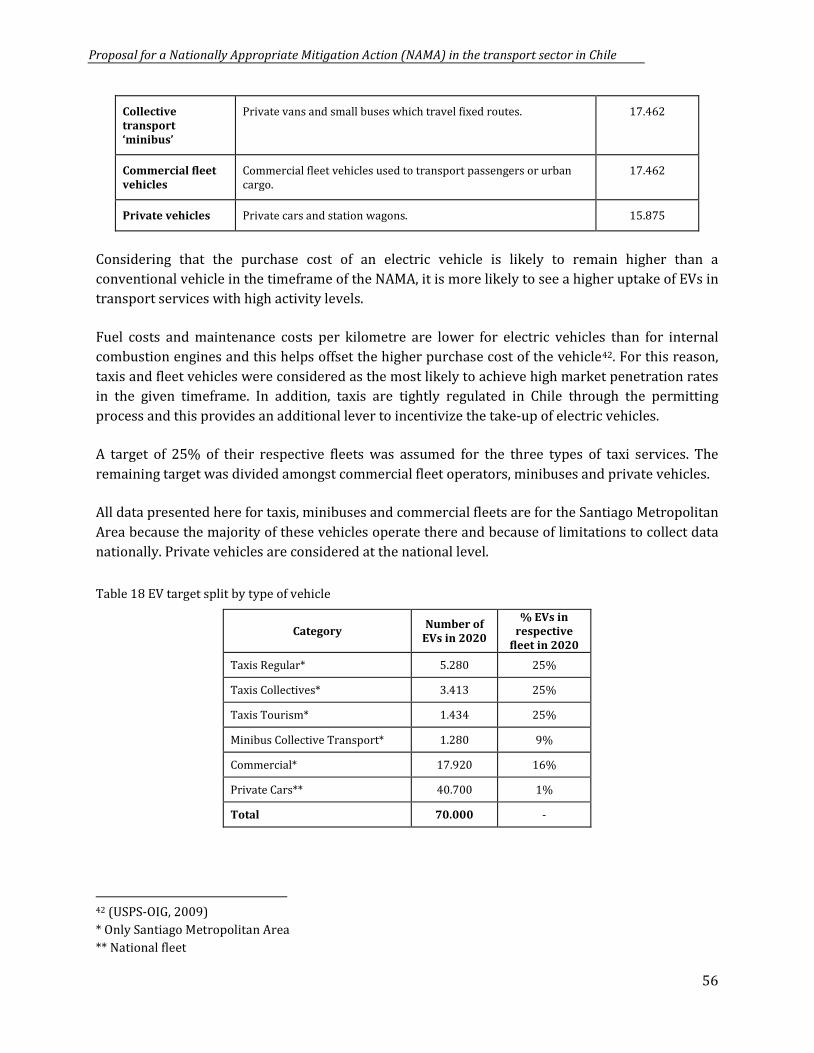
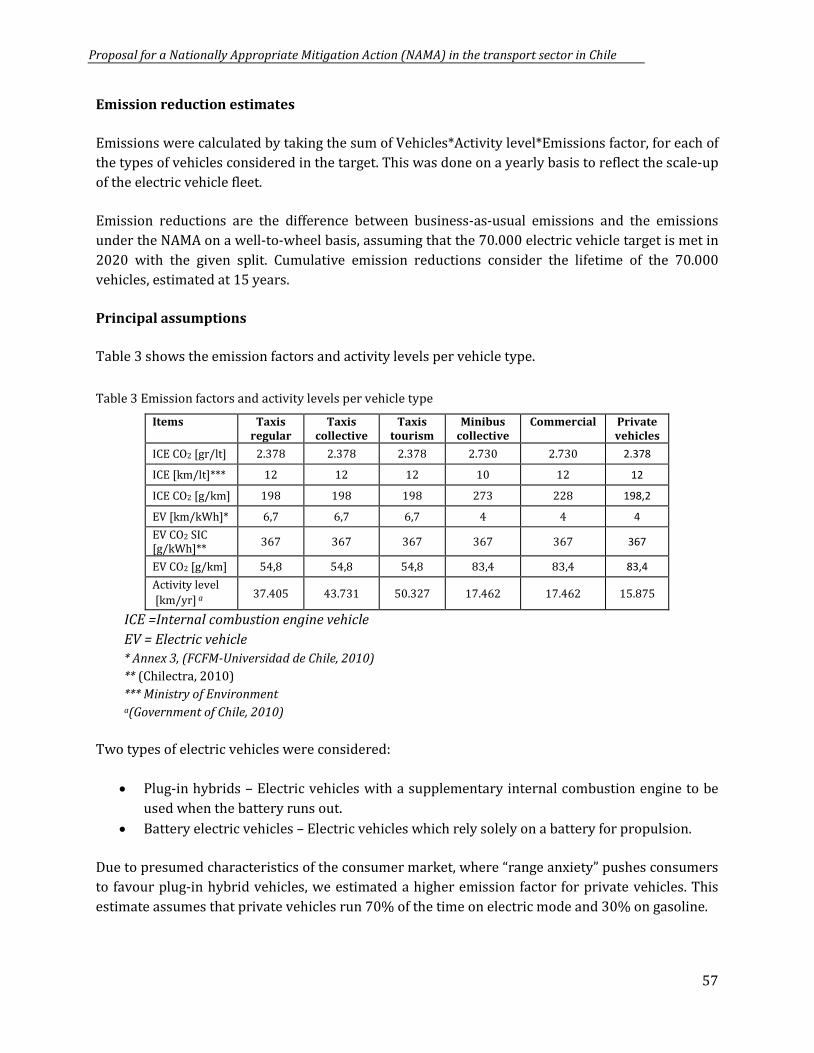
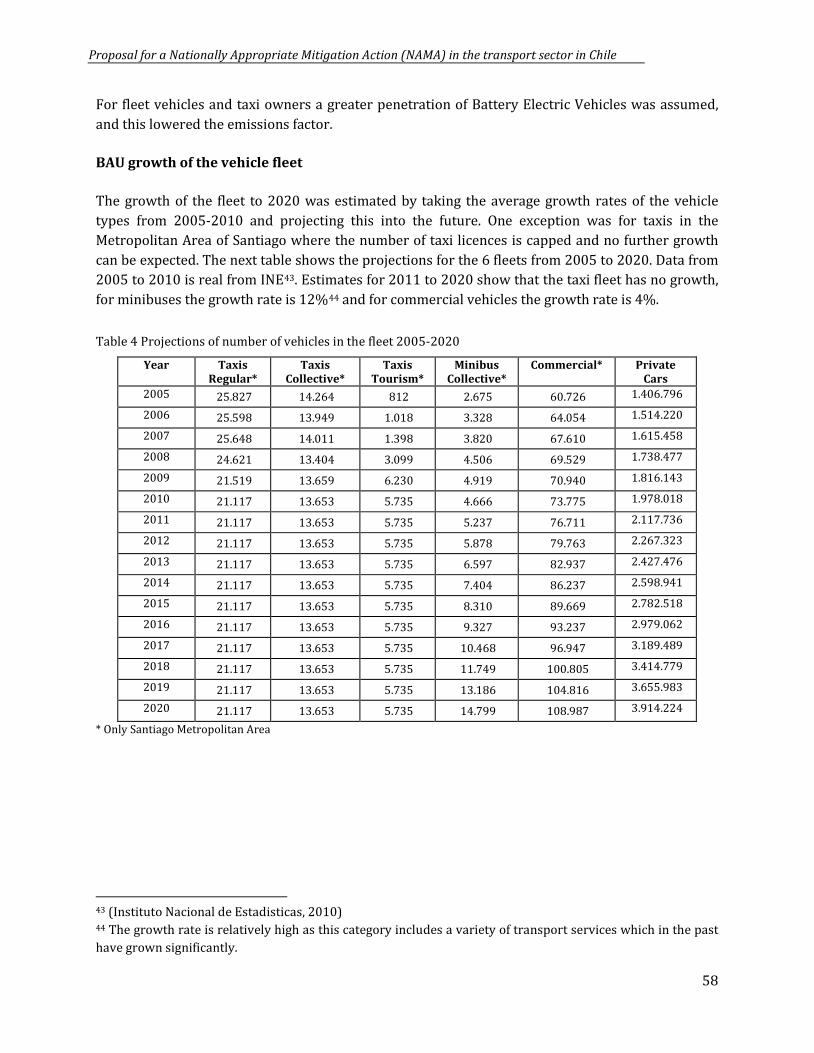
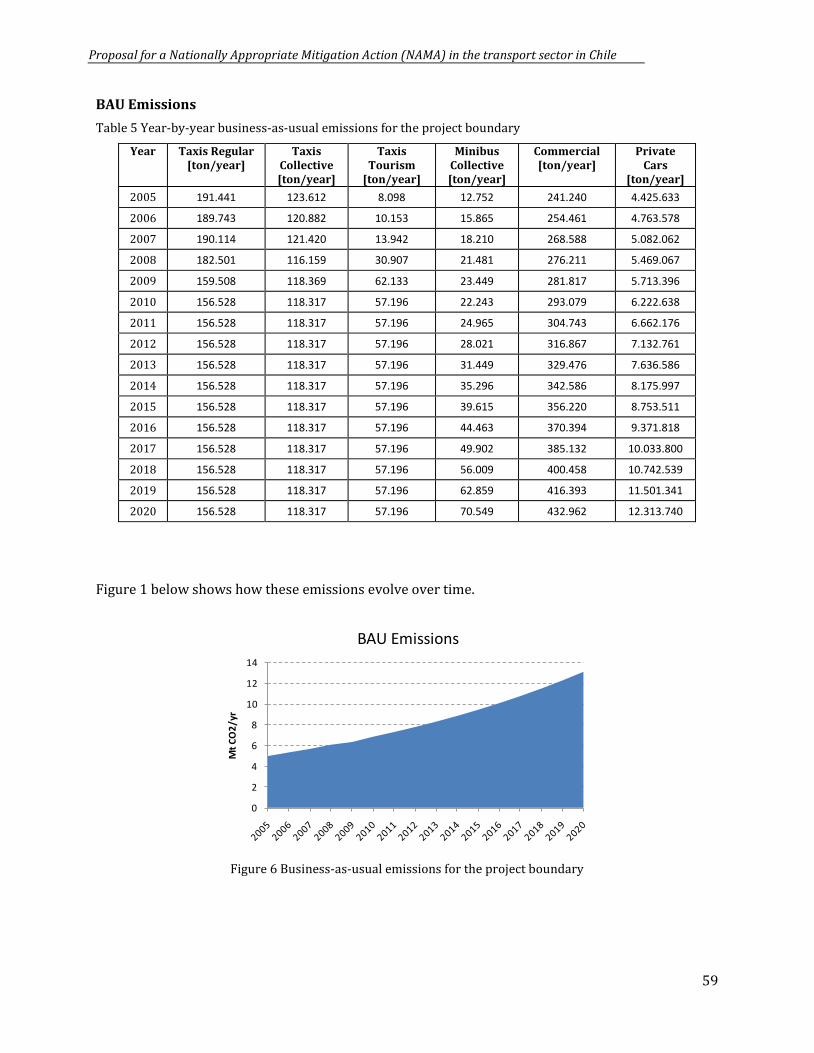
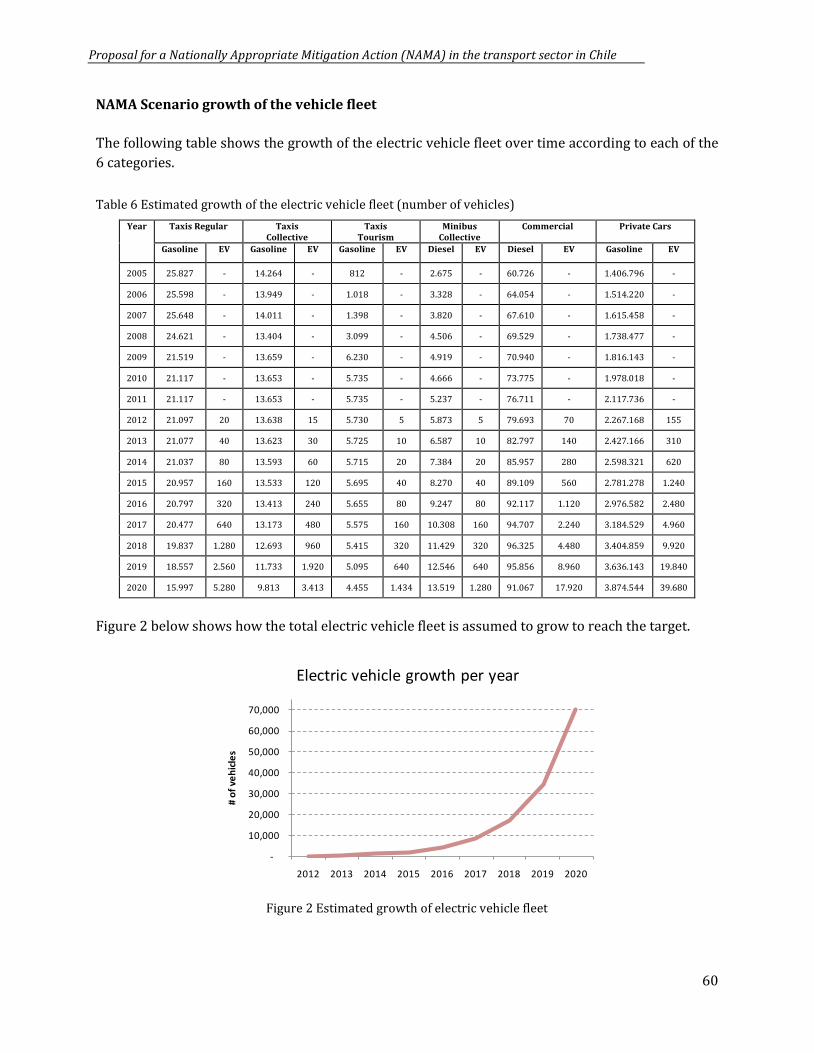
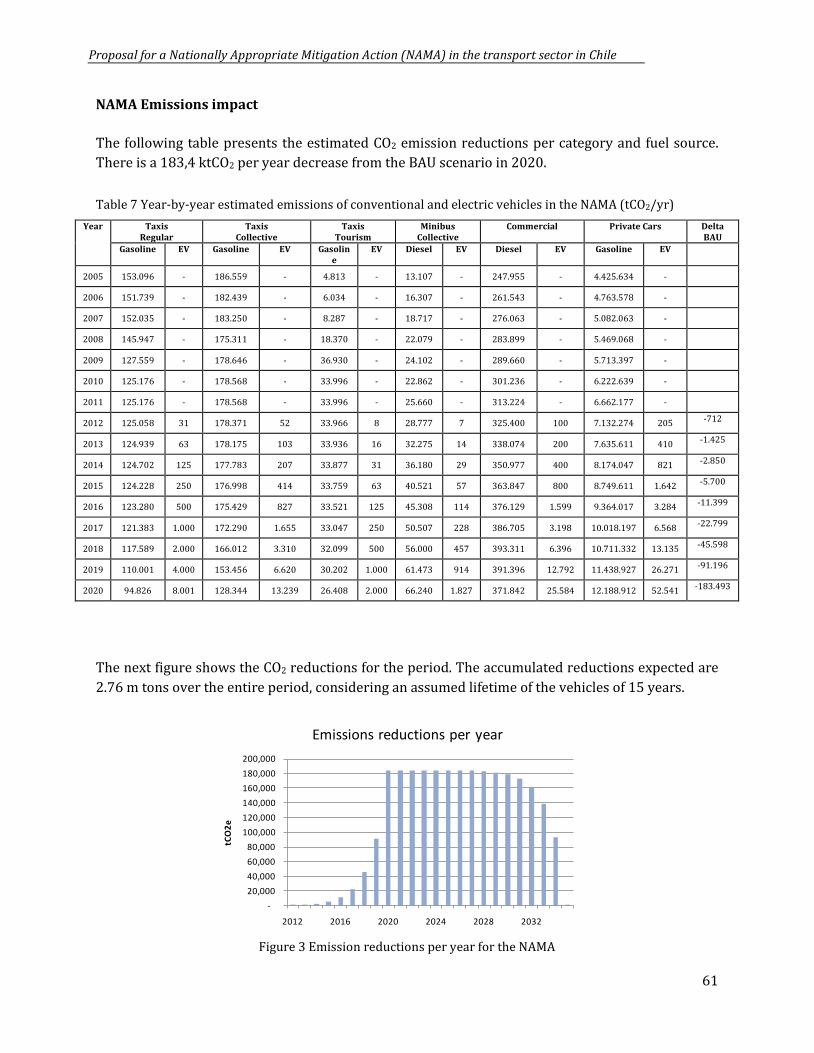


![Updated: July 2019152022 El Loa [Province: Chile] 152023 Tocopilla [Province: Chile] 152031 Copiapó [Province: Chile] 152032 Chañaral [Province: Chile] 152033 Huasco [Province: Chile]](https://static.documents.pub/doc/80x56/606b7161db19f317917da583/updated-july-2019-152022-el-loa-province-chile-152023-tocopilla-province-chile.jpg)


