CPD NR 3300 Conceptual Process Design Process Systems Engineering DelftChemTech - Faculty of Applied Sciences Delft University of Technology Appendices 1 Subject Propylene production by heat integrated dehydrogenation of propane with hydrogen oxidation (Hipphox) 2 Authors (Study nr.) Telephone M.S. de Graaff M.J. van de Graaf M.E.J. Pepels T.W. Smoor B.G. Visschedijk 9275430 9275080 9647199 9780217 9890649 015-2617388 015-2621562 015-2126799 015-2128848 06-48106208 Assignment issued : October 6 th 2004 Report issued : January 12 th 2004 Appraisal : January 30 th 2004
Transcript
CPD NR 3300 Conceptual Process Design
Process Systems Engineering
DelftChemTech - Faculty of Applied Sciences Delft University of Technology
Appendices
1 Subject
Propylene production by heat integrated dehydrogenation of propane with hydrogen oxidation (Hipphox)
2 Authors (Study nr.) Telephone
M.S. de Graaff M.J. van de Graaf M.E.J. Pepels T.W. Smoor B.G. Visschedijk
Assignment issued : October 6th 2004 Report issued : January 12th 2004
Appraisal : January 30th 2004
Appendices Appendix 1.1 UOP Oleflex process .............................................................................. 1 Appendix 2.1 Process options criteria .......................................................................... 4 Appendix 3.1 Final Block scheme of the Hipphox process ............................................. 7 Appendix 3.2 Overview pure components.................................................................... 8 Appendix 4.1 Thermodynamic figures [43,47] ........................................................... 10 Appendix 4.2 Calculation of equilibrium constants...................................................... 12 Appendix 4.3 T,x,y-Diagrams.................................................................................... 17 Appendix 4.4 Equilibrium composition calculations ..................................................... 20 Appendix 4.5 Matlab simulation model ...................................................................... 25 Appendix 5.1 Process Stream Summary (PSS) ........................................................... 35 Appendix 5.2 Heat exchanger design ........................................................................ 42 Appendix 5.3 Process Flow Sheet.............................................................................. 44 Appendix 5.4 Utility summary ................................................................................... 45 Appendix 5.5 Preliminary Block scheme of the Hipphox process.................................. 46 Appendix 7.1 Heat & Mass balance for streams total .................................................. 47 Appendix 8.1 Aspen simulation ................................................................................. 50 Appendix 8.2 Calculation of reactor dimensions ......................................................... 51 Appendix 8.3 Heat transfer calculation ...................................................................... 53 Appendix 8.4 Calculation of column pressure drop ..................................................... 55 Appendix 8.5 Equipment data sheets ........................................................................ 57 Appendix 10.1 Properties of components for F&EI ..................................................... 78 Appendix 10.2 F&EI Index of Monolith reactor........................................................... 79 Appendix 10.3 F&EI index of the riser regenerator..................................................... 80 Appendix 10.4 F&EI index of the depropanizer .......................................................... 81 Appendix 10.5 F&EI index of the de-ethanizer ........................................................... 82 Appendix 10.6 F&EI index of the P/P-splitter ............................................................. 83 Appendix 10.7 Loss control credit factors .................................................................. 84 Appendix 10.8 Hazard and Operability study.............................................................. 85 Appendix 11.1 Economic Calculations........................................................................ 89 Appendix 13.1 The selection of PIQUAR criteria and weighing factors ......................... 98
1
Appendix 1.1 UOP Oleflex process
The Oleflex process converts propane and butanes to their olefins. For this project the Oleflex process for the production of propylene is used as a reference process. This document describes the main aspects of the Oleflex process. The Oleflex process uses radial-flow moving-bed reactors in series with interstage heaters. The regeneration is done in CCR-unit (Continuous catalyst regeneration). A simple block scheme of the whole complex is shown below.
Figure A.1 Block scheme of the Oleflex process The Oleflex unit looks as follows (figure A.2) [49]
Propylene
Depro-panizer
Oleflex Selective Hydrogen Purification
De-etha-nizer P/P-
split-ter
H2 Net off gas(H2)
C2-
C4+
Propane feed
2
Figure A.2 Schematic representation of the Oleflex unit In this picture it can be seen that the Oleflex unit recycles hydrogen to dilute the feed stream. The ratio hydrogen : hydrocarbons is about 1-10, usually 3 [10]. The CCR unit is a continuously reaction system for the regeneration of the Pt catalyst. The main functions are to burn off the coke and redistribute the Platinum. A stream with low oxygen concentration is needed to burn off the coke. The Pt catalyst cannot resist high oxygen concentration, as it will form a lot of PtO2, which is not desirable. Chlorine is needed to transform the oxides of Pt and Sn into chlorides. Then hydrogen is needed to reduce the chlorides. For the CCR unit a nitrogen stream is needed to lift the Pt catalyst. This nitrogen stream will vary from 25-70 Nm3/hr [8]. The Oleflex process has several advantages over other dehydrogenation processes:
- High yields (25 mol% of propane is converted with a selectivity of 90 mol%) - Moderate capital costs - Low operating requirements - Totally continuous mode - Uniform catalyst activity at all times - No effluent composition oscillations - No reactor shutdown needed for regeneration - Reaction section and regeneration section are separated, so optimal conditions
for each section possible
3
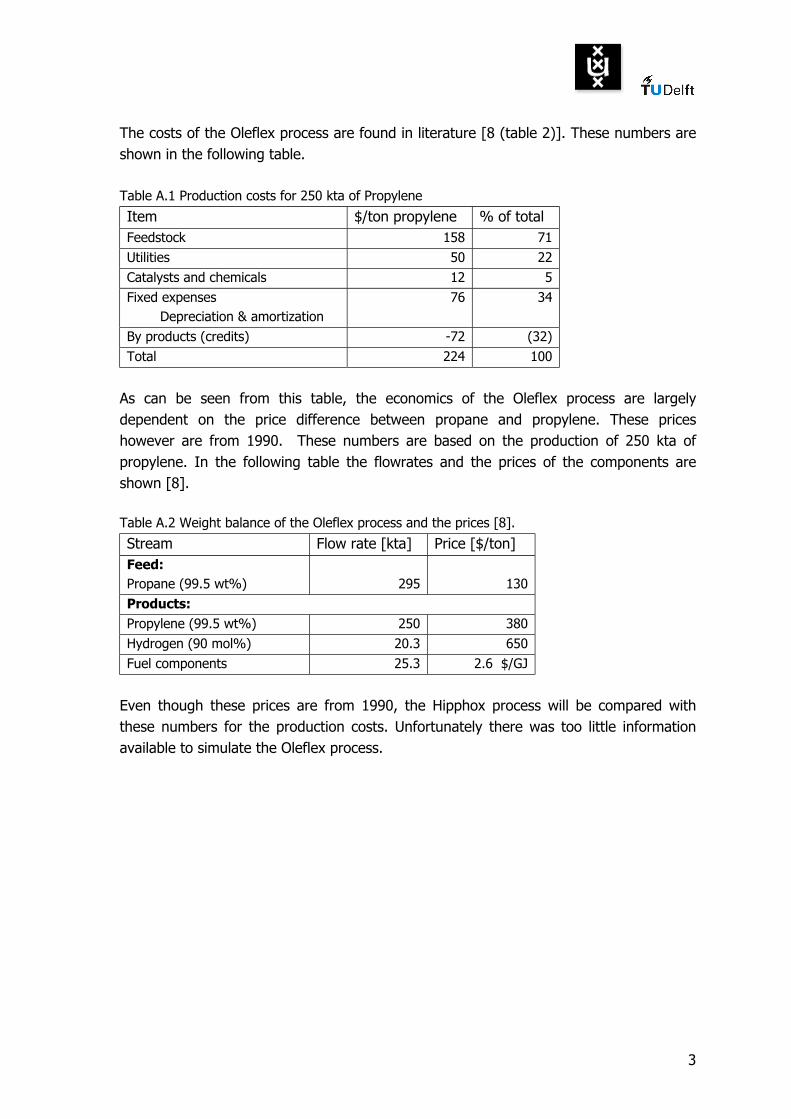
The costs of the Oleflex process are found in literature [8 (table 2)]. These numbers are shown in the following table. Table A.1 Production costs for 250 kta of Propylene
Item $/ton propylene % of total Feedstock 158 71 Utilities 50 22 Catalysts and chemicals 12 5 Fixed expenses Depreciation & amortization
76 34
By products (credits) -72 (32) Total 224 100
As can be seen from this table, the economics of the Oleflex process are largely dependent on the price difference between propane and propylene. These prices however are from 1990. These numbers are based on the production of 250 kta of propylene. In the following table the flowrates and the prices of the components are shown [8]. Table A.2 Weight balance of the Oleflex process and the prices [8].
Even though these prices are from 1990, the Hipphox process will be compared with these numbers for the production costs. Unfortunately there was too little information available to simulate the Oleflex process.
4
Appendix 2.1 Process options criteria
1. Energy integration regeneration with oxygen As during the regeneration of the SOC a lot of energy is released, it is very important that the heat integration is optimal. In option 2 and 3 DH and SHC are carried out in one reaction section. As in option 2 the regeneration is done in the same reactor, the heat can be delivered directly to DH. In option 3 the regeneration is done separately, but continuously and the heated catalyst and SOC flow will deliver the energy for DH. In option 1 and 4 the regeneration heat is less integrated with DH.
2. Conversion per reactor volume As in option 2 and 3 the DH and SHC take place in one reaction section, the conversion per reactor volume is higher, but there will be only a small difference, therefore the scores are 1 and 0.
3. Amount of equipment needed For option 2 and 3 less heat exchangers and reactors are required as the reaction and regeneration take place in one section.
4. Regeneration conditions optimal In option 2 the DH and SHC and regeneration are carried out in one section, it is very likely however that different conditions are optimal for the regeneration of the two. It is also very well possible that when the two are regenerated simultaneously, one of the two is regenerated before the other. In either way it will cost process time, therefore option 2 scores –2. In option 3 there is a possibility of regenerating the Pt catalyst and SOC in different units, therefore option 3 scores 0.
5. Dead time When regeneration is done continuously (option 3 and 4) there is no dead time caused by changing valves as in option 1 and 2.
6. Amount of N2 needed Since the regeneration of the second process takes place in one reactor, it has to be purged with nitrogen in order to prevent the combustion of hydrocarbons. In the other processes this is also the case, but to a lesser extent, since in option 1 only the SHC section needs to be purged, in option 3 the solids stream needs to be purged and in option 4 only the SOC stream.
7. Intrinsically safe It is clear that this is an important factor in our design, since we are working with hydrogen and oxygen. In option 3 and 4 there’s no contact possible between hydrogen and oxygen.
8. Proven technology (KRO factor) Option 2 en 3 have SHC and DH in 1 reaction section, this has not been commercialized yet.
9. Integration with existing plants
5
Various operation-blocks for DH already exist in industry today. Result of this is that more is known about it and it has already been proven to be a reliable technology. It should be possible with option 1 and 4 to integrate this design in an existing dehydrogenation plant, the SHC unit could be built next the already existing DH unit, for example an Oleflex plant. Option 2 and 3 have DH and SHC in one unit, this cannot be integrated in existing DH plants.
10. Coke formation on the SOC Due to the integrated DH and SHC there will also be coke-formation on the SOC, option 2 and 3 score –1.
11. CO formation by regeneration, which reduces SOC In the regeneration of the Pt catalyst, the coke is burnt off, and CO is formed. Due to the simultaneous regeneration of the Pt catalyst and the SOC in option 2, the CO formed will reduce the SOC.
12. Comply with (future) environmental legislation At this point all options are considered to comply with environmental legislation in the same manner, no conclusions can be drawn.
13. Safety for operators in plant and surrounding Not much can be concluded on the safety-aspect, it is clear that this is an important factor in our design, since we are working with hydrogen and oxygen. For now all process are considered equally (un-)safe for operators and surrounding.
14. Controllability of the temperature In process 3 and 4 the process is continuous, the possibility of hot-spots occurring and a bad controllable temperature inside the reaction section is therefore less likely since a continuous process is more easily controlled.
15. Controllability of the mass flows Process 1 and 4 have the advantage that between the reaction steps it is possible to adjust the streams or to take certain components out, the mass flows are easier to control than when DH and SHC are integrated.
16. Optimal conditions for DH and SHC possible In option 1 and 4 DH and SHC are carried out in different sections, therefore the conditions per unit can be optimised better. A drawback of the second and third process is that the reactions have to take place in similar conditions. This could influence the performance of one or both reactions negatively.
17. Scale-up easy Separate sections are easier to scale up than integrated sections.
18. Control system / exchangeable streams Because the regeneration of the SOC will happen in the same reactor as the SHC (and DH in option 2), there has to be a switch between the hydrocarbon stream, the nitrogen stream (to purge) and the oxygen stream. In option 3 and 4 this is not the case. So in option 1 and 2 an extra control system to switch streams is necessary.
19. Separation solid – gas necessary between reaction and regeneration section
6
An advantage of regeneration separated from the SHC in time is that the solid catalyst does not have to be separated from the gas in the reactor. Only a switch in streams is necessary. Continuous regeneration requires an extra separation step.
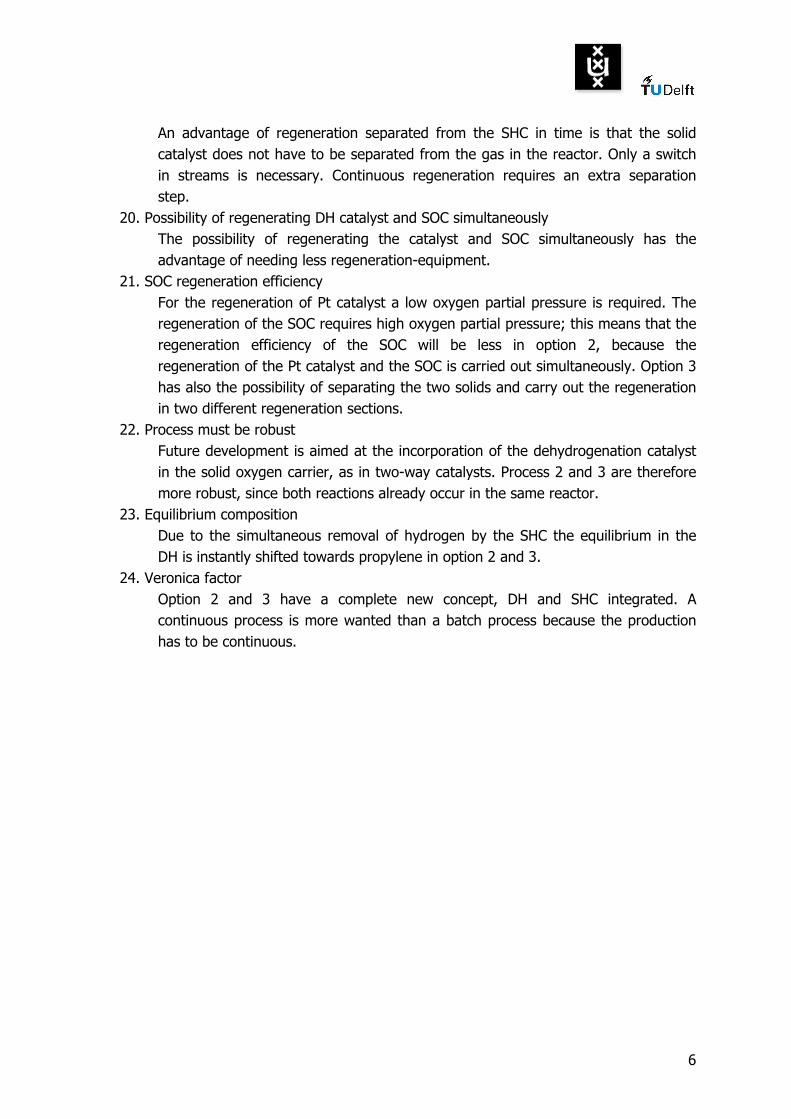
20. Possibility of regenerating DH catalyst and SOC simultaneously The possibility of regenerating the catalyst and SOC simultaneously has the advantage of needing less regeneration-equipment.
21. SOC regeneration efficiency For the regeneration of Pt catalyst a low oxygen partial pressure is required. The regeneration of the SOC requires high oxygen partial pressure; this means that the regeneration efficiency of the SOC will be less in option 2, because the regeneration of the Pt catalyst and the SOC is carried out simultaneously. Option 3 has also the possibility of separating the two solids and carry out the regeneration in two different regeneration sections.
22. Process must be robust Future development is aimed at the incorporation of the dehydrogenation catalyst in the solid oxygen carrier, as in two-way catalysts. Process 2 and 3 are therefore more robust, since both reactions already occur in the same reactor.
23. Equilibrium composition Due to the simultaneous removal of hydrogen by the SHC the equilibrium in the DH is instantly shifted towards propylene in option 2 and 3.
24. Veronica factor Option 2 and 3 have a complete new concept, DH and SHC integrated. A continuous process is more wanted than a batch process because the production has to be continuous.
7
Appendix 3.1 Final Block scheme of the Hipphox process
* The numbers of the flows are based on the first mass balances calculation described in chapter 5. These numbers are therefore not the optimized numbers. The numbers between the brackets are the ton of component per ton of product.
H2O (l) 95 kta (0.38) 30°C, 15 bara
2
3
4
8 Separation section 22°C 16 bara
Reaction section 600 °C 2 bara
Separation section 30 – 75 °C 12 – 25 bara
Regeneration section 600-700 °C 1-2 bara
LPG [v] 280 kta (1.12) 15 °C 17 bara
Propylene-product (v) 250 kta 15°C, 9 bara
C4+ (l)
11 kta (0.04) 15°C, 16 bara
Air (g) 390 kta (1.56) 15 °C, 1 bara
Propane + C2 [v] 461 kta (1.84) 379 °C, 2 bara
exhaust air (g) 305 kta (1.22) 40 °C,1 bara
Total IN: 670 kta (2.68) Total OUT: 670 kta (2.68)
547 kta (2.19) 596 °C 2 bara
1
9
10
11 12
7 Propane (l) 192 kta (0.77) 31°C, 17 bara
6 5 SOC recycle (s) 62668 kta (251)
596 °C
Light ends (v) 9 kta (0.04) 15°C, 24 bara
SOC recycle (s) 62754 kta (251)
676 °C
8
App
endi
x 3.
2 O
verv
iew
pur
e co
mpo
nent
s
PU
RE
CO
MPO
NEN
T PR
OPE
RTI
ES (1
of 2
)
C
ompo
nent
Nam
e
Te
chno
logi
cal D
ata
Des
ign
Syst
emat
ic
Form
ula
Mol
. Ph
ase
Boili
ng
Mel
ting
Cr
itica
l Cr
itica
l W
ater
Fl
ash
Solid
Li
quid
Va
pour
Enth
alpy
G
ibbs
ene
rgy
Entr
opy
Cp
W
eigh
t
Poin
t
Poin
t
Tem
pera
ture
Pr
essu
re
solu
bilit
y Po
int
D
ensi
ty D
ensi
ty D
ensi
ty
of f
orm
atio
n fo
rmat
ion
[1
] [1
] [1
3]
[7
] [1
] [3
] [2
] [3
] [3
][10]
[3
][10]
[3
][10]
[3
][10]
g/m
ol
o C
o C
o C
ba
r g
/ Li
ter
wat
er
o C
g/cm
3 k
g/m
3 k
g/m
3 kJ
/mol
kJ
/mol
J/
mol
*K J
/mol
*K
Carb
onm
onox
ide
Carb
onm
onoo
xide
CO
28
.010
V
-191
.50
-205
.02
-138
.7
34.6
-
-
- 1.
145
-110
.50
-137
.20
197.
7 29
.1
Met
hane
M
etha
ne
CH4
16.0
43
V -1
61.4
8 -1
82.4
7 -8
2.1
45.8
s
-386
.6
- -
0.42
3 -7
4.60
-5
0.50
18
6.3
35.7
Et
hyle
ne
Ethy
lene
C 2
H4
28.0
53
V -1
03.7
7 -1
69.1
5 9.
7 50
.5
i
- -
0.56
8 52
.40
68.4
0 21
9.3
42.9
Et
hane
Et
hane
C 2
H6
30.0
69
V -8
8.60
-1
82.7
9 32
.1
48.8
-
-130
.0
- -
0.54
5 -8
4.00
-3
2.00
22
9.2
52.5
Et
hyn
Acet
ylee
n C 2
H2
26.0
00
V -8
4.76
-8
1.50
36
.0
62.0
10
0cc18
[12]
- -
1.17
1 22
7.40
20
9.9
200.
9 44
.0
Carb
ondi
oxid
e Ca
rbon
diox
ide
CO2
44.0
10
V -7
8.40
-5
5.56
31
.1
73.0
s
-
- 1.
799
-393
.50
-394
.40
213.
8 37
.1
Prop
ylen
e Pr
opyl
ene
C 3H
6 42
.081
V
-47.
60
-185
.20
92.3
45
.0
vs
-108
.0
- -
0.50
5 20
.00
62.4
6 [1
4]
Prop
ane
Prop
ane
C 3H
8 44
.090
V
-42.
20
-187
.60
96.8
42
.0
s -1
04.0
-
- 0.
439
-103
.80
-23.
40
270.
3 73
.6
Alle
ne
Prop
adie
ne
C 3H
4 40
.064
V
-34.
40
-136
.20
120.
9 52
.5
sl
-
- 0.
584
190.
50
202.
38 [
14]
prop
yne
met
hyla
cety
leen
C 3
H4
40.0
64
V -2
3.20
-1
02.7
0 12
8.0
52.8
sl
-
- -
0.60
7 18
4.90
-
- -
buta
ne
buta
ne
C 4H
10
58.1
40
V -1
1.70
-1
35.0
0 13
4.0
37.0
i
-60.
0 -
- 2.
010
-125
.70
- -
- is
obut
ylen
e 1-
prop
ene-
2-m
ethy
l C 4
H8
56.1
10
V -6
.90
-140
.40
144.
8 40
.0
i -
- -
0.58
9 -1
6.90
-
- -
1-bu
teen
1-
bute
en
C 4H
8 56
.110
V
-6.2
0 -1
85.3
0 14
6.4
40.2
i
-80.
0 -
- 0.
588
0.10
-
- -
1,3-
buta
diee
n 1,
3-bu
tadi
een
C 4H
6 54
.091
V
-4.4
1 -1
08.9
1 16
1.8
42.6
i
-76.
1 -
- 0.
615
110.
00
- 19
9.0
- is
obut
ane
2-m
ethy
lpro
pane
C 4
H10
58
.140
V
-0.5
0 -1
45.0
0 -
- i
- -
- 2.
046
-134
.20
- -
- H
ydro
gen
Hyd
roge
n H
2 2.
016
V -2
52.8
7 -2
59.3
4 -2
40.0
12
.8
sl
-
- 0.
082
0.00
130.
7 28
.8
Nitr
ogen
N
itrog
en
N2
28.0
13
V -1
95.7
9 -2
10.0
0 -1
47.2
33
.5
sl
-
- 1.
145
0.00
191.
6 29
.1
Oxy
gen
Oxy
gen
O2
31.9
99
V -1
82.9
5 -2
18.7
9 -1
18.9
49
.7
-
- -
1.30
8 0.
00
20
5.2
29.4
W
ater
W
ater
H
2O
18.0
15
L 10
0.00
0.
00
374.
2 21
8.0
-
- 0.
997
- -2
41.8
0 -2
28.6
0 18
8.8
33.6
Ce
rium
Ce
rium
Ce
14
0.11
6 S
3443
.00
798.
00
- -
s, d
il ac
id
6.
77
- -
0 -
72.0
26
.9
Ceriu
mox
ide
Ceriu
m(I
V)ox
ide
CeO
2 17
2.11
5 S
- 24
00.0
0 -
- i,
dil a
cid
7.
65
- -
-108
8.70
-1
024.
6 62
.3
61.6
Ce
rium
oxid
e Ce
rium
(III
)oxi
de
Ce2O
3 32
8.23
0 S
3730
.00
2210
.00
- -
i, s
acid
6.20
-
- -1
796.
20
-170
6.2
150.
6 11
4.6
Plat
inum
Pl
atin
um
Pt
195.
200
S 43
00.0
0 17
55.0
0 -
- i
21
.4
- -
0.00
-
41.6
25
.9
Tung
sten
Tu
ngst
en
W
183.
840
S 55
55.0
0 34
22.0
0 -
- -
19
.30
- -
0.00
-
32.6
24
.3
Alum
ina
Alum
iniu
m o
xide
Al
2O3
SO
C C 0
.9W
0.1O
2 C 0
.9W
0.1O
2 17
6.50
0 S
- >
700
[11]
-
- -
- 6.
689
- -
- -
- -
Not
es:
[1]
A
t 10
1.3
kPa
[2]
D
ensi
ty a
t 25
oC,
unl
ess
spec
ified
oth
erw
ise
[3]
A
t 25
oC
[4
] O
ral i
nges
tion
in (
g) f
or a
mal
e of
70k
g w
eigh
t
[5
] D
ensi
ty a
t -4
7 oC
from
H2O
at
4 oC
[6]
D
ensi
ty a
t -4
5 oC
from
H2O
at
4 oC
[7]
s
= S
olub
le in
wat
er, s
l = S
light
ly s
olub
le, a
cid
= a
cid
solu
tions
, dil
= d
ilute
, I =
inso
lubl
e, v
s =
ver
y so
lubl
e
[8
] D
ensi
ty a
t -8
9 de
gree
s ce
ntig
rade
[9]
Tem
pera
ture
ran
ge -
10 -
-10
4
[10]
gas
[11]
SO
C do
es n
ot m
elt
at r
eact
ion
tem
pera
ture
, cau
sing
no
sint
erin
g an
d de
activ
atio
n
[12]
100
cc
of g
as s
olub
le in
100
g w
ater
at
18 d
egre
es C
elsi
us
Proj
ect
ID N
umbe
r:
CPD
3300
Com
plet
ion
Dat
e:
J
anua
ri20
04
9
[1
3] P
erry
's C
hem
ical
Eng
inee
rs' H
andb
ook,
6th
edi
tion,
Rob
ert
H. P
erry
and
Don
Gre
en, M
cGra
w H
ill
[1
4] Y
aws,
Che
mic
al P
rope
rtie
s H
andb
ook,
199
9
[1
5] S
ax's
Dan
gere
ous
Prop
ertie
s of
Ind
ustr
ial m
ater
ials
, 8th
edi
tion,
RJ
Lew
is S
r, V
NR N
ew Y
ork,
Vol
3
PU
RE
CO
MPO
NEN
T PR
OPE
RTI
ES (2
of 2
)
Com
pone
nt N
ame
H
ealth
&Sa
fety
dat
a
D
esig
n Sy
stem
atic
Au
to-ig
nitio
n Fl
amm
able
L
ower
U
pper
LC
50 [1
5]
MAC
M
AC
LD50
[15
]
Tem
p.
Lim
its
Expl
osio
n Ex
plos
ion
In a
ir/
Valu
e TG
G
Ora
l N
otes
[1
] %
by
vol
Lim
it (L
EL )
Li
mit
(UEL
)
wat
er
15
min
. [4
]
o C
in a
ir %
%
M
g/m
3 M
g/m
3 M
g/m
3 g
Ca
rbon
mon
oxid
e Ca
rbon
mon
ooxi
de
609.
0 12
.5-7
4 12
.5
74.2
18
07 p
pm/4
h 29
17
4 13
34 p
pm
M
etha
ne
Met
hane
65
0.0
5.3-
15
5.3
15.0
n.
a.
n.a.
Ethy
lene
Et
hyle
ne
450.
0 2.
7-36
2.
7 36
.0
95%
33
0 10
29
9
Etha
ne
Etha
ne
472.
0 3.
0-12
.5
3.0
12.5
n.
a.
n.a.
119
mg/
kg
8 Pr
opyn
e Ac
etyl
een
305.
0 2.
5-82
2.
5 82
.0
n.a.
17
00
Ca
rbon
diox
ide
Carb
ondi
oxid
e -
- -
- n.
a.
9000
7
Prop
ylen
e Pr
opyl
ene
455.
0 2.
0-11
.1
2.0
11.1
n.
a.
900
n.
a.
[2],
[5],
[7]
Prop
ane
Prop
ane
450.
0 2.
1-9.
5 2.
1 9.
5 n.
a.
1800
n.a.
[2
],[6
],[7
] Al
lene
Pr
opad
iene
2.1-
12.5
2.
1 12
.5
n.a.
n.
a.
n.
a.
7 pr
opyn
e m
ethy
lace
tyle
en
- -
1.7
- n.
a.
1650
buta
ne
buta
ne
462.
2 1.
9-8.
5 1.
9 8.
5 65
8 g/
cm3 /
4h
-
isob
utyl
ene
1-pr
open
e-2-
met
hyl
465.
0 1.
8-9.
6 1.
8 9.
6 62
0 g/
cm3 /
4h
-
1-bu
teen
1-
bute
en
383.
9 1.
6-9.
3 1.
6 9.
3 -
-
1,3-
buta
diee
n 1,
3-bu
tadi
een
420.
0 2.
0-11
.5
2.0
11.5
28
5 g/
m3 /
4h
-
5480
mg/
kg
is
obut
ane
2-m
ethy
lpro
pane
40
5.0
1.9-
8.5
1.9
8.5
n.a.
24
00
H
ydro
gen
Hyd
roge
n
4.0-
74.0
4.
0 74
.0
n.a.
n.
a.
7 N
itrog
en
Nitr
ogen
-
- -
-
n.a.
7
Oxy
gen
Oxy
gen
- -
- -
-
W
ater
W
ater
-
- -
-
-
Ceriu
m
Ceriu
m
- -
- -
- -
7 Ce
rium
oxid
e Ce
rium
(IV)
oxid
e -
- -
- -
-
5 gm
/kg
7 Ce
rium
oxid
e Ce
rium
(III
)oxi
de
- -
- -
- -
7 Pl
atin
um
Plat
inum
-
-
Tung
sten
Tu
ngst
en
- -
SOC
C0.9
W0.
1 -
-
-
-
10
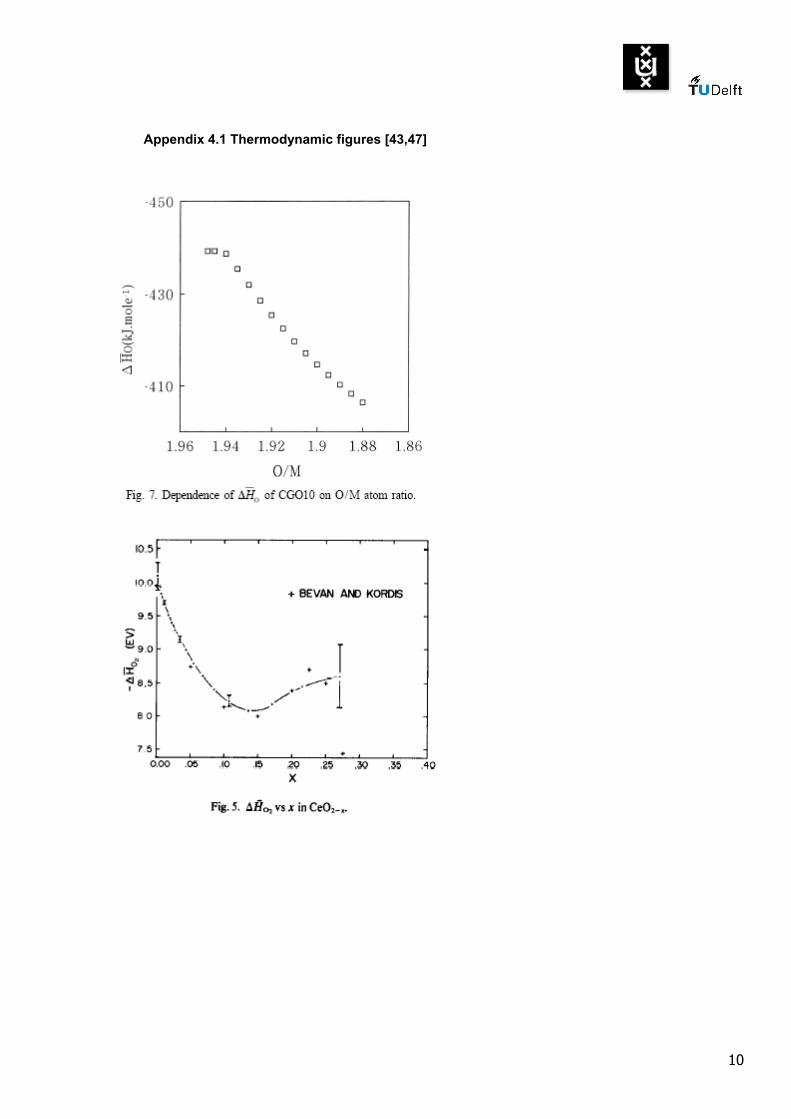
Appendix 4.1 Thermodynamic figures [43,47]
11
12
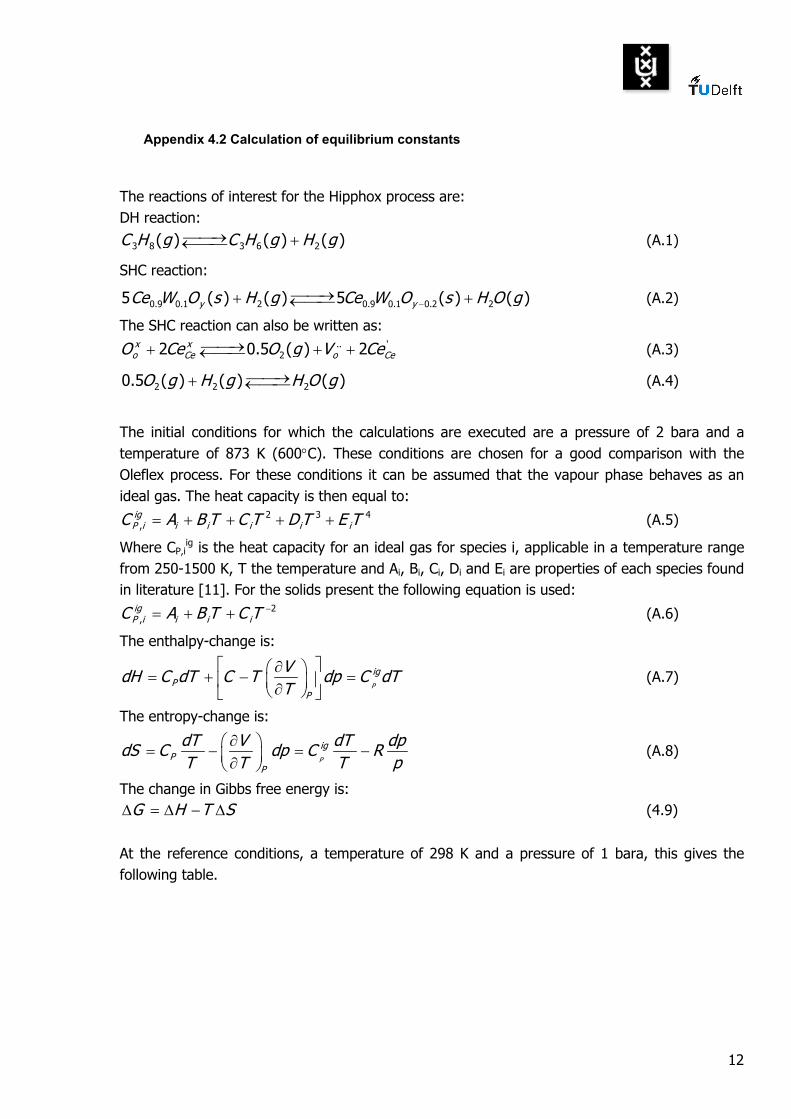
Appendix 4.2 Calculation of equilibrium constants
The reactions of interest for the Hipphox process are: DH reaction:
3 8 3 6 2( ) ( ) ( )C H g C H g H g→ +← (A.1)
SHC reaction:
0.9 0.1 2 0.9 0.1 0.2 25 ( ) ( ) 5 ( ) ( )y yCe W O s H g Ce W O s H O g−→+ +← (A.2)
The SHC reaction can also be written as: .. '
22 0.5 ( ) 2x xo Ce o CeO Ce O g V Ce→+ + +← (A.3)
2 2 20.5 ( ) ( ) ( )O g H g H O g→+ ← (A.4)
The initial conditions for which the calculations are executed are a pressure of 2 bara and a temperature of 873 K (600°C). These conditions are chosen for a good comparison with the Oleflex process. For these conditions it can be assumed that the vapour phase behaves as an ideal gas. The heat capacity is then equal to:
2 3 4,
igP i i i i i iC A B T C T D T E T= + + + + (A.5)
Where CP,iig is the heat capacity for an ideal gas for species i, applicable in a temperature range
from 250-1500 K, T the temperature and Ai, Bi, Ci, Di and Ei are properties of each species found in literature [11]. For the solids present the following equation is used:
2,
igP i i i iC A B T C T −= + + (A.6)
The enthalpy-change is:
P
igP
P
VdH C dT C T dp C dTT
∂ = + − = ∂ (A.7)
The entropy-change is:
P
igP
P
dT V dT dpdS C dp C RT T T p
∂ = − = − ∂ (A.8)
The change in Gibbs free energy is: G H T S∆ = ∆ − ∆ (4.9)
At the reference conditions, a temperature of 298 K and a pressure of 1 bara, this gives the following table.
The enthalpy and entropy of reaction 4.3 are independent of temperature for values of x>1.75 in Ce0.9W0.1Ox. The values of the enthalpy of formation (∆fH), the specific heat (Cp) and the Gibbs free energy of formation (∆fG) of Ce0.9W0.1Ox are unknown. However, the enthalpy of reaction 4.3 is known. The thermodynamic calculations for the SHC reaction are therefore based on reaction 4.3 and 4.4. The values of the enthalpy of formation (∆fH), the specific heat (Cp) and the Gibbs free energy of formation (∆fG) were based on literature [11,12 and 13]. The value of the entropy (∆fS) was calculated using equation (A.9). For the reactions, ∆r Cp0, ∆rH0, ∆rG0 and ∆rS0 can be calculated as follows:
0r i iCp Cpν∆ = ∑ (A.10)
0 0ir i fH Hν∆ = ∆∑ (A.11)
0 0ir iG Gν∆ = ∆∑ (A.12)
0 0ir iS Sν∆ = ∆∑ (A.13)
For reaction 4.3 only enthalpy and entropy of reaction for CeOx and Ce0.9Gd0.1Ox are known as a function of composition and amount of doping. With these chosen values, the influence on the equilibrium composition is calculated. The results are checked with relation (A.9). The equilibrium constant is obtained with the following equation:
0ln( ) rRT K G= −∆ (A.14)
In the following table the quantities of the reactions are given for the reference conditions. Table A.2 Properties of the reactions at reference conditions (T=298K, p=1bara)
The calculations of these quantities at T=873 K and p=2 bar, are as follows:
525 298ig
f f PH H C dT∆ = ∆ + ∫ (A.15)
14
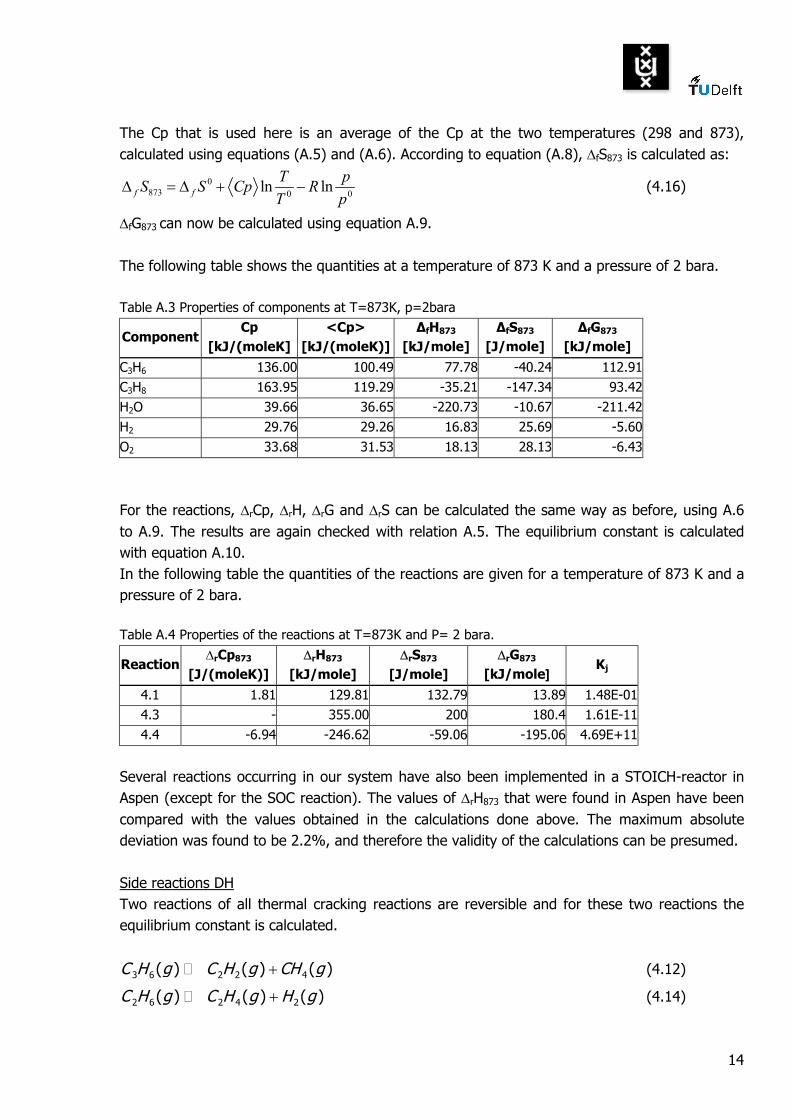
The Cp that is used here is an average of the Cp at the two temperatures (298 and 873), calculated using equations (A.5) and (A.6). According to equation (A.8), ∆fS873 is calculated as:
0873 0 0ln lnf f
T pS S Cp RT p
∆ = ∆ + − (4.16)
∆fG873 can now be calculated using equation A.9. The following table shows the quantities at a temperature of 873 K and a pressure of 2 bara. Table A.3 Properties of components at T=873K, p=2bara
For the reactions, ∆rCp, ∆rH, ∆rG and ∆rS can be calculated the same way as before, using A.6 to A.9. The results are again checked with relation A.5. The equilibrium constant is calculated with equation A.10. In the following table the quantities of the reactions are given for a temperature of 873 K and a pressure of 2 bara. Table A.4 Properties of the reactions at T=873K and P= 2 bara.
Several reactions occurring in our system have also been implemented in a STOICH-reactor in Aspen (except for the SOC reaction). The values of ∆rH873 that were found in Aspen have been compared with the values obtained in the calculations done above. The maximum absolute deviation was found to be 2.2%, and therefore the validity of the calculations can be presumed. Side reactions DH Two reactions of all thermal cracking reactions are reversible and for these two reactions the equilibrium constant is calculated.
3 6 2 2 4( ) ( ) ( )C H g C H g CH g+ (4.12)
2 6 2 4 2( ) ( ) ( )C H g C H g H g+ (4.14)
15
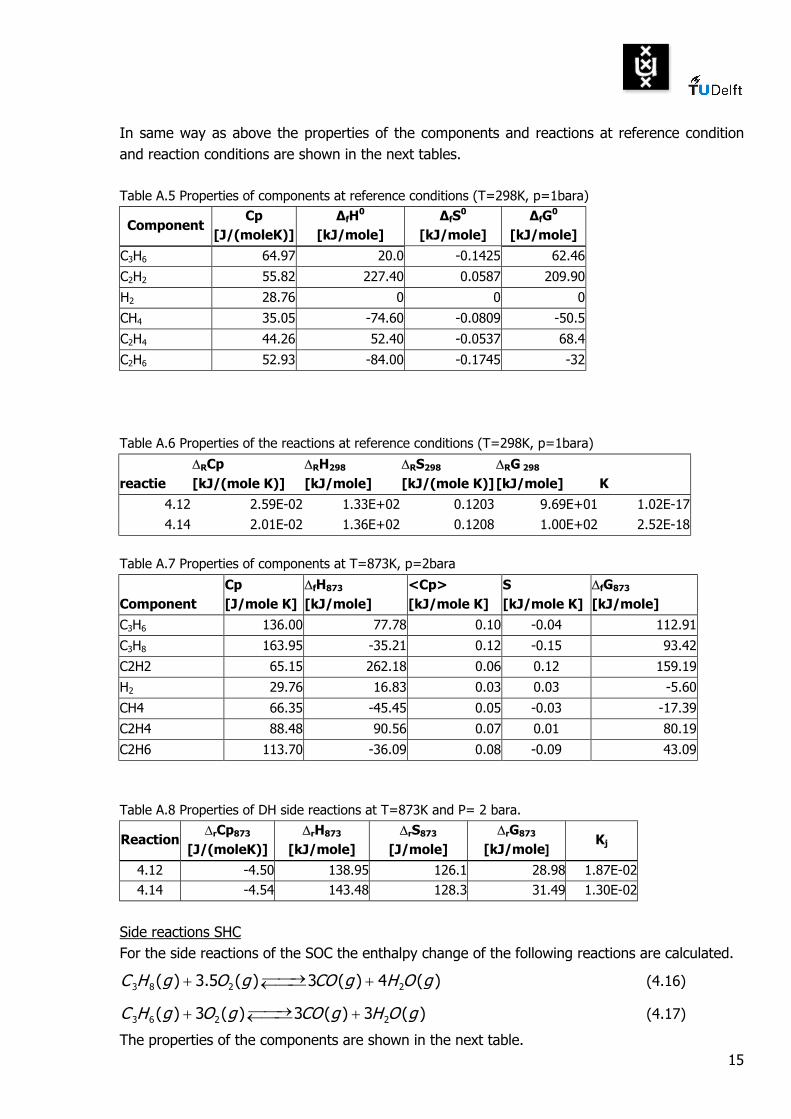
In same way as above the properties of the components and reactions at reference condition and reaction conditions are shown in the next tables. Table A.5 Properties of components at reference conditions (T=298K, p=1bara)
Component Cp
[J/(moleK)] ∆fH0
[kJ/mole] ∆fS0
[kJ/mole] ∆fG0
[kJ/mole] C3H6 64.97 20.0 -0.1425 62.46
C2H2 55.82 227.40 0.0587 209.90
H2 28.76 0 0 0
CH4 35.05 -74.60 -0.0809 -50.5
C2H4 44.26 52.40 -0.0537 68.4
C2H6 52.93 -84.00 -0.1745 -32
Table A.6 Properties of the reactions at reference conditions (T=298K, p=1bara)
In order to obtain expressions for the yi the following formula is used:
0 ,
0
i i j jj
ij j
j
ny
n
ν ε
ν ε
+=
+
∑∑
(A.1)
where: ni0 = the quantity of component i at the beginning, n0 = the overall quantity, νi,j = the stoichiometric coefficient of component i in reaction j νj = the overall stoichiometric coefficient. εj = the extent of reaction j in mole/hr. Table A.1 Stoichiometric coefficients
DH&SHC: This gives the following expressions for the yi for the simultaneous DH&SHC:
3 80
3 80
1
1 0.5 0.5C H A
C HA B c
ny
n
ε
ε ε ε
−=
+ + − (A.2)
3 60
3 60
1
1 0.5 0.5C H A
C HA B c
ny
n
ε
ε ε ε
+=
+ + − (A.3)
20
20
1 1
1 0.5 0.5H A C
HA B c
ny
nε ε
ε ε ε+ −
=+ + −
(A.4)
20
20
0.5 0.5
1 0.5 0.5H A C
OA B c
ny
nε ε
ε ε ε+ −
=+ + −
(A.5)
2 0
20
1
1 0.5 0.5H O C
H OA B c
ny
n
ε
ε ε ε
+=
+ + − (A.6)
To calculate the equilibrium composition at the initial conditions of T=873K and p=2bara the following equations are used [14]:
0 0ln( )ij r iRT K G Gν= −∆ = −∑ (A.7)
( ) ij i
i
K â ν= ∏ (A.8)
21
The activity âi equals: ^
0i
ifâp
= (A.9)
The fugacity ^
if equals: ^ ^
i i if y pφ= (A.10)
Since the pressure is initially 2 bara and the temperature 873 K, the gases may be viewed as
ideal gases, therefore the fugacity coefficient ^
iφ equals 1. This results in:
3 6 2 3 6 23 6 2
3 8 3 83 8
0 0 0
0
C H H C H HC H H
DHC H C H
C H
p p py y y yâ â p p pKpâ yyp
= = = (A.11)
In the second reaction solids are present, for which the following holds:
,i s i iâ x γ= (A.12)
As for a solid xi =1 and therefore γi = 1 the equation for the equilibrium constant for freeing oxygen from the lattice become:
' '2'
2
2
0.50.52
0.5 0.500.5
4.3 2 0
( )( )
( )
O O Ce CeO Ce
X X X X X XO O OCe Ce Ce
OV V Ce CeOV CeO
Ce O Ce Ce O O
px x yâ â â p pK yâ â x x p
γ γ
γ γ
⋅⋅ ⋅⋅⋅⋅
= = =
(A.13)
22 2
2 2
2 22 2
0
4.4 0.5 0.5 0.50.5 0.5
0 0 0
H OH O
H H
H O
H OO O
py yâ pKâ â p p py y y y
p p p
= = =
(A.14)
Combining K4.3 and K4.4 gives 2
2
H O
H
SHC
yK
y=
By using the calculated values of Kj, the equilibrium composition can be written as a function of the extent of reaction. By solving these reactions simultaneously in Maple the equilibrium composition is calculated. In table A.2 the results for different entropy and enthalpy of reaction 4.3 are listed. To compare the different chosen values the conversion for DH and SHC is calculated.
3 8 3 8
3 8 3 8
,0
,0 ,0
C H C H ADH
C H C H
n nn n
εξ−
= = (A.15)
2 2
2
,
,
H formed H ASHC
H formed C
n nn
εξε
−= = (A.16)
22
The temperature and pressure dependence of this equilibrium can be reviewed by repeating the procedure described for different temperatures and pressures. A selection of the results can be found in the following table. First enthalpy of formation was varied while entropy remains constant, second entropy was varied. Two extreme values were chosen to have a feeling of the influence of the value on the equilibrium composition. The chosen values are based on the figures in appendix 4.1. [47,43]. Table A.2 Equilibrium conversions at T=873 K and p=2 bara for different enthalpy and entropy values of
It is clear that the chosen value has a very large influence on the conversion. In Wang [47] it is concluded that doping of CeO2 lowers the enthalpy of the reaction. The influence of tungsten on the enthalpy is unknown. From Panlener [43] and Wang [47] it can be concluded that the doping has a positive influence on the enthalpy and the entropy. In earlier experiments a substantial conversion was measured. Also in literature with other solid oxygen carriers higher conversions are measured, in the order of 50-70%. Therefore the DH conversion for the Hipphox process is set to 62% with enthalpy values for reaction ∆H =355 kJ/mole and ∆S =0.200 kJ/(mole K). In table A.3 the results of calculation at different temperature are listed. The overall reaction is an endothermic reaction and is thus favoured by a high temperature. To prevent coke formation in the reaction section steam can be used as diluent. The influence of the steam on the equilibrium is calculated with propane:steam as 1:4, found in literature [17] The influence on the equilibrium in not negligible. Therefore, steam cannot be used as a diluent. In these equilibrium calculations thermal cracking is not taken into account. This is treated in chapter 4, reaction kinetics. Table A.3 Equilibrium conversions at different temperatures with ∆HB = 355 kJ/mole and ∆SB =0.20
kJ/(mole K).
p [bara] T [K] K4.1 [-] K4.3 [-] K4.4 [-] DHξ SHCξ
The influence of the pressure is calculated. Higher pressure results in lower values for the equilibrium constants of reaction 4.1 and 4.3 due to formation of molecules. Therefore the pressure has to be as low as possible. Because of high pumping duties at lower pressure than 2 bara the pressure is set to 2 bara. From these results it can be seen that in order to obtain an acceptable conversion of propane the temperature has to be at least 873 K. DH+SHC+DH The equilibrium calculations for a reactor system with DH+SHC+SH are done in similar way as treated in paragraph 4.1.1. The temperature is set to 873 K, the pressure is 2 bara. The equilibrium equation for DH is the same as for the combined reaction.
3 6 2
3 8
0
==C H H
DHC H
py ypK
y (A.17)
2
2
= H O
H
SHC
yK
y (A.18)
The expressions for the yi for DH + SHC + DH in series are:
3 80
3 80
C H AC H
A
ny
n
ε
ε
−=
+ (A.19)
3 60
3 60
C H AC H
A
ny
n
ε
ε
+=
+ (A.20)
20
2 ,0
1
1H A
H DHA
ny
nε
ε+
=+
(A.21)
2
2 ,0,
1naDHH SHC
H SHCnaDH
ny
nε−
= (A.22)
2 0
20,
H O SHCH O
naDH
ny
n
ε+= (A.23)
First the equilibrium for DH is calculated. The conversion of DH is 26%. This is used as input for the SHC. This gives a conversion of 88%. This is again used for DH and results in a final
24
conversion of 48%. This is remarkable lower than in combined DH&SHC and more reactor units are required. Therefore it is chosen to do combined DH&SHC.
25
Appendix 4.5 Matlab simulation model
% Temparature dependent variables: % ------------------------------------------------------------------------------------------------------------------ % Thermodynamical data (temperature dependent) i=3; % i detemines temperature: % % i T Optimal conditions: time yield selectivity % % 1 773 % 2 823 % 3 873 % 4 923 % 5 973 % eq_constants=[773 1.54E-2 1.69E-3 1.07E-3; 823 5.11E-2 6.05E-3 4.03E-3; 873 0.148 1.870E-2 1.30E-2; 923 3.80E-1 5.11E-2 3.71E-2; 973 8.87E-1 1.27E-1 9.48E-2]; T=eq_constants(i,1); % Reactor temperature K_eq_soc=7.53; % Thermodynamic equilibrium constant of SOC hydrogen combustion. k_soc=1.67E-1; % Rate constant for selective hydrogen combustion rection [mol*sec-1*kg soc-1] % Propane <-> Propylene + Hydrogen equilibrium constant: K_eq2=eq_constants(i,2); % Thermodynamic equilibrium constant of cracking reaction 2 at T and P % Propylene <-> Ethyn + Methane K_eq6=eq_constants(i,3); % Thermodynamic equilibrium constant of cracking reaction 6 at T and P % Ethane <-> Ethylene + Hydrogen K_eq8=eq_constants(i,4); % Thermodynamic equilibrium constant of cracking reaction 8 at T and P % ------------------------------------------------------------------------------------------------------------------ %Reactor Specifications: V=0; % Volume of reactor [m3] P=2; % Reactor inlet Pressure [bara] P0=1; % Reference pressure [bara] T0=298; % Reference temperature [K] R=8.314; % Universal gas constant [J/mol/K] R_cal=1.987E-3; % Universal gas constant [kcal/mol/K] rho_cat=2700; % Density of dehydrogenation catalyst [kg/m3] rho_soc=6689; % Density of SOC [kg/m3] % Molar masses: M_soc=175.7232E-3; % Molar mass of fresh SOC [kg/mol] M_sc=172.5234E-3; % Molar mass of spent SOC [kg/mol] M_propane=44.09E-3; % Molar mass of propane [kg/mol] M_ethane=30.069E-3; % Molar mass of ethane [kg/mol] M_hydrogen=2.016E-3; % Molar mass of hydrogen [kg/mol] M_propylene=42.074E-3; % Molar mass of propylene [kg/mol] M_water=18.015E-3; % Molar mass of water [kg/mol] M_methane=16.043E-3; % Molar mass of methane [kg/mol] M_ethene=28.053E-3; % Molar mass of ethylene [kg/mol] M_coke=72.06E-3; % Assumed molar mass of coke [kg/mol] M_ethyn=26E-3; % Molar mass of ethyn [kg/mol] M_butene=56.110E-3; % Molar mass of butene kg/mol] M_butadiene=54.091E-3; % Molar mass of butadiene [kg/mol] M_co=28.01E-3; % Molar mass of carbonmonoxide [kg/mol] M_co2=44.01E-3; % Molar mass of carbondioxide [kg/mol]
26
M_cat=101.961E3; % Molar mass of DH catalyst [kg/mol] (derived from Al2O3) % Enthalpy change of reactions: dH_dh=129.81E3; % Enthalpy change for dehydrogenation reaction [J/mol propane] dH_soc=108.38E3; % Enthalpy change for hydrogen combustion by SOC [J/mol hydrogen] dH_soc_ox=36E3; % Enthalpy change for HC's combustions by SOC [J/mol HC] dH_crack_1=80.32E3; % Enthalpy change for cracking reaction 1 [J/mol Propane] dH_crack_6=139E3; % Enthalpy change for cracking reaction 6 [J/mol Propylene] dH_crack_8=143E3; % Enthalpy change for cracking reaction 8 [J/mol Ethane] % Inlet stream: moles and fractions % Gaseous components in feed f_propane_0=355.5579; % Propane feed to reactor [mol/s] f_propane=355.5579; % Propane feed to reactor [mol/s] f_ethane=7.06945; % Ethane feed to reactor [mol/s] f_hydrogen=0; % Hydrogen feed to reactor [mol/s] f_propylene=30.3444; % Propylene feed to reactor [mol/s] f_propylene_0=30.3444; % Propylene feed to reactor [mol/s] f_water=0; % Water feed to reactor [mol/s] f_methane=0; % Methane feed to reactor [mol/s] f_ethene=0; % Ethene molar flow into reactor f_coke=0; % Coke molar flow into reactor f_ethyn=0; % Ethyn molar flow into reactor f_butene=0; % Butene molar flow into reactor f_butadiene=0; % Butadiene molar flow into reactor f_co=0; % Carbonmonoxide molar flow into reactor f_co2=0; % Carbondioxide molar flow into reactor % Solid components f_soc=10000; % SOC feed to reactor [mol/s] f_sc=0; % Spent SOC feed to reactor [mol/s] f_cat=0; % DH catalyst feed to reactor [mol/s] f_gas=f_propane+f_ethane+f_hydrogen+f_water+f_co2+f_co; % Total gaseous reactor feed [mol/s] f_gas_0=f_propane+f_ethane+f_hydrogen+f_water+f_co2+f_co; % Total gaseous reactor feed [mol/s] f_solid=f_soc+f_sc+f_cat+f_coke; % Total solid reactor feed [mol/s] % Mass compositions m_vapor_0=f_propane*M_propane+f_ethane*M_ethane+f_hydrogen*M_hydrogen+f_propylene*M_propylene+f_water*M_water+f_methane*M_methane+f_ethene*M_ethene+f_ethyn*M_ethyn+f_butene*M_butene+f_butadiene*M_butadiene+f_co*M_co+f_co2+M_co2; % Total vapor mass flow [kg/s] m_solid_0=f_soc*M_soc+f_sc*M_sc+f_coke*M_coke+f_cat*M_cat; % Total solid mass flow [kg/s] % Kinetic data k01=4.692E10; % Turnover frequency thermal cracking reaction 1 [sec-1] k02=5.888E10; % Turnover frequency thermal cracking reaction 2 [sec-1] k03=2.539E13; % Turnover frequency thermal cracking reaction 3 [sec-1*mol-1] k04=1.514E11; % Turnover frequency thermal cracking reaction 4 [sec-1] k05=1.423E9; % Turnover frequency thermal cracking reaction 5 [sec-1] k06=3.794E11; % Turnover frequency thermal cracking reaction 6 [sec-1] k07=5.553E14; % Turnover frequency thermal cracking reaction 7 [sec-1*mol-1] k08=4.652E13; % Turnover frequency thermal cracking reaction 8 [sec-1] k09=1.026E12; % Turnover frequency thermal cracking reaction 9 [sec-1*mol-1] Ea01=50.60; % Activation energy for thermal cracking reaction 1 [kcal] Ea02=51.29; % Activation energy for thermal cracking reaction 2 [kcal] Ea03=59.06; % Activation energy for thermal cracking reaction 3 [kcal] Ea04=55.80; % Activation energy for thermal cracking reaction 4 [kcal] Ea05=45.50; % Activation energy for thermal cracking reaction 5 [kcal] Ea06=59.39; % Activation energy for thermal cracking reaction 6 [kcal]
27
Ea07=60.01; % Activation energy for thermal cracking reaction 7 [kcal] Ea08=65.20; % Activation energy for thermal cracking reaction 8 [kcal] Ea09=41.26; % Activation energy for thermal cracking reaction 9 [kcal] % Catalitic dehydrogenation k_app=11E-7; % Apparent rate constant of dehydrogenation catalyst [mol*kg cat-1*sec-1] cat_load=90; % DH catalyst load [kg/m3 monolith] % Calculation parameters dv=0.5; % Step size for calculations [delta V] V0=0.01; % Calculation start volume [m3] V_final=50; % Final calculation volume [m3] results=[]; % Vapor component results array results2=[]; % Second results array temperature=[]; % temperature array solid=[]; % Solid component results array rates=[]; % Reaction rates array conversion=[0 0 0 0]; % Conversion of propane mass=[]; % Check mass balances start_yield=0; % Temperature calculations T_feed=651; % Temperature of the hydrocarbon feed [K] T_soc=955; % Temperature of the fresh SOC feed [K] %T_feed=873; % Temperature of the hydrocarbon feed [K] %T_soc=800; % Temperature of the fresh SOC feed [K] Cp_soc=61.6; % Heat capacity of SOC (Ceriumoxide) [J/mole/K] Cp_propane=28.770+1.160E-1*T+1.96E-4*(T^2)-2.33E-7*(T^3)+6.87E-11*(T^4);% Heat capacity of propane [J/mole/K] Cp_ethane=(1.131+1.923E-2*T-0.000005561*(T^2))*R;% Heat capacity of ethane [J/mole/K] Cp_hydrogen=25.3990+2.018E-02*T-3.85E-05*(T^2)+3.19E-08*(T^3)-8.76E-12*(T^4);% Heat capacity of hydrogen [J/mole/K] Cp_propylene=31.298+7.245E-2*T+1.95E-4*(T^2)-2.16E-7*(T^3)+6.30E-11*(T^4);% Heat capacity of propylene [J/mole/K] Cp_water=(3.47+1.45E-3*T+12100/(T^2))*R; % Heat capacity of water [J/mole/K] Cp_methane=(1.7020+9.081E-03*T-0.000002164*(T^2))*R; % Heat capacity of methane [J/mole/K] Cp_butene=(1.9670+3.1630E-02*T+-9.8730E-06*(T^2))*R; % Heat capacity of butene [J/mole/K] a=((f_soc+f_sc)*Cp_soc*1.24)/(f_propane*Cp_propane+f_ethane*Cp_ethane+f_hydrogen*Cp_hydrogen+f_propylene*Cp_propylene+f_water*Cp_water+f_methane*Cp_methane); T=(T_feed+T_soc*a)/(1+a); % Reactor temperature [K] frac_conv_dh=0; % Initial fractional conversion of dehydrogenation reaction frac_conv_soc=0; % Initial fractional conversion of SOC reaction frac_conv_socox=0; % Initial fractional conversion of SOC side reactions % ------------------------------------------------------------------------------------------------------------------ for V=V0:dv:V_final k1=k01*exp(-Ea01/(R_cal*T)); % Rate constant for thermal cracking reaction 1 [sec-1] k2=k02*exp(-Ea02/(R_cal*T)); % Rate constant for thermal cracking reaction 2 [sec-1] k3=k03*exp(-Ea03/(R_cal*T)); % Rate constant for thermal cracking reaction 3 [sec-1*mol-1] k4=k04*exp(-Ea04/(R_cal*T)); % Rate constant for thermal cracking reaction 4 [sec-1] k5=k05*exp(-Ea05/(R_cal*T)); % Rate constant for thermal cracking reaction 5 [sec-1] k6=k06*exp(-Ea06/(R_cal*T)); % Rate constant for thermal cracking reaction 6 [sec-1] k7=k07*exp(-Ea07/(R_cal*T)); % Rate constant for thermal cracking reaction 7 [sec-1*mol-1] k8=k08*exp(-Ea08/(R_cal*T)); % Rate constant for thermal cracking reaction 8 [sec-1] k9=k09*exp(-Ea09/(R_cal*T)); % Rate constant for thermal cracking reaction 9 [sec-1*mol-1]
28
% Thermal cracking reactions r1=k1*((f_propane/f_gas)*P/(R_cal*T)); % Thermal cracking reaction 1 [mol*m3-1*sec-1] r2=0; % Thermal cracking reaction 2 [mol*m3-1*sec-1] r3=k3*(((f_propane*f_ethene)/(f_gas^2))*((P/(R_cal*T))^2));% Thermal cracking reaction 3 [mol*m3-1*sec-1] r4=k4*((f_propylene/f_gas)*(P/(R_cal*T))); % Thermal cracking reaction 4 [mol*m3-1*sec-1] r5=0; %k5*((f_propylene/f_gas)*(P/(R_cal*T))); % Thermal cracking reaction 5 (Coke formation) [mol*m3-1*sec-1] r6=k6*((f_propylene/f_gas)*P/(R_cal*T)-((f_ethyn*f_methane)/(f_gas^2))*(1/K_eq6)*((P/(R_cal*T))^2)); % Thermal cracking reaction 6 [mol*m3-1*sec-1] r7=k7*(((f_propylene*f_ethane)/(f_gas^2))*((P/(R_cal*T))^2)); % Thermal cracking reaction 7 [mol*m3-1*sec-1] r8=k8*((f_ethane/f_gas)*P/(R_cal*T)-((f_ethene*f_hydrogen)/(f_gas^2))*(1/K_eq8)*((P/(R_cal*T))^2)); % Thermal cracking reaction 8 [mol*m3-1*sec-1] r9=k9*((f_ethene*f_ethyn)/(f_gas^2))*((P/(R_cal*T))^2); % Thermal cracking reaction 9 [mol*m3-1*sec-1] % Dehydrogenation reaction K_dh=(P0/P)*(1.76E12)*exp(-15521/T); r_dh=cat_load*k_app*P*1E5*((f_propane/f_gas)-(((f_propylene/f_gas)*(f_hydrogen/f_gas)*P*1E5)/(K_dh))); % Solid oxygen carrier reaction if f_soc>0 % SOC reaction only occurs if SOC is present. r_soc=0.97*(f_soc*M_soc)*k_soc*((f_hydrogen/f_gas)-(f_water/f_gas)/K_eq_soc);% SOC hydrogen combustion reaction (97% selective) else % If SOC is not present, no reaction takes place. r_soc=0; % SOC hydrogen combustion reaction if no SOC is present end r_soc_oxidizing=(3/97)*r_soc; % SOC hydrocarbon combustion reaction (3% selective) if r_soc<0 r_soc=0; r_soc_oxidizing=0; end % Euler's method for stochiometric reactions: x(V+dV) = x(V) + step * dx/dV % Gaseous components: f_propane=f_propane+dv*(-r1-r2-r3-r_dh-0.5*(1/7)*r_soc_oxidizing); % moles of propane f_ethane=f_ethane+dv*(+r3-r7-r8); % moles of ethane f_hydrogen=f_hydrogen+dv*(+r2+r8+r_dh-r_soc); % moles of hydrogen f_propylene=f_propylene+dv*(+r2+r3-2*r4-2*r5-r6-r7+r_dh-(0.5*(1/6)*r_soc_oxidizing));% moles of propylene f_water=f_water+dv*(r_soc+(0.5*(4/7)*r_soc_oxidizing)+(0.5*(3/6)*r_soc_oxidizing));% moles of water f_methane=f_methane+dv*(+r1+3*r5+r6+r7); % moles of methane f_ethene=f_ethene+dv*(+r1-r3+3*r4+r8-r9); % moles of ethylene f_ethyn=f_ethyn+dv*(+r6-r9); % moles of ethyn f_butene=f_butene+dv*(+r7); % moles of butene f_butadiene=f_butadiene+dv*(+r9); % moles of butadiene f_co=f_co+dv*((0.5*(3/7)*r_soc_oxidizing)+(0.5*(3/6)*r_soc_oxidizing)); % moles of carbonmonoxide f_co2=f_co2; % moles of carbondioxide f_gas=f_propane+f_ethane+f_hydrogen+f_propylene+f_water+f_methane+f_ethene+f_ethyn+f_butene+f_butadiene+f_co+f_co2; % Total moles in reactor % Fractional conversions frac_conv_dh=frac_conv_dh+r_dh*dv; % frac_conv_dh2=frac_conv_dh/f_propane_0; % Fractional conversion of dehydrogenation reaction frac_conv_soc=frac_conv_soc+r_soc*dv; % frac_conv_soc2=frac_conv_soc/(frac_conv_dh); % Fractional conversion of SOC reaction frac_conv_socox=frac_conv_socox+r_soc_oxidizing*dv; % frac_conv_socox2=frac_conv_socox/f_propane_0; % Fractional conversion of SOC side reactions
29
% Solid components: f_soc=f_soc-dv*(5*r_soc+5*r_soc_oxidizing); % moles of fresh SOC present f_sc=f_sc+dv*(5*r_soc+5*r_soc_oxidizing); % moles of spent SOC present %f_coke=f_coke+dv*(0.5*r5); % moles of coke f_total_solid=f_soc+f_sc+f_coke; % total moles in solid phase x_soc=f_soc/f_total_solid; % SOC fraction in solids x_sc=f_sc/f_total_solid; % SC fraction in solids % Temperature effects % Specific heats: Cp_soc=61.6; % Heat capacity of SOC (Ceriumoxide) [J/mole/K] Cp_propane=28.770+1.160E-1*T+1.96E-4*(T^2)-2.33E-7*(T^3)+6.87E-11*(T^4); % Heat capacity of propane [J/mole/K] Cp_ethane=(1.131+1.923E-2*T-0.000005561*(T^2))*R;% Heat capacity of ethane [J/mole/K] Cp_hydrogen=25.3990+2.018E-02*T-3.85E-05*(T^2)+3.19E-08*(T^3)-8.76E-12*(T^4); % Heat capacity of hydrogen [J/mole/K] Cp_propylene=31.298+7.245E-2*T+1.95E-4*(T^2)-2.16E-7*(T^3)+6.30E-11*(T^4); % Heat capacity of propylene [J/mole/K] Cp_water=(3.47+1.45E-3*T+12100/(T^2))*R; % Heat capacity of water [J/mole/K] Cp_methane=(1.7020+9.081E-03*T-0.000002164*(T^2))*R;% Heat capacity of methane [J/mole/K] Cp_butene=(1.9670+3.1630E-02*T+-9.8730E-06*(T^2))*R;% Heat capacity of butene [J/mole/K] % Temperature calculation based on ideal heat exchange T=T-dv*(dH_crack_1*r1+dH_crack_6*r6+dH_crack_8*r8+dH_soc_ox*r_soc_oxidizing+dH_dh*r_dh+dH_soc*r_soc)/((f_soc+f_sc)*Cp_soc*1.24+f_propane*Cp_propane+f_ethane*Cp_ethane+f_hydrogen*Cp_hydrogen+f_propylene*Cp_propylene+f_water*Cp_water+f_methane*Cp_methane); % Mass balance check m_vapor=f_propane*M_propane+f_ethane*M_ethane+f_hydrogen*M_hydrogen+f_propylene*M_propylene+f_water*M_water+f_methane*M_methane+f_ethene*M_ethene+f_ethyn*M_ethyn+f_butene*M_butene+f_butadiene*M_butadiene+f_co*M_co+f_co2+M_co2; % Total vapor mass present [kg] m_solid=f_soc*M_soc+f_sc*M_sc+f_coke*M_coke; % Total solid mass present [kg] m_total=m_vapor+m_solid; %Total mass present [kg] conv=(f_propane_0-f_propane)/f_propane_0; % Conversion of propane yield=(f_propylene-f_propylene_0)/(f_propane_0-f_propane); % Yield of propylene [formed mol propylene/reacted mol propane] yield2=yield*conv; % Yield of propylene [formed mol propylene/fed mol propane] results=[results; V f_propane f_ethane f_hydrogen f_propylene f_water f_methane f_ethene f_ethyn f_butene f_butadiene f_co f_co2]; % Molar flow rates array rates=[rates; V r1 r2 r3 r4 r5 r6 r7 r8 r9 r_dh r_soc r_soc_oxidizing];% Reaction rates array temperature=[temperature; V T]; % Temperature array conversion=[conversion; V conv yield yield2]; % Conversion array solid=[solid; V x_soc x_sc]; % Solid fractions array mass=[mass; V m_vapor m_solid m_total]; % Mass balance check array end % ------------------------------------------------------------------------------------------------------------------ % Plotting section: The code below offers different plots of calculated variables. % Results2 matrix consists of various components: % % 1. Volume ratio of DC catalyst / SOC [m3/m3]
30
% 2. Optimal residence time [s] % 3. Propylene yield [mole propylene/mole propane] % 4. Moles of coke formed [mol] % 5. Reactor exit temperature [K] % 6. Moles of propane present in reactor at start [mol] % 7. Mass fraction of catalyst [] % 8. Mass fraction of SOC [] % 9. Amount of catalyst [Kg] %10. Amount of SOC [Kg] %11. Amount of Sc [Kg] % Result matrix consists of various components: % % 1. Time [s] % 2. Fraction of propane % 3. Fraction of ethane % 4. Fraction of hydrogen % 5. Fraction of propylene % 6. Fraction of water % 7. Fraction of methane % 8. Fraction of ethene % 9. Fraction of ethyn %10. Fraction of butene %11. Fraction of butadiene %12. Fraction of carbonmonoxide %13. Fraction of carbondioxide % % Solid matrix consists of various components: % % 1. Time [s] % 2. Fraction of fresh SOC % 3. Fraction of spent SOC % 4. Fraction of coke % % Reaction rates result matrix of various reaction rates: % % 1. Time [s] % 2. Reaction rate of reaction r1 % 3. Reaction rate of reaction r2 % 4. Reaction rate of reaction r3 % 5. Reaction rate of reaction r4 % 6. Reaction rate of reaction r5 % 7. Reaction rate of reaction r6 % 8. Reaction rate of reaction r7 % 9. Reaction rate of reaction r8 %10. Reaction rate of reaction r9 %11. Reaction rate of the dehydrogenation reaction %12. Reaction rate of SOC hydrogen combustion (97% selective) %13. Reaction rate of SOC hydrocarbon combustion (3% selective) % % Conversion of propane: % % 1. Time [s] % 2. Conversion of propane % 3. Yield of propylene % % Mass matrix consists of various items: % % 1. Time [s] % 2. Vapor phase mass [kg]
31
% 3. Solid phase mass [kg] % 4. Total mass [kg] % Plotting conversion subplot(1,2,1) plot(conversion(:,1),conversion(:,2)) hold on plot(conversion(:,1),conversion(:,3),'r') plot(conversion(:,1),conversion(:,4),'--r') axis([0 V_final 0 1]); xlabel('Volume [m3]'); ylabel('% Conversion of propane [blue] and % Yield of propylene [red]'); output=[T f_sc f_soc yield2] f_propane f_propylene f_hydrogen f_water f_ethane f_co f_methane f_ethyn f_butene f_butadiene f_soc f_sc frac_conv_dh2 frac_conv_soc2 frac_conv_socox2 %plot(conversion(:,1),conversion(:,3),'--r') %plot(conversion(:,1),conversion(:,4),'--g') legend('Propane conversion','Selectivity','Propylene yield'); %axis([0 V0 0 1]); subplot(1,2,2) hold on plot(temperature(:,1),temperature(:,2)); xlabel('Volume [m3]'); ylabel('Reactor output temperature [K]'); %plot(conversion(:,1),optimal(:,8)) %hold on %plot(conversion(:,1),optimal(:,9)) %plot(conversion(:,1),optimal(:,10)) %starting_soc=[amount_soc amount_sc] break; % Estimating catalyst SOC ratio subplot(2,3,1) plot(results2(:,7),results2(:,2)) xlabel('Mass fraction DH cat in solid'); ylabel('Optimal residence time [s]'); subplot(2,3,2) plot(results2(:,1),results2(:,2)) xlabel('Volume fraction DH cat in solid'); ylabel('Optimal residence time [s]'); subplot(2,3,3) plot(results2(:,7),results2(:,9),'--r') hold on
32
plot(results2(:,7),results2(:,10),'--b') legend('DH Cat [Kg]','SOC [Kg]') xlabel('Mass fraction DH cat in solid'); ylabel('Amount of DH cat [kg]'); subplot(2,3,4) plot(results2(:,7),results2(:,3),'r') ylabel('Propylene yield'); xlabel('Mass fraction of DH catalyst'); subplot(2,3,5) plot(results2(:,7),results2(:,5),'b') ylabel('Reactor exit temperature [K]'); xlabel('Mass fraction of DH catalyst'); plot(results2(:,7),results2(:,6),'b') ylabel('Moles of propane at start in reactor [mol/m3]'); xlabel('Mass fraction of DH catalyst'); break; % Plotting mass balances hold on subplot(1,3,1) plot(mass(:,1),mass(:,2)); xlabel('Vapor phase mass'); subplot(1,3,2) plot(mass(:,1),mass(:,3)); xlabel('Solid phase mass'); subplot(1,3,3) plot(mass(:,1),mass(:,4)); xlabel('Total mass'); break; % Plotting solid fractions hold on plot(solid(:,1),solid(:,2)) xlabel('Time [s]'); ylabel('Mole fractions in solid phase'); plot(solid(:,1),solid(:,2)) plot(solid(:,1),solid(:,3),'--') plot(solid(:,1),solid(:,4),'--r') axis([0 t_final 0 1]); break; % Plotting vapor fractions hold on subplot(2,6,1) plot(results(:,1),results(:,2)); xlabel('Propane'); subplot(2,6,2) plot(results(:,1),results(:,3)); xlabel('Ethane'); subplot(2,6,3) plot(results(:,1),results(:,4)); xlabel('Hydrogen'); subplot(2,6,4) plot(results(:,1),results(:,5)); xlabel('Propylene'); subplot(2,6,5) plot(results(:,1),results(:,6)); xlabel('Water');
Appendix 5.5 Preliminary Block scheme of the Hipphox process
* The numbers of the flows are based on the first mass balances calculation described in chapter 5. These numbers are therefore not the optimized numbers. The numbers between the brackets are the ton of component per ton of product.
H2O (l) 93.71 kta (0.37) 30°C, 12 bara
2
3
4
8 Separation section 22°C 16 bara
Reaction section 600 °C 2 bara
Separation section 30 – 75 °C 12 – 25 bara
Regeneration section 600 °C 1-2 bara
LPG [v] 306.15 kta (1.22) 15 °C, 17 bara
Propylene-product (v) 250 kta 15°C, 9 bara
C4+ (l)
9.18 kta (0.04) 15°C, 16 bara
O2 (in air) 83.23 kta (0.34) 15 °C, 1 bara
Propane + C2 [v] 473.21 kta (1.89) 600 °C, 2 bara
SOC recycle
exhaust air
By-product (v) 35.05 kta (0.14) 15°C, 2 bara
Total IN: 389.38 kta (1.56) Total OUT: 389.38 kta (1.56)
556.43 kta (2.23) 600 °C 2 bara
1
9
10
12 13
7
11 H2 (v) 1.43 kta (0.01)
15°C, 2 bara
Propane (l) 176.24 kta (0.70) 31°C, 17 bara
6 5
47
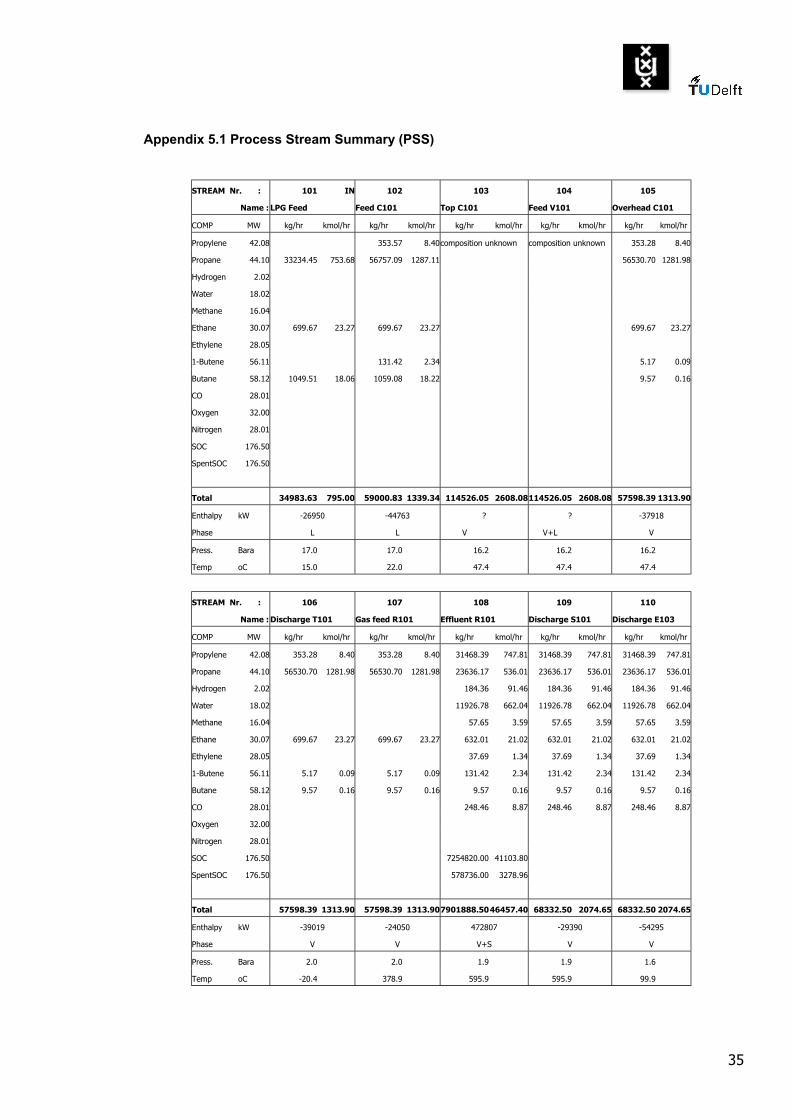
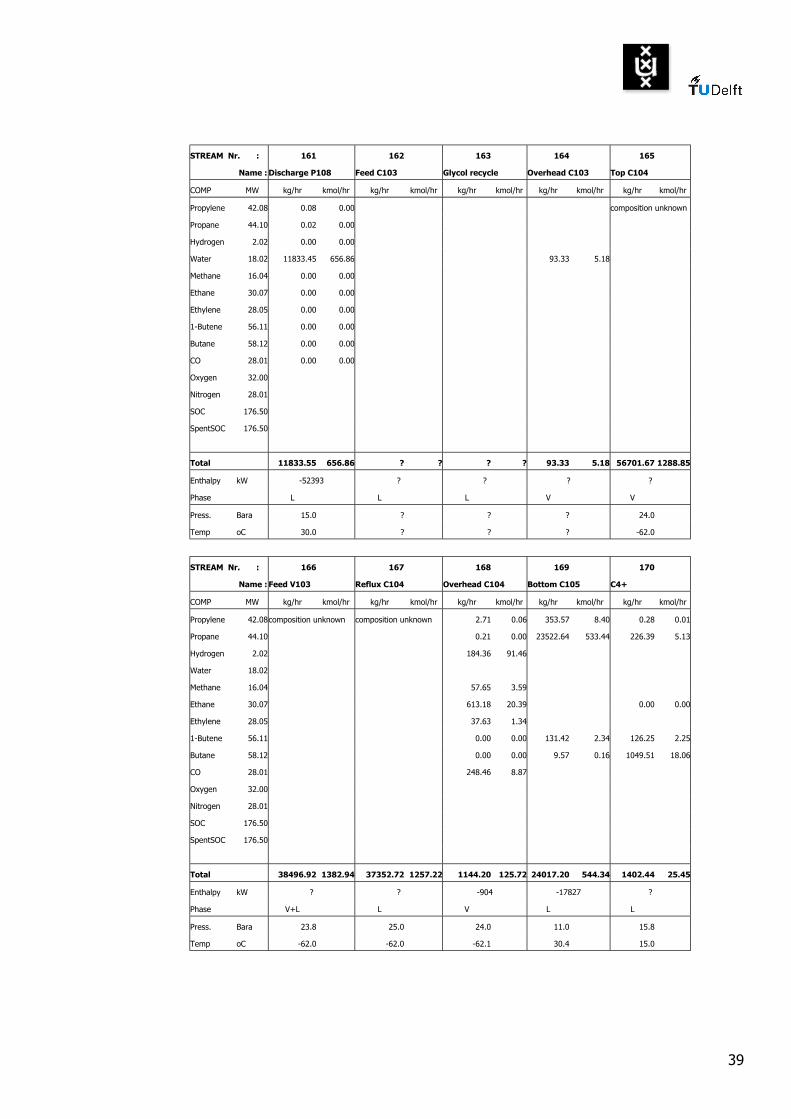
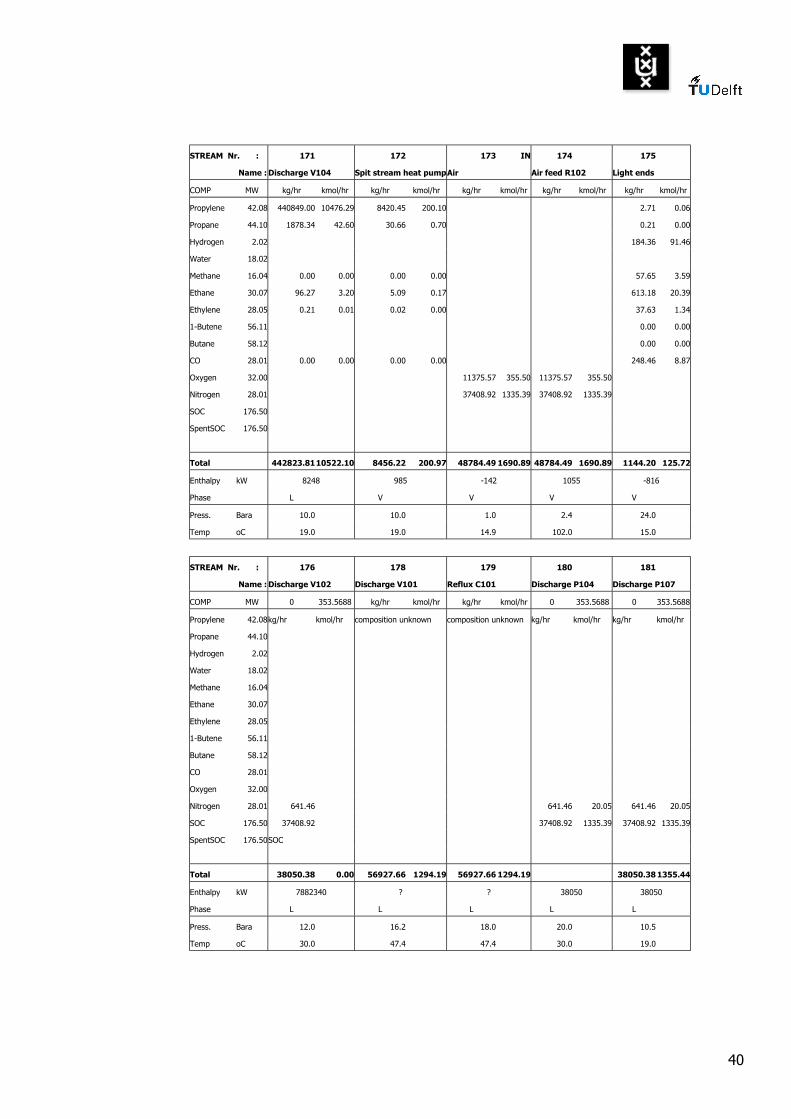
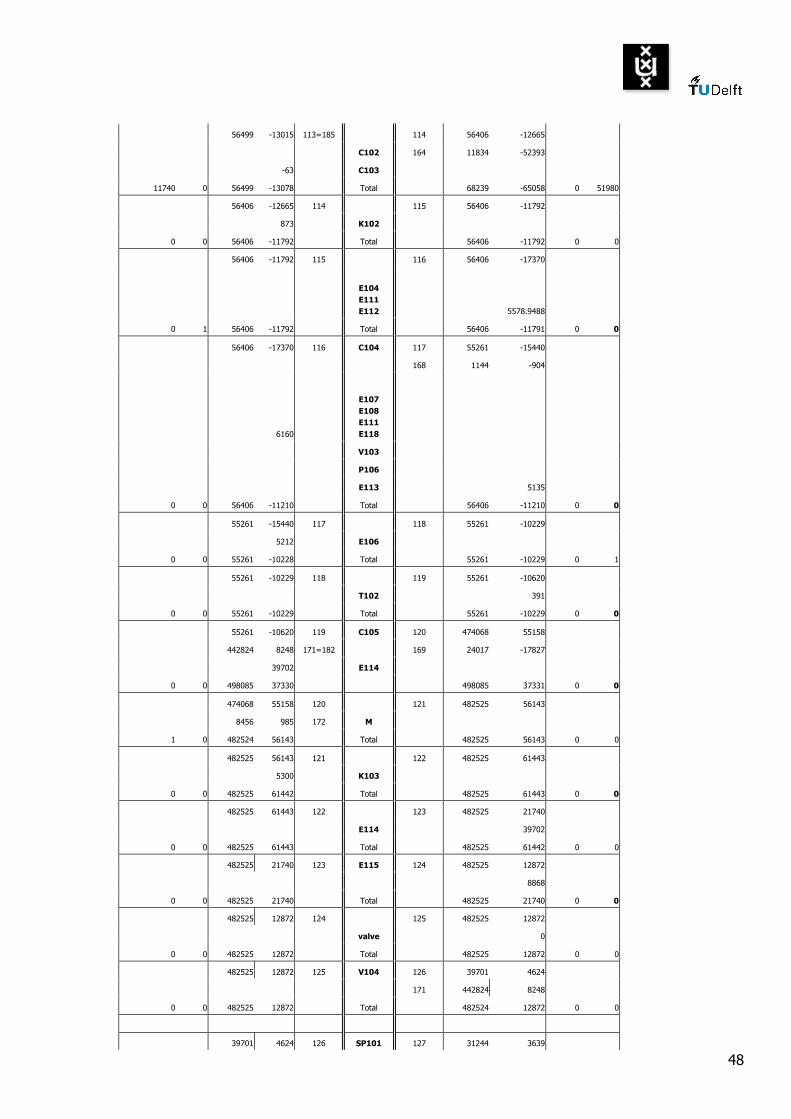
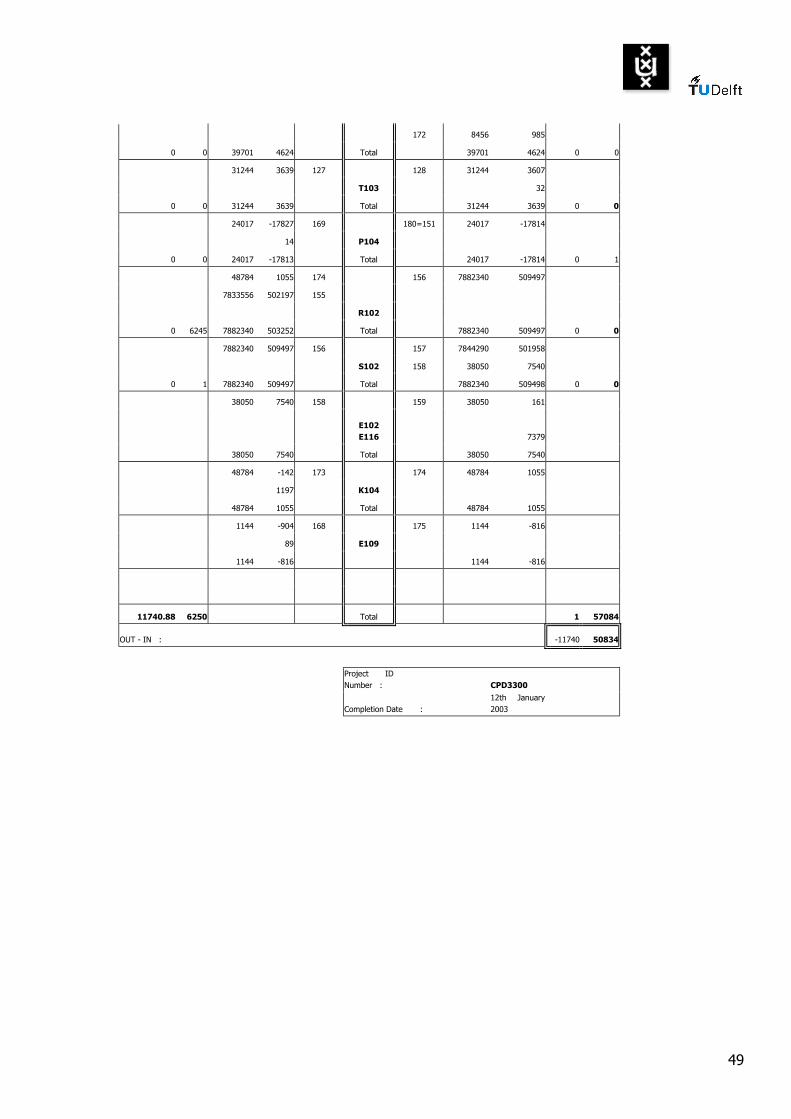
Appendix 7.1 Heat & Mass balance for streams total
HEAT & MASS BALANCE FOR STREAMS TOTAL
IN OUT
Plant EQUIPMENT EQUIPM. EQUIPMENT Plant
Mass Heat Mass Heat Stream IDENTIF. Stream Mass Heat Mass Heat
kg/hr kW kg/hr kW Nr. Nr. kg/hr kW kg/hr kW
34984 -26950 101 M 102 59001 -44763
24017 -17814 151
1 59001 -44764 Total 59001 -44763 0
59001 -44763 102 C101 105 57598 -37918
152 1402 -856
0 E101 4616
10606 E105
V101
P101
0 59001 -34157 Total 59001 -34158 0 0
57598 -37918 105 106 57598 -39019
T101 1101
0 0 57598 -37918 Total 57598 -37918 0 0
57598 -39019 106 107 57598 -24050
0 14969
E102 E103 E104
0 0 57598 -24050 Total 57598 -24050 0 0
57598 -24050 107 108 7901888 472807
R101
7844290 501958 157
0 0 7901888 477908 Total 7901888 472807 0 5101
7901888 472807 108 S101 109 68332 -29390
155 7833556 502197
0 0 7901888 472807 Total 7901888 472807 0 0
68332 -29390 109 110 68332 -54295
E103 E105 E106 E107 24905
0 0 68332 -29390 Total 68332 -29390 0 0
68332 -54295 110 111 68332 -49438
4857 K101
0 0 68332 -49438 Total 68332 -49438 0 0
68332 -49438 111 112 68333 -65408
E108 E109 E110 15971
0 1 68332 -49438 Total 68333 -49437 0 0
68333 -65408 112 V102 113 56499 -13015
160 11834 -52393
0 0 68333 -65408 Total 68332 -65408 0 0
48
56499 -13015 113=185 114 56406 -12665
C102 164 11834 -52393
-63 C103
11740 0 56499 -13078 Total 68239 -65058 0 51980
56406 -12665 114 115 56406 -11792
873 K102
0 0 56406 -11792 Total 56406 -11792 0 0
56406 -11792 115 116 56406 -17370
E104 E111 E112 5578.9488
0 1 56406 -11792 Total 56406 -11791 0 0
56406 -17370 116 C104 117 55261 -15440
168 1144 -904
6160
E107 E108 E111 E118
V103
P106
E113 5135
0 0 56406 -11210 Total 56406 -11210 0 0
55261 -15440 117 118 55261 -10229
5212 E106
0 0 55261 -10228 Total 55261 -10229 0 1
55261 -10229 118 119 55261 -10620
T102 391
0 0 55261 -10229 Total 55261 -10229 0 0
55261 -10620 119 C105 120 474068 55158
442824 8248 171=182 169 24017 -17827
39702 E114
0 0 498085 37330 498085 37331 0 0
474068 55158 120 121 482525 56143
8456 985 172 M
1 0 482524 56143 Total 482525 56143 0 0
482525 56143 121 122 482525 61443
5300 K103
0 0 482525 61442 Total 482525 61443 0 0
482525 61443 122 123 482525 21740
E114 39702
0 0 482525 61443 Total 482525 61442 0 0
482525 21740 123 E115 124 482525 12872
8868
0 0 482525 21740 Total 482525 21740 0 0
482525 12872 124 125 482525 12872
valve 0
0 0 482525 12872 Total 482525 12872 0 0
482525 12872 125 V104 126 39701 4624
171 442824 8248
0 0 482525 12872 Total 482524 12872 0 0
39701 4624 126 SP101 127 31244 3639
49
172 8456 985
0 0 39701 4624 Total 39701 4624 0 0
31244 3639 127 128 31244 3607
T103 32
0 0 31244 3639 Total 31244 3639 0 0
24017 -17827 169 180=151 24017 -17814
14 P104
0 0 24017 -17813 Total 24017 -17814 0 1
48784 1055 174 156 7882340 509497
7833556 502197 155
R102
0 6245 7882340 503252 Total 7882340 509497 0 0
7882340 509497 156 157 7844290 501958
S102 158 38050 7540
0 1 7882340 509497 Total 7882340 509498 0 0
38050 7540 158 159 38050 161
E102 E116 7379
38050 7540 Total 38050 7540
48784 -142 173 174 48784 1055
1197 K104
48784 1055 Total 48784 1055
1144 -904 168 175 1144 -816
89 E109
1144 -816 1144 -816
11740.88 6250 Total 1 57084
OUT - IN : -11740 50834
Project ID Number : CPD3300
Completion Date : 12th January 2003
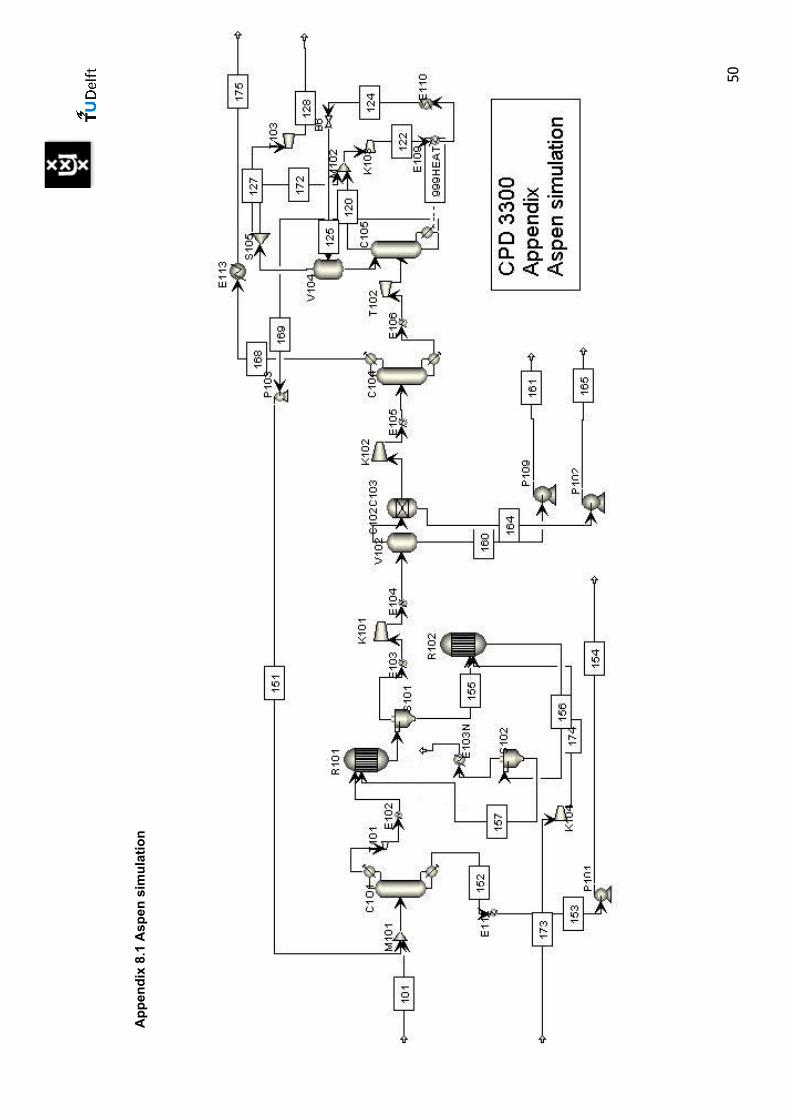
50
App
endi
x 8.
1 A
spen
sim
ulat
ion
51
Appendix 8.2 Calculation of reactor dimensions
For the calculation of the reactor dimensions the following input data is used: Table A.1 Input for reactor dimension calculations
Reactor volume 71 m3
Solid volume fraction 0.3 Gas volume 50 m3 Residence time τ 3.65 s Gas flow 13.6 m3/s
With the calculated reactor volume different H/D ratio’s are chosen, which are used to calculate the specific area. From the area and the gas flow the superficial gas velocity can be calculated. The absolute particle velocity is obtained by summing up the superficial gas velocity and the relative particle speed. The relative particle speed can be obtained by using the following iteration procedure. First the relative particle speed is set to a certain arbitrarily chosen value. Using the following relation the Reynolds-particle number can be calculated:
Re vDρµ
= (A.1)
with: ρ = density of the gas, a mixture of propane and propylene [kg/m3], v = relative particle speed [m/s], D = diameter of the particle [m], µ = viscosity of the gas [Pa*s]. From the Reynolds number the drag-factor can be obtained using the following formula:
3518.5*ReDC
−= (A.2)
This formula was obtained from Yang et al. [59]. The drag-factor of the particle can be used to calculate the velocity of the particle again.
1/ 24 ( )
3p s g
pg D
gdv
Cρ ρ
ρ −
=
(A.3)
These steps are repeated several times until the adequate relative particle speed is obtained, which is 0.68 m/s in this case. In the following the pressure drop over the column is calculated. Two effects have a main influence on the pressure drop in the reactor. Firstly friction of the gas with the walls and
52
secondly the static pressure drop caused by the downward motion of the particles. The pressure drop due to friction with the walls can be calculated using the following formula.
( ) ( )2 22 12 1 2 1
2 1
12 m A wr m
P P g h h v v Aφ φ φρ ρ
− + − + − = −
(A.4)
with:
( )2 21 12 24wr w
i i
LA f v K vD
= + ∑ (A.5)
P = pressure [Pa], ρ = density [kg/m3], g = gravity constant [m/s2], h = height [m], v = velocity [m/s], φ = mass flow [kg/s], φA = added energy (which is the energy that is released or withdrawn by reaction) [J/s], Awr = energy dissipation [J/kg], f = friction coefficient (chosen to be 0.007 for moderate roughness), L = length of the tube [m], D = diameter of the tube [m], Kw = friction loss factor and the index 1 and 2 point out the location at the beginning and the end respectively. The static pressure drop caused by the downward motion of the particles can be calculated using the following formula found in literature ([58], page 4206).
s pp g hε ρ∆ = (A.6)
where ε is the holdup in the column, ρp the density of the particle, and h the height of the column. These two formula’s give a pressure drop over the vessel, where the static pressure drop has the opposite effect in the downer reactor than the friction pressure drop.
53
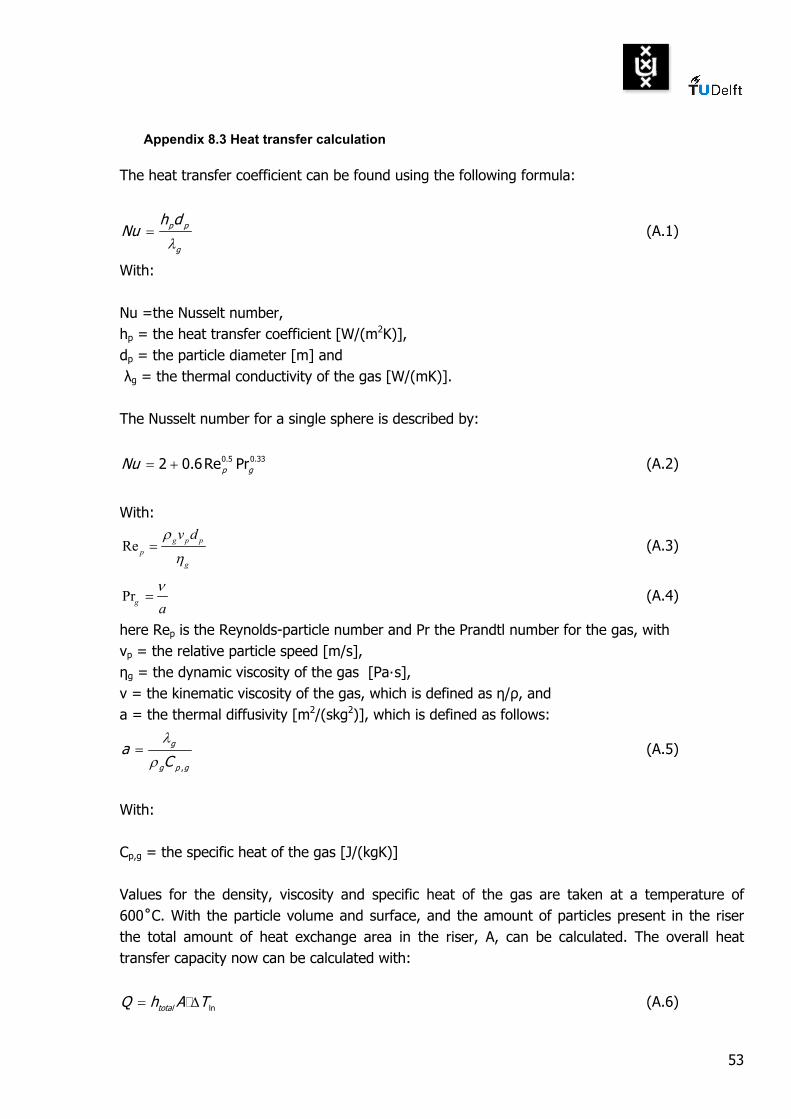
Appendix 8.3 Heat transfer calculation
The heat transfer coefficient can be found using the following formula:
p p
g
h dNu
λ= (A.1)
With: Nu =the Nusselt number, hp = the heat transfer coefficient [W/(m2K)], dp = the particle diameter [m] and λg = the thermal conductivity of the gas [W/(mK)]. The Nusselt number for a single sphere is described by:
0.5 0.332 0.6Re Prp gNu = + (A.2)
With:
Reρ
η= g p p
pg
v d (A.3)
Prν
=g a (A.4)
here Rep is the Reynolds-particle number and Pr the Prandtl number for the gas, with vp = the relative particle speed [m/s], ηg = the dynamic viscosity of the gas [Pa·s], ν = the kinematic viscosity of the gas, which is defined as η/ρ, and a = the thermal diffusivity [m2/(skg2)], which is defined as follows:
,
g
g p g
aC
λ
ρ= (A.5)
With: Cp,g = the specific heat of the gas [J/(kgK)] Values for the density, viscosity and specific heat of the gas are taken at a temperature of 600˚C. With the particle volume and surface, and the amount of particles present in the riser the total amount of heat exchange area in the riser, A, can be calculated. The overall heat transfer capacity now can be calculated with:
lntotalQ h A T= ∆ (A.6)
54
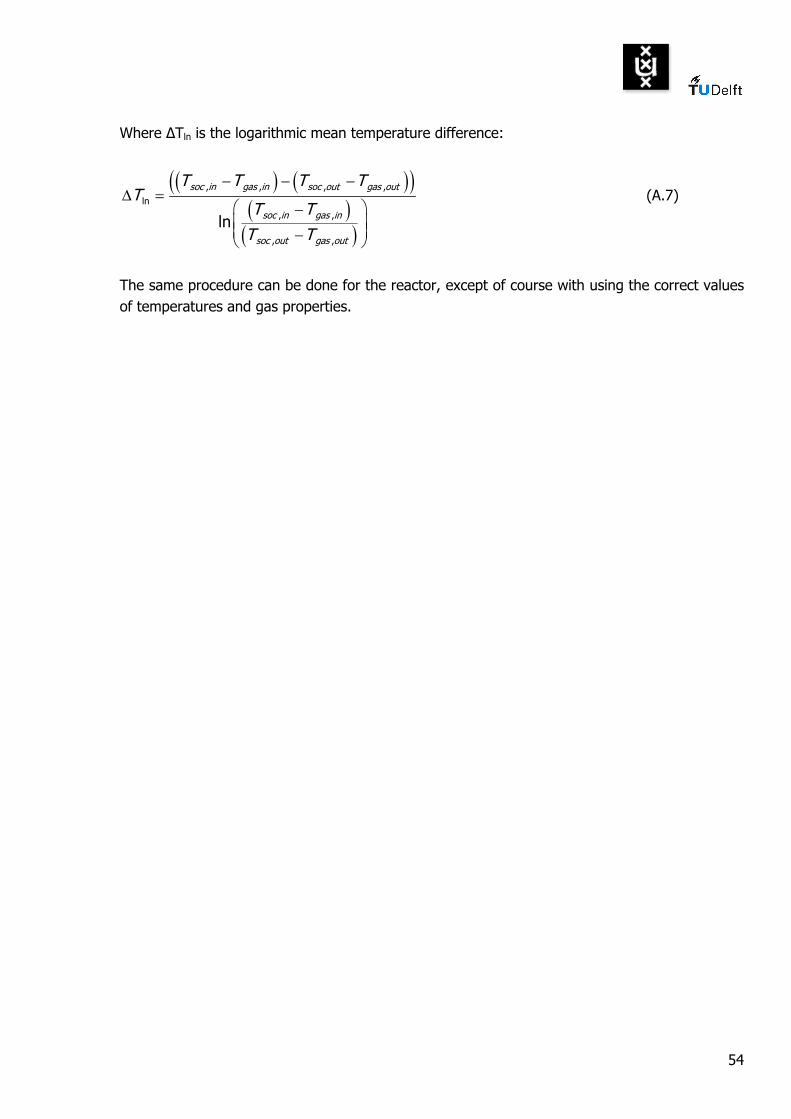
Where ∆Tln is the logarithmic mean temperature difference:
( ) ( )( )( )
( )
, , , ,ln
, ,
, ,
ln
soc in gas in soc out gas out
soc in gas in
soc out gas out
T T T TT
T TT T
− − −∆ =
− −
(A.7)
The same procedure can be done for the reactor, except of course with using the correct values of temperatures and gas properties.
55
Appendix 8.4 Calculation of column pressure drop
To calculate the column pressure drop, formulas from [21, page 571, 575] and [24, page 454, 456] are used. Estimates have to be made for the densities of the top and bottom stream, ρG and ρL and the distillate flow (D). They are based on the output of Aspen, for the simulation of the complete process, in which the column pressure drops were estimated. The flooding velocity (v) can be calculated with formula (A.1) by assuming that the F-factor (F) is equal to 1.5 for towers with 2 ft tray spacing [24].
1.5 GF v ρ= = (A.1)
The dry plate pressure drop hd can be calculated with:
2
0
51 Gd
L
vhC
ρρ
=
[mmL] (A.2)
in which C0 is the orifice coefficient, taken as 0.8 [21]. The residual head hr can be calculated with:
12500r
L
hρ
= [mmL] (A.3)
The weir liquid crest how can be calculated using an estimate for the weir length (lw), as estimate a value of 0.77 is taken [21].
750owL w
Dhlρ
=
[mmL] (A.4)
The total plate drop ht can be calculated using an estimate for the weir height (hw), as estimate a value of 80 mm is taken [21].
t d w ow rh h h h h= + + + [mmL] (A.5)
The total plate pressure drop ∆Pt can now be calculated with:
39.81 10t t LP h ρ−∆ = ⋅ [Pa] (A.6)
The column pressure drop is then:
5 1.21 10
t tP NP ∆∆ = ⋅
⋅ [bara] (A.7)
in which 1.2 is a design factor, to take a certain margin for the pressure drop in the columns. The results of this calculation are shown for column C101, C104 and C105 in the following table.
total electricity (IN) 10704 104,726,122 0.083 8.6713 6.9978
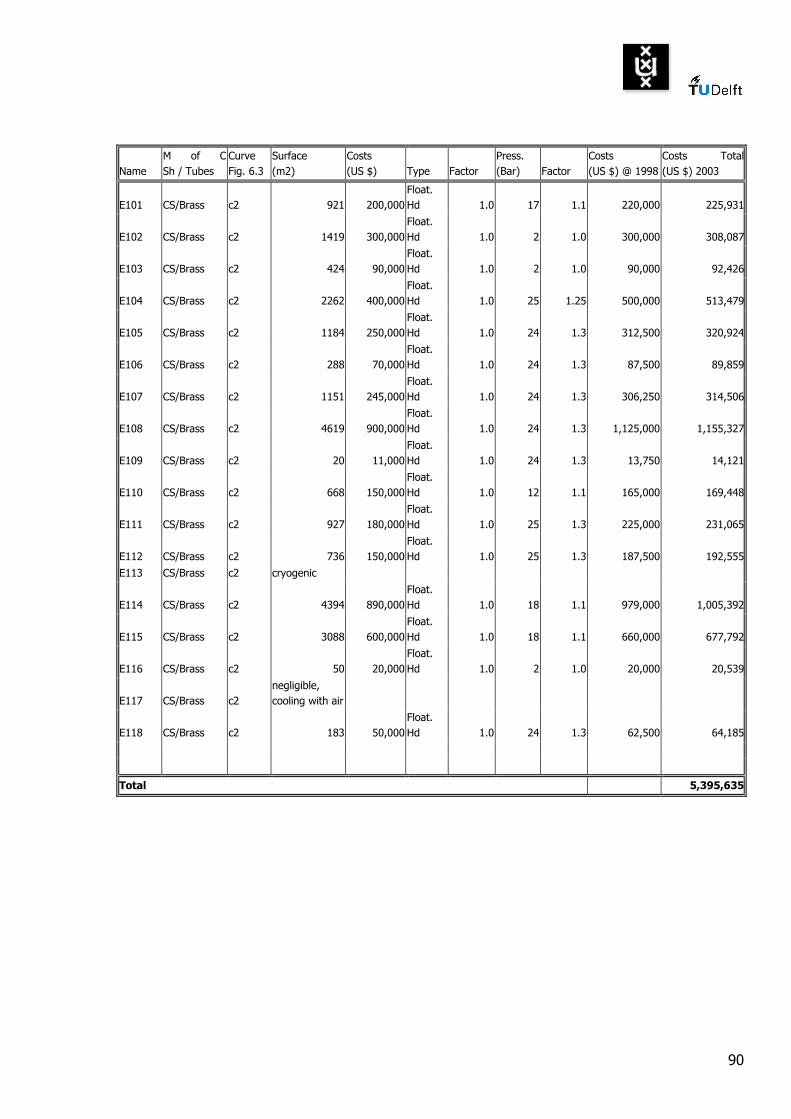
Total utilities 13.5824 10.9610
94
*: electricity expanders: kW (load) * 0.85 delivered to the net electricity compressors: kW (load) / 0.85 required from the net
Summary of production costs from table 6.6 [21]
Values euro million/a
% of total Production costs Remarks
Variable costs 1. Raw materials 43.38 56.21 2. Miscellaneous materials 0.20 0.25 10% of Maintenance 3. Utilities 10.96 14.20 4. Shipping and packaging 0.00 0.00 negligible
Subtotal A 54.54 Fixed costs 5. Maintenance 1.97 2.55 6% of Fixed capital costs
6. Operating labour 1.35 1.75
costs per operator: 90000euro, 3 operatorsper shift, 5 shifts per day
7. Laboratory costs 0.27 0.35 20% of Operating labour 8. Supervision 0.27 0.35 20% of Operating labour 9. Plant overheads 0.68 0.87 50% of Operating labour 10. Capital charges 4.91 6.37 15% of Fixed capital costs 11. Insurance 0.33 0.42 1% of Fixed capital costs
12. Local taxes 0.00 0.00 set to zero, not taken intoaccount yet
13. Royalties & Licence costs 0.00 0.00 Licence costs are set to zero
Subtotal B 9.77 Direct Production Costs
(A+B) 64.32 14. Sales expense 15. General overheads 16. Research and development
12.86 16.67 20% of Direct productioncosts
Subtotal C 12.86 Annual production cost (A+B+C) 77.18 100.00
Annual production rate (t/a) 250,000 Production costs (euro/kg) 0.3087
95
4) Calculation of economic criteria a) Net Cash Flow (NCF)
The construction time is two years; in these two years the investments will take place. The plant life time is twenty years; in these twenty years there are no investments.
Appendix 13.1 The selection of PIQUAR criteria and weighing factors
From a list of 150 criteria 29 criteria were chosen by the CPD group. From these criteria each individual present at the kick-off meeting chose 10. The results of this are shown in the table A.1. Table A.1 Selection of the piquar criteria. The choice of the principals counts four times, that of the students one time and that of Pieter Swinkels two times. The highlighted factors came out as the final ten. There were three criteria that had a score of six but only two of them could be chosen, therefore the one that was chosen by a principal and Pieter Swinkels was preferred over the one just chosen by one principal. The remaining ten criteria are shown in table A.2.
Piquar criteria
Alex Gadi Pieter Truke Maarten Marthe Marlieke Bas multiplication factor: factor: 4 4 2 1 1 1 1 1
10 Integrated risk analysis functional plant ill-defined qualitative 1 1 1 3 11 Energy efficient functional plant ill-defined quantitative 1 1 1 1 1 1 1 1 15 12 High feedstock efficiency functional plant ill-defined quantitative 1 2 13 Correct spatial planning functional plant well-defined qualitative 1 1 5 14 Optimization possibilities functional plant well-defined qualitative 1 1 2 15 No product loss functional plant well-defined quantitative 1 4 16 Waste management functional plant well-defined quantitative 1 1 1 1 7 17 Expansion possibilities functional site ill-defined qualitative 0 18 Safety for operators in plant and surrounding functional world ill-defined qualitative 1 1 6 19 Controllability operational plant ill-defined qualitative 1 1 1 1 4 20 Surroundings considered, meet locations specific demand operational plant ill-defined qualitative 1 1 5 21 Translation of client's wishes organizational plant ill-defined qualitative 1 4 22 Designer is satisfied organizational plant ill-defined qualitative 1 1 2 23 Keep alternatives during design process organizational plant well-defined qualitative 1 1 1 6 24 Design decisions are explicit and can be repeated organizational plant well-defined qualitative 1 1 3 25 Maximum room for innovation organizational plant ill-defined qualitative 1 1 2 26 Good documentation of project organizational plant ill-defined qualitative 1 4 27 Team spirit with an open mind organizational plant ill-defined qualitative 1 1 1 1 8 28 Flexibility physical plant ill-defined qualitative 1 1 29 Dismantling is safe / environmentally friendly physical world well-defined qualitative 1 2
99
Table A.2 Piquar criteria.
Criteria A Product quality and quantity B Economically feasible C Energy efficient D Intrinsically safe E Efficient use of raw materials F Waste management G Process must be robust H Team spirit with an open mind I Comply with (future) environmental legislation J Safety for operators in plant and surrounding Weighing Factor Calculation The next step was to assign values to the criteria from 1 to 10 to each criterion. From this the weighing factors can be calculated. In order to determine quantitatively the importance of each quality factor, the weighting factor has to be calculated for each criterion. The procedure is described in section 1.3.
The determined weighing factor values are shown in table A.3 Table A.3 Weighing factors
Criterion WF Product quality and quantity 0.368 Economically feasible 0.175 Energy efficient 0.092 Intrinsically safe 0.087 Efficient use of raw materials 0.081 Waste management 0.044 Process must be robust 0.042 Team spirit with an open mind 0.040 Comply with (future) environmental legislation 0.035 Safety for operators in plant and surrounding 0.034
PIQUAR Analysis When the criteria and their weighing factors are known the group will evaluate to what extent the accomplishments of each week comply with these criteria. The evaluation is done by each group member individually by assigning a value to each criterion, this is then multiplied with the weighing factor, which gives the Piquar number per individual, a value between 0 and 1. These are added up and the average is taken, which gives the Piquar number of that particular week. The recent performance factor (RPF) we have given for the recent performance is showing in the following table:
100
Table A.4 Quality Factor Evaluation
Criterion Weighing factor
Week 3 (RPF)
Un-quality factor
Product quality and quantity 0.368 0.26 0.27 Economically feasible 0.175 0.14 0.15 Energy efficient 0.092 0.24 0.07 Intrinsically safe 0.087 0.14 0.08 Efficient use of raw materials 0.081 0.20 0.07 Waste management 0.044 0.04 0.04 Process must be robust 0.042 0.18 0.03 Team spirit with an open mind 0.040 0.40 0.02 Comply with (future) environmental legislation 0.035 0.20 0.03 Safety for operators in plant and surrounding 0.034 0.12 0.03 The un-quality factor is calculated based on the correlation: UQF = Weighting Factor ×(1-RPF) (A.1) where UQF is the un-quality factor, and RPF is the recent performance factor given by the group members. The quality factor in the design group so far is 21%, which is calculated from the equation: QF = 1-Sum (UQF) (A.2) From the result shows in the figure below we know that in the future period in order to improve the performance on quality factor, we should especially put more attention on “Product quality and quantity” and “Economically feasible” criterion to decrease the un-quality value.
9 Safety for operators in plant and surrounding 7 6 10 9 10 5 9 10 8.54
10 Team spirit with an open mind 8 9 7 6 7 9 2 8 6.63
Each group member assigned weighing factors from 1 tot 10 for each criterion, which is shown in the table above. Again the vote of the principals counts 4 times and Pieter’s vote 2 times that of the students. The importance decreases from 1 to 10.
102
From this the following matrix can be obtained which gives the importance of the criteria relative to another: Now the method will be described that was used to determine the weighing factors that are used in the Piquar method. Table A.6 Importance relation matrix of the weighing factors.
5: Ci is extremely more important than Cj. 4: Ci is strongly more important than Cj. 3: Ci is essentially more important than Cj. 2: Ci is moderately more important than Cj. 1: Ci is equally important to Cj. 1/2: Ci is of moderate inferiority to Cj. 1/3: Ci is of essential inferiority to Cj. 1/4: Ci is of strong inferiority to Cj. 1/5: Ci is of extreme inferiority to Cj. The criteria are shown in table A.7. Table A.7 Piquar criteria.
Safety for operators in plant and surrounding A
Comply with (future) environmental legislation B
Team spirit with an open mind C
Process must be robust D
Waste management E
Efficient use of raw materials F
Intrinsically safe G
Energy efficient H
Economically feasible I
Product quality and quantity J
103
From table A.6 the weighing factors can be calculated using the following method. The eigenvalues form the matrix of table A.6 are shown in table A.8: Table A.8 Eigenvalues table A.6.
The first eigenvalue was chosen to be the most suitable for calculating the weighing factors. From the vector belonging to the first eigenvalue the weighing factors could be calculated, they are shown in table A.9. Table A.9 Piquar weighing factors. Product quality and quantity 0.319 Economically feasible 0.189 Energy efficient 0.099 Intrinsically safe 0.094 Efficient use of raw materials 0.088 Waste management 0.048 Process must be robust 0.045 team spirit with an open mind 0.043 Comply with (future) environmental legislation 0.038 safety for operators in plant and surrounding 0.037