146
Protecting World Heritage from Natural Hazards through Earth Observation Technology July 4, 2016 Beijing Fang Chen [email protected]

Protecting World Heritage from Natural Hazards through Earth Observation Technology
July 4, 2016 Beijing
Fang Chen [email protected]

Disaster Risks Management
Disaster Risks for World Heritage
EO Data for Disaster Risks Management
Outline

Global Disaster
• Every year, 200 million people affected by droughts, cyclones, earthquakes, wildlandfires, and other hazards
• Increased population densities, environmental degradation and global warming adds to impacts http://www.preventionweb.net/files/31685_factsheet2012.pdf

What is a disaster?
Disaster is defined as a serious disruption of the functioning
of a community or a society causing widespread human,
material, economic or environmental losses which exceeds
the ability of the affected community or society to cope
using its own resources (UNISDR, 2002).
Disaster Hazards

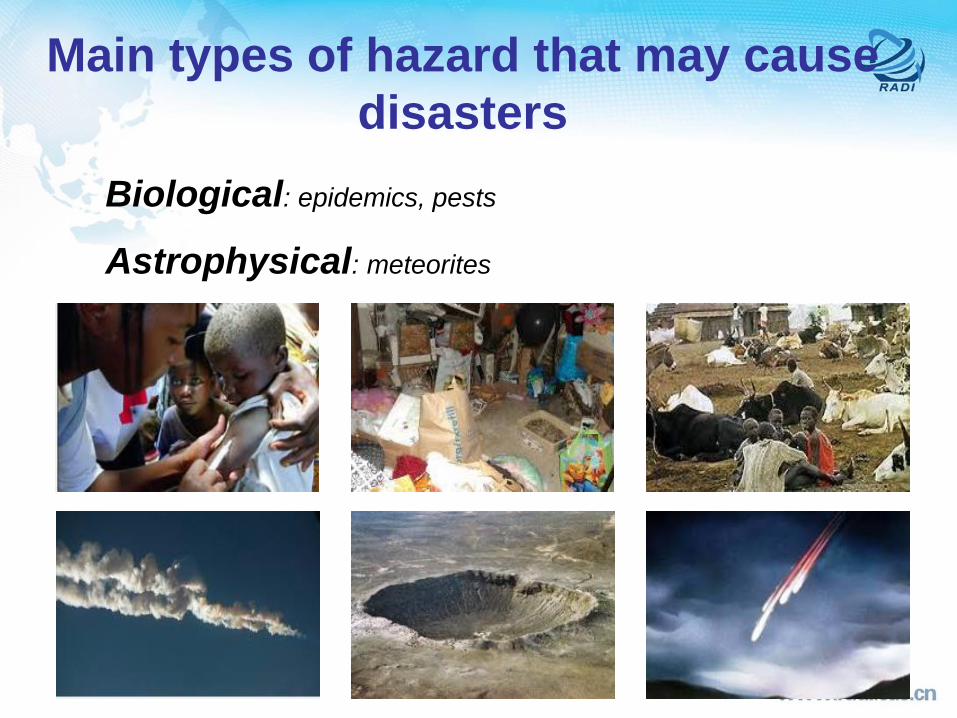
Main types of hazard that may cause
disasters
Meteorological: hurricanes, tornadoes, heat-waves, lightning, fire

Main types of hazard that may cause
disasters
Hydrological: floods, flash-floods, tsunamis

Main types of hazard that may cause
disasters
Geological: volcanoes, earthquakes, mass movement
(falls, slides, slumps)
Main types of hazard that may cause
disasters
Biological: epidemics, pests
Astrophysical: meteorites

Main types of hazard that may cause
disasters
Climate change: increased storm frequency and severity,
glacial lake outburst floods

Main types of hazard that may cause
disasters
Human-induced: armed conflict, fire, pollution, infrastructure
failure or collapse, civil unrest and terrorism

Relationships of natural hazards and
human-induced hazards

12
L’AQUILA EARTHQUAKE ITALY, 2009

13
HAITI EARTHQUAKE 2010

CHRISTCHURCH EARTHQUAKE 2010

15
EARTHQUAKE AND TSUNAMI JAPAN 2011

Turkey - Van Earthquake October 23 2011

PAKISTAN FLOOD, 2010
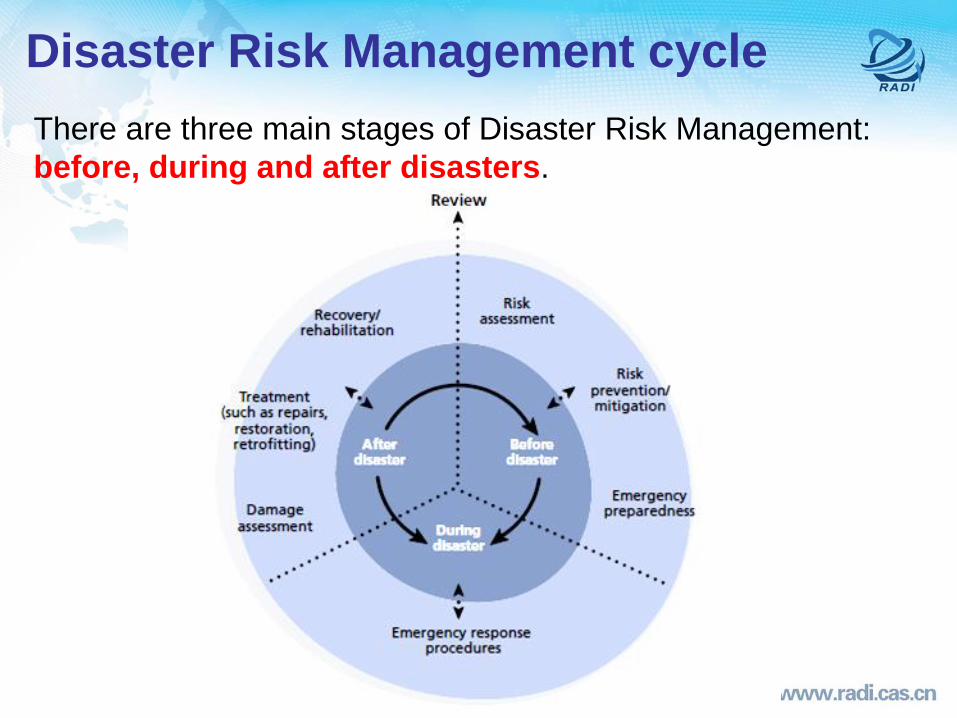
Disaster Risk Management cycle
There are three main stages of Disaster Risk Management:
before, during and after disasters.

Disaster Risk Management cycle
Emergency preparedness to be
undertaken before a disaster includes
measures such as creating an
emergency team, an evacuation plan
and procedures, warning systems and
drills and temporary storage.
The preparedness activities to be undertaken before a disaster include
risk assessment, prevention and mitigation measures for specific hazards
(maintenance and monitoring and formulating and implementing various
disaster management policies and programmes).
Before

Disaster Risk Management cycle
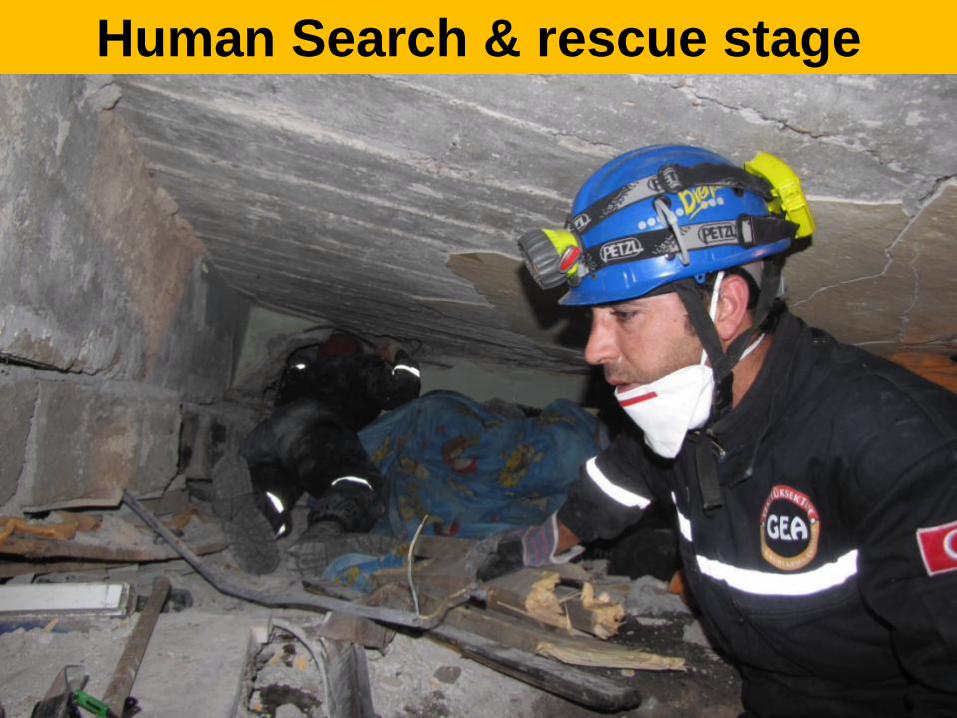
During a disaster situation, which is usually considered to last for the
first 72 hours after the incident, various emergency response procedures
for saving people as well as heritage need to be developed and practiced
beforehand.
During

Earthquake
GEA SAR ARCHIVE 2011
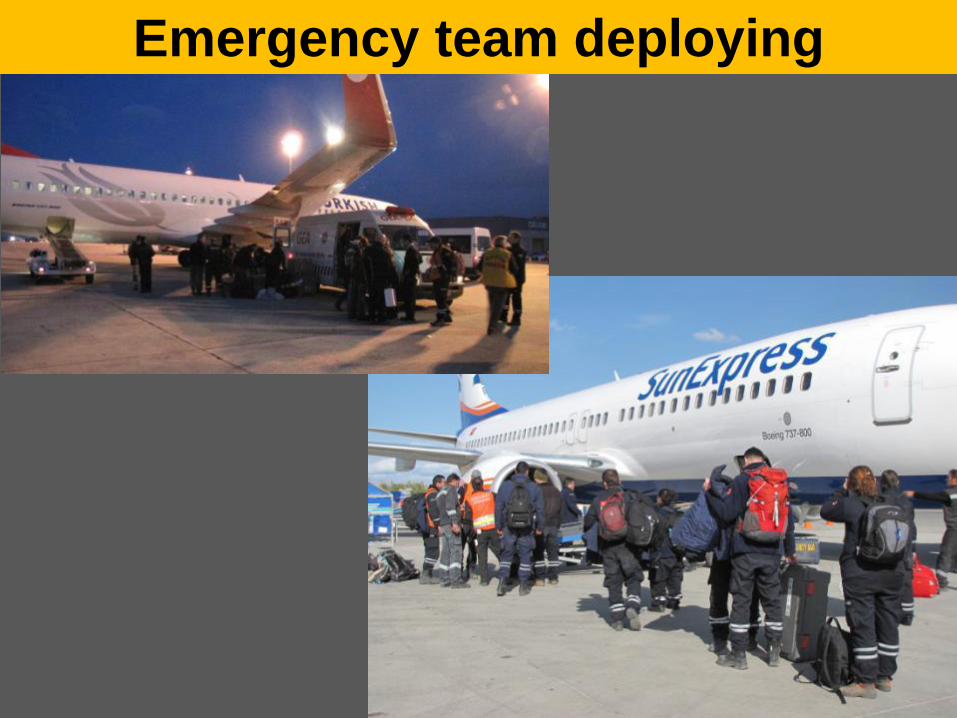
Emergency team deploying

Emergency team deploying

Human Search & rescue stage

Human Search & rescue stage
Human Search & rescue stage

Human Search & rescue stage
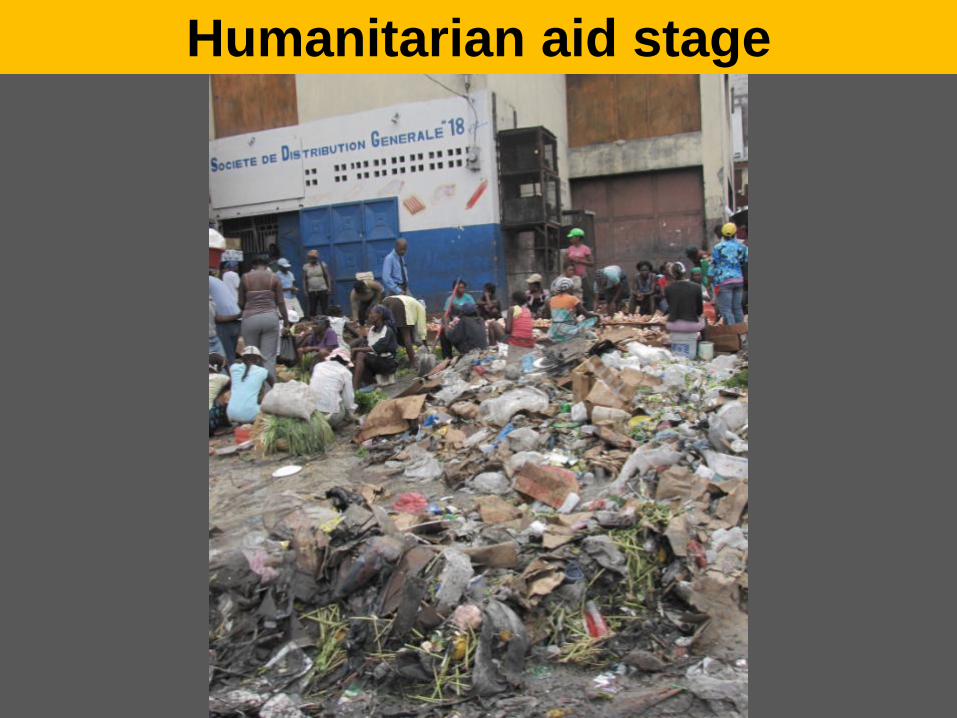
Humanitarian aid stage

Humanitarian aid stage

Humanitarian aid stage

Humanitarian aid stage

Humanitarian aid stage

Disaster Risk Management cycle
Activities initiated after the disaster include damage assessment,
treatment of damaged components of the property through interventions
such as repairs, restoration and retrofitting and recovery or rehabilitation
activities.
After
Disaster Risk Management is
concerned with preparedness
for all these activities to be
undertaken before, during and
after the disaster.

Damage Assessment stage

Damage Assessment stage

Damage Assessment stage


Damage Assessment stage

Damage Assessment stage

Damage Assessment stage

Essential characteristics of a DRM plan
A plan is essential for providing clear, flexible and practical for the site
manager and their team.
a DRM plan should not consist merely of a list of actions. Rather, it should
describe the processes which, for different situations, should be followed
by the responsible authorities in deciding and implementing the appropriate
actions.
clearly state the main objectives and process of the plan, the scope,
target audience and the agencies responsible for its implementation
based on identifying and assessing the main disaster risks that might
result in negative impacts to the property as well as to human lives and
assets at the site.

Main components of a Disaster Risk
Management plan

Disaster Risks Management
Disaster Risks for World Heritage
EO Data for Disaster Risks Management
Outline

Impact may disasters have on World
Heritage
All World Heritage properties can be exposed to one or
more types of disaster.
Over the last few years, natural and human-induced
disasters have caused enormous losses to World
Heritage properties.

Impact may disasters have on World
Heritage
Bam (Islamic Republic of Iran) due to earthquake in 2003
Before
After

Impact may disasters have on World
Heritage
Bam (Islamic Republic of Iran) due to earthquake in 2003

Impact may disasters have on World
Heritage
Bam (Islamic Republic of Iran) due to earthquake in 2003

Impact may disasters have on World
Heritage
After

Impact may disasters have on World
Heritage
Edinburgh Old Town Fire - December 2002

Impact may disasters have on World
Heritage
Temple of the Tooth Relic in Kandy (Sri Lanka) after
terrorist attack in 1998

Impact may disasters have on World
Heritage
Global climate change is also exposing World Heritage
natural properties and the ecological systems that sustain
life to increasing disaster risks.
Disasters pose risks not only to the physical attributes that
carry the heritage values of the property, but also to the
lives of visitors, staff and local communities living on
the site or in neighboring areas, and also to important
collections and documents.

Why Protect Heritage?
Heritage drives sustainable development and local
economies
Disasters are driving losses to heritage
Climate change and conflicts threaten heritage
Heritage contributes to resilience
Heritage is not being sufficiently protected

Why Protect Heritage?
Heritage drives sustainable development and local
economies
In Europe, for instance, heritage is vital
to the competitiveness of tourism, which
is valued at 586 billion euros (€) per
annum and employs 9.7 million people.
Rice Terraces of the Philippine Cordilleras
Cultural heritage is also a powerful asset for inclusive economic development, by
attracting investments and promoting green, locally based, stable and decent
jobs related to a wide range of sustainable activities in areas such as tourism,
conservation, construction, food production, traditional healing and, the
production of crafts of all kinds and the arts in general.

Why Protect Heritage?
Disasters are driving losses to heritage
Heritage is exposed to a number of threats from urbanization,
development pressures, socio-economic transformations,
unsustainable tourism and lack of resources.
The impact of disasters on heritage can also be severe. More
cultural heritage is lost in disasters than is ever fully accounted.

Why Protect Heritage?
Disasters are driving losses to heritage
Damage to one of
the turrets at the
Castle of Ferrara
during the
earthquake
in 2012, Italy.

Why Protect Heritage?
Disasters are driving losses to heritage
Earthquake damage
to the Catholic
Basilica in
Christchurch, New
Zealand

Why Protect Heritage?
Disasters are driving losses to heritage
Damage to Cultural
Heritage in Leh,
India due to Cloud
Burst in 2010

Why Protect Heritage?
Disasters are driving losses to heritage
Flood Risk to World Heritage Cities

Why Protect Heritage?
Disasters are driving losses to heritage
Landslide Risk to World Heritage Cities

Why Protect Heritage?
Disasters are driving losses to heritage

Why Protect Heritage?
Climate change and conflicts threaten heritage
A survey was launched by the World Heritage Centre
among all States Parties to the World Heritage
Convention to assess the extent and nature of the
impacts of climate change on World Heritage properties.
A total of 125 World Heritage sites were mentioned
specifically as threatened by climate change.

Why Protect Heritage?
Climate change and conflicts threaten heritage
Conflicts and political tensions often have a disastrous
impact on heritage sites.
The Citadel at
Aleppo, Syria has
suffered major
damage due to
ongoing conflict.

Why Protect Heritage?
Climate change and conflicts threaten heritage
Repair work at Timbuktu, Mali.
The World Heritage site has
suffered significant damage
during civil unrest

Why Protect Heritage?
Heritage contributes to resilience
In the same way that biological diversity increases the resilience of
natural systems, cultural diversity has the capacity to increase
the resilience of social systems.
Traditional construction technologies that have evolved through trial
and error are often very resilient because of indigenous knowledge
that has enabled these technologies to manage local hazards and
use local materials.

Why Protect Heritage?
Heritage contributes to resilience
Traditional ‘Bhunga’ dwellings in Gujarat, India survived 2001 earthquake

Why Protect Heritage?
Heritage is not being sufficiently protected
Identified
& Considered Plan
Not Identified
Identified
No plan
Identified
& Planed

Disaster Risk Management for heritage
DRM aims to prevent or reduce the negative impacts of disaster on
World Heritage properties.
The values for which the property was inscribed on the World Heritage
List should be the foundation on which all other plans and actions are
based (all other plans for Heritage ).
DRM for heritage is concerned not only with protecting the property from
major hazards but also with reducing underlying vulnerability factors.
The risks to cultural and natural heritage that DRM must address may
originate inside the property or in the surrounding environment.

Disaster Risk Management for heritage
DRM plan linked to the site management plan of a heritage property
Lack of coordination between the site management systems for the
particular heritage property and the organizational set-up, policies and
procedures for disaster management in the city or region in which the
property is located.
GAPS

Analyze the factors that may cause disaster
risks to your property
Step 1 Step 2 Step 3 Step 4

Analyze the factors that may cause disaster
risks to your property
Step 1- List natural and human-induced
Listing all the natural and human-induced hazards that expose the
property to disaster risks. These would include primary hazards with
potentially disastrous impact, such as earthquakes, as well as slow and
progressive secondary hazards, or underlying risk factors, such as
changes in natural vegetation due to rising ground water or
changes in ground water quality due to pollution.

Analyze the factors that may cause disaster
risks to your property
Step 2- Identify vulnerability factors
Identifying the processes that might, in combination with
a primary hazard, cause disaster risk to the property.
-evaluating the performance of existing management systems
and disaster preparedness measures
-analyzing the potential negative impacts of existing damage and
deterioration patterns or phenomena
-analyzing the underlying risk factors relating to the surrounding
environment that increase the property’s vulnerability
-analyzing the potential negative effect of poor restoration
done in the past.

Analyze the factors that may cause disaster
risks to your property
Step 3- Analyze ‘cause-effect relationships’
the ‘cause-effect’ relationships between various primary
hazards and underlying risk factors that increase the
property’s vulnerability and expose it to disaster risk.

Analyze the factors that may cause disaster
risks to your property
Step 4- potential impact on heritage
values
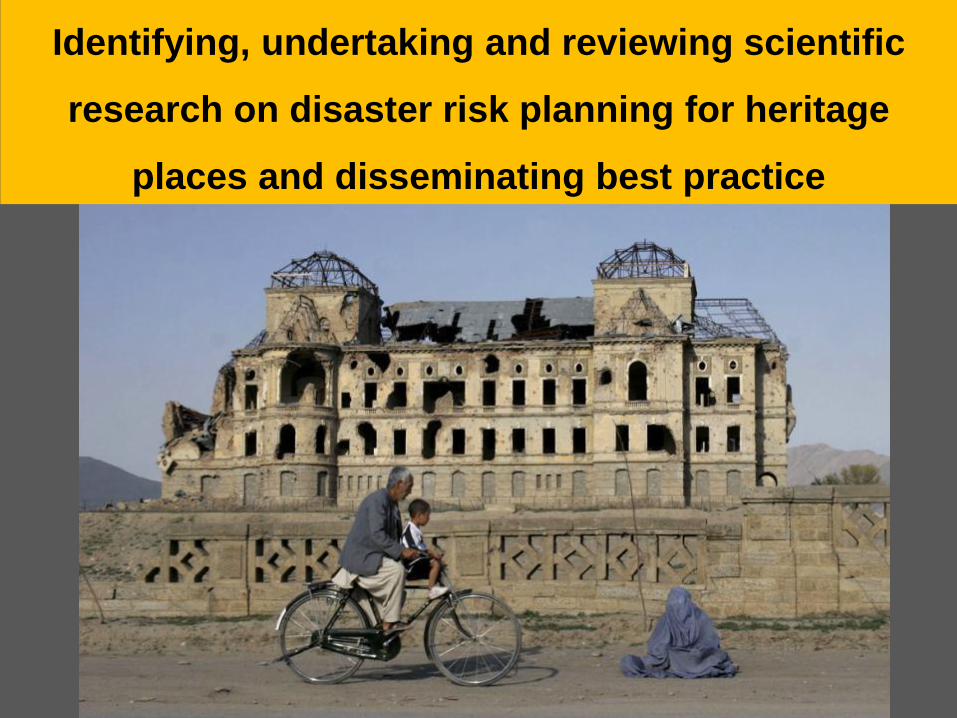
Identifying, undertaking and reviewing scientific
research on disaster risk planning for heritage
places and disseminating best practice

Creating knowledge, delivering training and building
capacity to reduce the loss of heritage

Collaborating with international, national and non-
governmental organizations to integrate the
protection of cultural heritage places into disaster
risk planning

Disaster Risks Management
Disaster Risks for World Heritage
EO Data for Disaster Risks Management
Outline

78

Impacts of Disasters in
Asia-Pacific (2000-2012)
720776
60.3%
473950
39.7%
Asia-Pacific Rest of World
No. of people killed in the Asia-Pacific
581
132548
351715
231125
2839 831
Source: UNISDR analysis based on data from the Centre for Research on the Epidemiology of Disasters, EM-DAT
79

80

Earth Observation:
A continues vision of our planet
DATA
Earth Observation Earth System
Scientific Research & Human Society 81

EO for Disaster Mitigation
Earth Observation Systems
Air Ship
Earthquake Drought Tsunami 82

Early Warning Systems
Monitoring systems
Disaster management (Resource management and Planning, emergency logistics, land use regulation)
Land use plans, legal framework for DRR, EWS, resilience (infrastructures, community
preparedness and awareness building).
Models
Risk assessment Damage
Assessment
Socio economic data
Real time In situ observations Past events magnitude/frequency
NRT products (rapid mapping) Earth Observations (RS and in-situ measurement) in
put
Forecasting Models
Years days hours weeks months
A (very simplified) logic model for disasters
Mitigation and prevention preparedness response recovery
phase
outp
ut
outc
om
e
83

flood
84

SPOT-5 for Africa floods (ICSMD) DMC L1R for Vietnam floods (ICSMD)
2008/11/9
Flood area
2011/4/5
Flood area SPOT 5 was launched on May 4, 2002.
They offer a higher resolution of 2.5 to 5
meters in panchromatic mode and 10
meters in multispectral mode.
The Disaster Monitoring Constellation (DMC)
consists of a number of remote sensing satellites
and operated for the Algerian, Nigerian, Turkish,
British and Chinese governments.
EO for Flood Monitoring- Optical Sensor
Optical Sensor for Monitoring-SPOT-5
Optical Sensor for Monitoring-DMC 85

Flood in 2010 Pakistan
86
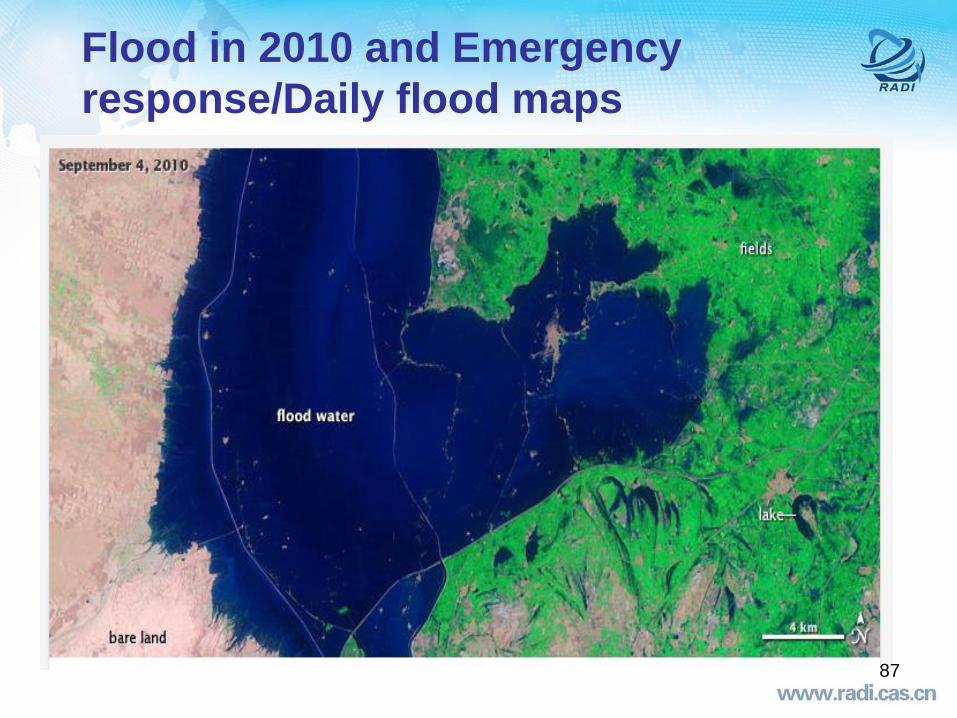
Flood in 2010 and Emergency
response/Daily flood maps
87

88

89

Worldview -2 (USGS)
WorldView-2 satellite sensor, launched October
8, 2009, provides 0.46m Panchromatic (B&W)
mono and stereo satellite image data.
EO for Flood Monitoring
High resolution satellite for floods monitoring
90

Flooded area monitoring using
Unmanned Aerial Vehicle, UAV
91

Flooded area monitoring using
Unmanned Aerial Vehicle, UAV
92

93
Flooded area monitoring using
Unmanned Aerial Vehicle, UAV

TXS-1 for Africa floods (DLR) ALOS for Vietnam floods (UNOSAT)
SAR satellite and has the disaster
monitoring ability of large scale, all
weather, all day and night and
dynamic.
0 5 km
0 2 km
EO for Flood Monitoring
- Microwave Sensor
Microwave Sensor for Monitoring
94

95
Flowchart of Making Rapid Flood Map
through Microwave Sensor
96
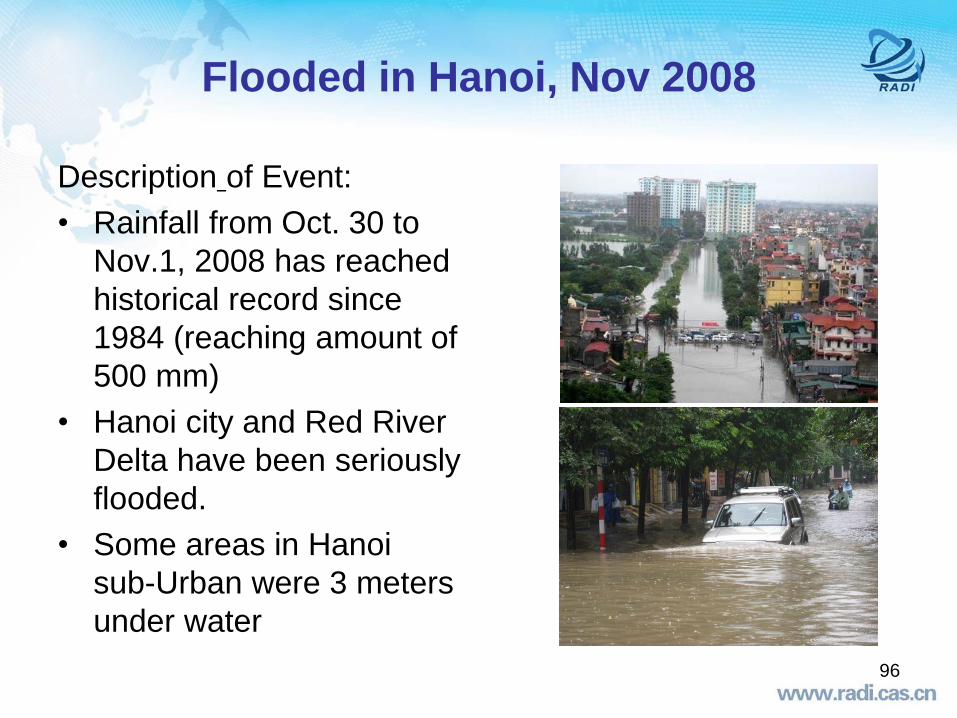
Flooded in Hanoi, Nov 2008
Description of Event:
• Rainfall from Oct. 30 to
Nov.1, 2008 has reached
historical record since
1984 (reaching amount of
500 mm)
• Hanoi city and Red River
Delta have been seriously
flooded.
• Some areas in Hanoi
sub-Urban were 3 meters
under water

97
HANOI Flood Rapid Map
• Requested to ESA for ASAR
image in 2nd, Nov, 2008 by
NRSC.
• Also Activated on International
Charter by UNDP in 5th, Nov,
2008 to acquire Radar images.
• ASAR/WS acquired by
Vietnam Ground Station,
NRSC in 7th, Nov 2008.
• Making Flood Rapid Map with
ASAR/WS resolution 75m,
HH Polarizaton and GIS data.

98
HANOI Urban Flood Rapid Map
• Data Retreived from
Infoterra in 8th, Nov,
2008.
• Data type: TerraSar
3m resolution.
• Flood areas were
mapped based on
TerraSar image and
GIS data.

TRMM Precipitation Monitoring (UNOSAT)
TRMM(Tropical Rainfall Measuring
Mission)designed to improve our
understanding of the distribution and
variability of precipitation within the
tropics as part of the water cycle in the
current climate system.
0 175 km
EO for Flood Warning
Precipitation Monitoring for Floods Warning
99

Flood simulation
100
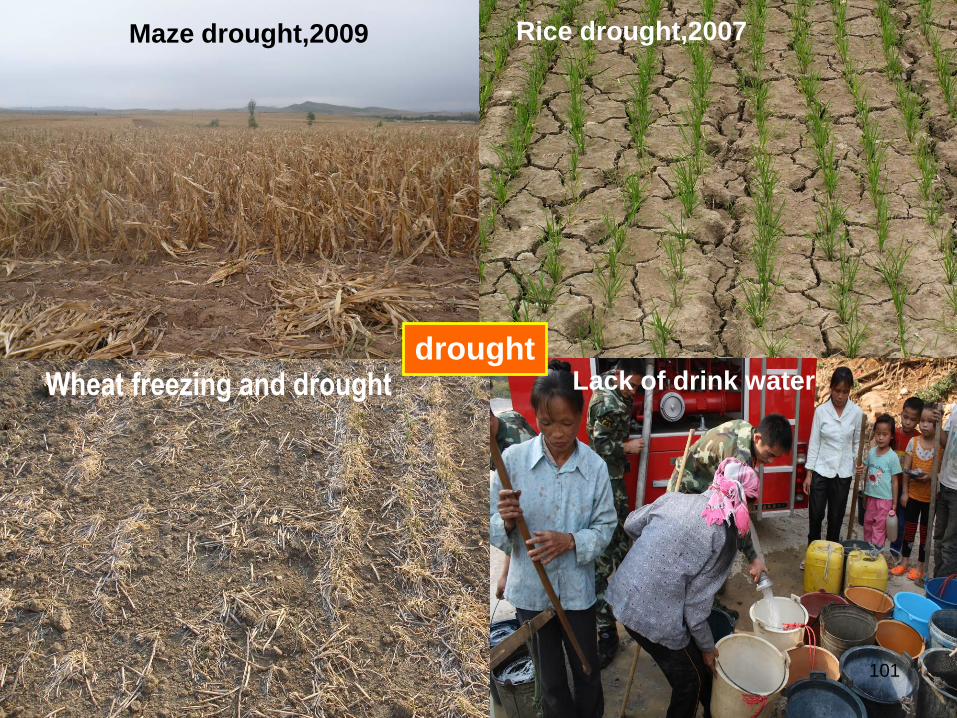
Maze drought,2009 Rice drought,2007
Wheat freezing and drought Lack of drink water drought
101

Measuring Drought
Composite Indices
-Crop moisture index
-Palmer index
- Keetch index
Single data
- Precipitation
- Temperature
- Stream flow
Remote sensing
-NDVI(Normalized Difference Vegetation Index)
-VCI (Vegetation Condition index)
-Prediction
1980’s
1900’s
1960’s
102

Palmer Drought Severity Index (PDSI) Complex function of rainfall and evaporation.
Better for large areas of uniform topography.
Standardized Precipitation Index (SPI) Based entirely on rainfall data. Flexible –
applies to various durations. Measures rainfall
deficiency in a common currency – standard
deviation units. Could be used to compare
different regions. Simple and popular.
Deciles Based entirely on rainfall data. Level of dryness
is expressed in scores related to cumulative
statistical distribution of rainfall.
Percent of normal Based on rainfall. Most straightforward. Region-
specific.
Many more exist. New indices continue to emerge.
Monitoring drought
103

Between July 2011 and mid-2012,
a severe drought affected the entire
East Africa region. Said to be "the
worst in 60 years", the drought
caused a severe food crisis that
threatened the livelihood of 9.5
million people.
MODIS can provide consistent, spatial
and temporal comparisons of global
vegetation conditions .
MODIS Vegetation Maps(UN-SPIDER) MODIS Drought Index Maps(UN-SPIDER)
Dry
Wet
0 600 km
0 1200 km
Monitoring drought
104

water(2011)
water(2010)
DI increase
DI reduce Vegetation Cover (2011) Vs. Average Vegetation
Cover 2001- (USAID)
Drought Index Comparison (UN-SPIDER)
increase reduce
0 1200 km
0 20 km
Temporal Comparison of Drought
Impacts through Satellite Data
Monitoring drought
105

ET(mm/day) 2011/07/02
Precp.(mm/day) 2011/07/02 Rate of Soil Mois.(%) 2011/07/02
Air Temp. (℃) 2011/07/02
http://hydrology.princeton.
edu/~justin/research/proje
ct_global_monitor/
Drought modeling
106

Earthquake
107

• Time: 12/05/2008 12:28PM;
• Magnitude: Ms.8.0;
• Location of epicenter: 103.4E, 31 N;
• Geographic Location: Wenchuan,Beichuan,Sichuan
province, China;
• Depth of Seismic focus: 14KM;
• Epicentral Intensity: 11Degree;
• Casualty: Death 69142, Missing 17551.
Wenchuan Earthquake
108

Wenchuan Earthquake
Satellite remote sensing data collection
Archive data :IRS-P6、LANDSAT-5、SPOT-5、
RADARSAT-1、SPOT2/4、QUICKBIRD、IKONOS, all
together 96 scenes。
Data programming:LANDSAT-5、SPOT-5、RADARSAT-1、RADARSAT-2、SPOT2/4、 TERRASAR-X 、EROS-B、 QUICKBIRD、ALOS、IKONOS、WORLDVIEW、COSMOS satellites 。
109

Data class Attribute Amount
Satellite 17 satellites 400 scenes
Airborne 0.5m resolution SAR data 14.9TB、39,000km2
0.5m resolution Optical data 5.3TB、23,700km2
UAV 0.1-0.35m resolution Optical data
More than 5000 scenes
One year later data
X\L\C SAR data 3TB
0.5m resolution Optical data 2.5TB
Wenchuan Earthquake
110

Unclassified – For Internal Use Only
Data collection - Oversea data with
Charter
111

5-14~5-28,16 flies
Area:23,700km2
Resolution :0.5-0.7m
Amount :5.3TB
光学遥感覆盖范围示意图
Data collection - Airborne
112

5-14~5-29,16flies
Area :39,000km2
Resolution :0.5m
Amount :14.9TB
Data collection – SAR Data
113

geology disaster after
earthquake
ALOS for landslide
image in Xiao Maoping Wenchuan County in 5.15
Geology disaster in Chenjiaba Beichuan
50% surface has been destroyed , such as
landslides and collapse form after-quake- lakes。
114

Yingxiu house collapses
For man interpretation For auto extraction with texture and spectrum feature
Beichuan house collapses
House collapses monitoring
115

Caculated 102 county’s house collapse rates
116

Barrier Lakes
Remote sensing
images detected
46 Barrier lakes
in the
earthquake hit
area, and the
Tangjiashan
barrier lake was
the famous one
among them.
117

water level monitor in Tang Jiashan lake with optical and SAR
Tangjiashan lake
5.14 16 19 23 24 25 26 31
2008年5月16日
Barrier Lakes monitoring
118
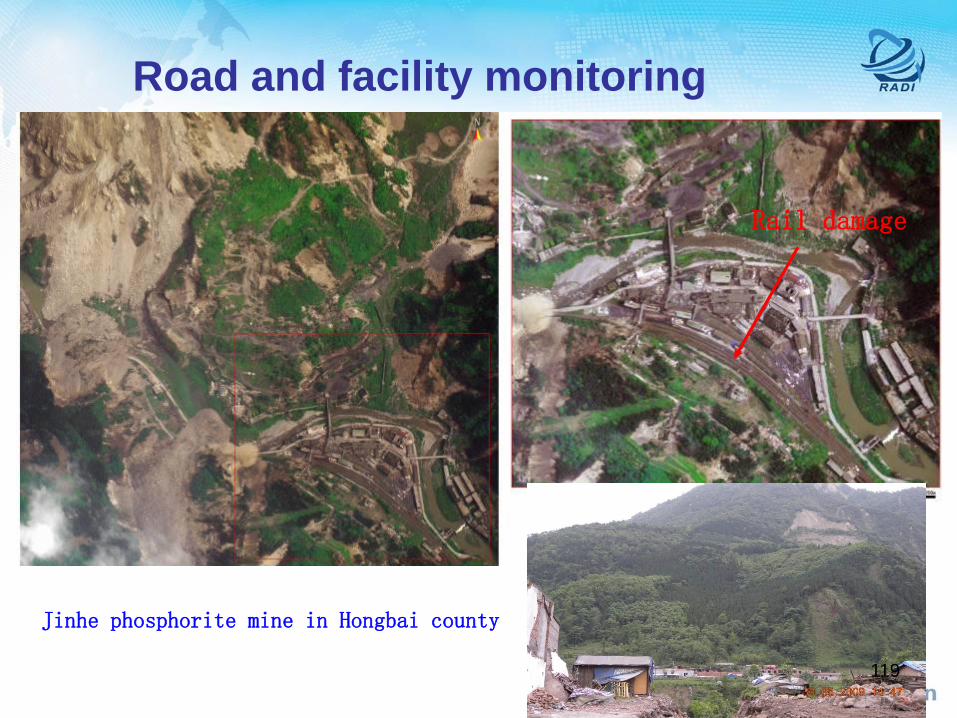
Jinhe phosphorite mine in Hongbai county
Rail damage
Road and facility monitoring
119

A
B C
D
外
江 内
江
金
刚
堤
玉垒山
离堆公园
F E
A:秦堰楼
B:二王庙
C:安澜索桥
D:飞沙堰
E:宝瓶口
F:伏龙观
Ancient architecture damaged in Du Jiangyan
宝瓶口 飞沙堰
二王庙
Road and facility monitoring
Du Jiangyan key water control project is good after earthquake
120

Zoology damage monitoring
Long Chigang before earthquake Long Chigang after earthquake
121

Landscape
before in Yinxing
2007-5-9
Landscape
after in Yinxing
2007-5-16
Zoology damage monitoring
122

2008-5-23 2008-5-16
Agricultural damage monitoring
123

Broken road
Good road
“SOS700”in
the image
collected in
5.16。
Civilian rescue and monitoring
124

125

A. Beichuan Middle
School
B. Agriculture Bank
C. Beichuan Hotel
3D in Wenchuan area
126

北川中学
北川中学
震后北川县城
3D in Wenchuan area
127

Beichuan County Before
Earthquake
Beichuan County After
Earthquake
128

129
Capacity Development for Disaster Mitigation in Developing Countries

2.0 Tln.
Damage
4.4 Bln.
Affected
About 64% of the Earth population
1.3 Mil.
Killed
Comparable to the number of victims in 1500 А380 (853
passengers each) accidents
Impacts of Disasters (1992-2012)
TOP 10 COUNTRIES IMPACTED BY DISASTERS
Source: UNISDR report of June 13, 2012
130

Sustainable Development &
Disaster Mitigation
Disasters
Oceans Energy Water
Jobs Food Cities
7 Critical Issues at Rio+20
Source: Rio+20 Conference Website
We need new technologies for disaster mitigation
131

Support all phases of the risk
management cycle associated
with hazards (mitigation and
preparedness, early warning,
response, and recovery).
International Programs
- GEO Disasters SBA Created in 2005, to develop a coordinated and sustained Global Earth
Observation System of Systems (GEOSS) to enhance decision making in nine
Societal Benefit Areas (SBAs).

Information Systems for Hydro-meteorological Extremes
Development of a Global
Drought Information System
that will integrate global,
continental, and regional
scale monitoring and forecast
information with high enough
accuracy to assist in early
warning efforts.
Source: Alfieri et al. 2013
GEO Disasters SBA
133

134

135

136

137

138

139

Disaster Monitoring in Asia-Pacific
Organizations and Networks
CAS-TWAS CoE on Space Technology for Disaster Mitigation
International Center for Drought Risk Reduction
Asian Disaster Preparedness Centre
Asian Disaster Reduction Centre
Asian Disaster Reduction & Response Network
International Water Management Institute
Asian Development Bank
UNESCAP
140

The Mechanism is intended to provide
satellite products for drought monitoring
and also to assist members in developing
localized products and services for relevant
decision making.
16 September 2010, the United Nations Economic and Social Commission for
Asia and the Pacific (ESCAP) launched in to service a Regional Cooperative
Mechanism on Drought Monitoring and Early Warning in Nanjing, China.
Drought Monitoring in Asia-Pacific
141

Drought Monitoring in Asia-Pacific
The Regional Integrated Multi-Hazard Early Warning System for
Africa and Asia (RIMES)
RIMES is established with support from
ESCAP. At RIMES, a drought early warning
system (DEWS) is being adapted to identify
climate and water supply trends in order to
detect the probability and potential severity of
drought.
142

CAS, Beijing, China TWAS, Trieste, Italy
Joint Research
Program
Education &
Training Workshop
Scientific Report &
Advisory Services
Conference &
Seminar
CAS-TWAS Centre of Excellence on Space Technology for Disaster Mitigation(SDIM),
aims to enhance scientific and research capacities for disaster mitigation in developing
countries through the use of the most advanced space technologies. The centre is hosted
at RADI, CAS.
About Centre
143

Elements of Disaster Mitigation
6.Disaster Research to Policy
1. Drought Observing Systems 2. Drought Data Systems 3. Drought Modeling
5. Capacity Development 4. Drought Management Theory
144

Technology
Broadband Internet
- Drought data distribution
High Processing Speed
-Drought data analysis
Global Sensor Webs
- Drought data collecting
Development
Servers
-Drought data storage
Software
-Drought data application
Virtual globes
Data and Products Remote Sensing and GNSS Data Sensor Webs Data Users and Consumers Contributed Data Social Networks Data
Users
Professional -Research
Public
-Service
Value Adders
DE can provide significant support
Disaster Mitigation in Digital Earth
The Digital Earth Paradigm
- Drought data display
Government
-Management
145


