Page 1
Protein-Lipid Interactions with Pulmonary Surfactant Using Atomic Force
Microscopy
DISSERTATION
Presented in Partial Fulfillment of the Requirements for the Degree Doctor of Philosophy
in the Graduate School of The Ohio State University
By
Minette Ocampo
Graduate Program in Chemistry
The Ohio State University
2014
Dissertation Committee:
Professor Heather C. Allen, Advisor
Professor Barbara E. Wyslouzil
Professor Dennis Bong
Professor Govindasamy Ilangovan
Page 2
Copyright by
Minette C. Ocampo
2014
Page 3
ii
Abstract
Pulmonary surfactant is a highly surface-active lipoprotein complex that lines the
alveolar surface of lungs. One of its main function is the reduction of surface tension at
the alveolar air-liquid interface and prevents alveolar collapse. Surfactant protein A (SP-
A) plays important functions in the promotion of pulmonary surfactant activity and
phospholipid metabolism in the alveolar space and these are dependent upon the ability
of SP-A to bind to the surfactant phospholipids. In the first part of the study, the binding
strength of the interaction of different surfactant phospholipids,
dipalmitoylphosphatidylcholine (DPPC), dipalmitoylphosphatidylethanolamine (DPPE),
and dipalmitoylphosphatidylglycerol (DPPG) with SP-A is investigated using atomic
force microscopy (AFM). Using AFM to measure interaction forces, the binding forces
between SP-A and each of the three different surfactant lipid bilayers were measured in
phosphate buffered saline (pH 7.4) with ~1 mM Ca2+. For the lipid headgroup interaction
with SP-A, which is assigned to the primary force value, DPPC and DPPE presented
similar interaction forces while DPPG showed the weakest interaction with SP-A (p-
value <0.001). DPPC showed the broadest distribution of forces, which was bimodal,
indicating a secondary interaction resulting mainly from hydrophobic interactions of the
acyl chains and choline methyl groups with SP-A. Considering the overall distribution of
binding events (primary and secondary forces), DPPC revealed the strongest interaction
with SP-A (headgroup and acyl chain interaction) compared to DPPE and DPPG under
Page 4
iii
dynamic conditions. Control experiments done in the absence of calcium and in the
presence of SO42- for DPPC and DPPE resulted to decrease in the unbinding forces and
overall distribution of forces which can indicate partial charge neutralization of the
positively charged lipid headgroup and the role of electrostatic interaction for SP-
A/DPPC and SP-A/DPPE systems. SP-A/DPPG experiment done in the absence of
calcium also revealed similar result which confirms Ca2+-dependent binding of SP-A
with DPPG.
In the second part of the study, the dissociation rate constant (Koff) for each SP-
A/lipid systems in the presence of Ca2+ is experimentally calculated using the Bell-Evans
model. By determining the unbinding forces at different loading rates, the unstressed Koff
can be determined. From the calculated Koffs for each SP-A/lipid interaction, DPPC gave
the strongest interaction among the three lipids. The dynamic force spectrum and
potential energy curves revealed a two-energy barrier unbinding pathway for DPPC and
DPPG while DPPE did not show a linear dependence with the loading rate. The Koff
values obtained in this study showed weaker interactions compared to other systems used
in force spectroscopy, which are mostly protein-protein systems with similar loading
rates. To the best of the authors’ knowledge the adhesion force and dissociation
constants between SP-A and different surfactant lipids has not been reported.
Page 5
iv
Be still and know that I am God.
- Psalms 46:10
Page 6
v
Acknowledgments
This thesis would have not been possible if it weren’t for the help and
encouragement of various people. First and foremost, I would like to thank my advisor,
Dr. Heather Allen, for the support and encouragement especially when I decided to take
on this project. Her guidance during my graduate studies has helped me grow as a skilled
researcher. My deepest gratitude to Dr. Nadia Casillas-Ituarte for that coffee time we had
that had led to this research project, for all the AFM skills and knowledge that she
imparted to me and for the patience in answering my questions. To Dr. Steven Lower
and Dr. Larry Schlesinger, for allowing me to use their facility and for all the valuable
comments and suggestions. To Dr. Dominique Verreault, for always having time to
bounce off ideas with and for all the illuminating discussions and insights. To the rest of
the Allen group members, past and present, particularly Hardy Castada, Roxanna Sierra-
Hernandez, Dana-Marie Telesford and Arijit Ghosh for the friendship and coffee breaks
that has kept my sanity throughout these years.
To my Filipino Christian Fellowship family, for always including me in their
prayers. My sincerest love and gratitude to my husband, Rex, during the last years of my
graduate study especially during the dissertation process. His love, support,
encouragement and understanding have sustained me and have given me that extra push
Page 7
vi
to finish my studies. To the arrival of our son, Ezekiel, who has been my motivation. To
my family, for trusting and believing in me even after all the detours and even if the task
seems daunting. And above all, to Almighty God, for his grace and faithfulness, who
made all these possible and to whom I give back all glory, honor and praise.
Page 8
vii
Vita
September 30, 1983 .......................................Born – Angeles City, Philippines
2005................................................................B.S. Chemistry, University of the
Philippines - Diliman
2011................................................................M.S. Chemistry, The Ohio State University
2008 to present ..............................................Graduate Teaching Assistant, Department of
Chemistry, The Ohio State University
2008 to present ..............................................Graduate Research Associate, Department
of Chemistry, The Ohio State University
Fields of Study
Major Field: Chemistry
Page 9
viii
Table of Contents
Abstract ............................................................................................................................... ii
Dedication………………………………………………………………………….......…iv
Acknowledgments............................................................................................................... v
Vita .................................................................................................................................... vii
Fields of Study .............................................................................................................. vii
Table of Contents ............................................................................................................. viii
List of Tables ..................................................................................................................... xi
List of Figures ................................................................................................................... xii
List of Abbreviations ..................................................................................................... xviii
List of Symbols ................................................................................................................. xx
Chapter 1 : Introduction ...................................................................................................... 1
Chapter 2 : AFM Theory................................................................................................... 12
2.1 Atomic Force Microscopy ....................................................................................... 12
2.2 Modes of AFM ........................................................................................................ 13
2.2.1 Contact Mode ................................................................................................... 14
2.2.2 Non-Contact Mode ........................................................................................... 14
Page 10
ix
2.2.3 Tapping Mode................................................................................................... 15
2.3 Force Spectroscopy Mode ....................................................................................... 15
2.4 Regions in the Force Curve ..................................................................................... 18
2.5 Tip Functionalization .............................................................................................. 18
2.6 Calibration ............................................................................................................... 20
2.7 Noise........................................................................................................................ 21
2.8 Statistics .................................................................................................................. 22
2.9 AFM Applications ................................................................................................... 23
2.10 Determination of Dissociation Rate Constant ....................................................... 24
Chapter 3 : Experimental Materials and Methods ............................................................ 33
3.1 Materials .................................................................................................................. 33
3.2 Lipid Solutions Preparation ..................................................................................... 33
3.3 Purification of SP-A ................................................................................................ 34
3.4 AFM Tip Preparation and Functionalization .......................................................... 34
3.5 Langmuir Blodgett Technique ................................................................................ 34
3.6 AFM Force Spectroscopy........................................................................................ 36
3.7 Dynamic Force Spectrum ........................................................................................ 37
Chapter 4 : Determination of Binding Strengths for Each Protein-Lipid Systems ........... 44
4.1. SP-A/Lipid Interactions in the Presence of Ca2+ .................................................... 44
Page 11
x
4.2. Control Experiments .............................................................................................. 50
4.3. SP-A/Lipid Interactions in the Absence of Ca2+ .................................................... 52
Chapter 5 : Determination of Dissociation Rate Constant (KOFF)..................................... 62
Chapter 6 : Conclusions and Future Work ........................................................................ 73
References ......................................................................................................................... 76
Page 12
xi
List of Tables
Table 5.1 Parameters extracted from the low strength regime of the dynamic force
spectrum plot in Figure 5.1A using Bell-Evans model for each SP-A/lipid system. The
unbinding force values in the low strength regime of Figure 5.1B did not show a clear
linear dependence with the loading rate and hence was not fitted with the Bell-Evans
equation. ............................................................................................................................ 71
Table 5.2 Parameters extracted from the high strength regime of the dynamic force
spectrum plot in Figure 5.1A and B using Bell-Evans model for each SP-A/lipid system.
........................................................................................................................................... 72
Page 13
xii
List of Figures
Figure 1.1 Diagram of the lungs. The mammalian lungs branch into tubes leading to tiny
air sacs called alveoli where oxygen and carbon dioxide gaseous exchange takes place.
The lungs contain hundreds of millions of alveoli with diameters ranging from 75–300
µm in adults. ....................................................................................................................... 8
Figure 1.2 Schematic overview of the pulmonary surfactant system. Lung surfactant is
synthesized, secreted and recycled by the alveolar type II cell. It is stored in lamellar
bodies and secreted to the alveolar hypophase which then forms tubular myelin and other
aggregates. Lamellar bodies and tubular myelin both contains the lipoprotein
components of surfactant. The lung surfactant from these aggregates then adsorbs to
form a film at the air-liquid interface. The surfactant in the hypophase is then taken back
to the Type II cell for recycling. (Adapted from Notter, 2000)2 ......................................... 9
Figure 1.3 Structure of SP-A. SP-A consists of six trimeric subunits that forms an
octadecamer with a “flower bouquet-like” structure. The primary structure consists of an
amino-terminal domain, a collagenous domain, a neck domain, and a carbohydrate-
recognition domain (CRD). SP-A is the most abundant of the pulmonary surfactant
proteins and is relatively hydrophilic. ............................................................................... 10
Figure 1.4 Primary structure of SP-A. The 228 amino acid sequence is derived from
cDNA by Floros et al.57 and White et al.58 and is taken from Notter2. The secondary
structures of the neck and carbohydrate recognition domain are also specified according
Page 14
xiii
to Head et al.59. Blue residues form coiled structures, red residues form alpha helix and
green residues form beta strand structures. ....................................................................... 11
Figure 2.1 Schematic of a tip-scanning atomic force microscope. The tip, which is
mounted on a cantilever with a specific spring constant, is scanned over the sample
surface. While scanning, the force between the tip and the sample is measured by
monitoring the deflection of the cantilever with a four quadrant photodiode using an
optical lever sensor. In an optical lever, a laser beam is focused on and reflected from the
rear of the cantilever. A small deflection of the cantilever causes a large change in the
laser spot position at the detector. ..................................................................................... 26
Figure 2.2 Interatomic force vs. distance curve. ............................................................. 27
Figure 2.3 Example of a force-distance curve. During the approach phase, there is no
tip-sample contact (1). As the tip approaches the sample, the tip may jump into contact
with the sample surface (2) due to Van der Waals and electrostatic forces. The cantilever
deflects further due to increasing force and gives rise to the linear part of the curve (3).
The tip then retracts in the z-direction and the force of the cantilever is decreasing.
Adhesive forces present between the tip and the sample keep the tip in contact with the
sample and leads to a negative deflection of the cantilever (4). The tip then breaks free
from the surface (pull-off force) and returns to its starting position. ................................ 28
Figure 2.4 The tip-sample distance. D is the actual tip-sample distance and Zp is the
distance between the rest position of the cantilever and the sample surface and is the
distance controlled during measurement. Interaction forces present causes cantilever
Page 15
xiv
deflection (Zc) and this changes the actual distance between the cantilever and the sample
surface. .............................................................................................................................. 29
Figure 2.5 Regions in the force-distance curve (adapted from Leite and Herrmann,
2005).91.............................................................................................................................. 30
Figure 2.6 A schematic diagram of the energy landscape illustrating the dissociation in
the absence of external force (solid line) and with an applied force (dashed line). The
schematic shows how an external mechanical force deforms the energy landscape by
reducing the barrier of the unbinding path. ....................................................................... 31
Figure 2.7 Dynamic force spectra. The unbinding force usually scales linearly with the
logarithm of the loading rate. For a single barrier, the plot of unbinding force vs. the
logarithm of the loading rate is a simple linear force spectrum (A). For a system
involving two barriers that lie along a single unbinding pathway, this is predicted to
follow a continuous sequence of linear regimes in the force spectrum (B). (Adapted from
Lee et al., 2007)50 .............................................................................................................. 32
Figure 3.1 Molecular structures of the studied phospholipids. ........................................ 39
Figure 3.2 Schematic illustration of a Langmuir trough with a Wilhelmy plate balance to
measure surface pressure and moveable barriers for symmetric compression or
expansion. For the fabrication of LB films, a dipping mechanism is included to hold the
solid substrate as it is immersed into the liquid. ............................................................... 40
Figure 3.3 The atomic force microscope used for this study at the Surface Analysis
Laboratory of the Department of Chemistry and Biochemistry at The Ohio State
University. ......................................................................................................................... 41
Page 16
xv
Figure 3.4 Experimental setup for force measurements. .................................................. 42
Figure 3.5 Representative force-distance curve from AFM measurements. From the
force-distance curve, the unbinding force (F), the separation distance (D) and the
effective spring constant (Keff) can be extracted. .............................................................. 43
Figure 4.1 Illustration of the experimental setup for the interactions between the SP-A-
functionalized AFM tip and the SLB in PBS buffer. The AFM tip is incubated with SP-A
solution and the lipid bilayer is supported on a glass slide. The tip is moved directly
towards the sample (1) then retracted (2) and if adhesion forces are present, a positive
peak is generated in the force-distance curve. The tip is then continuously retracted until
the interaction between the protein and the bilayer is ruptured (3). A force curve is then
generated which provides quantitative information of the forces present between the SP-
A and bilayer. .................................................................................................................... 55
Figure 4.2 Representative force curves for the SP-A/DPPC interaction in the presence of
Ca2+. The force curves show different magnitudes of rupture forces and rupture lengths.
Force curve (i) showed a greater unbinding force than (ii) but both showed similar
rupture length. Force curve (iii) showed a longer rupture length but similar unbinding
force as (i). Force curve (iv) showed the strongest interaction having the longest rupture
length and largest unbinding force. For all the SP-A/lipid systems, >8000 force curves
were collected to ensure a full statistical understanding of the interactions. .................... 56
Figure 4.3 Representative force curve that exhibits multiple peaks. For such curves, only
the final rupture peak was considered for the unbinding force values. ............................ 57
Page 17
xvi
Figure 4.4 Frequency distribution of the unbinding forces for the interactions of SP-A in
the presence of Ca2+ with (A) DPPC, (B) DPPE, and (C) DPPG in PBS buffer. The
experimental data (gray bars) are fitted with a multi-Gaussian function (red line). The
maximum peak forces from the Gaussian fit are reported in Table 4.1. ........................... 58
Figure 4.5 Surface-area isotherms of DPPC, DPPG and DPPE at ambient temperature.
The LB film for each lipid were taken in the LC phase at surface pressures of 40 mN/m
for DPPC, and 30 mN/m for both DPPG and DPPE. ....................................................... 59
Figure 4.6 The SP-A/DPPC system was used for the DPPC blocking control experiment.
The frequencies were normalized to show a relative decrease in frequency. There is a
decrease of binding frequency to ~26% after addition of 1 mM DPPC in buffer and to
~12% after addition of 10 mM DPPC. The decrease in frequency after blocking confirms
the specificity of interaction. The error bars represent the standard error from four
repeated control experiments. ........................................................................................... 60
Figure 4.7 Control experiments: Frequency distribution of the unbinding forces for the
interactions of SP-A in the absence of Ca2+ with (A) DPPC and (B) DPPE in PBS buffer
with 1 mM SO42-, and with (C) DPPG in PBS buffer only. The experimental data (gray
bars) are fitted with a multi-Gaussian function (red line). The maximum peak forces
from the Gaussian fit are reported in Table 4.2. ............................................................... 61
Figure 5.1 Force dynamic spectrum for each SP-A/lipid interaction. Koff values were
calculated using the same fitting method over two different loading rate ranges. (A) Low
force regime range is 103 - 104 pN/s and high force regime is 104 – 106 pN/s (B) Low
force regime is 103 – 105 pN/s and high force regime range is 105-106 pN/s. Unbinding
Page 18
xvii
forces for DPPE did not show a clear linear dependence with loading rate and thus was
not fitted with the Bell-Evans model. ............................................................................... 69
Figure 5.2 Potential energy curves for SP-A/DPPC (A) and SP-A/DPPG (B) interactions
based from the parameters calculated from Figure 5.1A using the Bell-Evans model..... 70
Page 19
xviii
List of Abbreviations
AFM atomic force microscopy
APP alveolar proteinosis patient
ARDS acute respiratory syndrome
BAL bronchoalveolar lavage
CRD carbohydrate recognition domain
DPPC 1,2-dipalmitoyl-sn-glycero-3-phosphocholine
DPPE 1,2-dipalmitoyl-sn-glycero-3-phosphoethanolamine
DPPG 1,2-dipalmitoyl-sn-glycero-3-phosphoglycerol sodium salt
GPI glycosylphosphatidylinositol
LB Langmuir-Blodgett
LC liquid-condensed
MBP myelin basic protein
PBS phosphate-buffered saline
PC phosphatidylcholine
PE phosphatidylethanolamine
PEG polyethylene glycol
PG phosphatidylglycerol
PI phosphatidylinositol
PS pulmonary surfactant
Page 20
xix
PSGL-1 P-selectin glycoprotein ligand-1
RDS respiratory distress syndrome
SEM scanning electron microscopy
SP-A surfactant protein-A
SP-B surfactant protein-B
SP-D surfactant protein-D
SLB supported lipid bilayer
TLC thin layer chromatography
mM milliMolar
N Newton
pN pico-Newton
nN nano-Newton
nm nanometer
Å Angstrom
V volts
Page 21
xx
List of Symbols
F Force, unbinding or rupture force
K Cantilever spring constant
α Deflection sensitivity
δ Cantilever’s deflection, volts
Zc Cantilever’s deflection, nm
Zp Cantilever’s rest position
D Relative tip-sample distance
KB Boltzmann constant
z Average value of cantilever deflection
σ Standard deviation
Xβ Position of transition state of a single bond
r Loading Rate
Koff Dissociation rate constant
τ Bond lifetime
Keff Effective Spring constant
υ Cantilever retraction speed
r2 Correlation Factor
m Slope
b y-intercept
Page 22
1
Chapter 1 : Introduction
Lungs are an essential part of the respiratory system and provide the large surface
area to facilitate the gas exchange needed to drive metabolic functions. The major parts
of the lungs include the trachea, bronchi, bronchioles, and the alveoli. The alveoli are
fluid-lined tiny air sacs in the lungs where the exchange of oxygen and carbon dioxide
takes place (Figure 1.1). The average human adult has 300 million alveoli that provide a
large surface area for gas exchange of up to 75 m2.1 The alveolus is covered by a thin-
liquid lining or hypophase and the air-liquid interface is lined with a surfactant layer that
is essential for the maintenance of normal lung function. Pulmonary surfactant (PS) is
synthesized by alveolar Type II cells and stored in lamellar body organelles which is then
secreted into the alveolar hypophase (Figure 1.2).2,3 These lamellar bodies are then
transformed to phospholipid-rich aggregates including tubular myelin. Tubular myelin is
a lattice-like structure composed of phospholipid membranes in the alveolar hypophase
that is believed to be an intermediate structure in the formation of surfactant monolayer
from type II cells.4,5 Lung surfactant adsorbs onto the air-hypophase interface from these
aggregates to form a surfactant monolayer covering the alveolar hypophase.
A major function of PS includes the reduction of surface tension inside the alveoli to
< 1 mN/m on exhalation.2,3 This property reduces the work expenditure associated with
Page 23
2
breathing, stabilizes the alveoli and prevents the lungs from collapsing at the end of
exhalation.2 Lung surfactant deficiency and dysfunction can lead to several respiratory
diseases. Respiratory distress syndrome (RDS) is the major lung surfactant disease and is
the leading cause of death of premature infants.2 In RDS, there is insufficient production
of surfactant in the lungs primarily due to lack of functional type II cells. Severe
respiratory failure due to lung injury can cause acute RDS (ARDS) which occurs in all
age groups. General advances in medicine have allowed the development of exogenous
surfactant replacement therapy for RDS and ARDS and is still the focus of ongoing
research.
PS is a lipoprotein complex that consists of ~90% lipids, ~10% proteins and small
amounts of carbohydrates.2,6,7 Phosphatidylcholines (PC) are the most abundant class of
surfactant phospholipids making up ~80% of the total phospholipid.2,7 About half of the
PCs are in the form of dipalmitoylphosphatidylcholine (DPPC) which is considered to be
primarily responsible for surface tension reduction of PS, thus preventing lung collapse.7-
9 The second most abundant type of phospholipids is phosphatidylglycerol (PG) which
constitutes ~10% of the surfactant phospholipids.2,7 Although the role of PG in lung
surfactant processes remains unclear, recent studies have shown that it can suppress
inflammatory responses in the lung.7-10 Other lipids that are present in smaller amounts
are phosphatidylethanolamines (PE) and phosphatidylinositols (PI).
Page 24
3
The most abundant of the proteins in the lipoprotein complex is surfactant protein A
(SP-A). It is a hydrophilic glycoprotein with monomeric molecular weight of 28−36 kDa,
contains 228 amino acid residues and has an isoelectric point ranging from 4.8−5.2.2,11-15
It belongs to a class of proteins known as collectins along with surfactant protein D (SP-
D). SP-A is an octadecamer consisting of six trimeric subunits. Each subunit consists of
four domains: an amino-terminal domain, a collagen-like domain, an alpha helical coiled-
coil neck domain, and a Ca2+-dependent carbohydrate recognition domain (CRD) (Figure
1.3).13,16 The primary structure of SP-A is shown in Figure 1.4. The amino terminal is a
short peptide segment of 7 amino acids with a cysteine residue which forms an interchain
disulfide bridge. The collagen-like domain is composed of 73 amino acids consisting of
23 repeating glycine-X-Y tripeptide units where Y is often hydroxyproline.13,17,18 After
the 13th Gly-X-Y triplet, an interruption occurs as a result of the insertion of a proline
residue and the substitution of a cysteine for a glycine that introduces a flexible kink in
the collagen region causing each trimeric subunit to bend outward and gives rise to the
“flower-bouquet like” structure of SP-A.13,17,18 The neck and the CRD region are
composed of 148 amino acid residues.17 The neck region consists of a short sequence of
hydrophobic residues and amphipathic helix and the CRD contains a Ca2+-dependent
carbohydrate binding site which may play a role in pathogen recognition and clearance,
and lipid aggregation.13,19-21
SP-A is secreted by alveolar type II cells into the alveolar space and is shown to be
associated with the surfactant phospholipids.11 Numerous studies have investigated the
Page 25
4
lipid-binding properties of SP-A using various biochemical and biophysical methods and
under different experimental conditions such as temperature, pH and the amount of
calcium that can affect the lipid binding properties of SP-A. Various methods have been
employed such as centrifugation,22,23 resonant mirror spectroscopy,24,25 infrared
spectroscopy,26 and electron microscopy27,28 to study SP-A binding with phospholipid
bilayers using multilamellar or unilamellar vesicles. Lipid monolayer studies have also
been done with SP-A.29,30 SP-A/lipid binding has also been observed using thin layer
chromatography (TLC) by immobilizing the lipids on silica gel to observe direct binding
of labeled SP-A.31
Although several studies have shown the role of Ca2+ in inducing phospholid vesicle
aggregation,32-35 there have been contradictory reports however on the Ca2+ dependence
binding of SP-A with lipids. Kuroki and Akino reported Ca2+-dependent binding of I125-
SP-A with DPPC adsorbed on silica gel.31 King et al. demonstrated that the binding of
SP-A to DPPC vesicles occurs in the presence of EDTA when the vesicles are in the gel
phase.22 Fluorescence studies have revealed increase in the intrinsic fluorescence of SP-
A when DPPC vesicles are in the gel phase.36 These studies indicate that SP-A/DPPC
binding is dependent on the physical state of the vesicle and is independent on Ca2+.
Studies on DPPC monolayers showed that the presence of Ca2+ in the subphase did not
affect the properties of SP-A/DPPC films but improved the miscibility of SP-A with
DPPG films and DPPC/DPPG films.15,30 Previous lipid binding studies suggest that SP-
A binds to both the headgroup and acyl chains of phospholipids in a Ca2+-dependent
Page 26
5
manner.24,25,31,32,36 Mutagenesis studies have also shown that the phospholipid binding
domain of SP-A overlaps with the CRD and that the latter affects its lipid binding
properties and aggregation.37-41 The alpha helical coil neck region in SP-A may also
contribute to lipid binding and may be involved in phospholipid uptake of various
cells.42,43
Among other functions, SP-A also enhances the surface tension lowering properties
of phospholipids and modulates the secretion, uptake, and recycling of surfactant.13,44
The continuous clearance of surfactant from the alveolar hypophase is important in
maintaining the steady state condition in the lungs.44 Alveolar type II cells and
macrophages play a role in the recycling and degradation of surfactant, respectively.44,45
The process of selective targeting of specific classes of surfactant by these two types of
cells is still unclear. However, studies have shown that SP-A enhances the uptake of
lipids by alveolar type II cells and macrophages through the activation of macrophages
and its binding to putative SP-A receptors.45-48 SP-A also facilitates the formation of
tubular myelin in a Ca2+-dependent manner in vitro and has been shown to interact with
ordered lipids in membranes of interfacial films.25,30,36,49 These functions are dependent
on the ability of SP-A to interact with the certain types of surfactant lipids.
In this work, the lipid binding properties of SP-A to different surfactant
phospholipids (DPPC, DPPE, and DPPG) was investigated using AFM. AFM has been
widely used in biology to study ligand-receptor interactions because of its high
Page 27
6
sensitivity. 50 Binding or adhesion forces can also be employed to study different cell-
cell or cell-substrate interactions.50-53 Additionally, AFM has the ability to characterize
the interactions between phospholipids and proteins under dynamic conditions. The
ability of AFM to measure protein-lipid binding was shown by Desmeules et al. wherein
they measured a binding force of ~48 pN between recoverin, a Ca2+-myristoyl switch
retinal protein, and a supported DPPC bilayer.54 Cross et al. also employed AFM-based
force spectroscopy to determine the binding force between glycosylphosphatidylinositol
(GPI)-anchored alkaline phosphatase protein and supported DPPC bilayer wherein they
measured ~350 pN binding force.55 The interaction of SP-D with different saccharide
ligands was also studied using AFM by Thormann et al. who measured binding forces in
the range of 35−55 pN binding.56 To the best of the authors’ knowledge the adhesion
force between SP-A and different surfactant lipids has not been reported.
The work presented in this dissertation can provide insight on the selective SP-
A/lipid interactions in the alveolar hypophase under dynamic conditions. Using force
spectroscopy, the lipid binding properties of SP-A are investigated allowing better and
detailed understanding on the interaction forces and binding mechanism involved in the
interaction of SP-A with the different surfactant lipids.
In Chapter 2, AFM theory and principles are introduced and force spectroscopy is
discussed in detail. Chapter 3 presents the materials and methods used in this study.
Chapter 4 presents the work on the measurement of the binding forces of SP-A with the
Page 28
7
different surfactant lipids (DPPC, DPPE and DPPG) using AFM. DPPC and DPPE
presented similar headgroup interactions with SP-A while DPPG showed the weakest
interaction. DPPC showed a bimodal and the broadest distribution of forces that suggest
strong interaction with SP-A. The differences and origin of the binding forces for each
SP-A/lipid systems is discussed. The determination of dissociation rate constant (Koff)
for each SP-A/lipid systems is presented on Chapter 5. The unbinding forces at different
loading rates were measured and plotted using the Bell-Evans model to generate a
dynamic force spectrum. The Koff was then calculated and results revealed a stronger
interaction of SP-A with DPPC. The potential energy curves were also plotted for each
interaction to reveal the energy landscape of the unbinding pathway for each SP-A/lipid
systems.
Page 29
8
Figure 1.1 Diagram of the lungs. The mammalian lungs branch into tubes leading to tiny
air sacs called alveoli where oxygen and carbon dioxide gaseous exchange takes place.
The lungs contain hundreds of millions of alveoli with diameters ranging from 75–300
µm in adults.
Page 30
9
Figure 1.2 Schematic overview of the pulmonary surfactant system. Lung surfactant is
synthesized, secreted and recycled by the alveolar type II cell. It is stored in lamellar
bodies and secreted to the alveolar hypophase which then forms tubular myelin and other
aggregates. Lamellar bodies and tubular myelin both contains the lipoprotein
components of surfactant. The lung surfactant from these aggregates then adsorbs to
form a film at the air-liquid interface. The surfactant in the hypophase is then taken back
to the Type II cell for recycling. (Adapted from Notter, 2000)2
Page 31
10
Figure 1.3 Structure of SP-A. SP-A consists of six trimeric subunits that forms an
octadecamer with a “flower bouquet-like” structure. The primary structure consists of an
amino-terminal domain, a collagenous domain, a neck domain, and a carbohydrate-
recognition domain (CRD). SP-A is the most abundant of the pulmonary surfactant
proteins and is relatively hydrophilic.
Page 32
11
Figure 1.4 Primary structure of SP-A. The 228 amino acid sequence is derived from
cDNA by Floros et al.57 and White et al.58 and is taken from Notter2. The secondary
structures of the neck and carbohydrate recognition domain are also specified according
to Head et al.59. Blue residues form coiled structures, red residues form alpha helix and
green residues form beta strand structures.
Page 33
12
Chapter 2 : AFM Theory
2.1 Atomic Force Microscopy
Atomic force microscopy (AFM) is a high resolution imaging technique based on the
measurement of attractive and repulsive interaction forces between a cantilever tip and a
sample surface. It was invented on 1986 by Binnig and Quate60 wherein they
demonstrated for the first time the theory of AFM, which uses an ultra-small probe tip at
the end of the cantilever. The AFM technique is based on the interaction between a sharp
probe attached to a flexible cantilever and a sample at a very short probe-sample distance
(0.2−10 nm).61 The main contributions to the attractive forces are Van der Waals force,
electrostatic force, and short range chemical force.62 The repulsive forces in general are
very short-range forces and include Pauli-exclusion repulsion and electron-electron
Coulomb interactions.62 For AFM imaging, the image contrast arises because of the
forces present between the tip and the sample which is a function of the tip-sample
distance and the material of both the tip and the sample.
In topographic measurements, the AFM tip is scanned over the sample surface while
maintaining a constant interaction force between the tip and the sample. The cantilever
deflects in the z-direction due to the surface topography of the sample, and depending
whether the tip-sample interaction is attractive or repulsive, the cantilever will deflect
towards or away from the surface (Figure 2.1). The vertical and lateral deflections of the
Page 34
13
cantilever are measured using the optical lever. The optical lever operates by focusing
and reflecting a laser beam off the rear of the cantilever. The reflected laser beam strikes
a four-quadrant photodetector which indicates the position of the laser spot on the
detector and the angular deflections of the cantilever. The output from the photodetector
controls the force applied to the tip so that the force remains constant. A feedback loop is
used to regulate the force applied on the sample. The feedback loop consists of a tubular
piezoelectric device that controls the height of the cantilever, tip and optical lever which
measures the height of the sample. The feedback circuit keeps the cantilever deflection
constant by adjusting the voltage applied to the scanner.
AFM provides a 3D profile of the sample surface with sub-nanometer scale
resolution. For imaging, the resolution depends strongly on the shape of the tip. The
smaller the tip, the smaller the surface area sampled by the tip, hence a better imaging
resolution. The most common type of AFM tips are made of silicon nitride (Si3N4) and
are pyramidal and conical in shape with a radii of ~20-60 nm.61 Si3N4 tips have very low
force constants and is also known as a low-wear material, thus minimizing tip wear and
distortion of AFM data.63,64
2.2 Modes of AFM
Depending on the distance of the tip and the sample surface different operating
modes are possible for AFM. Generally, AFM has three imaging operating modes: the
contact mode, non-contact mode, and tapping mode (Figure 2.2). In all these three
Page 35
14
modes, the tip is scanned across the sample surface and the topography of the sample is
obtained by interpreting the cantilever deflection.
2.2.1 Contact Mode
In the contact mode or constant force mode, the tip is in permanent physical
contact with the sample. The cantilever’s deflection signal is maintained at a set point
value via an electronic feedback loop. The image of the surface topography is created by
measuring the deflection of the cantilever required to maintain a constant force. Contact
mode AFM is appropriate for hard and stable materials since the tip is in close contact
with the sample. The shear forces applied to the sample while scanning may damage soft
materials with weakly bound molecules. In the contact region, at a very small tip-sample
distance, repulsive forces predominate due to the overlap of the electronic orbitals at
atomic distances. Typical forces applied to contact mode AFM are in the order of nN.
2.2.2 Non-Contact Mode
In non-contact mode, the AFM probe is brought into close proximity to the
sample surface and senses the long-range attractive forces (Van der Waals forces) that
induce a frequency shift in the resonant frequency of the cantilever. In this mode, the tip
oscillates at the resonance frequency and the amplitude of the oscillation is kept constant
using a feedback loop during scanning. This method is most suitable for soft materials
since the tip never actually touches the surface resulting in low deformation and shear
Page 36
15
forces on the sample. The greatest drawback of this mode is that it cannot be used in
liquid environment because this can interfere with the oscillation.65
2.2.3 Tapping Mode
The AFM tapping mode uses an oscillating tip. During the oscillation, the tip is
brought into contact with the sample so that the forces felt by the tip are the same as that
in the contact mode. The contact time however is greatly reduced in this mode and since
the tip is not in contact with the sample during lateral movement while scanning, shear
forces applied to the sample is negligible and this prevents the tip from sweeping the
molecules on the surfaces. This mode provides better lateral and vertical resolution than
contact and non-contact mode and can be used in liquid environment.
2.3 Force Spectroscopy Mode
Although AFM is best known for its high resolution imaging capabilities, it can also
be a powerful tool for sensitive force measurements. Forces in the piconewton (pN)
range can be measured which is the order of magnitude of forces that are required to
separate receptors from ligands. The small radius of the AFM tip allows a small
interaction area and high sensitivity for smaller forces. In AFM imaging mode, the
cantilever is usually scanned over the sample surface to generate a 3D image. In force
spectroscopy, the cantilever-tip assembly acts as a sensitive force sensor. The cantilever
and the tip are moved towards the sample in the z-direction while maintaining the x-y
position of the AFM probe fixed. The tip approaches the sample until it is contact with it
Page 37
16
and then retracted again, while the interaction between the tip and the sample is
measured. This is then repeated several times at the same spot and different locations to
give a better statistical understanding of the interaction. AFM can directly measure the
force between the atoms or molecules at the end of the probe and the surface. Often, the
ligand is immobilized on the AFM tip and the receptors immobilized on the surface. The
presence of interaction forces causes the cantilever to deflect and the deflections of the
cantilever are recorded which gives rise to force-distance curves or briefly “force
curves”.
Force curves provide quantitative information of interaction forces present between
the tip and the sample by measuring the amount of force felt by the cantilever as the tip
approaches the sample surface. Figure 2.3 shows the movement of the cantilever during
the force spectroscopy experiment and the corresponding force curve generated. During
the approach phase, at position (1) which is about 10−100 μm away from the sample,
there is no tip-sample contact. As the cantilever approaches the sample surfaces, at
several microns away from the sample, long-range interactions, such as electrostatic
interactions can be measured. At position (2), at nanometers away from the sample,
short-range forces, such as Van der Waals or capillary forces, can be measured. At this
distance, when the sum of the forces is attractive, the tip may jump into contact with the
surface. Once the cantilever is in contact with the surface, the cantilever deflects further
due to increasing force as the cantilever is pushed towards the sample and this gives rise
to the linear part of the force curve (position 3). At this point, the stiffness and elastic
Page 38
17
response of the sample can be measured. The cantilever then retracts in the z-direction
and force felt by the cantilever decreases. Adhesion forces keep the tip in contact with
the sample and this leads to a negative deflection of the cantilever and results to a
negative peak in the force curve (position 4). The cantilever then breaks free from the
surface and returns to its starting deflection.
The result of a force measurement is a measure of the cantilever deflection in volts
(V) versus the displacement of the piezo element in nm. The force F between the tip and
the sample is related to the cantilever’s deflection through Hooke’s law:63,66
𝐹 = 𝐾𝛼𝛿 (2-1)
where K is the cantilever’s spring constant (N/nm), α is the deflection sensitivity (nm/V)
and 𝛿 is the measure cantilever’s deflection in volts (V).
The piezo element displacement (Zp) defines the distance between the sample surface
and the rest position of the cantilever. Zp has to be converted to the relative tip-sample
distance D (nm) by taking into account the cantilever deflection in nm (Zc). D is
calculated by the piezo element displacement corrected by the deflection of the cantilever
(Figure 2.4):
𝐷 = 𝑍𝑃 − 𝑍𝐶 (2-2)
Page 39
18
Force-distance curve then is a plot of the force versus the true tip-sample distance
calculated from the raw data.
2.4 Regions in the Force Curve
The approach and withdrawal curves can be divided into three regions: the contact
region, non-contact region, and the zero line (Figure 2.5). The zero line is obtained when
the tip is far from the sample, such that there is no tip-sample contact and the cantilever’s
deflection is close to zero. As the tip is moved and pressed against the surface, the
corresponding cantilever deflection is called the contact region and can provide
information on the sample stiffness.61 The non-contact region of the approach curve
gives information about attractive or repulsive forces present at this certain tip-sample
distance. When the overall force felt by the cantilever is attractive, this will result to pull-
on forces (jump-to-contact) and if it is repulsive, this will give rise to a positive peak on
the curve. The non-contact region in the withdrawal curve contains the jump-off contact
due to pull-off forces as the tip is retracted from the surface. This pull-off force is the
adhesion force that exists between the tip and the sample.
2.5 Tip Functionalization
AFM adhesion experiments are based on the interaction between two molecules: one
attached to the AFM tip and the other bound to the surface. Tip functionalization with
the molecule of interest is an important strategy in the force spectroscopy experimental
Page 40
19
design. Employing the appropriate functionalization techniques would lead to more
significant and reliable results. Bare tip-sample adhesion is often observed but this is
often referred to as a nonspecific interaction. The challenge in every experiment is
finding a way to distinguish between the desired or relevant interaction from nonspecific
interactions and background noise. One important step to accomplish this goal is
choosing the appropriate attachment strategy. There are numerous considerations that
influence the choice of functionalization method, the practicality of the method and the
type of system being probed would often dictate the choice.
The most commonly used method for attachment is the use of intermediate
molecules, called spacers or linkers, between the tip and the molecule of interest. Most
commonly used spacers are short polyethylene glycol (PEG) polymer chains.67 This
method provides the molecule with flexibility and mobility to best access the binding
receptor on the surface. Although this method provides a simple way of functionalizing
the tip and providing the molecule with spatial freedom to interact with the receptor, this
configuration always requires extensive controls to distinguish between the specific and
the nonspecific interactions. Nonspecific interactions in this case can arise from the
interaction of the spacer or linker with the receptor and can make analysis of force
measurements complicated.
Although there are other approaches of tip functionalization, basic issues must
always be addressed in choosing the best attachment strategy. One must choose an
Page 41
20
appropriate AFM probe. Oftentimes, the most important consideration is the spring
constant. For binding experiments, typically the spring constants used are < 0.1 N/m
(soft cantilevers) because the forces measured for binding interactions are usually small.68
The use of a linker or spacer must also be considered if it will provide more benefits in
promoting and recognizing specific binding events. Appropriate experimental conditions
for tip functionalization and force measurement must also be ensured to maintain the
integrity and binding activity of the molecules of interest.
2.6 Calibration
The cantilever’s spring constant, K, is oftentimes estimated by the manufacturer and
a more accurate calibration method can be done to determine the spring constant. One of
the popular methods that is used for calibration and is used for this study is the thermal
tune method. This method involves measuring the cantilever’s mechanical response to
thermal fluctuations including the diffusion of small particles (Brownian motion). The
end position of the cantilever is constantly fluctuating because of the thermal vibrations
from the environment. The size of the fluctuations is measured by the AFM system by
measuring the cantilever’s vertical deflection over some time and these vertical
deflections are then analyzed. The thermal noise spectrum is a plot of the cantilever’s
fluctuations as a function of frequency. The greatest amplitude is usually seen around the
cantilever’s resonance frequency. The noise spectrum is then fitted with a Lorentzian
function and an estimate of the spring constant can be measured.
Page 42
21
This method was first presented by Hutter et al.69 Due to the small deflections in the
cantilever, the method assumes the cantilever has a single degree of freedom and follows
the equipartition theorem. The theorem states that for a system in thermal equilibrium,
the average energy in any free mode of the system has to be equal to KBT/2, where KB is
the Boltzmann constant and T is the absolute temperature.69,70 The energy in the
resonance is given by the spring constant, K, and the average value of the vertical
deflection of the cantilever, z:71
1
2𝐾𝐵𝑇 =
1
2𝐾 < 𝑧2 >
(2-3)
The value of z2 is taken from the Lorentzian fit of the thermal noise spectrum by taking
the area under the curve which corresponds to the energy in the resonance. For most
commercial AFMs, calibration is done through their software.
2.7 Noise
The limits of force sensing and force resolution in AFM are determined by the
overall noise in the system. Noise introduced in AFM measurements can arise from both
internal and external sources. Internal sources of noise are primarily due to thermal
vibrations of the cantilever when it is in contact with air or liquid.67 External sources of
noise include mechanical and acoustic vibrations and the turbulence in the liquid
environment. Both sources of noise can limit the force resolution. The noise determines
the lower limit of force that the AFM can detect. The noise level of a force-distance
Page 43
22
curve due to these sources is usually ≤30pN.66 But with the improvement in
commercially available cantilevers, forces down to ~10pN can be measured.72
Along the zero line (no tip-sample contact), the noise is dominated by thermal
vibrations. To minimize the effect of thermal drift, force measurements should be done
at high scan rates but still at a certain threshold speed before dynamic effects affect the
measurements.66 Acoustic noise can be minimized by using an appropriate enclosure.
Active vibration isolation stages are also employed for isolation solutions. Systematic
errors can also arise in the calculation of forces through the inaccurate estimation of the
cantilever spring constant. The estimation of distances can also be affected by systematic
errors due to the piezo response, hysteresis and creep.
2.8 Statistics
The number of force curves that must be taken for a force measurement experiment
depends on several factors. Not all force measurements will give the binding interaction
of interest. Either no interaction will be sensed (no binding event in the force-distance
curve) or non-specific interactions will be measured which are mixed with measurements
that show specific interaction. Collecting a large number of force curves can then allow
one to still have a significant number of specific binding events after filtering the non-
desired force curves. For complicated systems, such as the existence of multiple bonds,
the standard deviation can become large, requiring more force measurements to
accurately determine the mean.
Page 44
23
In general, from the statistics of normally distributed data, the number of samples
that should be acquired, n, so that the true mean lies within a margin of error E with a
confidence defined by z* is given by:
𝑛 = (
𝑧∗𝜎
𝐸)2
(2-4)
where 𝜎 is the standard deviation and the z*-score for 99% confidence is 2.576. For large
loading rates, the standard deviation for the distribution of rupture forces is 𝜎 =𝐾𝐵𝑇
𝑋𝛽
where Xβ is the position of the transition state of a single bond.73,74 This equation shows
that few measurements are actually needed to estimate the mean rupture force. If the
objective of the experiment is to find the mean of the unbinding forces, this can be done
with relatively fewer samples than those required to accurately fit the distribution to a
histogram of the forces measured. However, to analyze the data beyond the estimation of
the mean force and to resolve finer details in the force histogram, then larger number of
samples is needed.
2.9 AFM Applications
AFM has proven to be a suitable approach for the study of wide variety of samples
(conductors and insulators) and may be operated in various environments such as in
vacuum, air or liquid. This makes AFM particularly suited for biological applications
Page 45
24
because the samples can be imaged in physiological conditions. In its imaging mode, it
provides a three-dimensional topographical information with sub-nanometer resolution
providing quantitative height information. Its super resolution is its main advantage over
optical microscopy and scanning electron microscopy (SEM). Also, compared to SEM,
the samples need not be electrically conductive or dehydrated which allows probing of
the sample nondestructively and in its hydrated state. AFM have been used in the high
resolution imaging of different samples such metals, polymers, biomolecules, bio-
membranes and cells.75-82
One of the major advantage of AFM is that it provides information on some local
mechanical properties and interaction forces through the analysis of force-distance
curves. AFM has been successfully employed in the study of various ligand-receptor
interaction83-86, polymers and DNA.87,88
2.10 Determination of Dissociation Rate Constant
An external mechanical force applied to a system can deform the energy landscape
of the unbinding path and shortened the bond lifetime significantly below its natural
lifetime. Figure 2.6 shows how an increasing force can change the energy landscape and
lower the activation barrier. In 1978, Bell emphasized the increase in rate of bond
dissociation under external force.89 In his model, he predicted that the unbinding force of
a ligand-receptor bond should depend logarithmically on the loading rate:
Page 46
25
𝐹 =
𝐾𝐵𝑇
𝑋𝐵ln (
𝑟𝑋𝐵
𝐾𝑜𝑓𝑓𝐾𝐵𝑇)
(2-3)
where F is the most probable value for the rupture force, r is the loading rate which is a
measure of the rate at which force is applied to the system. It can be determined as the
product of slope of the rupture event (pN/nm) and the tip’s retraction speed (nm/s). Koff
is the dissociation constant in the absence of the applied force. By plotting the average
unbinding force vs. the loading rate and extrapolating to zero force, Koff can be estimated.
The value of Koff provides insight into the dynamics of the interaction, strength of the
bonds and the bond relaxation time (τ = 1/Koff).
A plot of the unbinding force vs. the logarithm of the loading rate usually gives rise
to a straight line (Figure 2.7). For an energy landscape with a single barrier, this would
give rise to a simple linear force spectrum (Figure 2.7A). For systems involving more
than one barrier, this will lead to multiple linear regimes in the force spectrum plot
(Figure 2.7B). Each linear regime corresponds to the overcoming of s single energy
barrier along the unbinding pathway. For a system with more than one energy barrier,
and assuming all barriers lie along a single unbinding pathway, the spectrum is predicted
to follow a continuous sequence of linear regimes.50,90 By varying the loading rate of the
force applied, one can make different barriers emerge and can map the dissociation
landscape of the system. This can provide detailed insight on the molecular dynamics of
a ligand-receptor system.
Page 47
26
Figure 2.1 Schematic of a tip-scanning atomic force microscope. The tip, which is
mounted on a cantilever with a specific spring constant, is scanned over the sample
surface. While scanning, the force between the tip and the sample is measured by
monitoring the deflection of the cantilever with a four quadrant photodiode using an
optical lever sensor. In an optical lever, a laser beam is focused on and reflected from the
rear of the cantilever. A small deflection of the cantilever causes a large change in the
laser spot position at the detector.
Page 48
27
Figure 2.2 Interatomic force vs. distance curve.
Page 49
28
Figure 2.3 Example of a force-distance curve. During the approach phase, there is no
tip-sample contact (1). As the tip approaches the sample, the tip may jump into contact
with the sample surface (2) due to Van der Waals and electrostatic forces. The cantilever
deflects further due to increasing force and gives rise to the linear part of the curve (3).
The tip then retracts in the z-direction and the force of the cantilever is decreasing.
Adhesive forces present between the tip and the sample keep the tip in contact with the
sample and leads to a negative deflection of the cantilever (4). The tip then breaks free
from the surface (pull-off force) and returns to its starting position.
Page 50
29
Figure 2.4 The tip-sample distance. D is the actual tip-sample distance and Zp is the
distance between the rest position of the cantilever and the sample surface and is the
distance controlled during measurement. Interaction forces present causes cantilever
deflection (Zc) and this changes the actual distance between the cantilever and the sample
surface.
Page 51
30
Figure 2.5 Regions in the force-distance curve (adapted from Leite and Herrmann,
2005).91
Page 52
31
Figure 2.6 A schematic diagram of the energy landscape illustrating the dissociation in
the absence of external force (solid line) and with an applied force (dashed line). The
schematic shows how an external mechanical force deforms the energy landscape by
reducing the barrier of the unbinding path.
Page 53
32
Figure 2.7 Dynamic force spectra. The unbinding force usually scales linearly with the
logarithm of the loading rate. For a single barrier, the plot of unbinding force vs. the
logarithm of the loading rate is a simple linear force spectrum (A). For a system
involving two barriers that lie along a single unbinding pathway, this is predicted to
follow a continuous sequence of linear regimes in the force spectrum (B). (Adapted from
Lee et al., 2007)50
Page 54
33
Chapter 3 : Experimental Materials and Methods
3.1 Materials
All synthetic lipids (purity >99%), namely 1,2-dipalmitoyl-sn-glycero-3-
phosphocholine (DPPC), 1,2-dipalmitoyl-sn-glycero-3-phosphoethanolamine (DPPE),
and 1,2-dipalmitoyl-sn-glycero-3-phospho-(1’-rac glycerol) (DPPG) were purchased
from Avanti Polar Lipids (Alabaster, AL) and used as received. Molecular structure of
lipids used are shown in Figure 3.1. Spectrophotometric grade chloroform and methanol
were purchased from Fisher Scientific. Nanopure water with a resistivity of 17.9 MΩcm
was obtained from a Barnstead Nanopure filtration system with a measured pH of 5.5.
Phosphate-buffered saline (PBS) solution (pH 7.4) with and without cations was
purchased from Life Technologies (Grand Island, NY). PBS solution with cations
contains ~0.9 mM CaCl2 and ~0.5 mM MgCl2. Triangular DNP-10 silicon nitride (Si3N4)
AFM tips were purchased from Bruker (Camarillo, CA) with a nominal spring constant
of 0.06 N/m.
3.2 Lipid Solutions Preparation
1 mM DPPC solution was prepared by dissolving DPPC in chloroform. 1 mM
DPPG and DPPE solutions were prepared in a chloroform: methanol mixture of 3:1 (v/v)
and 2:1(v/v), respectively.
Page 55
34
3.3 Purification of SP-A
Bronchoalveolar lavage (BAL) from alveolar proteinosis patients (APP) was used to
obtain APP-SP-A.92 SP-A preparation was assessed by SDS-PAGE with 99% purity.
Bacterial endotoxin levels were determined using the Limulus amebocyte lysate kit
(BioWhittaker, Walkersville, MD). Endotoxin levels in SP-A preparations ranged from
undetectable to 0.2 pg/μg protein. Two SP-A functional assays, oxidative burst and
liposome aggregation,93,94 were performed as quality control experiments.
3.4 AFM Tip Preparation and Functionalization
AFM tips were UV-cleaned for 10 min and then coated with the protein by
immersion of the cantilever in a ~25 µg/ml solution of SP-A in PBS for 1 h at ~37°C.
The tip was then carefully rinsed with PBS to remove loosely bound protein and was
used immediately for AFM measurements.
3.5 Langmuir Blodgett Technique
The Langmuir-Blodgett (LB) technique allows the fabrication of highly ordered
organic films.95 An LB film contains one or more monolayers of the organic material
deposited onto a solid substrate by immersing the substrate in the liquid. A Langmuir
trough is the equipment used for the production of LB films (Figure 3.2). It consists of a
container that is made from an inert material such as Teflon that holds the liquid
subphase onto which the monolayer is spread. The barriers, equipped with a position
detector to measure the film’s surface area, allow symmetric film compression to a
Page 56
35
certain surface pressure that is measured by a surface area sensor. Langmuir troughs
used for the fabrication of LBs are made with dipping wells for the immersion of solid
substrates. By successively dipping the solid substrate up and down through the
monolayer and keeping the surface pressure constant, the monolayer at the air-liquid
interface (Langmuir monolayer) is adsorbed onto the substrate and allows the formation
of highly organized multilayer films. Generally, to ensure formation of a homogenous
film, the deposition is done at high surface pressure to ensure sufficient cohesion in the
monolayer.
In this study, the supported lipid bilayers (SLBs) were prepared using the LB method
with a Minimicro LB-trough from KSV Instruments (Monroe, CT). A lipid monolayer
was first formed by spreading the lipid solution at the air-water interface at 25°C. After
10 min to allow the solvent to completely evaporate, the barriers were compressed at a
constant speed of 5 mm/min to the liquid-condensed (LC) phase corresponding to a
surface pressure of 40 mN/m for DPPC and 30 mN/m for both DPPG and DPPE. 96 The
monolayer was then allowed to equilibrate for 10 min and the surface pressure was
continuously monitored and kept constant during the deposition process by the Wilhelmy
plate method. The LB film was then generated by a single downstroke on a clean glass
slide at a rate of 1 mm/min through the air-monolayer interface. The second layer was
then transferred by a single upstroke at the same speed. The freshly formed SLBs were
kept in a Petri dish containing a small amount of water to ensure hydration prior to AFM
Page 57
36
measurements. To maintain the integrity of the SLB during the AFM measurements,
force curves were collected within 5 h after bilayer preparation.
3.6 AFM Force Spectroscopy
All force measurements were performed on a Dimension Icon atomic force
microscope (Bruker, Camarillo, CA) (Figure 3.3). It is a tip-scanning AFM wherein the
probe is raster-scanned over the sample surface to monitor probe-sample interactions. It
utilizes an XYZ closed loop head that scans at high speed rates with low drift and low
noise. It is also equipped with a high resolution camera to efficiently locate and focus the
sample and for faster probe positioning.
Force-distance curve measurements were conducted in PBS solution with and
without the presence of Ca2+ at ambient temperature. Figure 3.4 shows the schematic for
the experimental setup for force measurements. The functionalized tip is mounted on the
AFM probe and allowed ~10 min to equilibrate in the buffer solution before performing
the calibration with Nanoscope software (v. 8.10) using the thermal tune method69 to
determine an accurate value of the spring constant. The software allows the in-situ
analysis of the thermal noise and automatic spring constant calculation without the need
of any extra equipment. Experimental spring constants of the cantilevers used for each
lipid were measured to be 0.08 ± 0.01 N/m. The force-distance curves were generated by
bringing the protein-functionalized tip towards the SLB at a loading rate of ~5.55 µm/s
and then retracting it while recording the unbinding forces. This approach-retraction
Page 58
37
cycle is then repeated several times at five different locations on the SLB to obtain >300
force curves per location. For each set of curves only the final rupture peak was
considered for the unbinding force values.97-100 These values were then analyzed
statistically to obtain the force distribution (histogram), which was then fitted with a
multi-Gaussian function (Origin 8.0, OriginLab, Northampton, MA) as previously
reported.54-56 The unbinding force distribution for each protein-lipid system is the
average of the measurements performed at different locations on the lipid bilayer and
with different cantilevers on at least three different protein-lipid systems. The distribution
profile then serves as an indicator of the binding properties of SP-A to the different lipids.
3.7 Dynamic Force Spectrum
The dynamic force spectra in this study are generated by determining the rupture
force and loading rates of >500 force curves for each protein-lipid systems. The rupture
force is determined by taking the difference between the peak and the baseline (Figure
3.5). The effective spring constant (Keff) is obtained by determining the slope of a
straight line fit to the curve before the point of bond rupture (Figure 3.5). For this study,
the Keff is obtained using the scanning probe image processor (SPIP) software (version
5.1.11). The Keff is then used to determine the loading rate (described in detail on
Chapter 5). For a group of data points, the mean loading rate is obtained along with the
most frequent unbinding force within that group. For each average loading rate and most
frequent unbinding force the standard deviations are determined. These data points are
Page 59
38
then plotted to generate the dynamic force spectrum with the standard deviations for the
error bars.
Page 60
39
Figure 3.1 Molecular structures of the studied phospholipids.
Page 61
40
Figure 3.2 Schematic illustration of a Langmuir trough with a Wilhelmy plate balance to
measure surface pressure and moveable barriers for symmetric compression or
expansion. For the fabrication of LB films, a dipping mechanism is included to hold the
solid substrate as it is immersed into the liquid.
Page 62
41
Figure 3.3 The atomic force microscope used for this study at the Surface Analysis
Laboratory of the Department of Chemistry and Biochemistry at The Ohio State
University.
Page 63
42
Figure 3.4 Experimental setup for force measurements.
Page 64
43
Figure 3.5 Representative force-distance curve from AFM measurements. From the
force-distance curve, the unbinding force (F), the separation distance (D) and the
effective spring constant (Keff) can be extracted.
Page 65
44
Chapter 4 : Determination of Binding Strengths for Each Protein-Lipid Systems
4.1. SP-A/Lipid Interactions in the Presence of Ca2+
In the work presented here, the lipid headgroup interaction with SP-A in the presence
of Ca2+ was investigated. This interaction may be important in SP-A’s role in lipid
aggregation and in its association with ordered membranes in the gel-like phase and with
lipid vesicles. To assess this interaction, SLBs of surfactant lipids with identical acyl
chains, but with different headgroup charge (at neutral pH, DPPC and DPPE are
zwitterionic, while DPPG is negatively charged) were studied.
The binding affinity of SP-A for the three different surfactant lipids was determined.
In these experiments, the SP-A-functionalized AFM tip was brought into contact with
each SLB allowing the protein to interact with the lipid headgroups and/or acyl chains
(Figure 4.1). The AFM tip was then retracted while the unbinding force between the SP-
A and the SLB was measured. This procedure was repeated at different locations of the
SLB to ensure a homogeneous examination of the sample. Most locations revealed a
significant number of force curves that showed binding events while few locations
showed low binding frequencies, mostly generated force curves with no interaction
detected. The low binding frequencies are possibly due to inhomogeneity of the lipid
bilayer film or the presence of lipid packing defects. AFM imaging studies of lipid
Page 66
45
bilayer have shown that a low surface pressure deposition leads to more lipid packing
defects.101-103 In this study, deposition was done at high surface pressure to ensure a
homogenous bilayer and minimized lipid packing defects. Freshly prepared bilayer films
were also used to ensure integrity of the film. This was demonstrated by Cross et al,
wherein an AFM image of a freshly prepared DPPC bilayer film deposited at ~40mN/m
showed a smooth morphology compared to a week-old DPPC bilayer that revealed
numerous dark regions or holes in the AFM image (Cross).55 In these binding studies,
>8000 force curves were collected from samples prepared from different protein
extraction procedures and different lipid bilayers.
Figure 4.2 shows representative force curves for the SP-A/DPPC interaction that
revealed unbinding events. Force curves (i) and (ii) had similar rupture lengths but
different magnitudes of unbinding force, while force curve (iii) presented a longer rupture
length but similar unbinding force as (i). Force curve (iv) showed the longest rupture
length and the largest unbinding force. Physically, this means that the protein is adhering
more strongly to the bilayer compared to the interaction in (i)-(iii). Similar force curves
as those shown in Figure 4.2 were obtained for the SP-A/DPPG and SP-A/DPPE systems.
The differences in the rupture length can also arise from the unfolding of a portion of the
protein due to the retraction process. Aside from multiple binding, protein unfolding can
also contribute to multiple peaks in the force-distance curve, thus, the peak that describes
the largest separation distance is considered for the unbinding force as mentioned in the
Experimental Methods (Chapter 3). Figure 4.3 is an example of a force curve that shows
Page 67
46
multiple peaks. For such force curves, the peak furthest out (largest separation distance)
is considered as the unbinding event.
The distributions of the unbinding forces for the three different SP-A/lipid systems
are shown in Figure 4.4. Table 4.1 shows the average peak force for each SP-A/lipid
interaction deduced from the multi-Gaussian fit. The unbinding strength between SP-A
and the three surfactant lipids follows in the order of DPPC DPPE > DPPG. DPPC and
DPPE interactions with SP-A produced primary force values of ~80 pN. The fact that
DPPC and DPPE showed comparable peak unbinding force with SP-A suggests that the
nature of the lipid headgroup plays an important role in the interaction with SP-A. As
mentioned above, both DPPC and DPPE headgroups are zwitterionic at neutral pH. The
primary unbinding force is therefore assigned to electrostatic interactions of the dipolar
zwitterionic headgroups with SP-A. In contrast, DPPG generated the weakest interaction
among the three lipids with SP-A with a force of ~70 pN. DPPG is negatively charged
resulting in weaker electrostatic interactions with SP-A as the overall surface charge of
SP-A is also negative at pH 7.4.11
Although the majority of the unbinding forces of SP-A with DPPC and DPPE
resulted in similar force values, DPPC presented a bimodal and broader force
distribution, indicating the presence of secondary interactions of DPPC with SP-A
(Figure 4.4A). A stronger bimodal character was also observed in the force distribution of
the SP-A/DPPG system, suggesting that both DPPC and DPPG have two types of
Page 68
47
interaction with SP-A. The relatively large unbinding forces measured for the second
mode of DPPC (~160 pN) and DPPG (~250 pN) are assigned to interactions of the
multiple binding sites of SP-A with the lipid bilayer.11 Another cause for the larger forces
measured could be the presence of hydrophobic interactions arising from the partial
penetration of SP-A into the DPPC and DPPG lipid bilayers.
The packing of the lipids in the SLBs may account for the differences in unbinding
forces observed among the three surfactant lipids. For instance, DPPE is known to form a
more packed and ordered bilayer relative to DPPC due to the smaller size of the DPPE
headgroup and the ability of DPPE to interact via intermolecular H-bonding.104-106 This
can also be observed from the surface-area isotherms of each lipid in water at room
temperature (Figure 4.5). The LB films for each lipid were taken at 40 mN/m for DPPC
and 30mN/m for DPPG and DPPE, all in the LC phase. At these surface pressures, the
isotherm of DPPE is shifted to a lower mean molecular area compared to DPPC and
DPPG indicating a more packed and densed monolayer in the LC phase. The closer
packing of the DPPE bilayer could restrict the penetration of SP-A and minimize
hydrophobic interactions with the lipid acyl chains. DPPG, however, does not have the
ability to create such intermolecular H-bonds,104 and for this reason, SP-A can penetrate
more easily into the bilayer, thereby resulting in increased hydrophobic interactions. This
behavior has also been seen with myelin basic protein (MBP) which is believed to
interact hydrophobically with lipid fatty acid chains. To this point, MBP showed less
binding with PE than PG, which is consistent with weaker hydrophobic interactions
Page 69
48
caused by closely packed PE molecules.107,108 In the case of DPPC, not only can the
DPPC zwitterionic headgroup contribute to electrostatic interactions with SP-A, but the
methyl groups of the choline headgroup can also provide sites for hydrophobic
interactions. These additional hydrophobic interactions could be responsible for the larger
unbinding forces. Our findings are consistent with previous studies of the SP-A/DPPC
system which suggest that the principal mode of DPPC interaction with SP-A is
hydrophobic in nature and that the hydrophobic neck domain of SP-A may contribute to
its lipid binding property.31,33,37,43,59
Other studies have also revealed stronger interactions of SP-A with DPPC compared
to other surfactant phospholipids. 125I-SP-A binding to lipids immobilized on TLC silica
plates indicated that SP-A specifically binds to DPPC in the presence of Ca2+ ions.31
Other reports did not show specificity but observed preference of SP-A to bind with
DPPC and weaker binding affinities with other surfactant phospholipids.15,25,30,33 In the
work presented here, considering the overall force distribution (primary and secondary
interactions) for each SP-A/lipid system, DPPC gave the broadest distribution and thus
the largest average unbinding force among the three lipids. This average force accounts
for the overall strength of interaction of SP-A with DPPC and takes into account the
headgroup and acyl chain contributions in the interaction with SP-A. This broad
distribution of unbinding forces can be a rationale for the preferred and stronger
interaction of SP-A to DPPC.
Page 70
49
It is important to mention that the results given in the current work were obtained
under dynamic conditions due to the mechanical stress applied to the system, whereas all
previously reported SP-A/lipid binding studies were conducted under equilibrium
conditions. In dynamic force spectroscopy, the bond dissociation is a stochastic process
and is dependent upon the nature of the interaction and the magnitude of the force applied
to the system.51,56 As mentioned above, the main unbinding force is assigned to the SP-
A/lipid headgroup interaction. The unbinding force values found here were similar for
DPPC and DPPE which somewhat contradicts a previous SP-A binding assay study
conducted under equilibrium conditions wherein the PC headgroup showed preference
over PE and PG.25 This deviation is most likely due to the dynamic conditions of the
experiment, the orientation of the protein and the lipids, and how they are supported on a
solid substrate.
As mentioned by Thormann et al., working in the dynamical regime constitutes a
more representative model of the interaction of SP-A with the surfactant lipids in the
alveolar hypophase.56 SP-A can experience shear forces in its interaction with lipids due
to the expansion and contraction of the pulmonary alveoli during breathing. SP-A may
also be bound to the surface of type II cells and macrophages45-48 and may not be free in
solution when interacting with lipids. This is similar to this work’s experimental setup
wherein SP-A is bound to the AFM tip. It should also be mentioned that the magnitude of
the forces measured in this study may change using a different loading rate. Under
dynamic conditions, the unbinding force for weak bonds is dependent upon the force that
Page 71
50
is applied.51 In this experiment, the relative strength of unbinding forces for the three
lipid-systems was investigated thus the same loading rate was used to compare the results
under the same conditions.
4.2. Control Experiments
The magnitude of the binding forces and their frequency distribution are indicators of
the specificity of the interaction among the three different lipids with SP-A. To further
test the specificity of the interaction, control experiments were conducted (Figure 4.6).
The control experiments involved blocking the binding sites of SP-A with a ligand such
as surfactant lipids in buffer solution. Initially, in the absence of a ligand, an SP-A-
coated tip was brought into contact with a DPPC bilayer in buffer, and force curves were
collected. The initial buffer was then replaced with a buffer containing ~1 mM DPPC to
partially block the lipid binding sites of SP-A and additional force curves were then
collected. DPPC showed strong interaction with SP-A and can thus effectively block the
binding site of the protein. After the addition of 1 mM DPPC, only 26% of the total force
curves showed specific binding events. When ~10 mM DPPC was used to block the
binding sites, a further decrease of binding frequency to 12% was observed. A
significant reduction in binding frequency after lipid addition is observed, confirming the
specificity of the probed interaction. The reduction in frequency showed to be
statistically significant after addition of 1 mM DPPC (p-value < 0.0025) and after
addition of 10 mM DPPC (p-value < 0.0001). The decrease in the binding frequency of
the control experiments can be attributed to the partial blocking of the lipid binding sites
Page 72
51
of SP-A at this lipid concentration. Since the critical micelle concentration (cmc) for
DPPC in aqueous solution is ~10-10 M, 2,109 the DPPC in buffer solution used in this
blocking control experiment is composed mostly of lipid vesicles and not free lipids in
solution. However, these lipid vesicles can still bind to the lipid binding domain of SP-A
and affect the binding ability of SP-A with the lipid bilayer.
Additional control experiments were conducted by probing the interaction of a bare
tip with each lipid bilayer and the interaction of a SP-A coated tip with glass slide. A
binding frequency of <3% was observed for each bare tip–lipid system and ~5% for a SP-
A coated tip and glass interaction. These binding frequencies are significantly less than
the binding frequencies (>15%) observed for an SP-A/lipid system. This reduction in
frequency also confirms the specificity of the SP-A/lipid interaction.
Initial experiments were also performed on DPPC and DPPG using
carboxymethylcellulose, a linker, to tether SP-A on the AFM tip through its N-terminal
group and subsequently have its C-terminal end free to interact with the lipid bilayer.
These results show a higher overall unbinding force for DPPC when compared with
DPPG. Control experiments (i.e. without SP-A), however, showed a significant
contribution of nonspecific interactions from the linker to the overall unbinding force
between the protein and the lipid bilayer. Therefore, to avoid any force contributions
from the linker, all subsequent experiments were conducted without it. Even in the case
without the linker, DPPC showed a higher unbinding force relative to DPPG. Moreover,
Page 73
52
it is likely that the orientation of SP-A with and without the linker is similar as evidenced
by the comparable differences in the SP-A/lipid unbinding forces.
4.3. SP-A/Lipid Interactions in the Absence of Ca2+
Additional control experiments were done in the absence of Ca2+. For the SP-
A/DPPC and SP-A/DPPE interaction however, SO42- was added to the PBS solution to
probe the screening effects of the positive charge of the lipid headgroup. Prior studies
have shown the role of Ca2+ in lipid binding of SP-A.11 There have been contradictory
reports however on the Ca2+-dependent binding to DPPC. For instance, Kuroki and Akino
reported the Ca2+-dependent binding of 125I-SP-A with DPPC.31 Meyboom et al. obtained
similar results with DPPC/egg-PC/PG/cholesterol liposomes.24,31 In contrast, other
studies revealed no direct influence of Ca2+ on the binding of SP-A to DPPC. The
presence of Ca2+ ions in the subphase did not change the properties of the SP-A/DPPC
monolayer films and fluorescence studies showed no Ca2+-dependent binding of SP-A to
DPPC vesicles.15,36
In these control experiments, the SP-A/DPPC and SP-A/DPPE systems were
investigated in the absence of Ca2+ and in the presence of a divalent anion (1 mM SO42-
in PBS buffer) to test the contribution of the positive charge of the DPPC and DPPE
headgroup on the main unbinding force through electrostatic interactions. Figures 4.7A
and 4.7B show the distribution of the unbinding forces for DPPC and DPPE in the
presence of SO42-, respectively. There is a decrease in the unbinding forces for DPPC
(~73 pN, 5% decrease) and DPPE (~67 pN, 15% decrease) in the presence of the anion
Page 74
53
which can indicate the partial charge neutralization of the positively charged lipid
headgroup. DPPE’s amine headgroup is less shielded compared to DPPC’s choline
headgroup allowing efficient interaction of SP-A with the positively charged amine,
resulting in a significant decrease in the unbinding force relative to DPPC when SO42- is
present. There is also a decrease in the overall distribution of forces as compared to
Figures 4.4A and 4.4B which suggests a minimized multiple binding and decreased
hydrophobic interactions. This decrease in the unbinding forces due to partial charge
neutralization suggests the contribution of electrostatic interactions for the DPPC/SP-A
and DPPE/SP-A systems.
In the case of DPPG, the presence of Ca2+ was shown in a previous study to promote
SP-A/DPPG interactions. The presence of Ca2+ improved the ability of SP-A to mix with
DPPG and DPPC/DPPG monolayers and a decrease in the interaction of DPPC/DPPG
vesicles with SP-A was observed in the absence of Ca2+.15,36 In this control experiment,
as discussed above, due to the negative charge of DPPG, the SP-A/DPPG interaction
resulted in a lower unbinding force than DPPC and DPPE indicating a weaker interaction
with SP-A. The presence of Ca2+ however can partially neutralize the charge of DPPG
and increase interaction with SP-A. To confirm the role of Ca2+ in the promotion of SP-
A interaction with DPPG, the SP-A/DPPG system was probed in the absence of Ca2+.
There was a decrease in the main unbinding force (~60 pN, 13% decrease) for the SP-
A/DPPG system as shown in Figure 4.7C. There was also a decrease in the overall
unbinding force as evidenced by the decrease in the distribution of the unbinding forces
Page 75
54
as compared to Figure 4.4C. The decrease in the main unbinding force and the overall
distribution of force indicates the Ca2+-dependent binding of SP-A to DPPG.
Page 76
55
Figure 4.1 Illustration of the experimental setup for the interactions between the SP-A-
functionalized AFM tip and the SLB in PBS buffer. The AFM tip is incubated with SP-A
solution and the lipid bilayer is supported on a glass slide. The tip is moved directly
towards the sample (1) then retracted (2) and if adhesion forces are present, a positive
peak is generated in the force-distance curve. The tip is then continuously retracted until
the interaction between the protein and the bilayer is ruptured (3). A force curve is then
generated which provides quantitative information of the forces present between the SP-
A and bilayer.
Page 77
56
Figure 4.2 Representative force curves for the SP-A/DPPC interaction in the presence of
Ca2+. The force curves show different magnitudes of rupture forces and rupture lengths.
Force curve (i) showed a greater unbinding force than (ii) but both showed similar
rupture length. Force curve (iii) showed a longer rupture length but similar unbinding
force as (i). Force curve (iv) showed the strongest interaction having the longest rupture
length and largest unbinding force. For all the SP-A/lipid systems, >8000 force curves
were collected to ensure a full statistical understanding of the interactions.
0 20 40 60 80 100 120 140 160 180 200
0
200
400
600
800
1000
1200
iv
iii
ii
i
Forc
e, p
N
Separation, nm
Page 78
57
Figure 4.3 Representative force curve that exhibits multiple peaks. For such curves, only
the final rupture peak was considered for the unbinding force values.
Page 79
58
Figure 4.4 Frequency distribution of the unbinding forces for the interactions of SP-A in
the presence of Ca2+ with (A) DPPC, (B) DPPE, and (C) DPPG in PBS buffer. The
experimental data (gray bars) are fitted with a multi-Gaussian function (red line). The
maximum peak forces from the Gaussian fit are reported in Table 4.1.
0 100 200 300 400 500 6000
2
4
6
8
10
12
Fre
qu
ency
, % DPPC A
0 100 200 300 400 500 60002
46
810
1214
1618
Fre
qu
ency
, % DPPE B
0 100 200 300 400 500 6000
2
4
6
8
10
12
Force, pN
DPPG C
Fre
qu
ency
, %
Page 80
59
Figure 4.5 Surface-area isotherms of DPPC, DPPG and DPPE at ambient temperature.
The LB film for each lipid were taken in the LC phase at surface pressures of 40 mN/m
for DPPC, and 30 mN/m for both DPPG and DPPE.
Page 81
60
Figure 4.6 The SP-A/DPPC system was used for the DPPC blocking control experiment.
The frequencies were normalized to show a relative decrease in frequency. There is a
decrease of binding frequency to ~26% after addition of 1 mM DPPC in buffer and to
~12% after addition of 10 mM DPPC. The decrease in frequency after blocking confirms
the specificity of interaction. The error bars represent the standard error from four
repeated control experiments.
Page 82
61
Figure 4.7 Control experiments: Frequency distribution of the unbinding forces for the
interactions of SP-A in the absence of Ca2+ with (A) DPPC and (B) DPPE in PBS buffer
with 1 mM SO42-, and with (C) DPPG in PBS buffer only. The experimental data (gray
bars) are fitted with a multi-Gaussian function (red line). The maximum peak forces
from the Gaussian fit are reported in Table 4.2.
0 100 200 300 400 500 6000
5
10
15
20
25
DPPC
A
Fre
qu
ency
, %
0 100 200 300 400 500 6000
5
10
15
20 B
DPPE
Fre
qu
ency
, %
0 100 200 300 400 500 6000
2
4
6
8
10
12
14
16
18
C
DPPG
Fre
qu
ency
, %
Force, pN
Page 83
62
Chapter 5 : Determination of Dissociation Rate Constant (KOFF)
Force spectroscopy provides information on the nature of a ligand-receptor bond and
its unbinding mechanism. In this part of the study, the dissociation rate constant for each
SP-A/lipid systems in the presence of Ca2+, to promote lipid binding, is experimentally
calculated using the Bell-Evans model. The Bell-Evans method has been used
extensively in characterizing binding interactions between molecules in vitro and in
living cells.86,110,111 By extrapolating the force to zero, the dissociation rate constant in
the absence of an applied force (unstressed Koff) can be determined. According to Bell-
Evans theory of kinetic bond rupture,73,89,112 the force acting on a single receptor-ligand
bond should depend on the natural logarithm of the loading rate of the bond as shown in
Eqn. (2-3).
By probing the unbinding forces (F) over a range of loading rates (r), a dynamic
force spectrum can be generated from which the parameters describing the energy
landscape of the bond can be extracted. The bond loading rate (pN/s) is determined by
multiplying the effective spring constant (Keff) in pN/µm with the cantilever retraction
speed (v) in µm/s:
𝑟 = 𝑣𝐾𝑒𝑓𝑓 (5-1)
Page 84
63
Keff approximates the effective spring constant of the cantilever-protein-lipid system.
Because the bonds exist in different thermal states during bond rupture, a distribution of
rupture forces is obtained for each loading rate. To generate the dynamic force spectrum,
the most probable rupture force is taken for each loading rate value.113,114 The most
probable unbinding force (F) is then plotted against r and fitted with a logarithmic
function:
𝐹 =
𝐾𝐵𝑇
𝑋𝛽ln(𝑟) +
𝐾𝐵𝑇
𝑋𝛽ln (
𝑋𝛽
𝐾𝑜𝑓𝑓𝐾𝐵𝑇)
(5-2)
where X is the position of the transition state and KB is the Boltzmann constant. Eqn.
(5.2) is another form of the Bell-Evan’s equation (Eqn. (2-3)). The slope (m) permits
calculation of Xβ:
𝑋𝛽 =
𝐾𝐵𝑇
𝑚
(5-3)
where KBT 4.1 pNnm at room temperature. The Koff can then be obtained by using the
slope m and the y-intercept (b) of Eqn. (5-2):
𝐾𝑜𝑓𝑓 =
1
𝑚exp (−
𝑏
𝑚)
(5-4)
The bond lifetime can then be calculated:
Page 85
64
𝜏 =
1
𝐾𝑜𝑓𝑓
(5-5)
The dynamic force spectrum for each SP-A/lipid system in this study is shown in
Figure 5.1. The force spectrum for SP-A/DPPC and SP-A/DPPG interactions showed
two distinct linear regimes, which locates two energy barriers along their unbinding
pathway as shown by Evans and Ritchie.51 For the SP-A/DPPE interaction however, the
data did not show a clear linear dependence with the loading rate and thus the Bell-Evans
model could not be fitted.
The parameters extracted from the force dynamic spectrum of each protein-lipid
systems are listed in Table 5.1 and 5.2. The low strength regime presented low
correlation values (r2 < 0.1) suggesting that this region could not be modeled with the
Bell-Evans theory. The parameters extracted from the low force regime also showed high
uncertainties making it difficult to interpret the results. The high strength regime
however, resulted in a clear linear dependence of the rupture force with the loading rate.
Because of the distribution of rupture forces for each loading rate, the Bell-Evans
equation was fitted for DPPC and DPPG’s dynamic force spectrum over two different
loading rate ranges for the high and low force regimes (Figure 5.1 A and B). Figure 5A
shows similar number of data points for the low and high force regime. Low rupture
force values were included for high loading rates in the high force regime. For Figure
5B, the higher force regime only included the rupture forces that showed a clear linear
Page 86
65
dependence with the loading rate. The high strength regime Koff is generally reported
because this dominates the kinetics of unbinding as it describes the rate-determining
step.115,116 Using the fitting range shown in Figure 5A, the Koff values calculated for the
high-strength regime are 262.3 ± 1.4 s-1 and 270.3 ± 6.5 s-1 for DPPC and DPPG,
respectively. For Figure 5B, Koff values of 78.9 ± 19.9 s-1 for DPPC and 189.9 ± 82.5 s-1
for DPPG were calculated. Both fitting approach resulted in a stronger interaction of
DPPC with SP-A (lower Koff). The fitting range used for Figure 5B however showed a
significant difference in the binding strength between DPPC and DPPG.
The bimodal character of DPPC and DPPG’s force histograms (Figure 4.4) suggests
the occurrence of two types of interactions (i.e., electrostatic and hydrophobic) between
SP-A and DPPC and DPPG. These two interactions can also be assigned to the two
different regimes (high and low force values) of the dynamic force spectrum plots. In the
case of DPPE, the forces measured were mostly concentrated at the lower strength region
as shown in Figure 5.1B. This result is consistent to the distinctive result of DPPE’s
histogram shown in Figure 4.4. From the histogram, SP-A/DPPE interaction revealed a
narrow distribution of forces compared to the bimodal distributions of DPPC and DPPG.
This unique result of DPPE may also be reflected in its dynamic force plot as most of the
forces measured were observed at the lower force region (low loading rates). The Bell-
Evans equation was not fitted to DPPE’s force plot and the corresponding parameters
were not extracted because the rupture forces measured did not show a clear linear
dependence with the loading rate. At higher loading rates, however there is a linear
Page 87
66
dependence of rupture force as seen in the cases for DPPC and DPPG (Figure 5.1A). It is
also possible that the loading rates used for this study to measure the forces were not
broad enough to probe a potential higher strength regime of SP-A/DPPE interaction. The
lack of secondary interaction for DPPE as discussed in Chapter 4 can be due to the closer
packing of the DPPE bilayer that could restrict the efficient penetration of SP-A and
minimize hydrophobic interactions. This result also confirms the role of hydrophobic
interactions on the binding strength of SP-A with the surfactant lipids.
From the Koff values obtained, the binding strength between SP-A and the three
surfactant lipids follows in the order of DPPC > DPPG > DPPE. DPPC showed the
strongest binding interaction with SP-A. This is consistent with the results from Chapter
4, considering the overall distribution of forces, wherein DPPC showed the strongest
interaction. This is also consistent with studies that have shown stronger interaction of
SP-A with DPPC compared to other surfactant lipids.
Figure 5.2 is an attempt to sketch the potential energy curves for each SP-A/DPPC
and SP-A/DPPG interaction based from the parameters calculated in Tables 5.1 and 5.2.
For DPPC and DPPG, the two linear regimes in their force spectrum plot locate two
energy barriers in their potential energy curves. The high-strength regimes locate the
inner barrier at Xβ = 0.4 and 0.6 Å for DPPC and DPPG, respectively. The lower strength
regimes map out the energy barriers at Xβ = 3.0 and 4.6 Å, respectively. Extrapolation of
each linear regime to zero force yields Koff and therefore the lifetime of the bond, τ.
Page 88
67
Although the bond lifetimes for the inner barriers of DPPC and DPPG are similar, SP-
A/DPPC interaction showed a slightly steeper energy barrier indicating that it can
withstand higher forces than SP-A/DPPG interaction. DPPC however showed a brittle
character as it can withstand high forces but small deformations (smaller Xβ). DPPG
showed an elastic character, as it can withstand lower forces but larger deformations
(larger Xβ).115
The Koff values obtained from the SP-A protein/lipid systems from this study are
higher than the Koff values obtained for other protein-lipid systems. Garcia et al. reported
Koff values of 10-2 s-1 for the interaction of DPPC and DPPG bilayers with a peripheral
membrane binding protein, calgranulin C, using surface plasmon resonance.117 The
interaction of Raf-C1 protein, a member of the protein kinase family, with supported PG
lipid bilayers revealed a Koff value of 10-4 s-1 using quartz crystal microbalance.118
Walther et al. reported a Koff value of 10-3 s-1 for the adhesion of Mini-B protein, a
synthetic surfactant related to native surfactant protein-B (SP-B), to DPPC liposomes
using plasmon resonance.119 The dissociation rate constants obtained under equilibrium
conditions are often magnitudes lower than the dissociation rate constants obtained under
dynamic conditions or in the presence of applied force.73,113 Depending on the forces a
system experiences in its physiological condition, the lifetime of the bonds may differ
greatly between the experimental and physiological conditions. As mentioned in Chapter
4, the dynamic conditions of this experiment is a good model of the SP-A/lipid
Page 89
68
interactions because of the shear forces experienced by SP-A in the alveolar space during
the expansion and contraction of the lungs.
Protein-protein systems have been the commonly used ligand-receptor pair in force
spectroscopy to study protein-protein interactions in the cellular level. Using similar
loading rates as in this study, Evans et al reported a Koff value of 102 s-1 for a L-
selectin/P-selectin glycoprotein ligand-1 (PSGL-1) interaction.116 Merkel et al and Lee et
al reported a Koff of 101 s-1 for an avidin/biotin interaction and fibrinogen/RGD linear
peptide sequence, respectively.112 The Koff values obtained in this study showed
comparable values with these protein-protein systems using force spectroscopy. The SP-
A/lipid systems however, still showed weaker interactions than other protein/protein
systems.
Page 90
69
Figure 5.1 Force dynamic spectrum for each SP-A/lipid interaction. Koff values
were calculated using the same fitting method over two different loading rate
ranges. (A) Low force regime range is 103 - 104 pN/s and high force regime is 104 –
106 pN/s (B) Low force regime is 103 – 105 pN/s and high force regime range is
105-106 pN/s. Unbinding forces for DPPE did not show a clear linear dependence
with loading rate and thus was not fitted with the Bell-Evans model.
Page 91
70
Figure 5.2 Potential energy curves for SP-A/DPPC (A) and SP-A/DPPG (B)
interactions based from the parameters calculated from Figure 5.1A using the Bell-
Evans model.
Page 92
71
Slope (m) y-intercept (b) Xβ (Å) Koff (s-1) τ (s)
DPPC 13.6 -54.7 3.0 ± 0.1 4.0 ± 3.0 0.25 ± 0.14
DPPG 9.0 -23.9 4.6 ± 0.8 1.6 ± 1.8 0.30 ± 0.12
Table 5.1 Parameters extracted from the low strength regime of the dynamic force
spectrum plot in Figure 5.1A using Bell-Evans model for each SP-A/lipid system. The
unbinding force values in the low strength regime of Figure 5.1B did not show a clear
linear dependence with the loading rate and hence was not fitted with the Bell-Evans
equation.
Page 93
72
A B
Slope
(m)
y-
intercept
(b)
Xβ (Å) Koff (s-1) τ (s) Slope
(m)
y-
intercept
(b)
Xβ (Å) Koff (s-1) τ (s)
DPPC 88.9 -893.6 0.4 ± 0.0 262.3 ±
1.4
0.0036 ±
0.0000
50.4 -417.8 0.08 ±
0.01
78.9 ±
19.9
0.012
±
0.004
DPPG 73.9 -731.8 0.6 ± 0.1 270.4 ±
6.5
0.0034 ±
0.0000
51.8 -476.3 0.08 ±
0.02
189.9 ±
82.5
0.005
±
0.002
Table 5.2 Parameters extracted from the high strength regime of the dynamic force spectrum plot in Figure 5.1A and B
using Bell-Evans model for each SP-A/lipid system.
72
Page 94
73
Chapter 6 : Conclusions and Future Work
The work presented in this thesis is motivated by an interest in understanding the role
of SP-A in lung surfactant activity and phospholipid metabolism which is dependent
upon its ability to bind to surfactant lipids. Lipid binding studies done on SP-A are in
equilibrium conditions, but due to the conditions in the lungs during the breathing cycle,
it is best to study the lipid binding properties of SP-A under dynamic conditions. In this
study, AFM was used to quantify the distribution of unbinding forces between SP-A and
three surfactant lipids under dynamic conditions. The SP-A-coated tip and SLBs were
used to model the dynamic conditions of SP-A/lipid binding in the alveolar hypophase.
DPPC, being the most abundant alveolar phospholipid, showed a broader force
distribution among the three phospholipids that were studied. Although DPPC revealed a
comparable main force value as DPPE for the SP-A/lipid headgroup interaction, its broad
and bimodal distribution of forces indicates a secondary interaction resulting mainly from
hydrophobic interactions of the lipid acyl chains with the protein. These forces resulted
in an overall preferred and stronger interaction of SP-A for DPPC.
To verify the role of the lipid headgroup charge on the main unbinding force through
electrostatic interactions, control experiments were done in the absence of Ca2+. DPPC
and DPPE experiments done in the absence of Ca2+ and in the presence of SO42- resulted
in a decrease in the main unbinding force which suggests the partial shielding and the
Page 95
74
role of the positive charge of the lipid headgroup in electrostatic interactions with SP-A.
In the case of SP-A/DPPG interaction in the absence of Ca2+, a decrease in the main
unbinding force and distribution of force was also observed indicating the Ca2+ dependent
binding with SP-A. These set of control experiments shows the role of electrostatic
interactions in SP-A/lipid binding. By shielding the positive charge of DPPC and DPPE
and unshielding the negative charge of DPPG, a decrease in the main peak force and
overall distribution of unbinding forces is observed which can confirm the contribution of
electrostatic interactions on the main peak unbinding force.
To further evaluate the strength of interaction, the dissociation constants for each
protein-lipid systems were determined using the Bell-Evans model. The two Gaussian
peaks observed for DPPC and DPPG histograms corresponded to two linear regimes in
their force spectrum plot. The Koff value was not determined for DPPE as the forces
measured did not exhibit clear dependence with the loading rate. The dissociation rate
constants revealed strongest binding strength for SP-A/DPPC interaction. The two types
of interactions, as suggested by the bimodal distribution of force for the DPPC and DPPG
histograms, were also observed in their force spectrum plots. The two modes of binding
can be from electrostatic interactions between the charged lipid headgroup and SP-A and
hydrophobic interactions between the lipid acyl chains and SP-A. Hydrophobic
interactions are assigned to higher forces measured and these forces gave a strong
dependence with the loading rate wherein Koff is extracted.
Page 96
75
The overall results suggest that SP-A/lipid interaction involves both electrostatic
and hydrophobic interactions and that both should be taken into account in evaluating the
strength of interaction of lipids with SP-A. Electrostatic interactions between the charged
lipid headgroup and SP-A can orient the protein for a more favorable interaction with the
lipids. As suggested by previous studies, hydrophobic interaction may be the primary
mode of binding of SP-A with surfactant lipids and that it has a strong binding with
DPPC compared to other surfactant phospholipids. This is also observed in this study
wherein DPPC presented the broadest overall distribution of force which takes into
account both electrostatic and hydrophobic interactions. The dissociation rate constant
also revealed a stronger interaction of SP-A with DPPC than DPPG or DPPE.
Further work should be done to probe the changes in the SP-A/lipid interactions
under different conditions. Change in temperature, pH and ionic concentration are
among the important conditions that must be explored to fully understand the binding
interactions of SP-A with different surfactant lipids. The effect of the physical state of
the phospholipid bilayer in the unbinding forces is also of interest.
Page 97
76
References
1. Daniels, C. B., and Orgeig, S. News in Physiological Sciences 2003, 18, 151-157.
2. Notter, R. H. (2000) Lung Surfactants: Basic Science and Clinical Applications,
Marcel Dekker, Inc., New York.
3. Schurch, S., Lee, M., and Gehr, P. Pure Appl. Chem. 1992, 64, 1745-1750.
4. Klein, J. M., McCarthy, T. A., Dagle, J. M., and Snyder, J. M. Am. J. Physiol.:
Lung Cell. Mol. Physiol. 2002, 282, L386-L393.
5. Williams, M. C. J. Cell Biol. 1977, 72, 260-277.
6. Malloy, J. L., and Wright, J. R. Respir. Res. 2004, 5, 1-9.
7. Veldhuizen, R., Nag, K., Orgeig, S., and Possmayer, F. Biochim. Biophys. Acta,
Mol. Basis Dis. 1998, 1408, 90-108.
8. Perez-Gil, J., and Weaver, T. E. Physiology. 2010, 25, 132-141.
9. Zuo, Y. Y., Veldhuizen, R. A. W., Neumann, A. W., Petersen, N. O., and
Possmayer, F. Biochim. Biophys. Acta, Biomembr. 2008, 1778, 1947-1977.
10. Kuronuma, K., Mitsuzawa, H., Takeda, K., Nishitani, C., Chan, E. D., Kuroki, Y.,
Nakamura, M., and Voelker, D. R. J. Biol. Chem. 2009, 284, 25488-25500.
11. Casals, C. Pediatr. Pathol. Mol. Med. 2001, 20, 249-268.
12. Hawgood, S., Efrati, H., Schilling, J., and Benson, B. J. Biochem. Soc. Trans.
1985, 13, 1092-1096.
13. Khubchandani, K. R., and Snyder, J. M. FASEB J. 2001, 15, 59-69.
14. Sueishi, K., and Benson, B. J. Biochim. Biophys. Acta 1981, 665, 442-453.
15. Taneva, S., McEachren, T., Stewart, J., and Keough, K. M. W. Biochemistry.
1995, 34, 10279-10289.
16. Voss, T., Eistetter, H., Schafer, K. P., and Engel, J. J. Mol. Biol. 1988, 201, 219-
227.
17. Creuwels, L., vanGolde, L. M. G., and Haagsman, H. P. Lung 1997, 175, 1-39.
18. Haagsman, H. P., White, R. T., Schilling, J., Lau, K., Benson, B. J., Golden, J.,
Hawgood, S., and Clements, J. A. Am. J. Physiol. 1989, 257, L421-L429.
19. Benne, C. A., Kraaijeveld, C. A., Vanstrijp, J. A. G., Brouwer, E., Harmsen, M.,
Verhoef, J., Vangolde, L. M. G., and Vaniwaarden, J. F. J. Iinfect. Dis. 1995, 171,
335-341.
20. Haagsman, H. P., Elfring, R. H., Vanbuel, B. L. M., and Voorhout, W. F.
Biochem. J 1991, 275, 273-276.
21. Vaniwaarden, J. F., Vanstrijp, J. A. G., Visser, H., Haagsman, H. P., Verhoef, J.,
and Vangolde, L. M. G. J. Biol. Chem. 1992, 267, 25039-25043.
22. King, R. J., Phillips, M. C., Horowitz, P. M., and Dang, S. C. Biochim. Biophys.
Acta 1986, 879, 1-13.
23. McCormack, F. X., Calvert, H. M., Watson, P. A., Smith, D. L., Mason, R. J., and
Voelker, D. R. J. Biol. Chem. 1994, 269, 5833-5841.
Page 98
77
24. Meyboom, A., Maretzki, D., Stevens, P. A., and Hofmann, K. P. J. Biol. Chem.
1997, 272, 14600-14605.
25. Meyboom, A., Maretzki, D., Stevens, P. A., and Hofmann, K. P. Biochim.
Biophys. Acta, Mol. Cell Biol. Lipids. 1999, 1441, 23-35.
26. Reilly, K. E., Mautone, A. J., and Mendelsohn, R. Biochemistry 1989, 28, 7368-
7373.
27. Voorhout, W. F., Veenendaal, T., Haagsman, H. P., Verkleij, A. J., Vangolde, L.
M. G., and Geuze, H. J. J. Histochem. Cytochem. 1991, 39, 1331-1336.
28. Williams, M. C., Hawgood, S., and Hamilton, R. L. Am. J. Respir. Cell Mol. Biol.
1991, 5, 41-50.
29. Ruano, M. L. F., Nag, K., Casals, C., Perez-Gil, J., and Keough, K. M. W.
Biophys. J. 1999, 77, 1469-1476.
30. Ruano, M. L. F., Nag, K., Worthman, L. A., Casals, C., Perez-Gil, J., and
Keough, K. M. W. Biophys. J. 1998, 74, 1101-1109.
31. Kuroki, Y., and Akino, T. J. Biol. Chem. 1991, 266, 3068-3073.
32. Hawgood, S., Benson, B. J., and Hamilton, R. L. Biochemistry. 1985, 24, 184-
190.
33. King, R. J., Carmichael, M. C., and Horowitz, P. M. J. Biol. Chem. 1983, 258,
672-680.
34. Perez-Gil, J. Biochim. Biophys. Acta, Biomembr. 2008, 1778, 1676-1695.
35. Ruano, M. L. F., Miguel, E., PerezGil, J., and Casals, C. Biochem. J 1996, 313,
683-689.
36. Casals, C., Miguel, E., and Perez-Gil, J. Biochem. J 1993, 296, 585-593.
37. Kuroki, Y., McCormack, F. X., Ogasawara, Y., Mason, R. J., and Voelker, D. R.
J. Biol. Chem. 1994, 269, 29793-29800.
38. McCormack, F. X., Kuroki, Y., Stewart, J. J., Mason, R. J., and Voelker, D. R. J.
Biol. Chem. 1994, 269, 29801-29807.
39. McCormack, F. X., Stewart, J., Voelker, D. R., and Damodarasamy, M.
Biochemistry. 1997, 36, 13963-13971.
40. Ogasawara, Y., and Voelker, D. R. J. Biol. Chem. 1995, 270, 14725-14732.
41. Seaton, B. A., Crouch, E. C., McCormack, F. X., Head, J. F., Hartshorn, K. L.,
and Mendelsohn, R. Innate Immunity 2010, 16, 143-150.
42. Ogasawara, Y., McCormack, F. X., Mason, R. J., and Voelker, D. R. J. Biol.
Chem. 1994, 269, 29785-29792.
43. Sano, H., Kuroki, Y., Honma, T., Ogasawara, Y., Sohma, H., Voelker, D. R., and
Akino, T. J. Biol. Chem. 1998, 273, 4783-4789.
44. Wright, J. R. Am. J. Physiol. 1990, 259, L1-L12.
45. Wright, J. R., and Youmans, D. C. Am. J. Physiol.: Lung Cell. Mol. Physiol. 1995,
268, L772-L780.
46. Pison, U., Wright, J. R., and Hawgood, S. Am J. Physiol. 1992, 262, L412-L417.
47. Poelma, D. L. H., Zimmermann, L. J. I., Scholten, H. H., Lachmann, B., and van
Iwaarden, J. F. Am. J. Physiol.: Lung Cell. Mol. Physiol. 2002, 283, L648-L654.
48. Wright, J. R., Borchelt, J. D., and Hawgood, S. Proc. Natl. Acad. Sci. USA. 1989,
86, 5410-5414.
Page 99
78
49. Worthman, L. A. D., Nag, K., Rich, N., Ruano, M. L. F., Casals, C., Perez-Gil, J.,
and Keough, K. M. W. Biophys. J. 2000, 79, 2657-2666.
50. Lee, C. K., Wang, Y. M., Huang, L. S., and Lin, S. M. Micron. 2007, 38, 446-
461.
51. Evans, E., and Ritchie, K. Biophys. J. 1997, 72, 1541-1555.
52. Eibl, R. H., and Moy, V. T. (2005) Atomic Force Microscopy Measurements of
Protein–Ligand Interactions on Living Cells. in Methods in Molecular Biology
(Nienhaus, G. U. ed.), Humana Press Inc., Totowa, NJ. pp 439-449
53. Helenius, J., Heisenberg, C. P., Gaub, H. E., and Muller, D. J. J. Cell Sci. 2008,
121, 1785-1791.
54. Desmeules, P., Grandbois, M., Bondarenko, V. A., Yamazaki, A., and Salesse, C.
Biophys. J. 2002, 82, 3343-3350.
55. Cross, B., Ronzon, F., Roux, B., and Rieu, J. P. Langmuir. 2005, 21, 5149-5153.
56. Thormann, E., Dreyer, J. K., Simonsen, A. C., Hansen, P. L., Hansen, S.,
Holmskov, U., and Mouritsen, O. G. Biochemistry. 2007, 46, 12231-12237.
57. Floros, J., Steinbrink, R., Jacobs, K., Phelps, D., Kriz, R., Recny, M., Sultzman,
L., Jones, S., Taeusch, H. W., Frank, H. A., and Fritsch, E. F. J. Biol. Chem. 1986,
261, 9029-9033.
58. White, R. T., Damm, D., Miller, J., Spratt, K., Schilling, J., Hawgood, S., Benson,
B., and Cordell, B. Nature 1985, 317, 361-363.
59. Head, J. F., Mealy, T. R., McCormack, F. X., and Seaton, B. A. J. Biol. Chem.
2003, 278, 43254-43260.
60. Binnig, G., Quate, C. F., and Gerber, C. Phys. Rev. Lett. 1986, 56, 930-933.
61. D'Acunto, M. (2006) Nanotribology and Biomaterials: New Challenges for
Atomic Force Microscopy. in Nanophysics, Nanoclusters and Nanodevices
(Gehar, K. S. ed.), Nova Publishers, Inc., New York. pp
62. Seo, Y., and Jhe, W. Rep. Prog. Phys. 2008, 71,
63. Butt, H. J., Cappella, B., and Kappl, M. Surf. Sci. Rep. 2005, 59, 1-152.
64. Corporation, O. (2014) Low-Wear Silicon Nitride Cantilever.
65. (2004) Atomic Force Microscopy: Biomedical Methods and Applications,
Humana Press, Totowa, New Jersey
66. Cappella, B., and Dietler, G. Surf. Sci. Rep. 1999, 34, 1-+.
67. Noy, A., and Friddle, R. W. Methods 2013, 60, 142-150.
68. Berquand, A., and Ohler, B. (2010) Common Approaches to Tip
Functionalization for AFM-Based Molecular Recognition Measurements.
(Bruker ed.
69. Hutter, J. L., and Bechhoefer, J. Rev. Sci. Instrum. 1993, 64, 1868-1873.
70. Butt, H. J., and Jaschke, M. Nanotechnology 1995, 6, 1-7.
71. Levy, R., and Maaloum, M. Nanotechnology 2002, 13, 33-37.
72. Viani, M. B., Schaffer, T. E., Chand, A., Rief, M., Gaub, H. E., and Hansma, P.
K. J. Appl. Phys. 1999, 86, 2258-2262.
73. Evans, E. Annu. Rev. Biophys. Biomol. Struct. 2001, 30, 105-128.
74. Friddle, R. W., Noy, A., and De Yoreo, J. J. Proc. Natl. Acad. Sci. USA. 2012,
109, 13573-13578.
Page 100
79
75. DeRose, J. A., and Revel, J. P. Thin Solid Films 1998, 331, 194-202.
76. Jandt, K. D., McMaster, T. J., Miles, M. J., and Petermann, J. Macromolecules
1993, 26, 6552-6556.
77. Klinov, D. V., Lagutina, I. V., Prokhorov, V. V., Neretina, T., Khil, P. P.,
Lebedev, Y. B., Cherny, D. I., Demin, V. V., and Sverdlov, E. D. Nucleic Acids
Res. 1998, 26, 4603-4610.
78. Orisaka, S., Minobe, T., Uchihashi, T., Sugawara, Y., and Morita, S. Appl. Surf.
Sci. 1999, 140, 243-246.
79. Hansma, H. G., Oroudjev, E., Baudrey, S., and Jaeger, L. J. Microsc-Oxford
2003, 212, 273-279.
80. Li, S. L., and Palmer, A. F. Langmuir 2004, 20, 7917-7925.
81. Reddy, C. V. G., Malinowska, K., Menhart, N., and Wang, R. Biochim. Biophys.
Acta, Biomembr. 2004, 1667, 15-25.
82. Sitko, J. C., Mateescu, E. M., and Hansma, H. G. Biophys. J. 2003, 84, 419-431.
83. Chen, A., and Moy, V. T. Biophys. J. 2000, 78, 2814-2820.
84. Kaur, J., Singh, K. V., Schmid, A. H., Varshney, G. C., Suri, C. R., and Raje, M.
Biosens Bioelectron. 2004, 20, 284-293.
85. Kienberger, F., Kada, G., Mueller, H., and Hinterdorfer, P. J. Mol. Biol. 2005,
347, 597-606.
86. Lee, I., and Marchant, R. E. Surf. Sci. 2001, 491, 433-443.
87. Li, H. B., Zhang, W. K., Xu, W. Q., and Zhang, X. Macromolecules 2000, 33,
465-469.
88. Rief, M., Clausen-Schaumann, H., and Gaub, H. E. Nat. Struct. Biol. 1999, 6,
346-349.
89. Bell, G. Science 1978, 200, 618-627.
90. Nevo, R., Stroh, C., Kienberger, F., Kaftan, D., Brumfeld, V., Elbaum, M., Reich,
Z., and Hinterdorfer, P. Nature Structural Biology 2003, 10, 553-557.
91. Leite, F. L., and Herrmann, P. S. P. J. Adhes. Sci. Technol. 2005, 19, 365-405.
92. Beharka, A. A., Gaynor, C. D., Kang, B. K., Voelker, D. R., McCormack, F. X.,
and Schlesinger, L. S. J. Immunol. 2002, 169, 3565-3573.
93. Crowther, J. E., Kutala, V. K., Kuppusamy, P., Ferguson, J. S., Beharka, A. A.,
Zweier, J. L., McCormack, F. X., and Schlesinger, L. S. J. Immunol. 2004, 172,
6866-6874.
94. Crowther, J. E., and Schlesinger, L. S. Am. J. Physiol.: Lung Cell. Mol. Physiol.
2006, 290, L334-L342.
95. Jr., O. N. O. Braz. J. Phys. 1992, 22, 60-69.
96. Chen, X. K., Huang, Z. S., Hua, W., Castada, H., and Allen, H. C. Langmuir.
2010, 26, 18902-18908.
97. Baumgartner, W., Hinterdorfer, P., Ness, W., Raab, A., Vestweber, D., Schindler,
H., and Drenckhahn, D. Proc. Natl. Acad. Sci. USA. 2000, 97, 4005-4010.
98. Casillas-Ituarte, N. N., Lower, B. H., Lamlertthon, S., Fowler, V. G., and Lower,
S. K. J. Biol. Chem. 2012, 287, 6693-6701.
Page 101
80
99. Schwesinger, F., Ros, R., Strunz, T., Anselmetti, D., Guntherodt, H. J., Honegger,
A., Jermutus, L., Tiefenauer, L., and Pluckthun, A. Proc. Natl. Acad. Sci. USA.
2000, 97, 9972-9977.
100. Strunz, T., Oroszlan, K., Schafer, R., and Guntherodt, H. J. Proc. Natl. Acad. Sci.
USA. 1999, 96, 11277-11282.
101. Bassereau, P., and Pincet, F. Langmuir 1997, 13, 7003-7007.
102. Benz, M., Gutsmann, T., Chen, N. H., Tadmor, R., and Israelachvili, J. Biophys. J.
2004, 86, 870-879.
103. Mou, J. X., Yang, J., and Shao, Z. F. J. Mol. Biol. 1995, 248, 507-512.
104. Boggs, J. M. Can. J. Biochem. 1980, 58, 755-770.
105. Hitchcock, P. B., Mason, R., Thomas, K. M., and Shipley, G. G. Proc. Natl. Acad.
Sci. USA. 1974, 71, 3036-3040.
106. Leekumjorn, S., and Sum, A. K. Biochim. Biophys. Acta, Biomembr. 2007, 1768,
354-365.
107. Boggs, J. M., Stollery, J. G., and Moscarello, M. A. Biochemistry 1980, 19, 1226-
1234.
108. Stollery, J. G., Boggs, J. M., and Moscarello, M. A. Biochemistry 1980, 19, 1219-
1226.
109. Smith, R., and Tanford, C. J. Mol. Biol. 1972, 67, 75-83.
110. Chang, M. I., Panorchan, P., Dobrowsky, T. M., Tseng, Y., and Wirtz, D. J. Virol.
2005, 79, 14748-14755.
111. Alcaraz, J., Buscemi, L., Grabulosa, M., Trepat, X., Fabry, B., Farre, R., and
Navajas, D. Biophys. J. 2003, 84, 2071-2079.
112. Merkel, R., Nassoy, P., Leung, A., Ritchie, K., and Evans, E. Nature 1999, 397,
50-53.
113. Franz, C. M., and Taubenberger, A. (2012) AFM-Based Single-Cell Force
Spectroscopy. in Atomic Force Microscopy in Liquid, Wiley-VCH Verlag GmbH
& Co. KGaA. pp 307-330
114. Zhang, X. H., Wojcikiewicz, E., and Moy, V. T. Biophys. J. 2002, 83, 2270-2279.
115. Bustanji, Y., Arciola, C. R., Conti, M., Mandello, E., Montanaro, L., and Samori,
B. Proc. Natl. Acad. Sci. USA. 2003, 100, 13292-13297.
116. Evans, E., Leung, A., Hammer, D., and Simon, S. Proc. Natl. Acad. Sci. USA.
2001, 98, 3784-3789.
117. Garcia, A. F., Lopes, J. L. S., Costa, A. J., Wallace, B. A., and Araujo, A. P. U.
Plos One 2013, 8,
118. Eing, A., Janshoff, A., Galla, H. J., Block, C., and Steinem, C. Chembiochem
2002, 3, 190-197.
119. Walther, F. J., Waring, A. J., Hernandez-Juviel, J. M., Gordon, L. M., Schwan, A.
L., Jung, C. L., Chang, Y. S., Wang, Z. D., and Notter, R. H. Plos One 2007, 2,


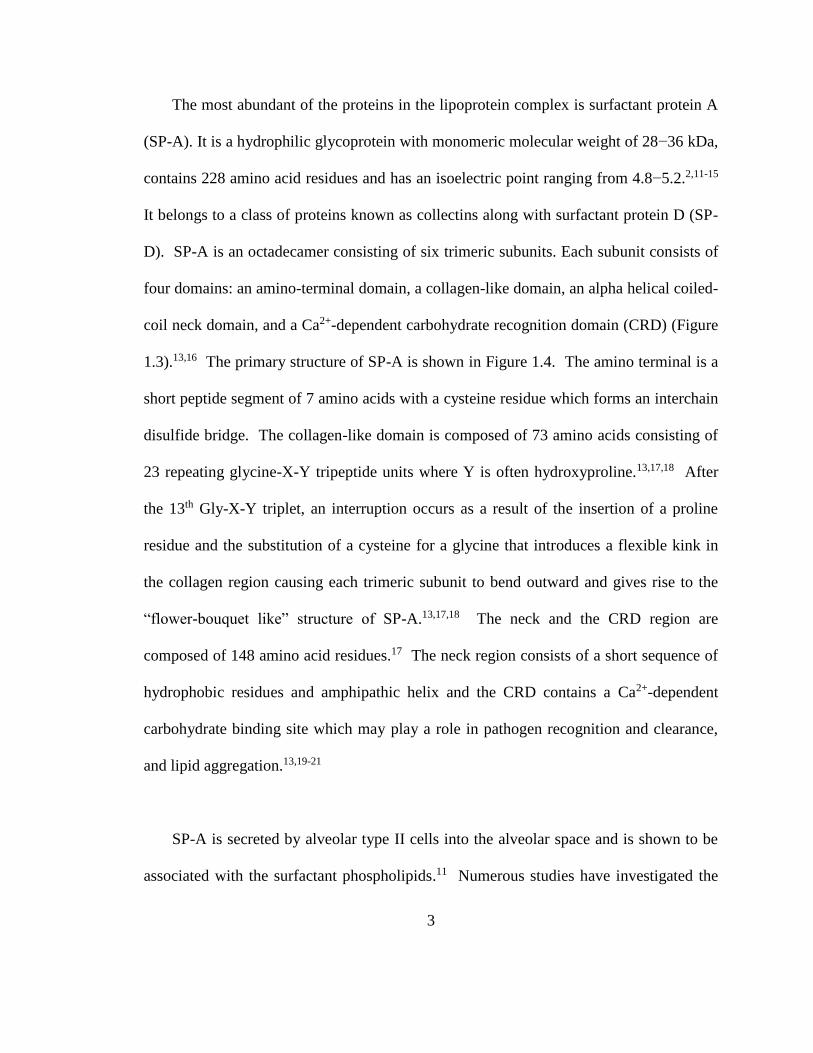

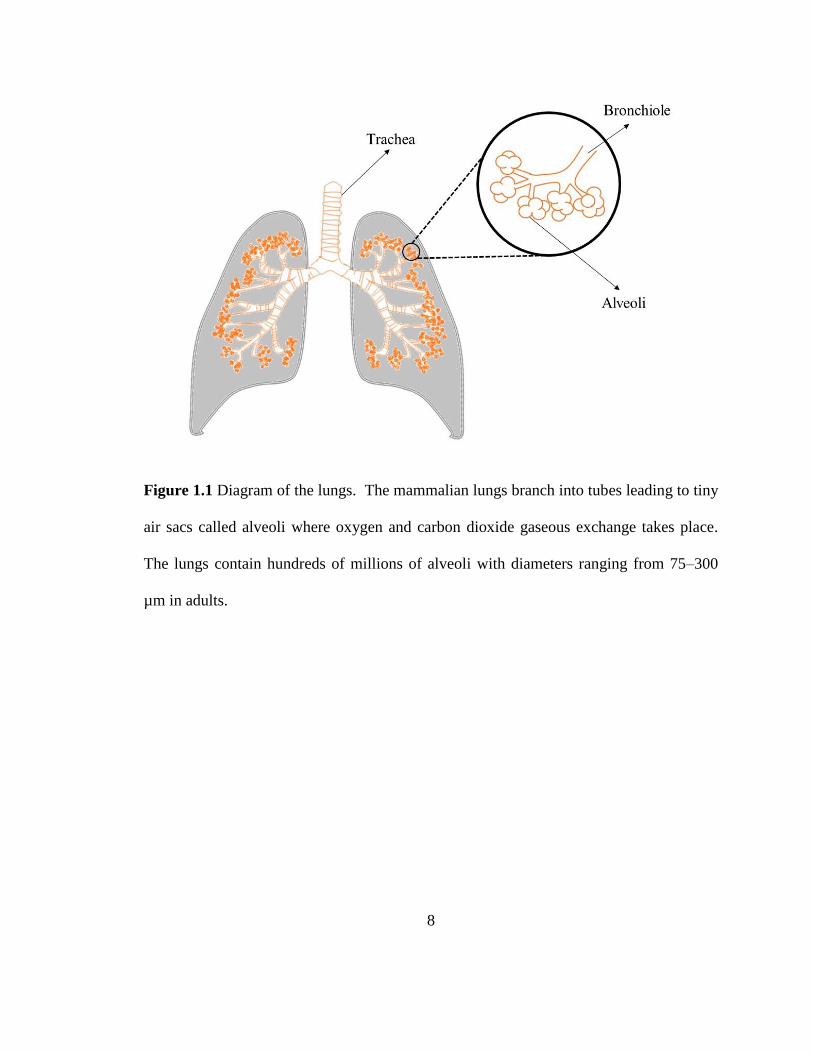

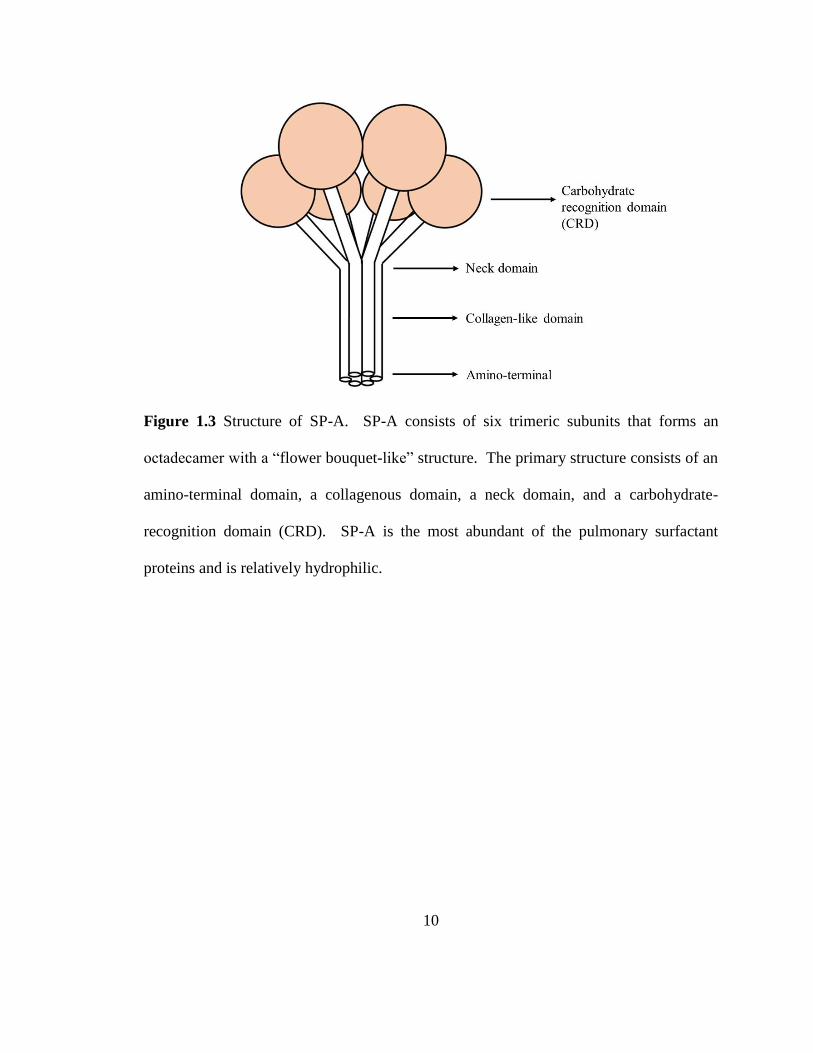


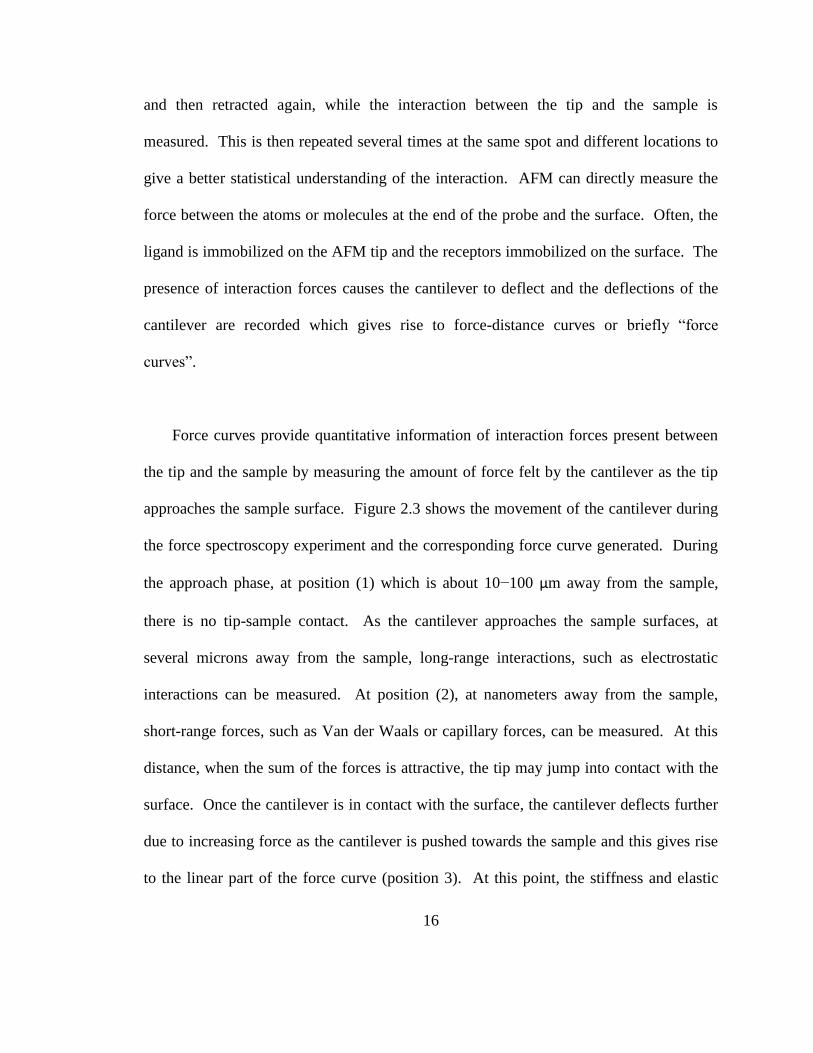

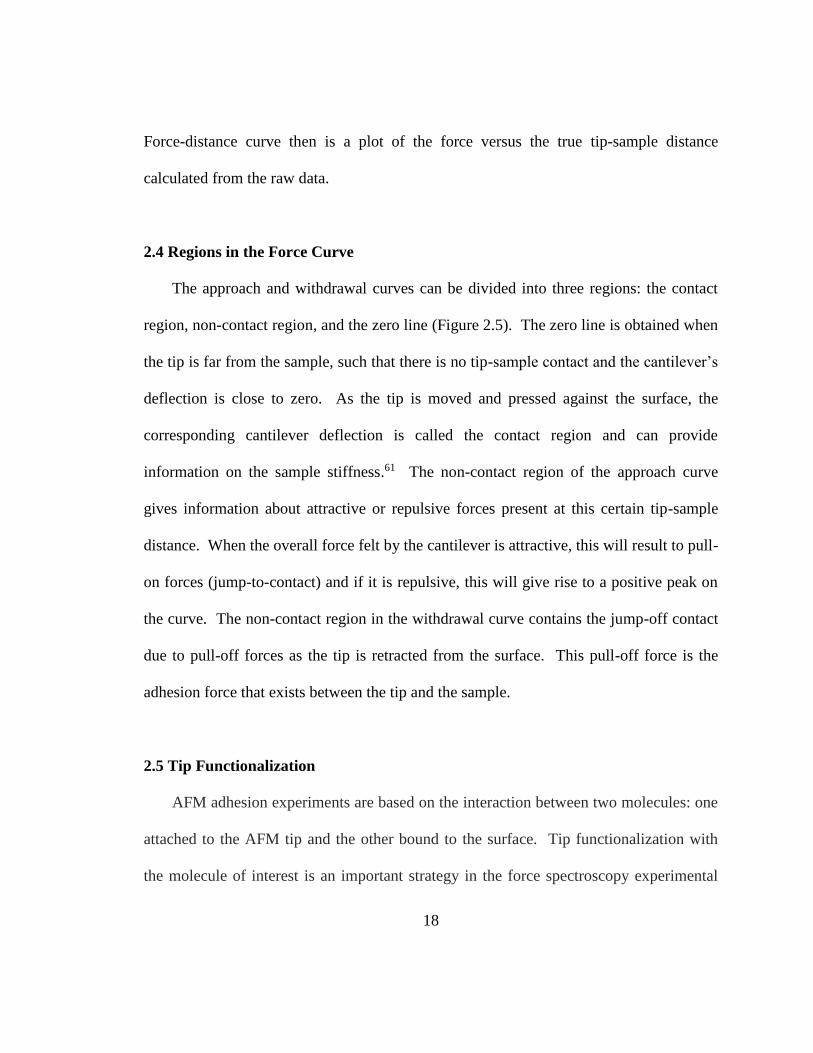


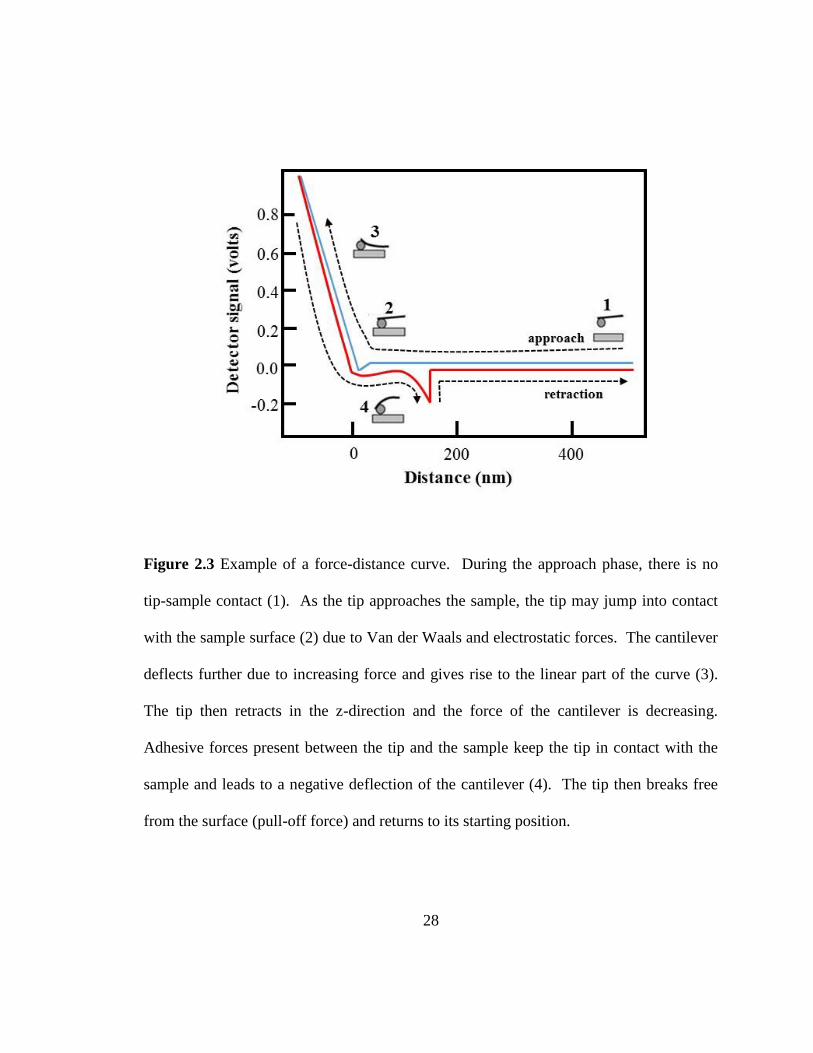

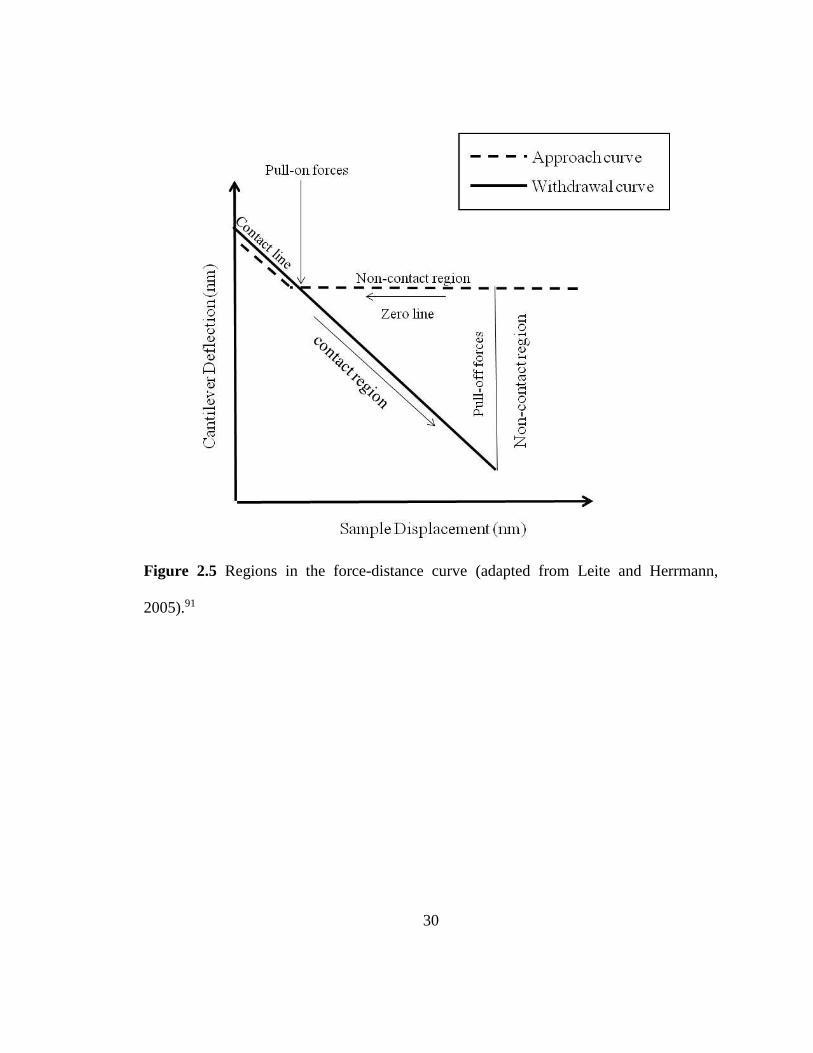


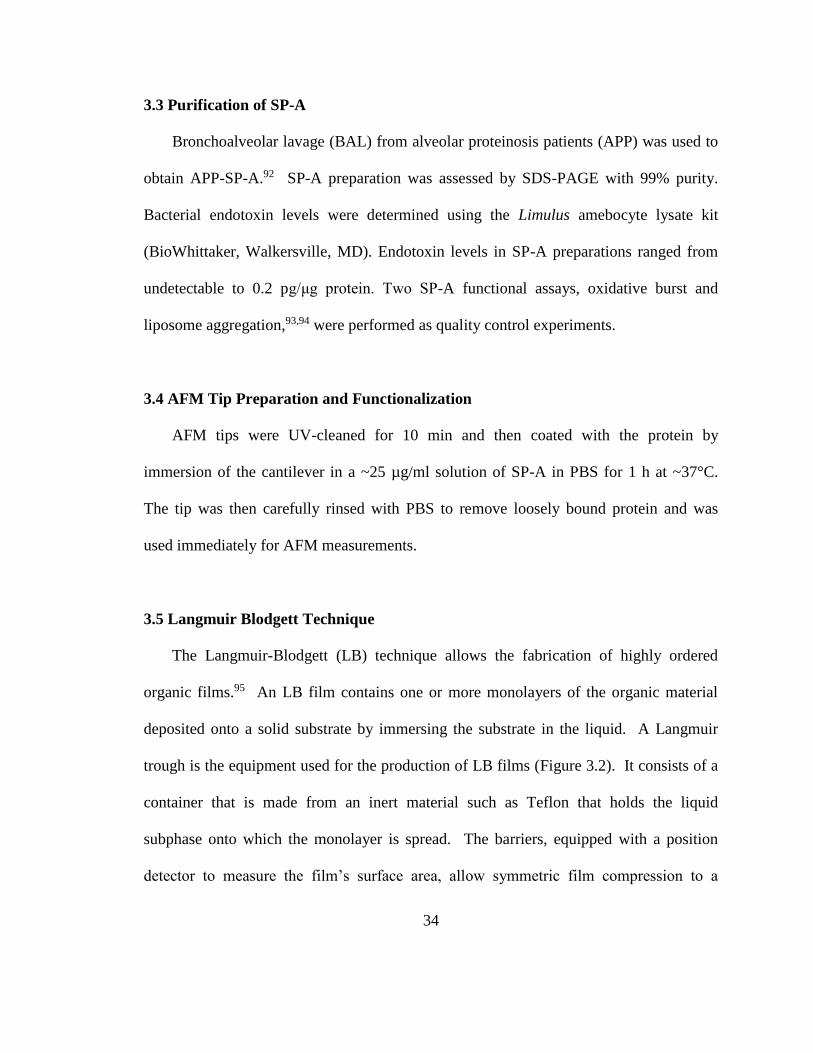
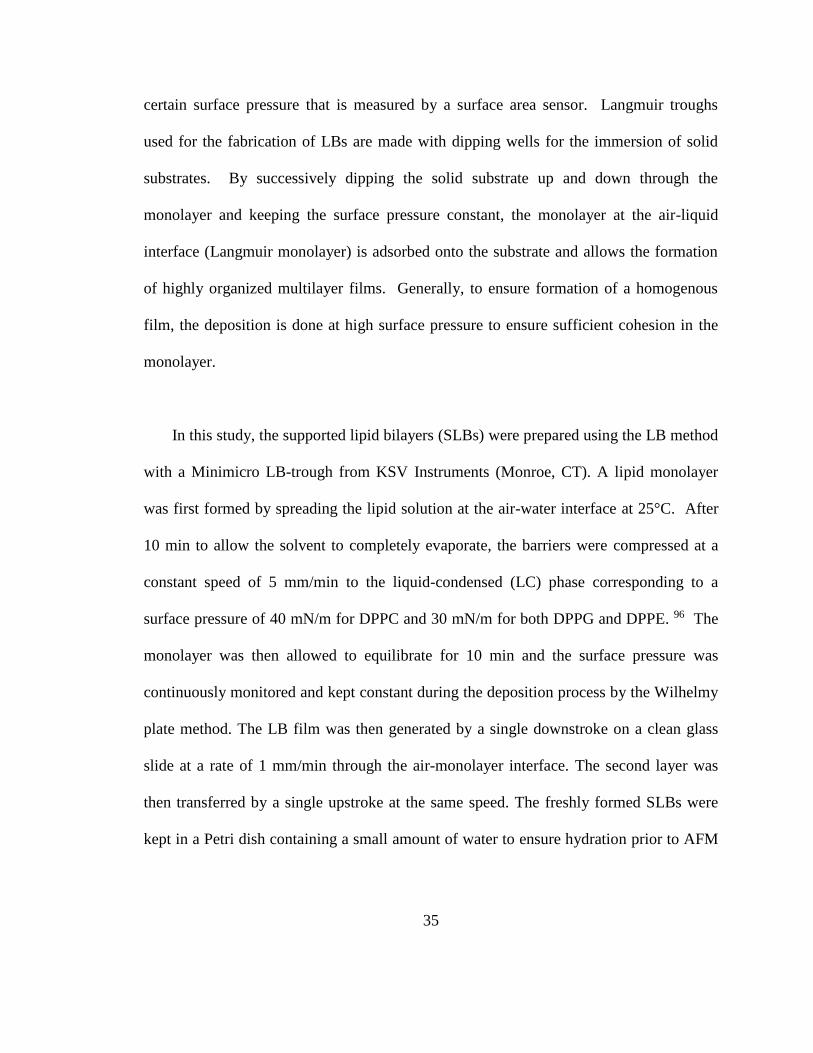

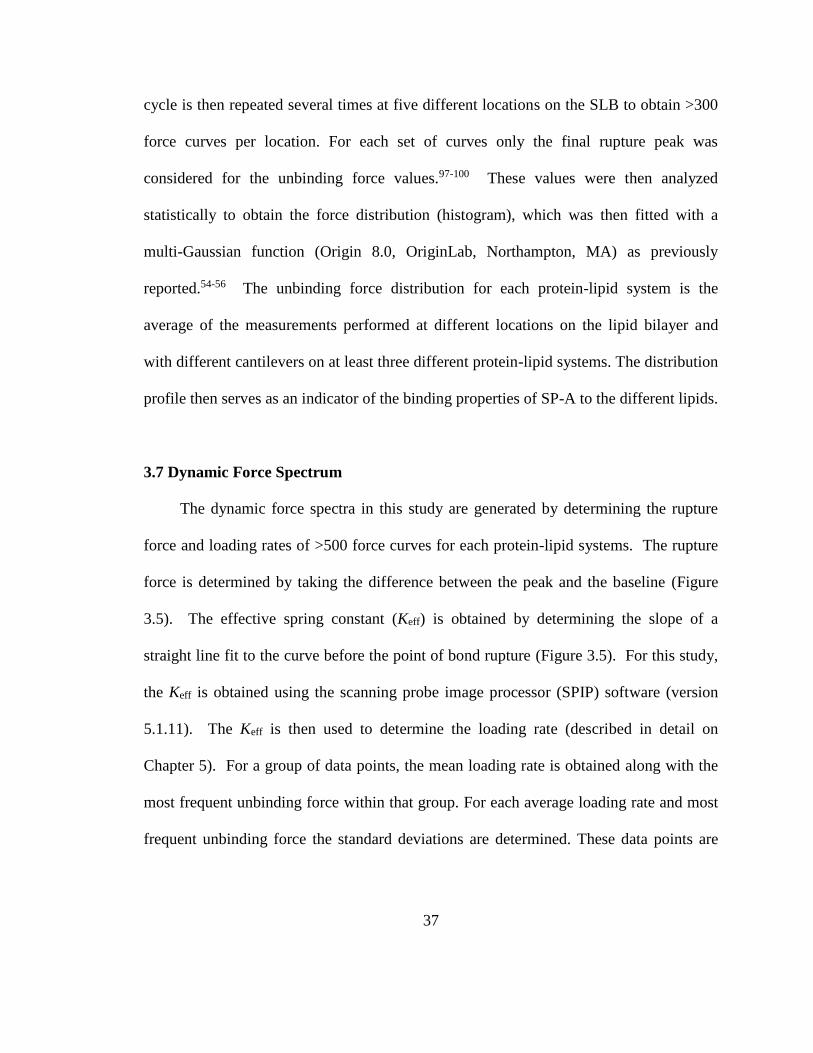


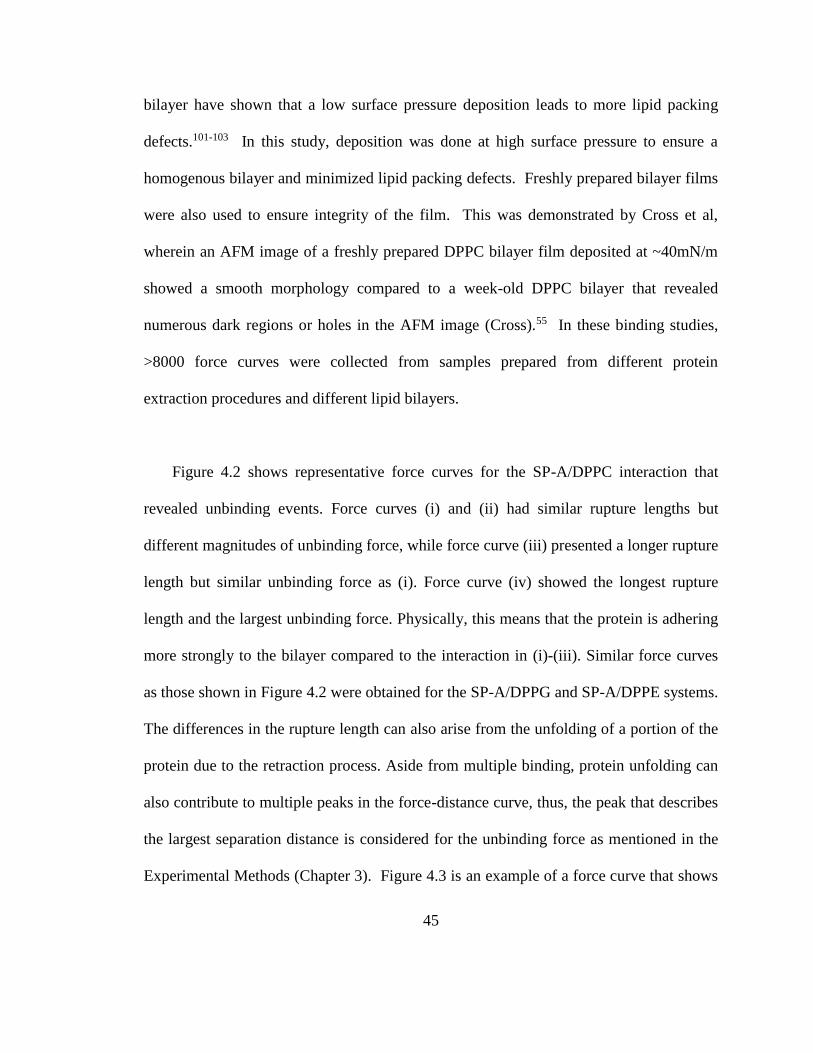
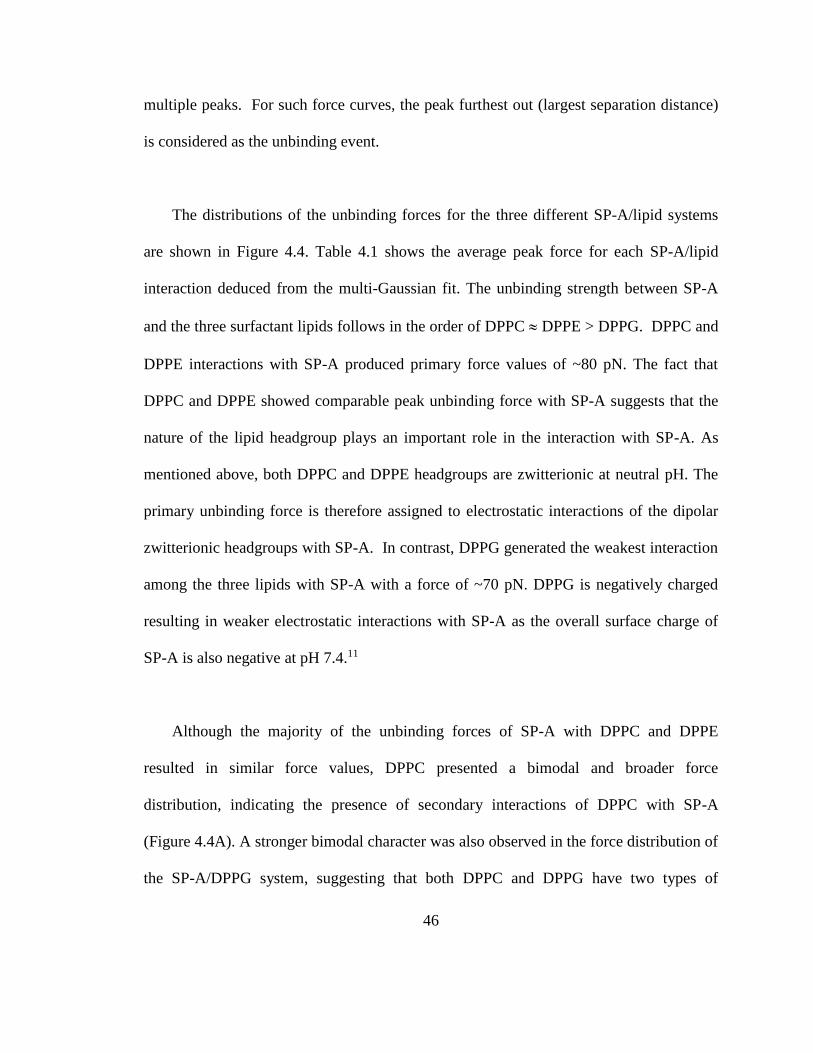
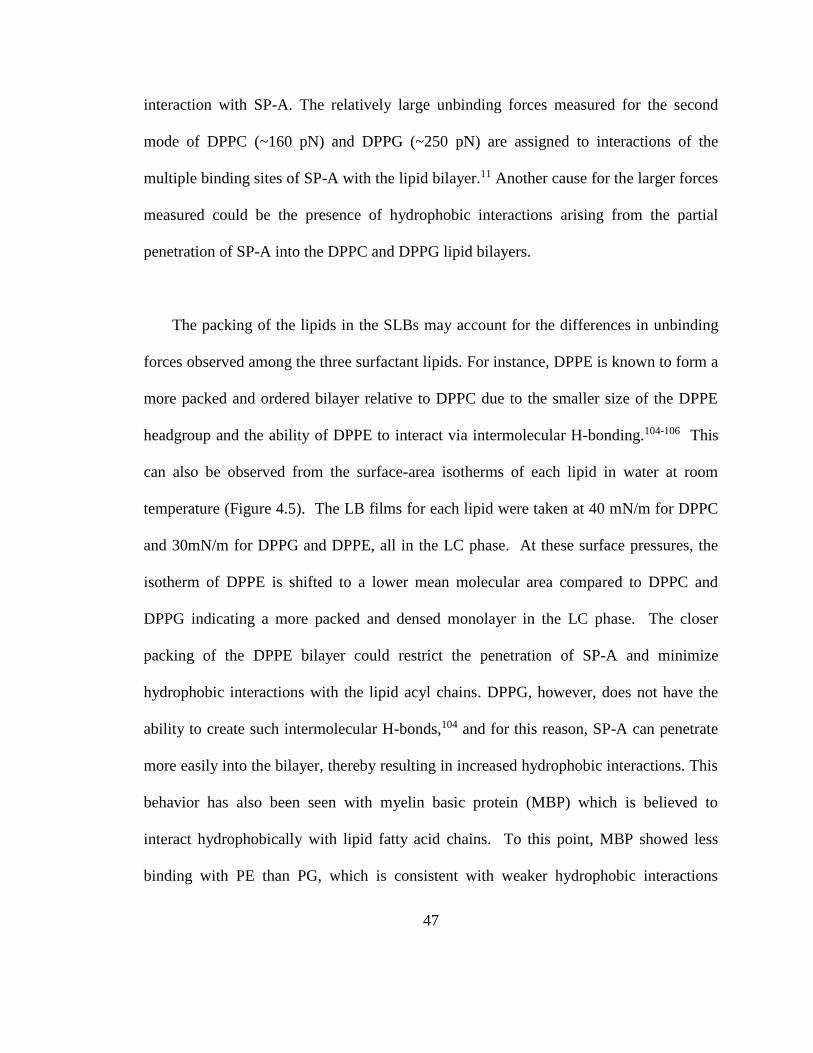
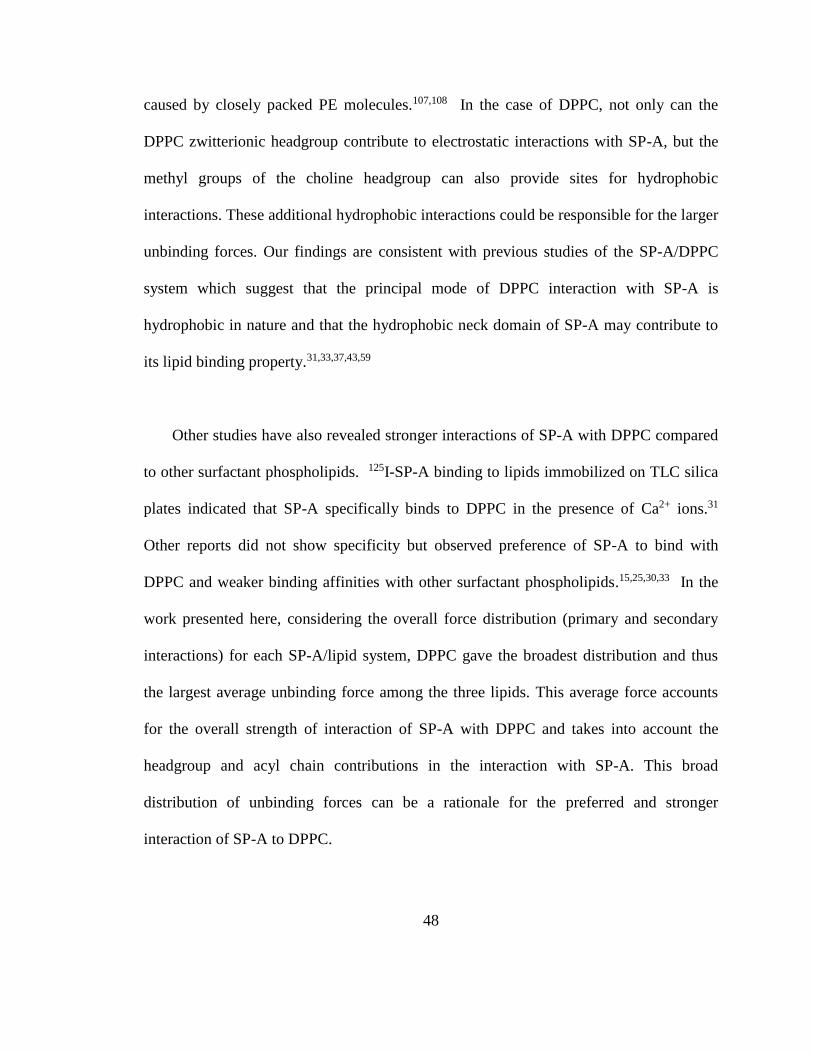


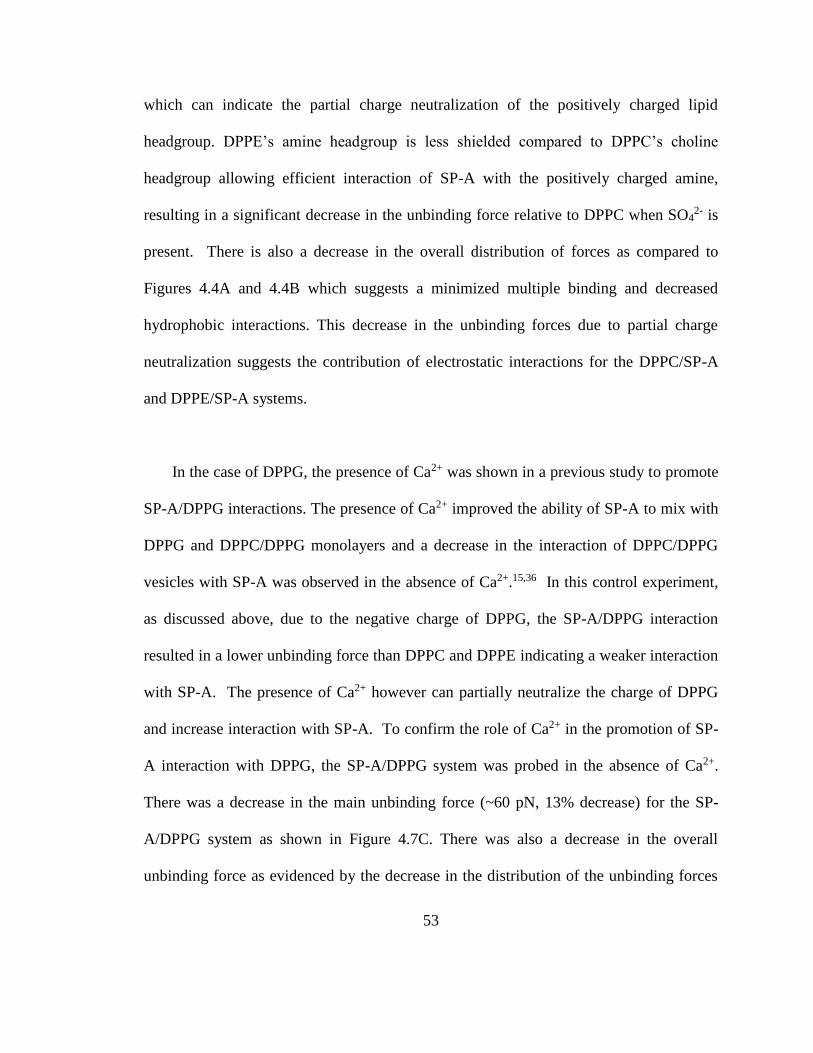

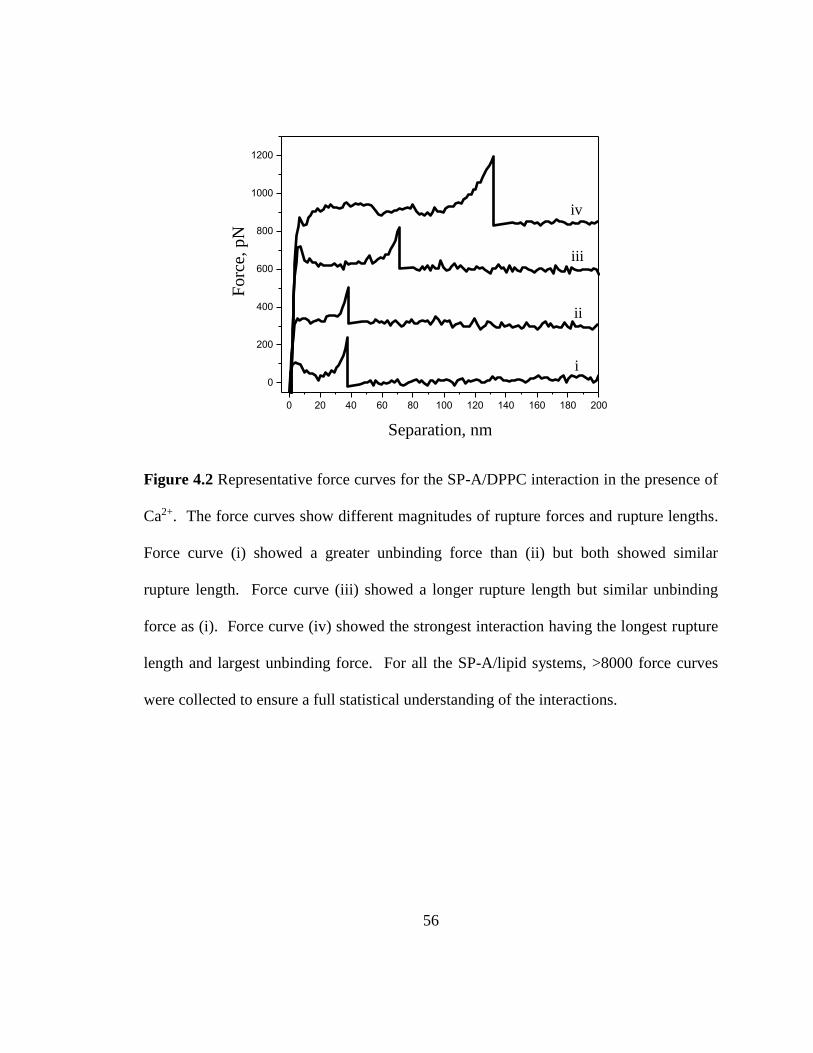


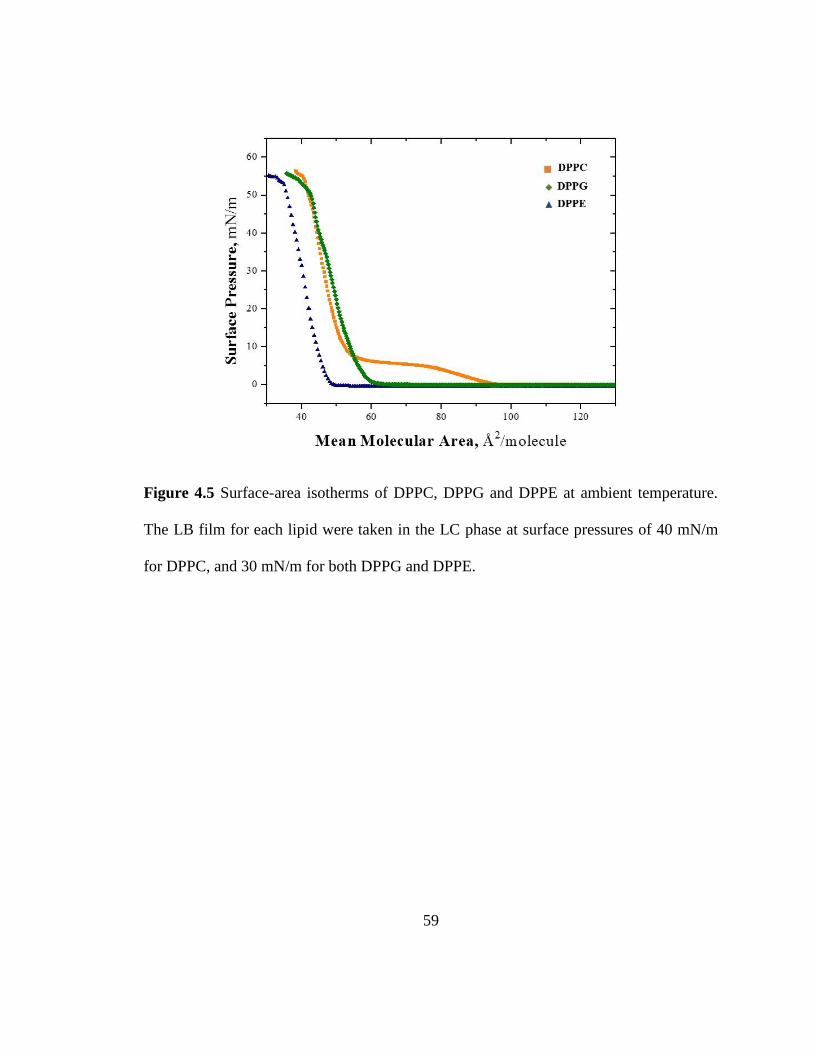


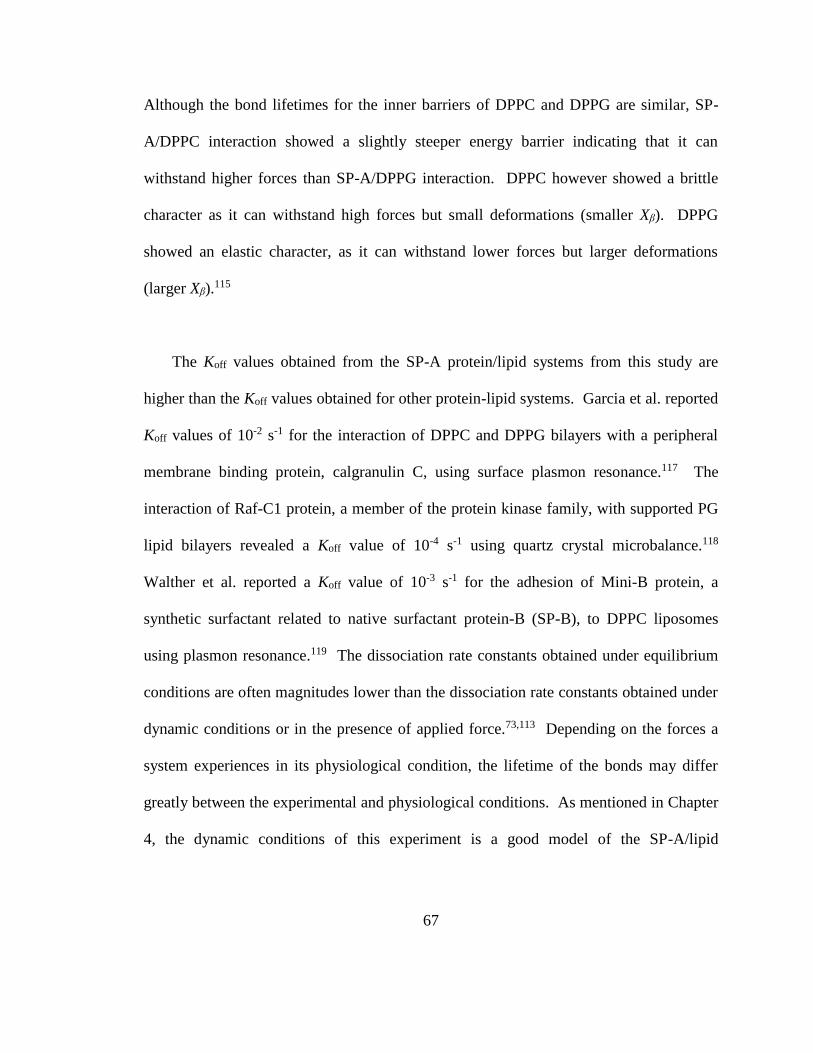
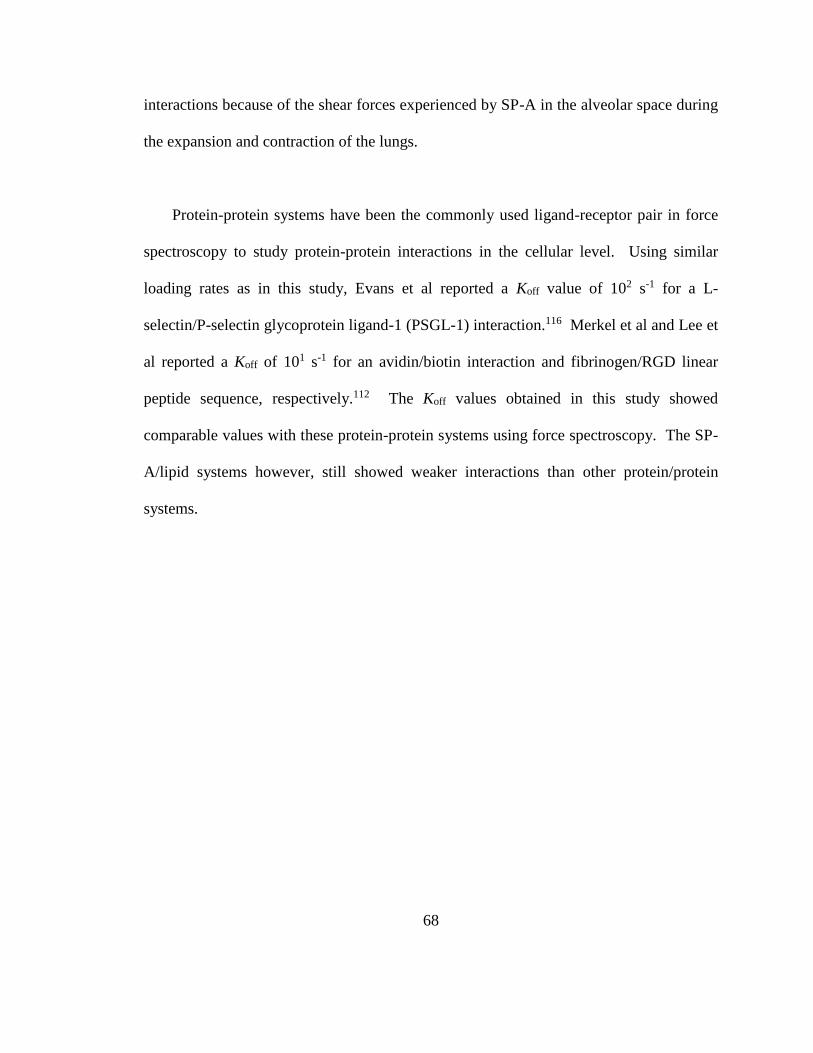
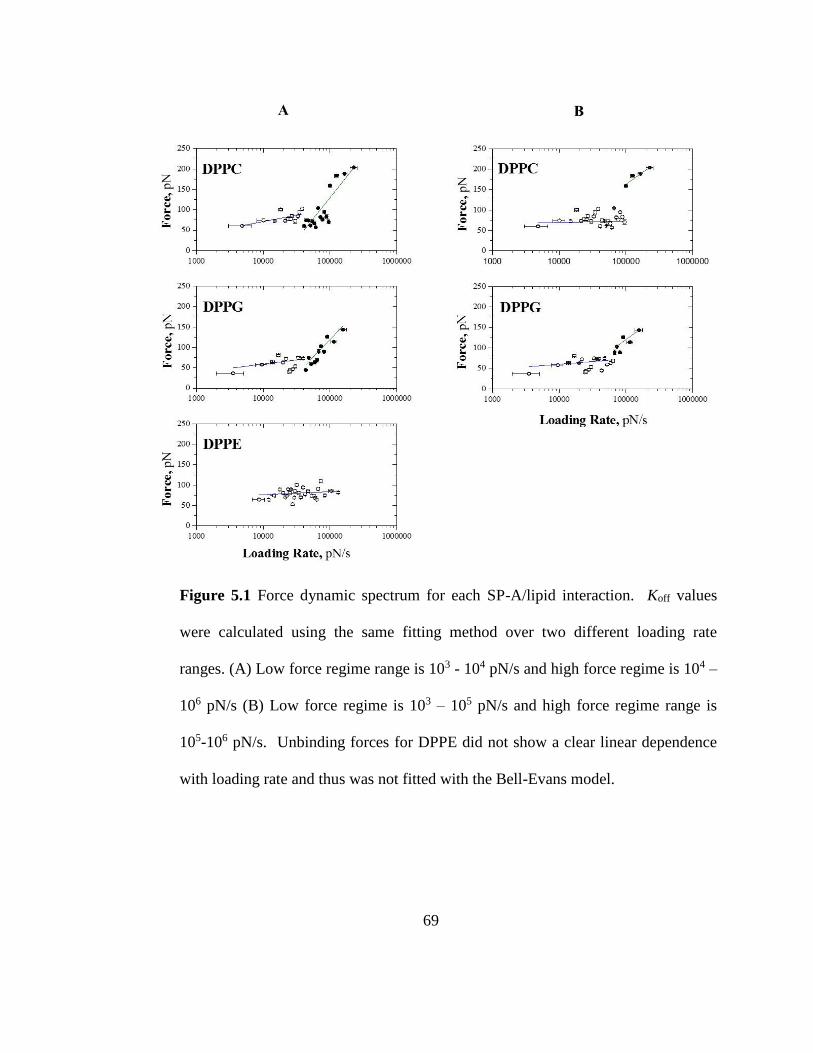
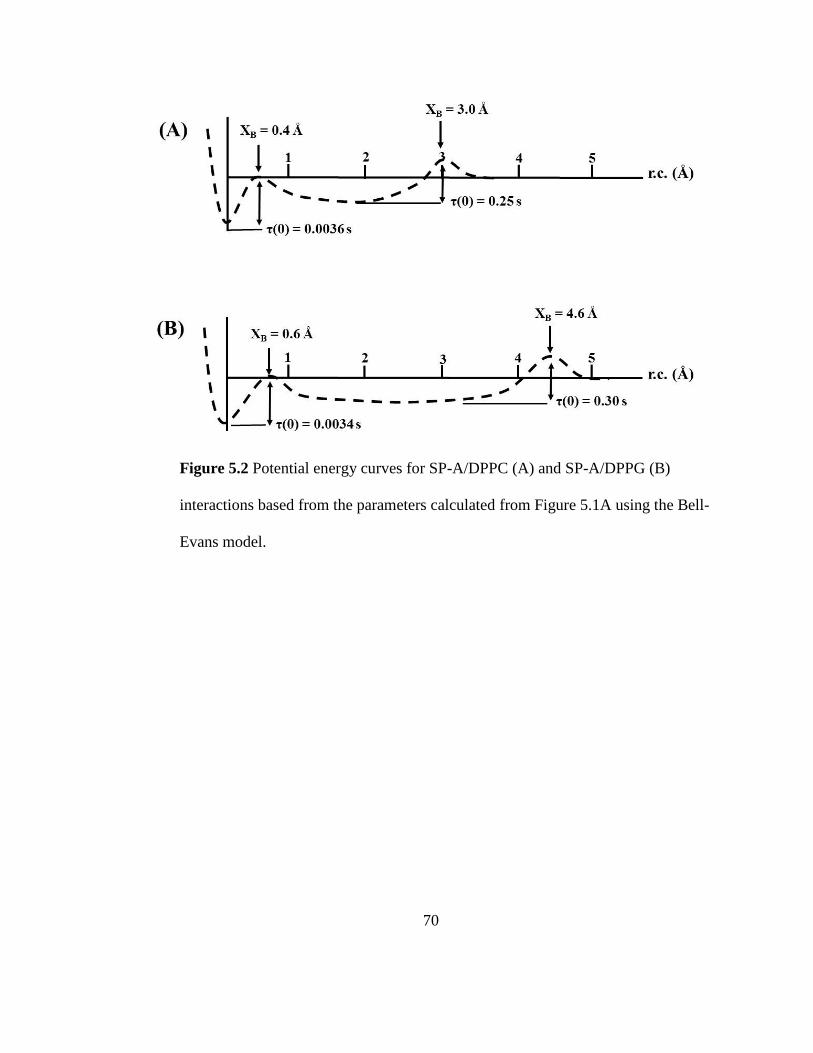
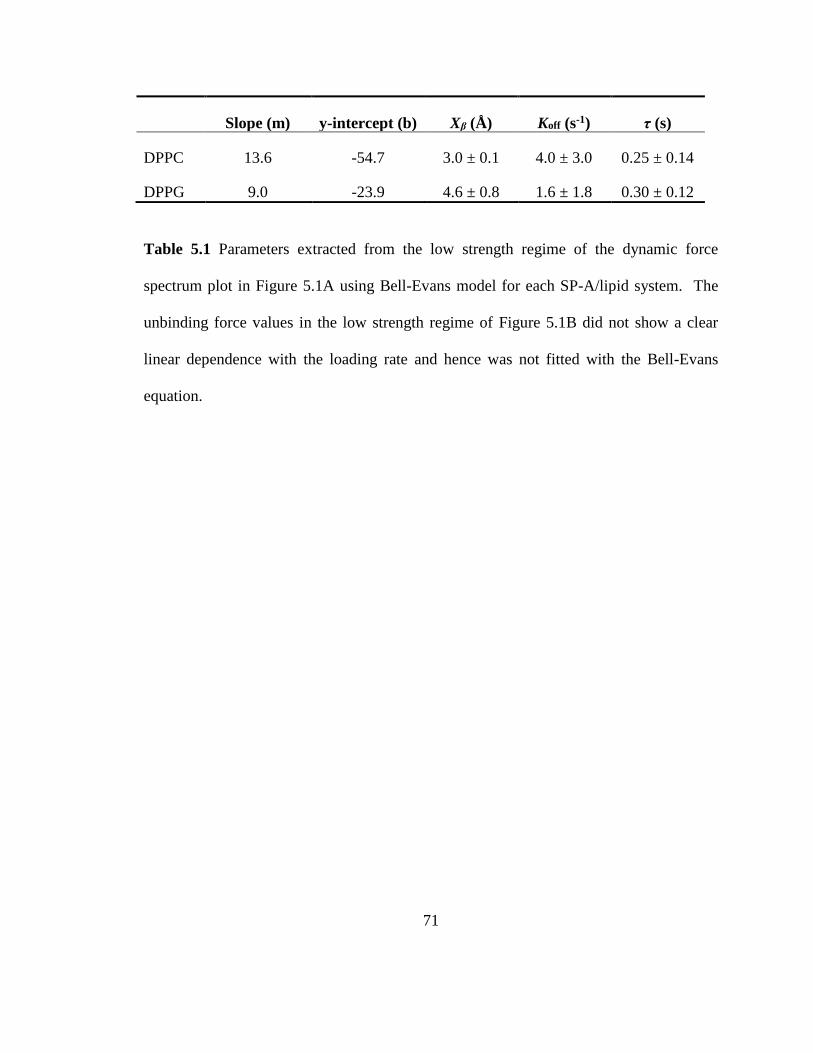
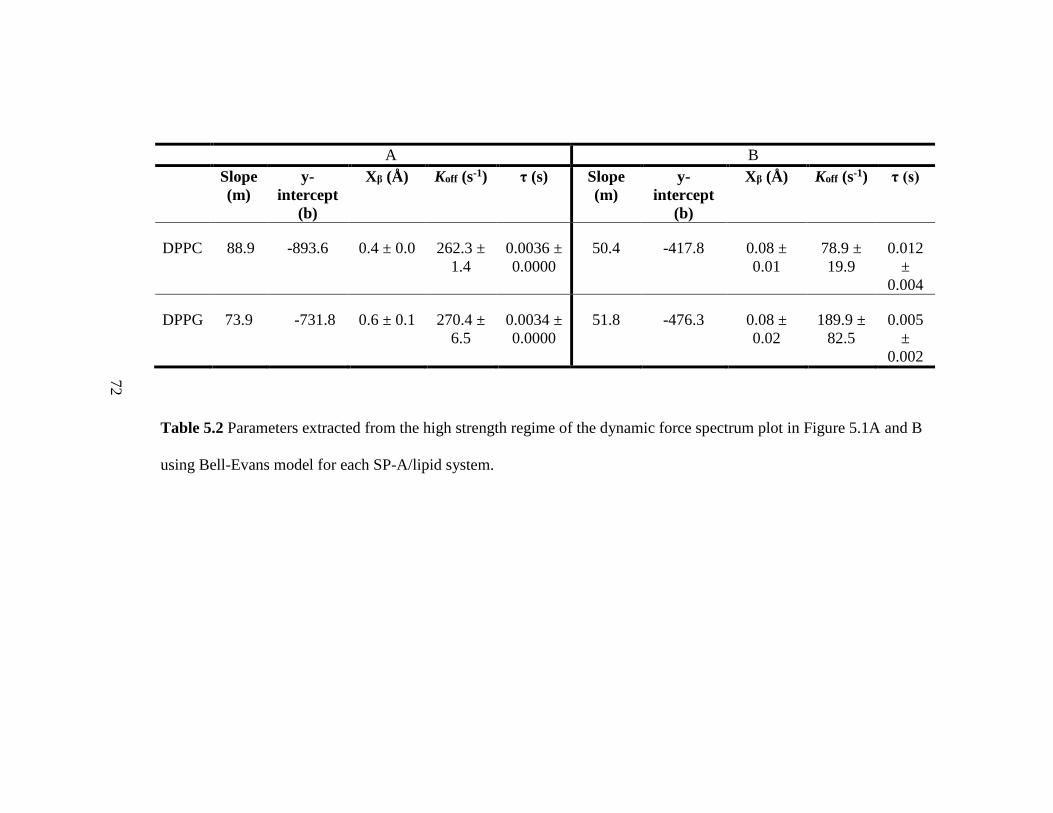


![4D Model Generator of the Human Lung, ³/XQJ &HU ......The lung consists of about three hundred millions of alveoli, tiny air bags with the size of about 0.3 mm [5]. The pulmonary](https://static.documents.pub/doc/80x56/5eb475bcd190f971f74a6032/4d-model-generator-of-the-human-lung-xqj-hu-the-lung-consists-of.jpg)


