Page 1
7/16/16
1
Protein Sequence Comparisonand Protein Evolution
(What BLAST does/Why BLAST works
William R. Pearsonfaculty.virginia.edu/wrpearson
[email protected]
1
Effective Similarity Searching in Practice1. Always search protein databases (possibly with
translated DNA)2. Use E()-values, not percent identity, to infer
homology – E() < 0.001 is significant in a single search
3. Search smaller (comprehensive) databases4. Change the scoring matrix for:– short sequences (exons, reads)– short evolutionary distances (mammals, vertebrates, a-
proteobacteria)– high identity (>50% alignments) to reduce over-extension
5. All methods (pairwise, HMM, PSSM) miss homologs, and find homologs the other methods miss
2
Page 2
7/16/16
2
Homology Fundamentals
• Homologous sequences are unexpectedly similar (excess similarity)– excess compared to ??? – random similarity
(similarity by chance, E()-value)• Non-significant similarity IS NOT evidence for non-
homology– significant similarity to a protein of different structure
shows non-homology• Homology at the (entire) sequence level is
different from homology at the residue level– sequence homology is inferred from statistics– residue homology REQUIRES sequence homology
3
Establishing homology from statistically significant similarity
Why BLAST works• For most proteins, homologs are easily found over
long evolutionary distances (500 My – 2 By) using standard approaches (BLAST, FASTA)
• Difficult for distant relationships or very short domains• Most default search parameters are optimized for
distant relationships and work well• Not every aligned residue is homologous
– but with significant similarity, there is an homologous domain
4
Page 3
7/16/16
3
This talk is not about:• Alignment
– Alignment quality may be more sensitive to parameter choice
– Multiple sequences for biologically accurate alignments• Inferring Protein Function
– Homology (common ancestry) implies common structure (guaranteed), not necessarily common function
– Homologs have different functions– Non-homologs have similar (or identical) functions
• The best sequences for building trees– Protein sequences are clearly best for establishing homology,
but DNA sequences may be better for resolving recent divergence
5
Homologues share a common ancestor
6
chemical evolution
prokaryotes/eukaryotes
plants/animals
vertebrates/arthopods
self-replicating systems
4,2896,530
18,000
time
(bili
ons
of ye
ars)
hum
anho
rse
fish
insec
t
worm
whea
t
yeas
t
E. c
oli
-0.1
-1.0
-2.0
-3.0
-4.0
Page 4
7/16/16
4
When do we infer homology?
7
Bovine trypsin (5ptp)Structure: E()< 10-23;
RMSD 0.0 ASequence: E()< 10-84
100% 223/223
S. griseus trypsin (1sgt)E()< 10-14 RMSD 1.6 AE()< 10-19 36%; 226/223
S. griseus protease A (2sga)E()< 10-4; RMSD 2.6 AE()< 2.6 25%; 199/181
Homology <=> structural similarity? sequence similarity
When can we infer non-homology?
8
Subtilisin (1sbt)E() >100E()<280; 25% 159/275
Cytochrome c4 (1etp)E() > 100E()<5.5; 23% 171/190
Non-homologous proteins havedifferent structures
Bovine trypsin (5ptp)Structure: E()<10-23
RMSD 0.0 ASequence: E()<10-84
100% 223/223
Page 5
7/16/16
5
9
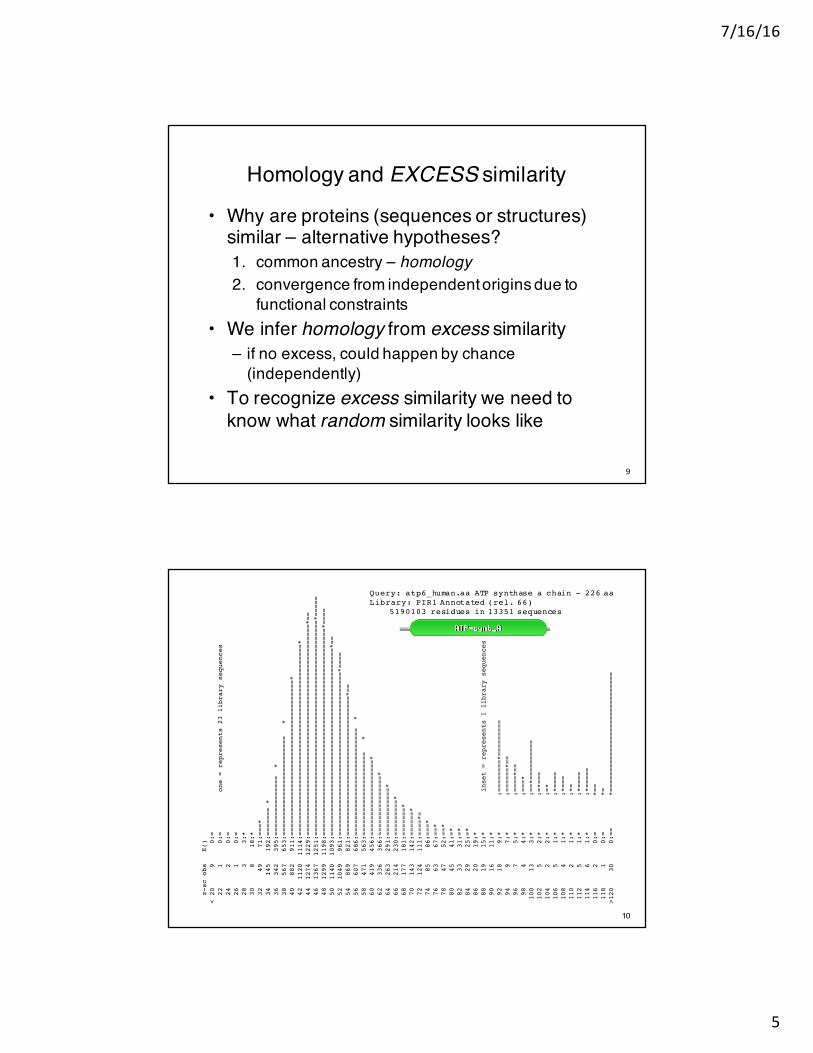
Homology and EXCESS similarity
• Why are proteins (sequences or structures) similar – alternative hypotheses?1. common ancestry – homology2. convergence from independent origins due to
functional constraints• We infer homology from excess similarity
– if no excess, could happen by chance (independently)
• To recognize excess similarity we need to know what random similarity looks like
10
z-sc obs
E()
< 20 9 0:=
22 1 0:= one = represents 23 library sequences
24 2 0:=
26 1 0:=
28 3 3:*
30 8 18:*
32 49 71:===*
34 145 192:======= *
36 342 395:=============== *
38 567 653:========================= *
40 882 911:=======================================*
42 1120 1114:================================================*
44 1274 1229:=====================================================*==
46 1367 1251:======================================================*=====
48 1299 1198:====================================================*====
50 1140 1093:===============================================*==
52 1049 961:=========================================*====
54 869 821:===================================*==
56 607 686:=========================== *
58 471 563:===================== *
60 419 456:===================*
62 336 366:===============*
64 263 291:============*
66 214 230:=========*
68 177 181:=======*
70 143 142:======*
72 124 111:====*=
74 85 86:===*
76 63 67:==*
78 47 52:==*
80 45 41:=*
82 33 31:=*
84 29 25:=*
86 20 19:*
88 19 15:* inset = represents 1 library sequences
90 16 11:*
92 18 9:* :========*=========
94 9 7:* :======*==
96 7 5:* :====*==
98 4 4:* :===*
100 13 3:* :==*==========
102 5 2:* :=*===
104 2 2:* :=*
106 5 1:* :*====
108 4 1:* :*===
110 2 1:* :*=
112 5 1:* :*====
114 6 1:* :*=====
116 2 0:= *==
118 1 0:= *=
>120 30 0:== *==============================
Query: atp6_human.aa ATP synthase a chain - 226 aaLibrary: PIR1 Annotated (rel. 66)
5190103 residues in 13351 sequences
Page 6
7/16/16
6
11
Inferring Homology from Statistical Significance
• Real UNRELATED sequences have similarity scores that are indistinguishable fromRANDOM sequences
• If a similarity is NOT RANDOM, then it must be NOT UNRELATED
• Therefore, NOT RANDOM (statistically significant) similarity must reflect RELATEDsequences
12
Query: atp6_human.aa ATP synthase a chain - 226 aaLibrary: 5190103 residues in 13351 sequences
The best scores are: ( len) s-w bits E(13351) %_id %_sim alensp|P00846|ATP6_HUMAN ATP synthase a chain (AT ( 226) 1400 325.8 5.8e-90 1.000 1.000 226sp|P00847|ATP6_BOVIN ATP synthase a chain (AT ( 226) 1157 270.5 2.5e-73 0.779 0.951 226sp|P00848|ATP6_MOUSE ATP synthase a chain (AT ( 226) 1118 261.7 1.2e-70 0.757 0.916 226sp|P00849|ATP6_XENLA ATP synthase a chain (AT ( 226) 745 176.8 4.0e-45 0.533 0.847 229sp|P00851|ATP6_DROYA ATP synthase a chain (AT ( 224) 473 115.0 1.7e-26 0.378 0.721 222sp|P00854|ATP6_YEAST ATP synthase a chain pre ( 259) 428 104.7 2.3e-23 0.353 0.694 232sp|P00852|ATP6_EMENI ATP synthase a chain pre ( 256) 365 90.4 4.8e-19 0.304 0.691 230sp|P14862|ATP6_COCHE ATP synthase a chain (AT ( 257) 353 87.7 3.2e-18 0.313 0.650 214sp|P68526|ATP6_TRITI ATP synthase a chain (AT ( 386) 309 77.6 5.1e-15 0.289 0.651 235sp|P05499|ATP6_TOBAC ATP synthase a chain (AT ( 395) 309 77.6 5.2e-15 0.283 0.635 233sp|P07925|ATP6_MAIZE ATP synthase a chain (AT ( 291) 283 71.7 2.3e-13 0.311 0.667 180sp|P0AB98|ATP6_ECOLI ATP synthase a chain (AT ( 271) 178 47.9 3.2e-06 0.233 0.585 236sp|P0C2Y5|ATPI_ORYSA Chloroplast ATP synth (A ( 247) 144 40.1 0.00062 0.242 0.580 231sp|P06452|ATPI_PEA Chloroplast ATP synthase a ( 247) 143 39.9 0.00072 0.250 0.586 232sp|P27178|ATP6_SYNY3 ATP synthase a chain (AT ( 276) 142 39.7 0.00095 0.265 0.571 170sp|P06451|ATPI_SPIOL Chloroplast ATP synthase ( 247) 138 38.8 0.0016 0.242 0.580 231sp|P08444|ATP6_SYNP6 ATP synthase a chain (AT ( 261) 127 36.3 0.0095 0.263 0.557 167sp|P69371|ATPI_ATRBE Chloroplast ATP synthase ( 247) 126 36.0 0.01 0.221 0.571 231sp|P06289|ATPI_MARPO Chloroplast ATP synthase ( 248) 126 36.0 0.011 0.240 0.575 167sp|P30391|ATPI_EUGGR Chloroplast ATP synthase ( 251) 123 35.4 0.017 0.257 0.579 214
sp|P19568|TLCA_RICPR ADP,ATP carrier protein ( 498) 122 35.0 0.043 0.243 0.579 152sp|P24966|CYB_TAYTA Cytochrome b ( 379) 113 33.0 0.13 0.234 0.532 158sp|P03892|NU2M_BOVIN NADH-ubiquinone oxidored ( 347) 107 31.7 0.31 0.261 0.479 211sp|P68092|CYB_STEAT Cytochrome b ( 379) 104 31.0 0.54 0.277 0.547 137sp|P03891|NU2M_HUMAN NADH-ubiquinone oxidored ( 347) 103 30.8 0.58 0.201 0.537 149sp|P00156|CYB_HUMAN Cytochrome b ( 380) 102 30.5 0.74 0.268 0.585 205sp|P15993|AROP_ECOLI Aromatic amino acid tr ( 457) 103 30.7 0.78 0.234 0.622 111sp|P24965|CYB_TRANA Cytochrome b ( 379) 101 30.3 0.87 0.234 0.563 158sp|P29631|CYB_POMTE Cytochrome b ( 308) 99 29.9 0.95 0.274 0.584 113sp|P24953|CYB_CAPHI Cytochrome b ( 379) 99 29.8 1.2 0.236 0.564 140
Page 7
7/16/16
7
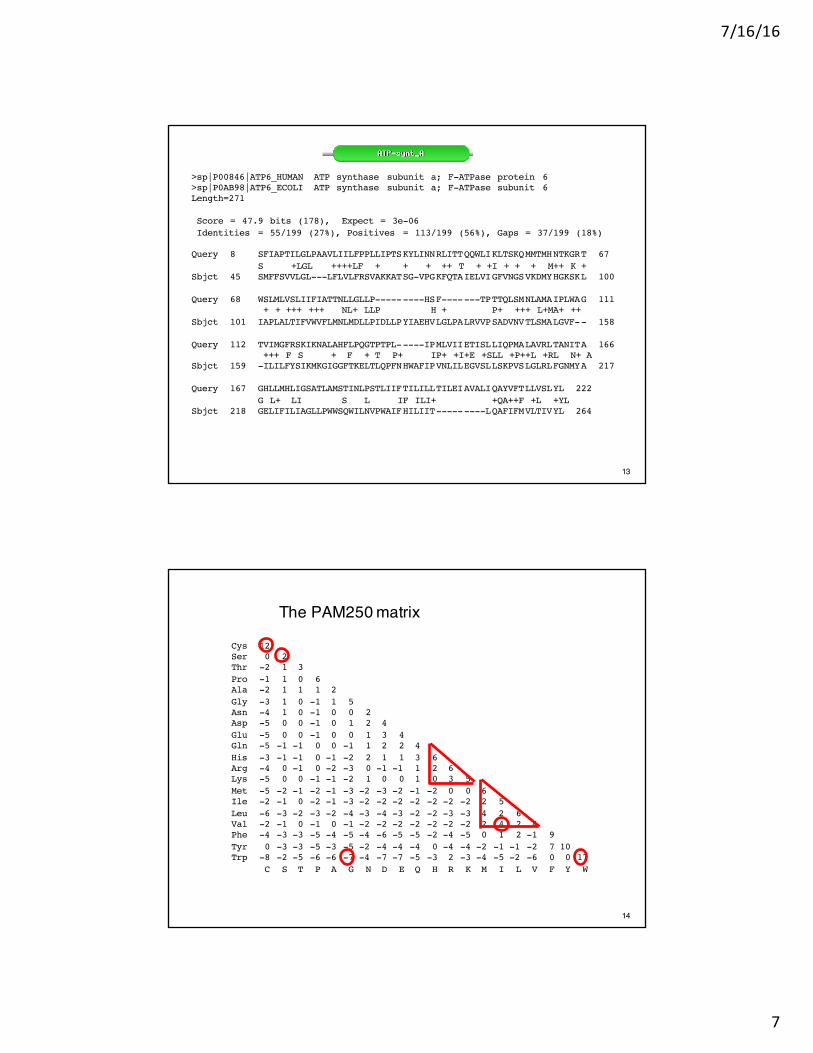
13
>sp|P00846|ATP6_HUMAN ATP synthase subunit a; F-ATPase protein 6 >sp|P0AB98|ATP6_ECOLI ATP synthase subunit a; F-ATPase subunit 6Length=271
Score = 47.9 bits (178), Expect = 3e-06Identities = 55/199 (27%), Positives = 113/199 (56%), Gaps = 37/199 (18%)
Query 8 SFIAPTILGLPAAVLIILFPPLLIPTSKYLINNRLITTQQWLIKLTSKQMMTMHNTKGRT 67S +LGL ++++LF + + + ++ T + +I + + + M++ K +
Sbjct 45 SMFFSVVLGL---LFLVLFRSVAKKATSG-VPGKFQTAIELVIGFVNGSVKDMYHGKSKL 100
Query 68 WSLMLVSLIIFIATTNLLGLLP---------HSF-------TPTTQLSMNLAMAIPLWAG 111+ + +++ +++ NL+ LLP H + P+ +++ L+MA+ ++
Sbjct 101 IAPLALTIFVWVFLMNLMDLLPIDLLPYIAEHVLGLPALRVVPSADVNVTLSMALGVF-- 158
Query 112 TVIMGFRSKIKNALAHFLPQGTPTPL-----IPMLVIIETISLLIQPMALAVRLTANITA 166+++ F S + F + T P+ IP+ +I+E +SLL +P++L +RL N+ A
Sbjct 159 -ILILFYSIKMKGIGGFTKELTLQPFNHWAFIPVNLILEGVSLLSKPVSLGLRLFGNMYA 217
Query 167 GHLLMHLIGSATLAMSTINLPSTLIIFTILILLTILEIAVALIQAYVFTLLVSLYL 222G L+ LI S L IF ILI+ +QA++F +L +YL
Sbjct 218 GELIFILIAGLLPWWSQWILNVPWAIFHILIIT---------LQAFIFMVLTIVYL 264
14
The PAM250 matrix
Cys 12Ser 0 2Thr -2 1 3Pro -1 1 0 6Ala -2 1 1 1 2Gly -3 1 0 -1 1 5Asn -4 1 0 -1 0 0 2Asp -5 0 0 -1 0 1 2 4Glu -5 0 0 -1 0 0 1 3 4Gln -5 -1 -1 0 0 -1 1 2 2 4His -3 -1 -1 0 -1 -2 2 1 1 3 6Arg -4 0 -1 0 -2 -3 0 -1 -1 1 2 6Lys -5 0 0 -1 -1 -2 1 0 0 1 0 3 5Met -5 -2 -1 -2 -1 -3 -2 -3 -2 -1 -2 0 0 6Ile -2 -1 0 -2 -1 -3 -2 -2 -2 -2 -2 -2 -2 2 5Leu -6 -3 -2 -3 -2 -4 -3 -4 -3 -2 -2 -3 -3 4 2 6Val -2 -1 0 -1 0 -1 -2 -2 -2 -2 -2 -2 -2 2 4 2 4Phe -4 -3 -3 -5 -4 -5 -4 -6 -5 -5 -2 -4 -5 0 1 2 -1 9Tyr 0 -3 -3 -5 -3 -5 -2 -4 -4 -4 0 -4 -4 -2 -1 -1 -2 7 10Trp -8 -2 -5 -6 -6 -7 -4 -7 -7 -5 -3 2 -3 -4 -5 -2 -6 0 0 17
C S T P A G N D E Q H R K M I L V F Y W
Page 8
7/16/16
8
15
A R N D E I LA 8R -9 12N -4 -7 11D -4 -13 3 11E -3 -11 -2 4 11I -6 -7 -7 -10 -7 12L -8 -11 -9 -16 -12 -1 10
Pam40A R N D E I L
A 2R -2 6N 0 0 2D 0 -1 2 4E 0 -1 1 3 4I -1 -2 -2 -2 -2 5L -2 -3 -3 -4 -3 2 6
Pam250
Where do scoring matrices come from?
• Scoring matrices can be designed for different evolutionary distances (less=shallow; more=deep)
• Deep matrices allow more substitution
€
λS = logqijpi p j
#
$ % %
&
' ( (
frequency of replace-ment in homologs
frequency of align-ment by chance
16
The best scores are: ( len) s-w bits E(13351) %_id %_sim alensp|P00846|ATP6_HUMAN ATP synthase a chain (AT ( 226) 1400 325.8 5.8e-90 1.000 1.000 226sp|P00847|ATP6_BOVIN ATP synthase a chain (AT ( 226) 1157 270.5 2.5e-73 0.779 0.951 226sp|P00848|ATP6_MOUSE ATP synthase a chain (AT ( 226) 1118 261.7 1.2e-70 0.757 0.916 226sp|P00849|ATP6_XENLA ATP synthase a chain (AT ( 226) 745 176.8 4.0e-45 0.533 0.847 229sp|P00851|ATP6_DROYA ATP synthase a chain (AT ( 224) 473 115.0 1.7e-26 0.378 0.721 222sp|P00854|ATP6_YEAST ATP synthase a chain pre ( 259) 428 104.7 2.3e-23 0.353 0.694 232sp|P00852|ATP6_EMENI ATP synthase a chain pre ( 256) 365 90.4 4.8e-19 0.304 0.691 230sp|P14862|ATP6_COCHE ATP synthase a chain (AT ( 257) 353 87.7 3.2e-18 0.313 0.650 214sp|P68526|ATP6_TRITI ATP synthase a chain (AT ( 386) 309 77.6 5.1e-15 0.289 0.651 235sp|P05499|ATP6_TOBAC ATP synthase a chain (AT ( 395) 309 77.6 5.2e-15 0.283 0.635 233sp|P07925|ATP6_MAIZE ATP synthase a chain (AT ( 291) 283 71.7 2.3e-13 0.311 0.667 180sp|P0AB98|ATP6_ECOLI ATP synthase a chain (AT ( 271) 178 47.9 3.2e-06 0.233 0.585 236sp|P0C2Y5|ATPI_ORYSA Chloroplast ATP synth (A ( 247) 144 40.1 0.00062 0.242 0.580 231sp|P06452|ATPI_PEA Chloroplast ATP synthase a ( 247) 143 39.9 0.00072 0.250 0.586 232sp|P27178|ATP6_SYNY3 ATP synthase a chain (AT ( 276) 142 39.7 0.00095 0.265 0.571 170sp|P06451|ATPI_SPIOL Chloroplast ATP synthase ( 247) 138 38.8 0.0016 0.242 0.580 231sp|P08444|ATP6_SYNP6 ATP synthase a chain (AT ( 261) 127 36.3 0.0095 0.263 0.557 167sp|P69371|ATPI_ATRBE Chloroplast ATP synthase ( 247) 126 36.0 0.01 0.221 0.571 231sp|P06289|ATPI_MARPO Chloroplast ATP synthase ( 248) 126 36.0 0.011 0.240 0.575 167sp|P30391|ATPI_EUGGR Chloroplast ATP synthase ( 251) 123 35.4 0.017 0.257 0.579 214
sp|P19568|TLCA_RICPR ADP,ATP carrier protein ( 498) 122 35.0 0.043 0.243 0.579 152sp|P24966|CYB_TAYTA Cytochrome b ( 379) 113 33.0 0.13 0.234 0.532 158sp|P03892|NU2M_BOVIN NADH-ubiquinone oxidored ( 347) 107 31.7 0.31 0.261 0.479 211sp|P68092|CYB_STEAT Cytochrome b ( 379) 104 31.0 0.54 0.277 0.547 137sp|P03891|NU2M_HUMAN NADH-ubiquinone oxidored ( 347) 103 30.8 0.58 0.201 0.537 149sp|P00156|CYB_HUMAN Cytochrome b ( 380) 102 30.5 0.74 0.268 0.585 205sp|P15993|AROP_ECOLI Aromatic amino acid tr ( 457) 103 30.7 0.78 0.234 0.622 111sp|P24965|CYB_TRANA Cytochrome b ( 379) 101 30.3 0.87 0.234 0.563 158sp|P29631|CYB_POMTE Cytochrome b ( 308) 99 29.9 0.95 0.274 0.584 113sp|P24953|CYB_CAPHI Cytochrome b ( 379) 99 29.8 1.2 0.236 0.564 140
Query: atp6_human.aa ATP synthase a chain - 226 aaLibrary: 5190103 residues in 13351 sequences
Page 9
7/16/16
9
17
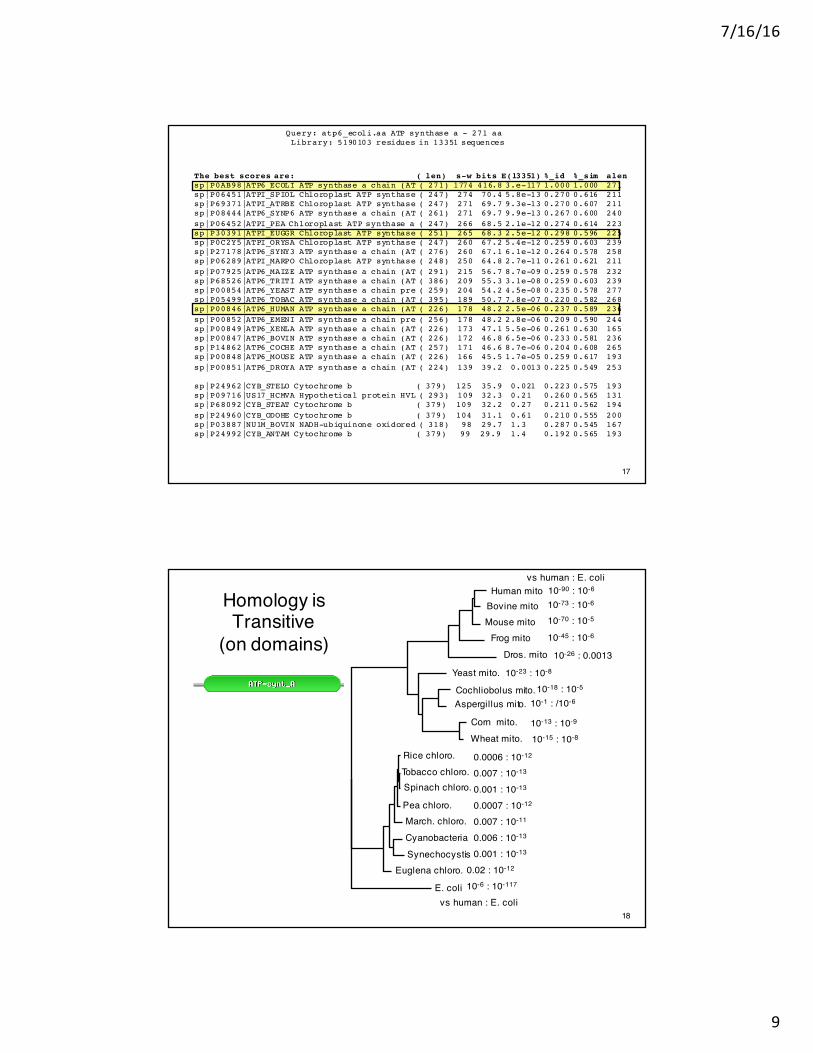
The best scores are: ( len) s-w bits E(13351) %_id %_sim alensp|P0AB98|ATP6_ECOLI ATP synthase a chain (AT ( 271) 1774 416.8 3.e-117 1.000 1.000 271sp|P06451|ATPI_SPIOL Chloroplast ATP synthase ( 247) 274 70.4 5.8e-13 0.270 0.616 211sp|P69371|ATPI_ATRBE Chloroplast ATP synthase ( 247) 271 69.7 9.3e-13 0.270 0.607 211sp|P08444|ATP6_SYNP6 ATP synthase a chain (AT ( 261) 271 69.7 9.9e-13 0.267 0.600 240sp|P06452|ATPI_PEA Chloroplast ATP synthase a ( 247) 266 68.5 2.1e-12 0.274 0.614 223sp|P30391|ATPI_EUGGR Chloroplast ATP synthase ( 251) 265 68.3 2.5e-12 0.298 0.596 225sp|P0C2Y5|ATPI_ORYSA Chloroplast ATP synthase ( 247) 260 67.2 5.4e-12 0.259 0.603 239sp|P27178|ATP6_SYNY3 ATP synthase a chain (AT ( 276) 260 67.1 6.1e-12 0.264 0.578 258sp|P06289|ATPI_MARPO Chloroplast ATP synthase ( 248) 250 64.8 2.7e-11 0.261 0.621 211sp|P07925|ATP6_MAIZE ATP synthase a chain (AT ( 291) 215 56.7 8.7e-09 0.259 0.578 232sp|P68526|ATP6_TRITI ATP synthase a chain (AT ( 386) 209 55.3 3.1e-08 0.259 0.603 239sp|P00854|ATP6_YEAST ATP synthase a chain pre ( 259) 204 54.2 4.5e-08 0.235 0.578 277sp|P05499|ATP6_TOBAC ATP synthase a chain (AT ( 395) 189 50.7 7.8e-07 0.220 0.582 268sp|P00846|ATP6_HUMAN ATP synthase a chain (AT ( 226) 178 48.2 2.5e-06 0.237 0.589 236sp|P00852|ATP6_EMENI ATP synthase a chain pre ( 256) 178 48.2 2.8e-06 0.209 0.590 244sp|P00849|ATP6_XENLA ATP synthase a chain (AT ( 226) 173 47.1 5.5e-06 0.261 0.630 165sp|P00847|ATP6_BOVIN ATP synthase a chain (AT ( 226) 172 46.8 6.5e-06 0.233 0.581 236sp|P14862|ATP6_COCHE ATP synthase a chain (AT ( 257) 171 46.6 8.7e-06 0.204 0.608 265sp|P00848|ATP6_MOUSE ATP synthase a chain (AT ( 226) 166 45.5 1.7e-05 0.259 0.617 193sp|P00851|ATP6_DROYA ATP synthase a chain (AT ( 224) 139 39.2 0.0013 0.225 0.549 253
sp|P24962|CYB_STELO Cytochrome b ( 379) 125 35.9 0.021 0.223 0.575 193sp|P09716|US17_HCMVA Hypothetical protein HVL ( 293) 109 32.3 0.21 0.260 0.565 131sp|P68092|CYB_STEAT Cytochrome b ( 379) 109 32.2 0.27 0.211 0.562 194sp|P24960|CYB_ODOHE Cytochrome b ( 379) 104 31.1 0.61 0.210 0.555 200sp|P03887|NU1M_BOVIN NADH-ubiquinone oxidored ( 318) 98 29.7 1.3 0.287 0.545 167sp|P24992|CYB_ANTAM Cytochrome b ( 379) 99 29.9 1.4 0.192 0.565 193
Query: atp6_ecoli.aa ATP synthase a - 271 aaLibrary: 5190103 residues in 13351 sequences
Homology is Transitive
(on domains)
18
Human mito
E. coli
Euglena chloro.SynechocystisCyanobacteriaMarch. chloro.
Spinach chloro.Tobacco chloro. 0.007 : 10-13
0.001 : 10-13
0.0007 : 10-12
0.007 : 10-11
0.006 : 10-13
0.001 : 10-13
0.02 : 10-12
10-6 : 10-117
Pea chloro.
10-90 : 10-6
Bovine mitoMouse mito
Frog mitoDros. mito
10-23 : 10-8
10-18 : 10-5
0.0006 : 10-12
10-1 : /10-6
10-13 : 10-9
10-15 : 10-8
Rice chloro.
10-70 : 10-5
10-73 : 10-6
10-45 : 10-6
10-26 : 0.0013
Yeast mito.
Cochliobolus mito.Aspergillus mito.
Corn mito.Wheat mito.
vs human : E. coli
vs human : E. coli
Page 10
7/16/16
10
19
Homology and EXCESS similarityThe importance of perspective
• We use the E()-value to infer homology based on excess similarity BETWEEN the QUERY and the SUBJECT sequences
• Two homologous sequences may not share excess similarity in a BLAST search with one or the other as query, but share significant similarity to a third sequence (or to a PSSM or HMM)
• If two sequences share significant similarity to the the same sequence in the same region, we can infer homology.
As always, non-excess similaritydoes not imply non-homology
Homology and Domains –Histone acetyltransferase KAT2B
20
The best scores are: s-w bits E(454402) %_id %_sim alenKAT2B_HUMAN Histone acetyltransferase KAT2B ( 832) 3820 1456. 0 1.000 1.000 832
KAT2A_HUMAN Histone acetyltransferase KAT2A ( 837) 2747 1049. 0 0.721 0.870 813
GCN5_SCHPO Histone acetyltransferase gcn5 ( 454) 867 334.7 3e-90 0.483 0.768 354GCN5_YEAST Histone acetyltransferase GCN5 ( 439) 792 306.2 1.1e-81 0.469 0.760 354
GCN5_ORYSJ Histone acetyltransferase GCN5 ( 511) 760 294.0 5.9e-78 0.436 0.755 376GCN5_ARATH Histone acetyltransferase GCN5; ( 568) 719 278.4 3.3e-73 0.434 0.740 369
BPTF_HUMAN Nucleosome-remodeling factor sub (3046) 286 113.6 7.6e-23 0.495 0.804 97
NU301_DROME Nucleosome-remodeling factor su (2669) 276 109.8 9.1e-22 0.511 0.819 94CECR2_HUMAN Cat eye syndrome critical regio (1484) 232 93.2 5e-17 0.371 0.790 105
BRD4_HUMAN Bromodomain-containing protein 4 (1362) 214 86.4 5.2e-15 0.379 0.698 116
BRD4_MOUSE Bromodomain-containing protein 4 (1400) 214 86.4 5.3e-15 0.379 0.698 116BAZ2A_HUMAN Bromodomain adjacent to zinc fi (1905) 211 85.2 1.7e-14 0.382 0.683 123
BAZ2A_XENLA Bromodomain adjacent to zinc fi (1698) 206 83.3 5.5e-14 0.350 0.684 117
FSH_DROME Homeotic protein female sterile; (2038) 205 82.9 8.8e-14 0.341 0.667 129BAZ2A_MOUSE Bromodomain adjacent to zinc fi (1889) 204 82.5 1e-13 0.368 0.680 125
BRDT_MACFA Bromodomain testis-specific prot ( 947) 197 80.0 3e-13 0.367 0.697 109BRD3_HUMAN Bromodomain-containing protein 3 ( 726) 194 78.9 4.9e-13 0.362 0.664 116
Page 11
7/16/16
11
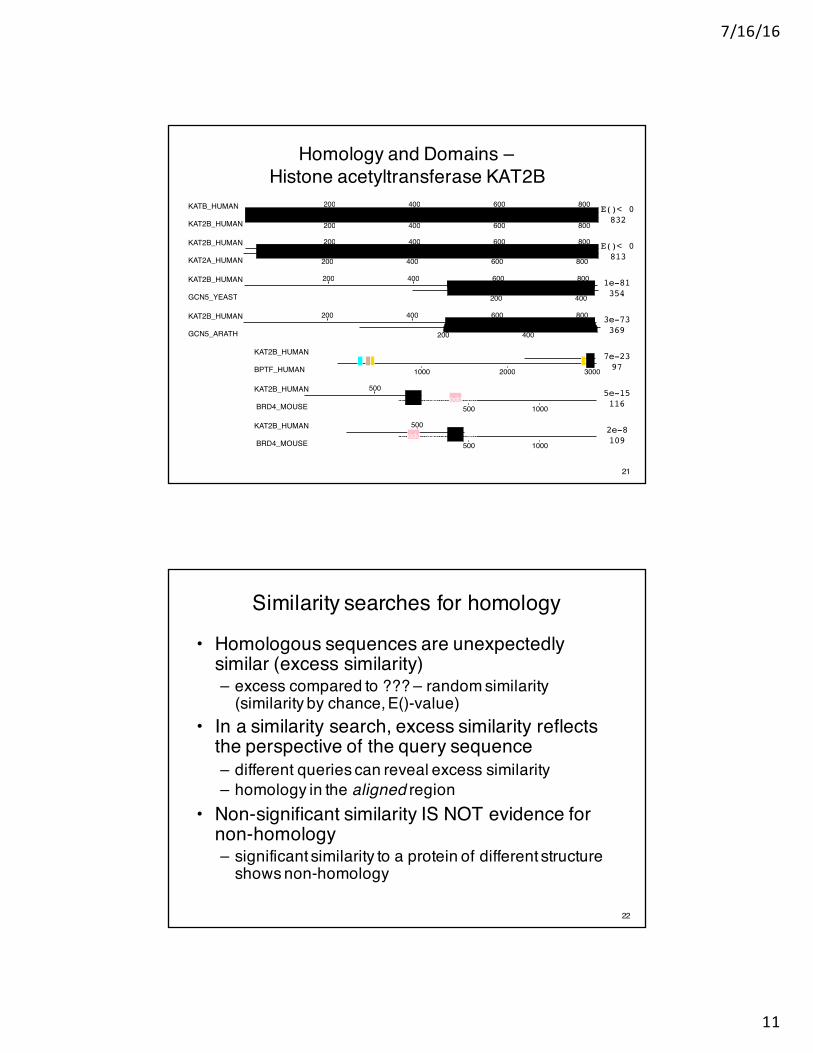
Homology and Domains –Histone acetyltransferase KAT2B
21
E()< 0832
E()< 0813
1e-81354
3e-73369
7e-2397
5e-15116
2e-8109
200 400 600 800KATB_HUMAN
200 400 600 800KAT2B_HUMANPCAF_N C.Acetyltrans Bromodomain
200 400 600 800KAT2B_HUMAN
200 400 600 800KAT2A_HUMANPCAF_N C.Acetyltrans Bromodomain
200 400
200 400 600 800KAT2B_HUMAN
GCN5_YEASTC.Acetyltrans Bromodomain
200 400 600 800KAT2B_HUMAN
200 400GCN5_ARATHC.Acetyltrans Bromodomain
KAT2B_HUMAN
1000 2000 3000BPTF_HUMAN
500KAT2B_HUMAN
500 1000 BRD4_MOUSEBromodomainBromodomain
500KAT2B_HUMAN
500 1000 BRD4_MOUSEBromodomainBromodomain
Similarity searches for homology
• Homologous sequences are unexpectedly similar (excess similarity)– excess compared to ??? – random similarity
(similarity by chance, E()-value)• In a similarity search, excess similarity reflects
the perspective of the query sequence– different queries can reveal excess similarity– homology in the aligned region
• Non-significant similarity IS NOT evidence for non-homology– significant similarity to a protein of different structure
shows non-homology
22
Page 12
7/16/16
12
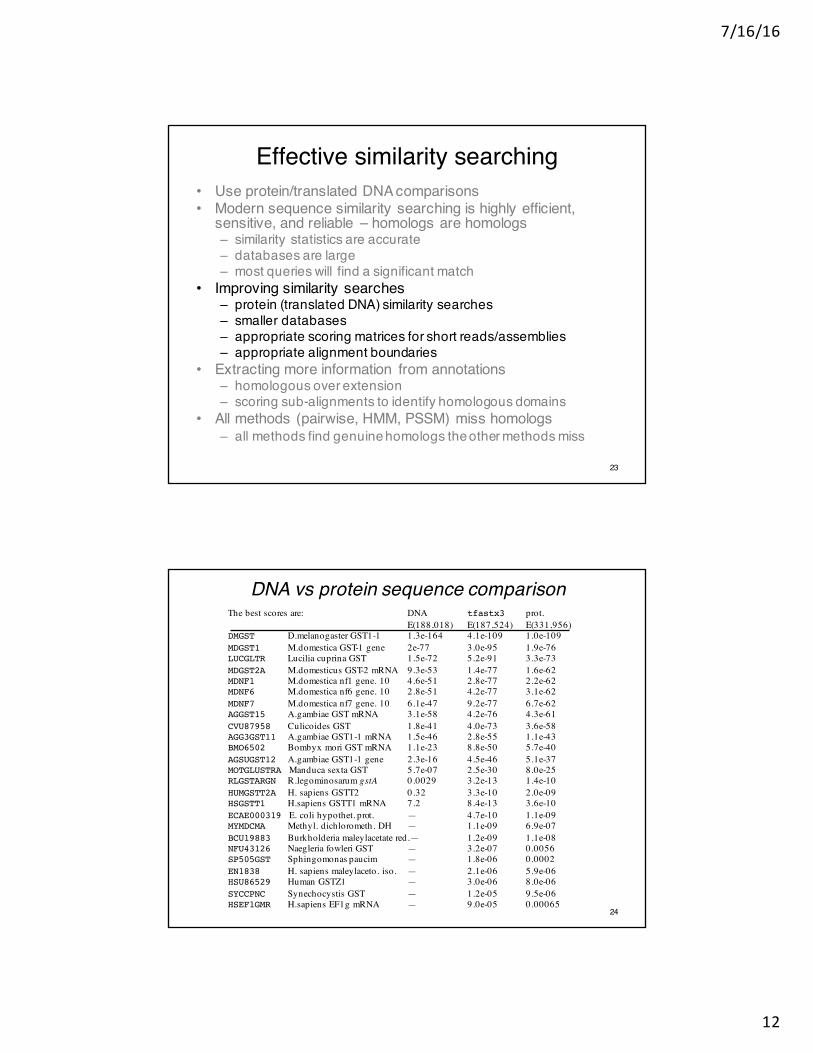
Effective similarity searching• Use protein/translated DNA comparisons• Modern sequence similarity searching is highly efficient,
sensitive, and reliable – homologs are homologs– similarity statistics are accurate– databases are large– most queries will find a significant match
• Improving similarity searches– protein (translated DNA) similarity searches– smaller databases– appropriate scoring matrices for short reads/assemblies– appropriate alignment boundaries
• Extracting more information from annotations– homologous over extension– scoring sub-alignments to identify homologous domains
• All methods (pairwise, HMM, PSSM) miss homologs– all methods find genuine homologs the other methods miss
23
24
The best scores are: DNA tfastx3 prot.E(188,018) E(187,524) E(331,956)
DMGST D.melanogaster GST1-1 1.3e-164 4.1e-109 1.0e-109MDGST1 M.domestica GST-1 gene 2e-77 3.0e-95 1.9e-76LUCGLTR Lucilia cuprina GST 1.5e-72 5.2e-91 3.3e-73MDGST2A M.domesticus GST-2 mRNA 9.3e-53 1.4e-77 1.6e-62MDNF1 M.domestica nf1 gene. 10 4.6e-51 2.8e-77 2.2e-62MDNF6 M.domestica nf6 gene. 10 2.8e-51 4.2e-77 3.1e-62MDNF7 M.domestica nf7 gene. 10 6.1e-47 9.2e-77 6.7e-62AGGST15 A.gambiae GST mRNA 3.1e-58 4.2e-76 4.3e-61CVU87958 Culicoides GST 1.8e-41 4.0e-73 3.6e-58AGG3GST11 A.gambiae GST1-1 mRNA 1.5e-46 2.8e-55 1.1e-43BMO6502 Bombyx mori GST mRNA 1.1e-23 8.8e-50 5.7e-40AGSUGST12 A.gambiae GST1-1 gene 2.3e-16 4.5e-46 5.1e-37MOTGLUSTRA Manduca sexta GST 5.7e-07 2.5e-30 8.0e-25RLGSTARGN R.legominosarum gstA 0.0029 3.2e-13 1.4e-10HUMGSTT2A H. sapiens GSTT2 0.32 3.3e-10 2.0e-09HSGSTT1 H.sapiens GSTT1 mRNA 7.2 8.4e-13 3.6e-10ECAE000319 E. coli hypothet. prot. — 4.7e-10 1.1e-09MYMDCMA Methyl. dichlorometh. DH — 1.1e-09 6.9e-07BCU19883 Burkholderia maleylacetate red.— 1.2e-09 1.1e-08NFU43126 Naegleria fowleri GST — 3.2e-07 0.0056SP505GST Sphingomonas paucim — 1.8e-06 0.0002EN1838 H. sapiens maleylaceto. iso. — 2.1e-06 5.9e-06HSU86529 Human GSTZ1 — 3.0e-06 8.0e-06SYCCPNC Synechocystis GST — 1.2e-05 9.5e-06HSEF1GMR H.sapiens EF1g mRNA — 9.0e-05 0.00065
DNA vs protein sequence comparison
Page 13
7/16/16
13
25
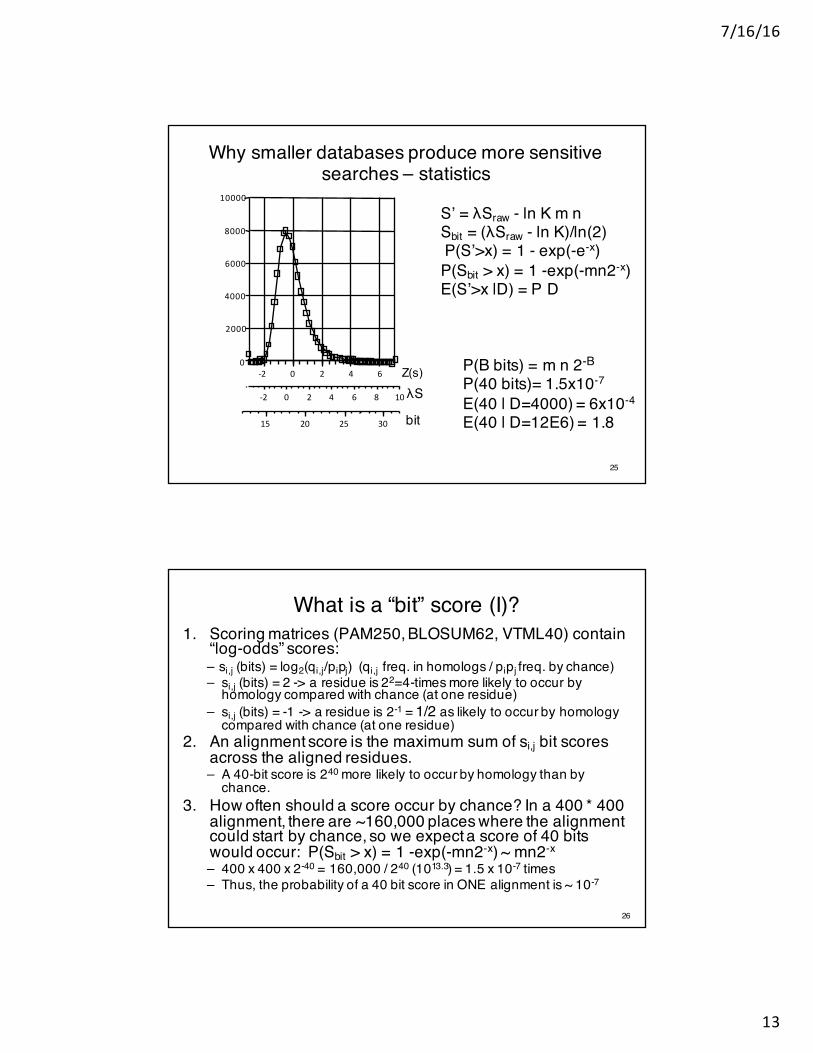
Why smaller databases produce more sensitive searches – statistics
S’ = λSraw - ln K m nSbit = (λSraw - ln K)/ln(2)P(S’>x) = 1 - exp(-e-x)P(Sbit > x) = 1 -exp(-mn2-x)E(S’>x |D) = P D
P(B bits) = m n 2-B
P(40 bits)= 1.5x10⁻⁷
E(40 | D=4000) = 6x10⁻⁴
E(40 | D=12E6) = 1.8
-2 0 2 4 6
-2 0 2 4 6 8 10
0
15 20 25 30
10000
8000
2000
6000
4000
Z(s)λS
bit
What is a “bit” score (I)?1. Scoring matrices (PAM250, BLOSUM62, VTML40) contain
“log-odds” scores:– si,j (bits) = log2(qi,j/pipj) (qi,j freq. in homologs / pipj freq. by chance)– si,j (bits) = 2 -> a residue is 22=4-times more likely to occur by
homology compared with chance (at one residue)– si,j (bits) = -1 -> a residue is 2-1 = 1/2 as likely to occur by homology
compared with chance (at one residue)2. An alignment score is the maximum sum of si,j bit scores
across the aligned residues. – A 40-bit score is 240 more likely to occur by homology than by
chance.3. How often should a score occur by chance? In a 400 * 400
alignment, there are ~160,000 places where the alignment could start by chance, so we expect a score of 40 bits would occur: P(Sbit > x) = 1 -exp(-mn2-x) ~ mn2-x
– 400 x 400 x 2-40 = 160,000 / 240 (1013.3) = 1.5 x 10⁻⁷ times– Thus, the probability of a 40 bit score in ONE alignment is ~ 10-7
26
Page 14
7/16/16
14
What is a “bit” score (I)?4. But we did not ONE alignment, we did 4,000,
40,000, 500,000, or 20 million alignments when we searched the database:
– E(Sbit | D) = p(40 bits) x database size– E(40 | 4,000) = 10-7 x 4,000 = 4 x 10⁻⁴ (significant)– E(40 | 40,000) = 10-7 x 4 x 104 = 4 x 10⁻³ (not significant)– E(40 | 500,000) =10-7 x 5 x 105 = 0.05 (not significant)– E(40 | 20 million) = 10-7 x 2.0 x 107 = 2.0 (not significant)
27
Not significant does not mean not-homologous
Bonferroni correction for multiple tests –each alignment is a test
28
E()-values are conservative frequentist estimates that similarity occurred by chance
S’ = λSraw - ln K m nSbit = (λSraw - ln K)/ln(2)P(S’>x) = 1 - exp(-e-x)P(Sbit > x) = 1 -exp(-mn2-x)
Bonferroni correction:E(S’>x |D) = P D(# of tests)-2 0 2 4 6
-2 0 2 4 6 8 10
15 20 25 30
Z(s)λSbit
With modern sequence databases (thousands of complete proteomes), E()<10-10 is routine for sequences >25% identical, after correcting for 10,000,000 sequences (tests)
Page 15
7/16/16
15
How many “bits” do I need?E() = p() x database size
E(40 | 4,000) = 10-7 x 4,000 = 4 x 10⁻⁴ (significant)E(40 | 40,000) = 10-7 x4 x 104 = 4 x 10⁻³ (not significant)E(40 | 500,000) = 10-7 x 5 x 105 = 0.05 (not significant)
To get E() ~ 10-3 , how many bits do I need? p = m n 2 –bits
bits = –log2(p/(m n)) = –log2(E()/(database_size m n))genome (10,000) p ~ 10-3/104 = 10-7/160,000 = 40 bitsSwissProt (500,000) p ~ 10-3/106 = 10-9/160,000 = 47 bitsUniprot/NR (107) p ~ 10-3/107 = 10-10/160,000 = 50 bits
29
very significant E()<10-50
significant E()<10-3
not significant
significant E()<10-6
What database to search?
• Search the smallest comprehensive database likely to contain your protein– vertebrates – human proteins (40,000)– fungi – S. cerevisiae (6,000)– bacteria – E. coli, gram positive, etc. (<100,000)
• Search a richly annotated protein set (SwissProt, >500,000)
• Always search NR (> 50 million) LAST• Never Search “GenBank” (DNA)
30
Page 16
7/16/16
16
Scoring matrices
• Scoring matrices can set the evolutionary look-back time for a search– Lower PAM (PAM10/MDM10 … PAM60) for closer
(10% … 50% identity)– Higher BLOSUM for higher conservation (BLOSUM50
distant, BLOSUM80 conserved)• Shallow scoring matrices for short domains/short
queries (metagenomics)– Matrices have “bits/position” (score/position), 40 aa at
0.45 bits/position (BLOSUM62) means 18 bit ave.score (50 bits significant)
• Deep scoring matrices allow alignments to continue, possibly outside the homologous region
31
32
A R N D E I LA 8R -9 12N -4 -7 11D -4 -13 3 11E -3 -11 -2 4 11I -6 -7 -7 -10 -7 12L -8 -11 -9 -16 -12 -1 10
Pam40A R N D E I L
A 2R -2 6N 0 0 2D 0 -1 2 4E 0 -1 1 3 4I -1 -2 -2 -2 -2 5L -2 -3 -3 -4 -3 2 6
Pam250
Where do scoring matrices come from?
qij : replacement frequency at PAM40, 250qR:N ( 40) = 0.000435 pR = 0.051 qR:N (250) = 0.002193 pN = 0.043 λ2 Sij = lg2 (qij/pipj) λe Sij = ln(qij/pipj) pRpN = 0.002193λ2 SR:N( 40) = lg2 (0.000435/0.00219)= -2.333λ2 = 1/3; SR:N( 40) = -2.333/l2 = -7λ SR:N(250) = lg2 (0.002193/0.002193)= 0
λSi, j = logb(qi, jpi pj
)
Page 17
7/16/16
17
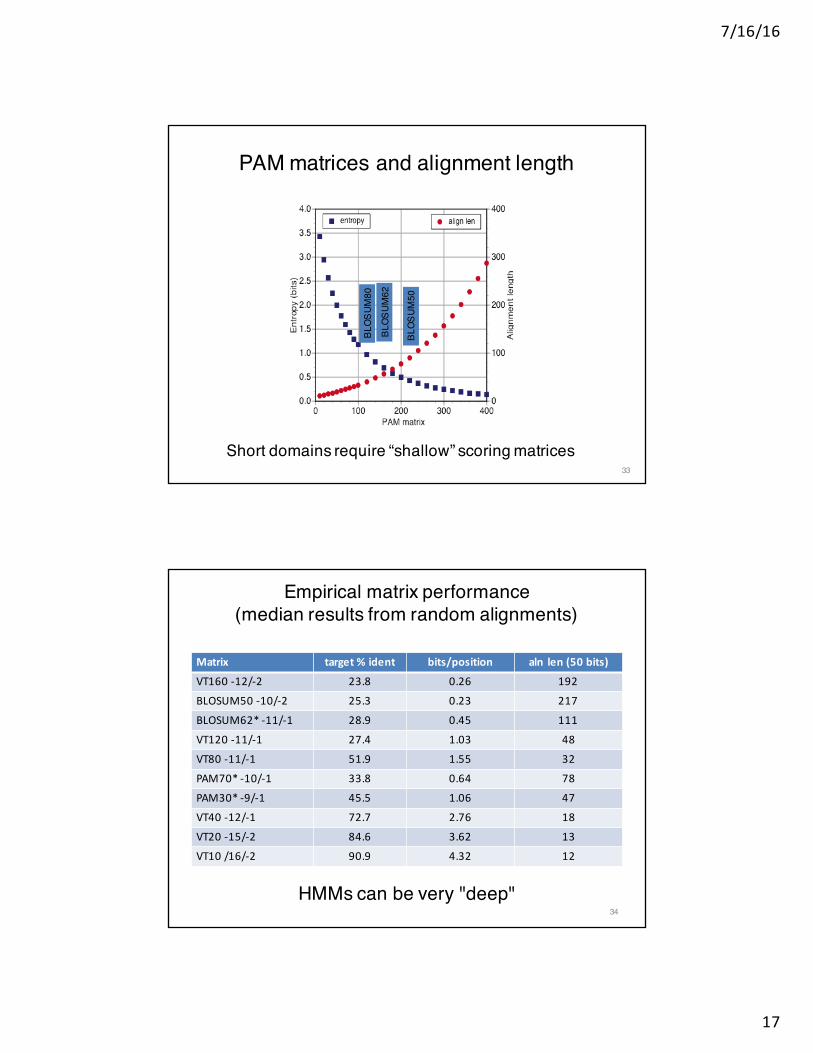
33
PAM matrices and alignment length
BLOS
UM80
BLOS
UM62
BLOS
UM50
Short domains require “shallow” scoring matrices
Empirical matrix performance(median results from random alignments)
Matrix target%ident bits/position aln len (50bits)
VT160-12/-2 23.8 0.26 192
BLOSUM50-10/-2 25.3 0.23 217
BLOSUM62*-11/-1 28.9 0.45 111
VT120-11/-1 27.4 1.03 48
VT80 -11/-1 51.9 1.55 32
PAM70*-10/-1 33.8 0.64 78
PAM30*-9/-1 45.5 1.06 47
VT40-12/-1 72.7 2.76 18
VT20-15/-2 84.6 3.62 13
VT10/16/-2 90.9 4.32 12
34
HMMs can be very "deep"
Page 18
7/16/16
18
Scoring matrices affect alignment boundaries(homologous over-extension)
BLOSUM62 -11/-1 VTML80 -10/-1
100 200 300 400 500sp|Q14247.2|SRC8_HUMAN Src substrate cortactin; Am
50
100
150
200
250
300
350
400
450
500
550
sp|Q14247.2|SRC8_HUMAN Src substrate cort
E(): <0.0001<0.01
<1<1e+02
>1e+02
Hs1_Cortacti
Hs1_Cortacti
Hs1_Cortacti
Hs1_Cortacti
Hs1_Cortacti
Hs1_Cortacti
Hs1_Cortacti
SH3_domain
Hs1_Cortacti
Hs1_Cortacti
Hs1_Cortacti
Hs1_Cortacti
Hs1_Cortacti
Hs1_Cortacti
Hs1_Cortacti
SH3_domain
35
36
Scoring Matrices - Summary
• PAM and BLOSUM matrices greatly improve the sensitivity of protein sequence comparison – low identity with significant similarity
• PAM matrices have an evolutionary model - lower number, less divergence – lower=closer; higher=more distant
• BLOSUM matrices are sampled from conserved regions at different average identity – higher=more conservation
• Short alignments (domains, exons, reads) require shallow (higher information content) matrices
• Shallow matrices set maximum look-back time
Page 19
7/16/16
19
Effective similarity searching• Modern sequence similarity searching is highly efficient,
sensitive, and reliable – homologs are homologs– similarity statistics are accurate– databases are large– most queries will find a significant match
• Improving similarity searches– smaller databases– appropriate scoring matrices for short reads/assemblies– appropriate alignment boundaries
• Extracting more information from annotations– homologous over extension– scoring sub-alignments to identify homologous domains
• All methods (pairwise, HMM, PSSM) miss homologs– all methods find genuine homologs the other methods miss
37
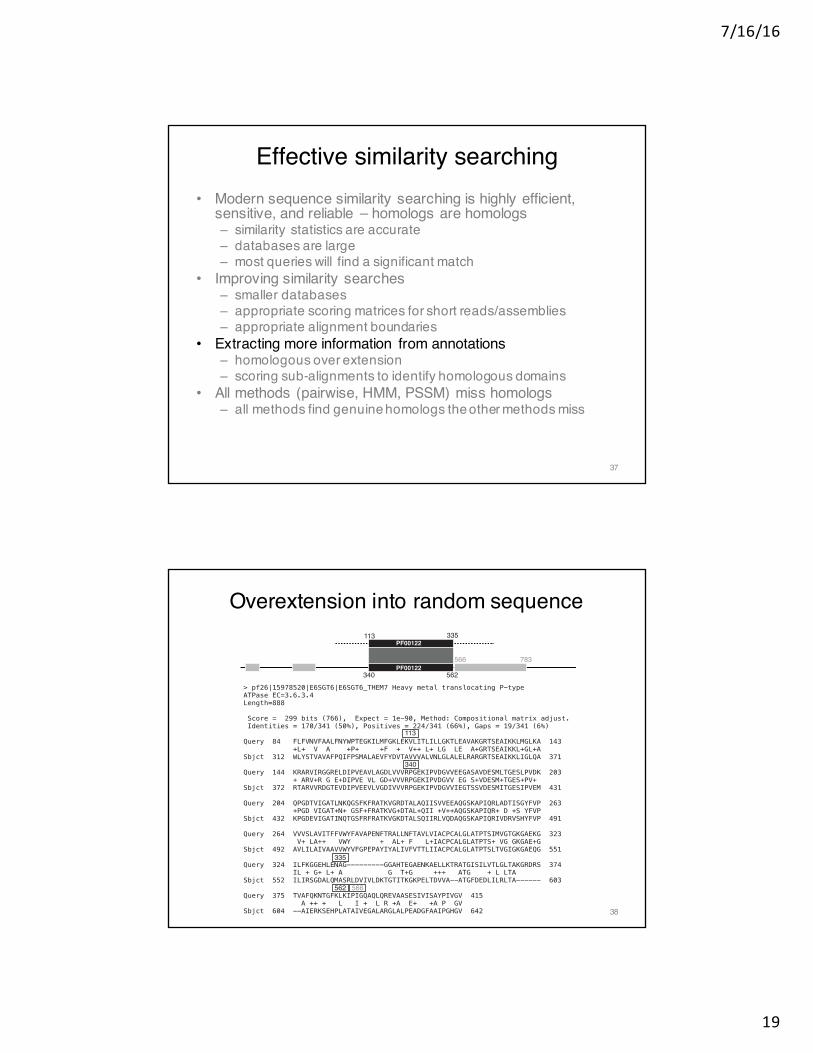
Overextension into random sequence
> pf26|15978520|E6SGT6|E6SGT6_THEM7 Heavy metal translocating P-type
ATPase EC=3.6.3.4
Length=888
Score = 299 bits (766), Expect = 1e-90, Method: Compositional matrix adjust.
Identities = 170/341 (50%), Positives = 224/341 (66%), Gaps = 19/341 (6%)
Query 84 FLFVNVFAALFNYWPTEGKILMFGKLEKVLITLILLGKTLEAVAKGRTSEAIKKLMGLKA 143
+L+ V A +P+ +F + V++ L+ LG LE A+GRTSEAIKKL+GL+A
Sbjct 312 WLYSTVAVAFPQIFPSMALAEVFYDVTAVVVALVNLGLALELRARGRTSEAIKKLIGLQA 371
Query 144 KRARVIRGGRELDIPVEAVLAGDLVVVRPGEKIPVDGVVEEGASAVDESMLTGESLPVDK 203
+ ARV+R G E+DIPVE VL GD+VVVRPGEKIPVDGVV EG S+VDESM+TGES+PV+
Sbjct 372 RTARVVRDGTEVDIPVEEVLVGDIVVVRPGEKIPVDGVVIEGTSSVDESMITGESIPVEM 431
Query 204 QPGDTVIGATLNKQGSFKFRATKVGRDTALAQIISVVEEAQGSKAPIQRLADTISGYFVP 263
+PGD VIGAT+N+ GSF+FRATKVG+DTAL+QII +V++AQGSKAPIQR+ D +S YFVP
Sbjct 432 KPGDEVIGATINQTGSFRFRATKVGKDTALSQIIRLVQDAQGSKAPIQRIVDRVSHYFVP 491
Query 264 VVVSLAVITFFVWYFAVAPENFTRALLNFTAVLVIACPCALGLATPTSIMVGTGKGAEKG 323
V+ LA++ VWY + AL+ F L+IACPCALGLATPTS+ VG GKGAE+G
Sbjct 492 AVLILAIVAAVVWYVFGPEPAYIYALIVFVTTLIIACPCALGLATPTSLTVGIGKGAEQG 551
Query 324 ILFKGGEHLENAG---------GGAHTEGAENKAELLKTRATGISILVTLGLTAKGRDRS 374
IL + G+ L+ A G T+G +++ ATG + L LTA
Sbjct 552 ILIRSGDALQMASRLDVIVLDKTGTITKGKPELTDVVA--ATGFDEDLILRLTA------ 603
Query 375 TVAFQKNTGFKLKIPIGQAQLQREVAASESIVISAYPIVGV 415
A ++ + L I + L R +A E+ +A P GV
Sbjct 604 --AIERKSEHPLATAIVEGALARGLALPEADGFAAIPGHGV 642
PF00122
PF00122
113 335
340 562
566 783
113
340
335
562 566
38
Page 20
7/16/16
20
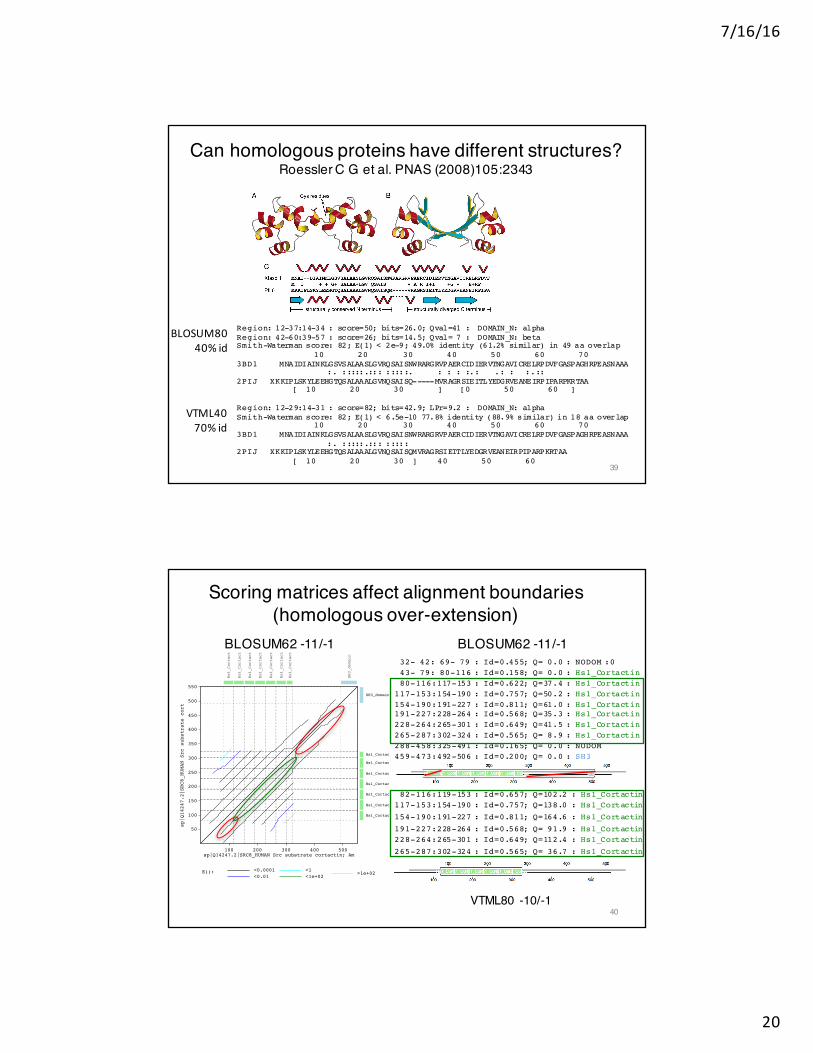
Region: 12-37:14-34 : score=50; bits=26.0; Qval=41 : DOMAIN_N: alphaRegion: 42-60:39-57 : score=26; bits=14.5; Qval= 7 : DOMAIN_N: betaSmith-Waterman score: 82; E(1) < 2e-9; 49.0% identity (61.2% similar) in 49 aa overlap
10 20 30 40 50 60 70 3BD1 MNAIDIAINKLGSVSALAASLGVRQSAISNWRARGRVPAERCIDIERVTNGAVICRELRPDVFGASPAGHRPEASNAAA
:. :::::.::: :::::. : : : :.: .: : :.:: 2PIJ XKKIPLSKYLEEHGTQSALAAALGVNQSAISQ-----MVRAGRSIEITLYEDGRVEANEIRPIPARPKRTAA
[ 10 20 30 ] [0 50 60 ]
Can homologous proteins have different structures?Roessler C G et al. PNAS (2008)105:2343
Region: 12-29:14-31 : score=82; bits=42.9; LPr=9.2 : DOMAIN_N: alphaSmith-Waterman score: 82; E(1) < 6.5e-10 77.8% identity (88.9% similar) in 18 aa overlap
10 20 30 40 50 60 70 3BD1 MNAIDIAINKLGSVSALAASLGVRQSAISNWRARGRVPAERCIDIERVTNGAVICRELRPDVFGASPAGHRPEASNAAA
:. :::::.::: ::::: 2PIJ XKKIPLSKYLEEHGTQSALAAALGVNQSAISQMVRAGRSIEITLYEDGRVEANEIRPIPARPKRTAA
[ 10 20 30 ] 40 50 60
BLOSUM8040%id
VTML4070%id
39
Scoring matrices affect alignment boundaries(homologous over-extension)
BLOSUM62 -11/-1 BLOSUM62 -11/-1
100 200 300 400 500sp|Q14247.2|SRC8_HUMAN Src substrate cortactin; Am
50
100
150
200
250
300
350
400
450
500
550
sp|Q14247.2|SRC8_HUMAN Src substrate cort
E(): <0.0001<0.01
<1<1e+02
>1e+02
Hs1_Cortacti
Hs1_Cortacti
Hs1_Cortacti
Hs1_Cortacti
Hs1_Cortacti
Hs1_Cortacti
Hs1_Cortacti
SH3_domain
Hs1_Cortacti
Hs1_Cortacti
Hs1_Cortacti
Hs1_Cortacti
Hs1_Cortacti
Hs1_Cortacti
Hs1_Cortacti
SH3_domain
32- 42: 69- 79 : Id=0.455; Q= 0.0 : NODOM :043- 79: 80-116 : Id=0.158; Q= 0.0 : Hs1_Cortactin80-116:117-153 : Id=0.622; Q=37.4 : Hs1_Cortactin
117-153:154-190 : Id=0.757; Q=50.2 : Hs1_Cortactin154-190:191-227 : Id=0.811; Q=61.0 : Hs1_Cortactin191-227:228-264 : Id=0.568; Q=35.3 : Hs1_Cortactin228-264:265-301 : Id=0.649; Q=41.5 : Hs1_Cortactin265-287:302-324 : Id=0.565; Q= 8.9 : Hs1_Cortactin288-458:325-491 : Id=0.165; Q= 0.0 : NODOM459-473:492-506 : Id=0.200; Q= 0.0 : SH3
VTML80 -10/-1
82-116:119-153 : Id=0.657; Q=102.2 : Hs1_Cortactin117-153:154-190 : Id=0.757; Q=138.0 : Hs1_Cortactin
154-190:191-227 : Id=0.811; Q=164.6 : Hs1_Cortactin
191-227:228-264 : Id=0.568; Q= 91.9 : Hs1_Cortactin228-264:265-301 : Id=0.649; Q=112.4 : Hs1_Cortactin
265-287:302-324 : Id=0.565; Q= 36.7 : Hs1_Cortactin
40
Page 21
7/16/16
21
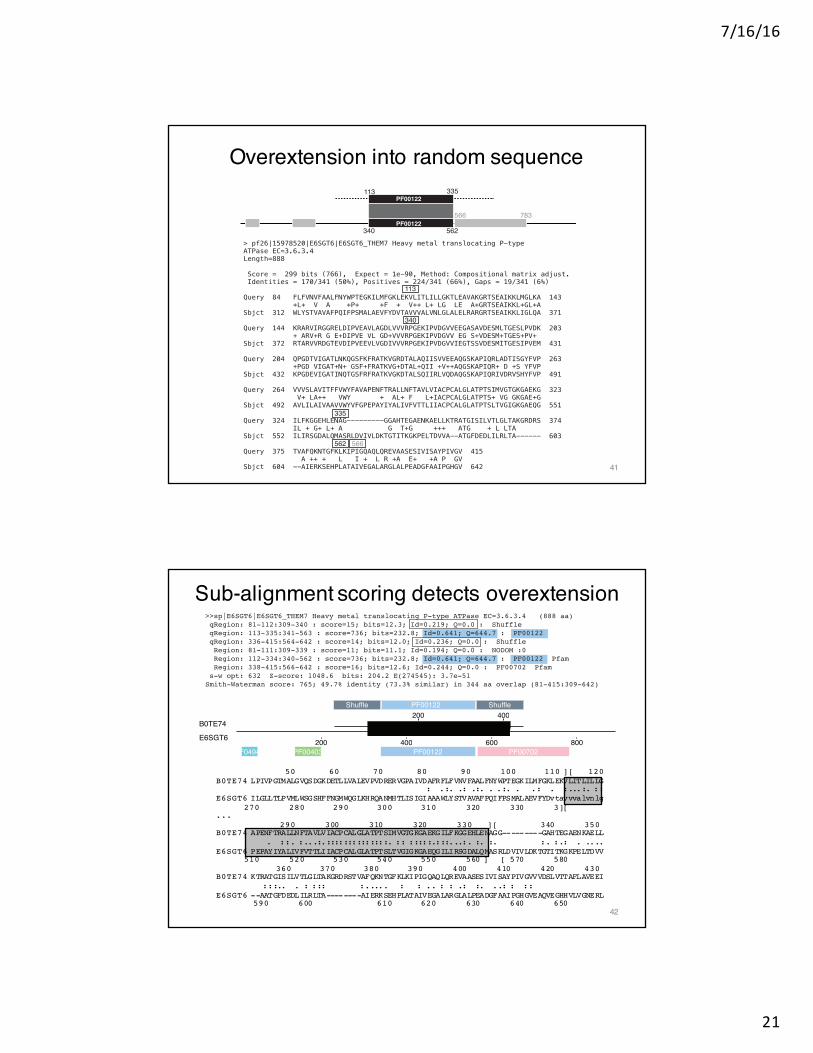
Overextension into random sequence
> pf26|15978520|E6SGT6|E6SGT6_THEM7 Heavy metal translocating P-type
ATPase EC=3.6.3.4
Length=888
Score = 299 bits (766), Expect = 1e-90, Method: Compositional matrix adjust.
Identities = 170/341 (50%), Positives = 224/341 (66%), Gaps = 19/341 (6%)
Query 84 FLFVNVFAALFNYWPTEGKILMFGKLEKVLITLILLGKTLEAVAKGRTSEAIKKLMGLKA 143
+L+ V A +P+ +F + V++ L+ LG LE A+GRTSEAIKKL+GL+A
Sbjct 312 WLYSTVAVAFPQIFPSMALAEVFYDVTAVVVALVNLGLALELRARGRTSEAIKKLIGLQA 371
Query 144 KRARVIRGGRELDIPVEAVLAGDLVVVRPGEKIPVDGVVEEGASAVDESMLTGESLPVDK 203
+ ARV+R G E+DIPVE VL GD+VVVRPGEKIPVDGVV EG S+VDESM+TGES+PV+
Sbjct 372 RTARVVRDGTEVDIPVEEVLVGDIVVVRPGEKIPVDGVVIEGTSSVDESMITGESIPVEM 431
Query 204 QPGDTVIGATLNKQGSFKFRATKVGRDTALAQIISVVEEAQGSKAPIQRLADTISGYFVP 263
+PGD VIGAT+N+ GSF+FRATKVG+DTAL+QII +V++AQGSKAPIQR+ D +S YFVP
Sbjct 432 KPGDEVIGATINQTGSFRFRATKVGKDTALSQIIRLVQDAQGSKAPIQRIVDRVSHYFVP 491
Query 264 VVVSLAVITFFVWYFAVAPENFTRALLNFTAVLVIACPCALGLATPTSIMVGTGKGAEKG 323
V+ LA++ VWY + AL+ F L+IACPCALGLATPTS+ VG GKGAE+G
Sbjct 492 AVLILAIVAAVVWYVFGPEPAYIYALIVFVTTLIIACPCALGLATPTSLTVGIGKGAEQG 551
Query 324 ILFKGGEHLENAG---------GGAHTEGAENKAELLKTRATGISILVTLGLTAKGRDRS 374
IL + G+ L+ A G T+G +++ ATG + L LTA
Sbjct 552 ILIRSGDALQMASRLDVIVLDKTGTITKGKPELTDVVA--ATGFDEDLILRLTA------ 603
Query 375 TVAFQKNTGFKLKIPIGQAQLQREVAASESIVISAYPIVGV 415
A ++ + L I + L R +A E+ +A P GV
Sbjct 604 --AIERKSEHPLATAIVEGALARGLALPEADGFAAIPGHGV 642
PF00122
PF00122
113 335
340 562
566 783
113
340
335
562 566
41
>>sp|E6SGT6|E6SGT6_THEM7 Heavy metal translocating P-type ATPase EC=3.6.3.4 (888 aa) qRegion: 81-112:309-340 : score=15; bits=12.3; Id=0.219; Q=0.0 : Shuffle qRegion: 113-335:341-563 : score=736; bits=232.8; Id=0.641; Q=644.7 : PF00122 qRegion: 336-415:564-642 : score=14; bits=12.0; Id=0.236; Q=0.0 : Shuffle Region: 81-111:309-339 : score=11; bits=11.1; Id=0.194; Q=0.0 : NODOM :0 Region: 112-334:340-562 : score=736; bits=232.8; Id=0.641; Q=644.7 : PF00122 Pfam Region: 338-415:566-642 : score=16; bits=12.6; Id=0.244; Q=0.0 : PF00702 Pfam s-w opt: 632 Z-score: 1048.6 bits: 204.2 E(274545): 3.7e-51Smith-Waterman score: 765; 49.7% identity (73.3% similar) in 344 aa overlap (81-415:309-642)
200 400
200 400 600 800E6SGT6
PF04945 PF00403 PF00122 PF00702
Shuffle PF00122 Shuffle
B0TE74
Sub-alignment scoring detects overextension
50 60 70 80 90 100 110 ][ 120B0TE74 LPIVPGTMALGVQSDGKDETLLVALEVPVDRERVGPAIVDAFRFLFVNVFAALFNYWPTEGKILMFGKLEKVLITLILLG
: .:. .: .:. . .:. . .: . :...:. ::E6SGT6 ILGLLTLPVMLWSGSHFFNGMWQGLKHRQANMHTLISIGIAAAWLYSTVAVAFPQIFPSMALAEVFYDvtavvvalvnlg
270 280 290 300 310 320 330 3][ ...
290 300 310 320 330 ][ 340 350 B0TE74 APENFTRALLNFTAVLVIACPCALGLATPTSIMVGTGKGAEKGILFKGGEHLENAGG---------GAHTEGAENKAELL
. ::. :...:.::::::::::::::. :: :::::.:::...:. :. :. :. :.: . ....E6SGT6 PEPAYIYALIVFVTTLIIACPCALGLATPTSLTVGIGKGAEQGILIRSGDALQMASRLDVIVLDKTGTITKGKPELTDVV
510 520 530 540 550 560 ] [ 570 580 360 370 380 390 400 410 420 430
B0TE74 KTRATGISILVTLGLTAKGRDRSTVAFQKNTGFKLKIPIGQAQLQREVAASESIVISAYPIVGVVVDSLVTTAFLAVEEI:::.. . : ::: :..... : : .. : : .: :. ..: : ::
E6SGT6 --AATGFDEDLILRLTA--------AIERKSEHPLATAIVEGALARGLALPEADGFAAIPGHGVEAQVEGHHVLVGNERL590 600 610 620 630 640 650
42
Page 22
7/16/16
22
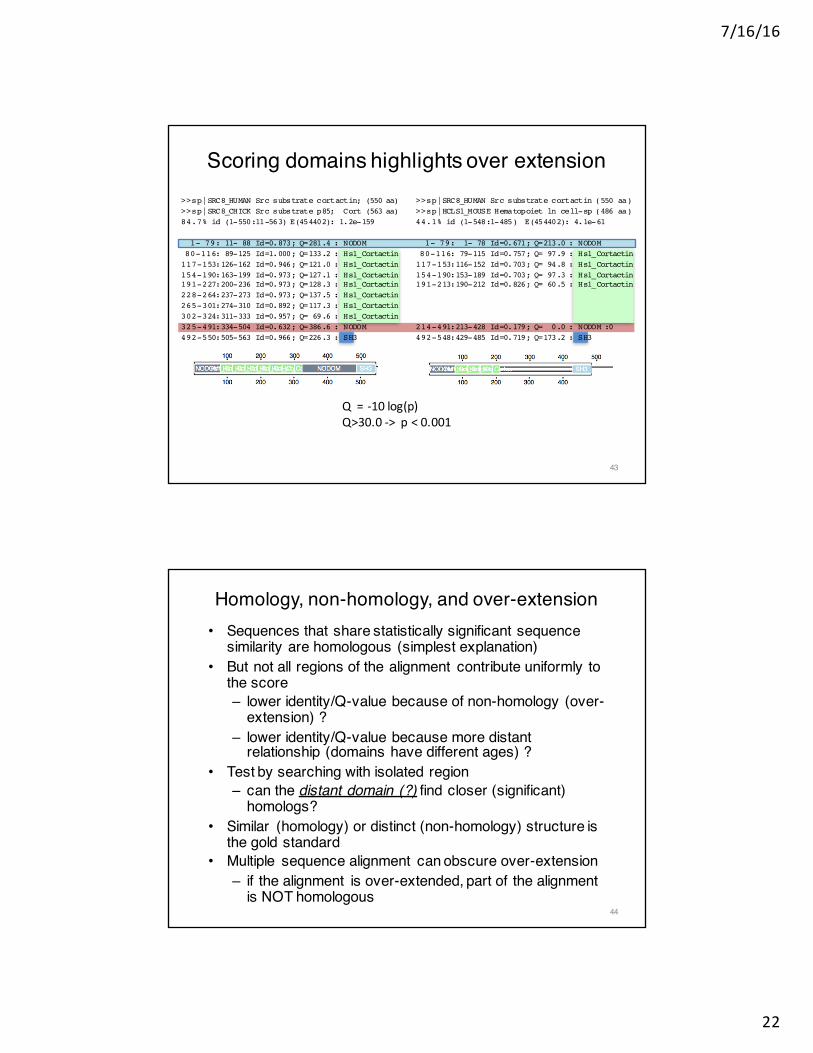
Scoring domains highlights over extension>>sp|SRC8_HUMAN Src substrate cortactin; (550 aa)>>sp|SRC8_CHICK Src substrate p85; Cort (563 aa)84.7% id (1-550:11-563) E(454402): 1.2e-159
1- 79: 11- 88 Id=0.873; Q=281.4 : NODOM80-116: 89-125 Id=1.000; Q=133.2 : Hs1_Cortactin117-153:126-162 Id=0.946; Q=121.0 : Hs1_Cortactin154-190:163-199 Id=0.973; Q=127.1 : Hs1_Cortactin191-227:200-236 Id=0.973; Q=128.3 : Hs1_Cortactin228-264:237-273 Id=0.973; Q=137.5 : Hs1_Cortactin265-301:274-310 Id=0.892; Q=117.3 : Hs1_Cortactin302-324:311-333 Id=0.957; Q= 69.6 : Hs1_Cortactin325-491:334-504 Id=0.632; Q=386.6 : NODOM492-550:505-563 Id=0.966; Q=226.3 : SH3
>>sp|SRC8_HUMAN Src substrate cortactin (550 aa)>>sp|HCLS1_MOUSE Hematopoiet ln cell-sp (486 aa)44.1% id (1-548:1-485) E(454402): 4.1e-61
1- 79: 1- 78 Id=0.671; Q=213.0 : NODOM80-116: 79-115 Id=0.757; Q= 97.9 : Hs1_Cortactin117-153:116-152 Id=0.703; Q= 94.8 : Hs1_Cortactin154-190:153-189 Id=0.703; Q= 97.3 : Hs1_Cortactin191-213:190-212 Id=0.826; Q= 60.5 : Hs1_Cortactin
214-491:213-428 Id=0.179; Q= 0.0 : NODOM :0492-548:429-485 Id=0.719; Q=173.2 : SH3
Q=-10log(p)Q>30.0->p<0.001
43
Homology, non-homology, and over-extension• Sequences that share statistically significant sequence
similarity are homologous (simplest explanation)• But not all regions of the alignment contribute uniformly to
the score– lower identity/Q-value because of non-homology (over-
extension) ?– lower identity/Q-value because more distant
relationship (domains have different ages) ?• Test by searching with isolated region
– can the distant domain (?) find closer (significant) homologs?
• Similar (homology) or distinct (non-homology) structure is the gold standard
• Multiple sequence alignment can obscure over-extension– if the alignment is over-extended, part of the alignment
is NOT homologous44
Page 23
7/16/16
23
Improving sensitivity withprotein/domain family models
• PSI-BLAST - method1. do BLAST search2. use query-based implied multiple sequence
alignment to build Position Specific Scoring Matrix (PSSM)
3. repeat steps 1 and 2 with PSSM, for 5 – 10 iterations
• PSI-BLAST – results:1. Typically 2X as sensitive as single sequence
methods2. Over-extension can cause PSSM contamination
45
Improving sensitivity withprotein/domain family models
• HMMER3 – jackhmmer – method1. do HMMER (Hidden Markov Model, HMM) search
with single sequence2. use query-HMM-based implied multiple sequence
alignment to more accurate HMM3. repeat steps 1 and 2 with HMM
• HMMER3– results:1. Less over-extension because of probabilistic
alignment2. Used to construct Pfam domain database
• Many protein families are too diverse for one HMM, Pfamdivides families into multiple HMMs and groups in Clans
3. Clearly homologous sequences are still missed
46
Page 24
7/16/16
24
Missing homology beyond the HMM model>>tr|Q8LNM4|Q8LNM4_ORYSJ Eukaryotic aspartyl protease family protein vs>>tr|Q2QSI0|Q2QSI0_ORYSJ Glycosyl hydrolase family 9 protein, expressed OS=O (694 aa)
qRegion: 134-277:172-311 : score=508; bits=240.8; LPr=67.0 : Aspartyl protease
s-w opt: 508 Z-score: 1248.7 bits: 240.8 E(1): 9.6e-68Smith-Waterman score: 508; 62.5% identity (79.2% similar) in 144 aa overlap
130 140 150 160 170 180 190 200
Q8LNM4 TDACKSIPTSNCSSNMCTYEGTINSKLGGHTLGIVATDTFAIGTATASLGFGCVVASGIDTMGGPSGLIGLGRAPSSLVS
::: :.: :: . :. : : : : :::::.::: :.: ::::::: :::: : ::..::::.: :::.Q2QSI0 LCESISNDIHNCSGNVCMYEASTNA---GDTGGKVGTDTFAVGTAKANLAFGCVVASNIDTMDGSSGIVGLGRTPWSLVT
170 180 190 200 210 220 230
210 220 230 240 250 260 270 280Q8LNM4 QMNITKFSYCLTPHDSGKNSRLLLGSSAKLAGGGNSTTTPFVKTSPGDDMSQYYPIQLDGIKAGDAAIALPPSGNTVLVQ
: .. :::::.:::.:::. :.:::.::::::: ...:::: : :.:.: :: .::. .::::: : :::::
Q2QSI0 QTGVAAFSYCLAPHDAGKNNALFLGSTAKLAGGGKTASTPFVNIS-GNDLSNYYKVQLEVLKAGDAMIPLPPSGVLWDNY240 250 260 270 280 290 300 310
Q8LNM4 Q2QSI0
Asp
47
hamB2hamA1a
humM1
humA2ahumD2
dogAd1
dogCCKB
ratCCKAmusEP2
musEP3humTXA2
humMSHhumACTHratPOT
ratCGPCRhumEDG1
ratLHbovOP
ratODORchkP2y
musP2ugpPAFchkGPCR
humRSC
dogRDC1
ratG10dhumfMLFratANG
her pesEC
humIL8bovLCR1
ratRBS11
cmvHH3
cmvHH2
humSSR1
musdeltohumC5aratBK2 humTHR
ratRTA humMRGhumMAS
ratNPYY1ratNK1flyNKflyNPYmusGIR
ratNTR
musTRHmusGnRH
ratVIabovETAmusGRP
ratD1bovH1
hum5HT1a
Pfam misses/mis-alignsproteins distant from the model
• For diverse families, a single model can find, and miss, closely related homologs
• Even if homologs are found, alignments may be short
48
Page 25
7/16/16
25
Homology Fundamentals
• Homologous sequences are unexpectedly similar (excess similarity)– excess compared to ??? – random similarity
(similarity by chance, E()-value)• Non-significant similarity IS NOT evidence for non-
homology– significant similarity to a protein of different structure
shows non-homology• Homology at the (entire) sequence level is
different from homology at the residue level– sequence homology is inferred from statistics– residue homology REQUIRES sequence homology
49
Effective Similarity Searching in Practice
1. Always search protein databases (possibly with translated DNA)
2. Use E()-values, not percent identity, to infer homology – E() < 0.001 is significant in a single search
3. Search smaller (comprehensive) databases4. Change the scoring matrix for:
– short sequences (exons, reads)– short evolutionary distances (mammals, vertebrates, a-
proteobacteria)– high identity (>50% alignments) to reduce over-extension
5. All methods (pairwise, HMM, PSSM) miss homologs, and find homologs the other methods miss
50