Protein stability engineering insights revealed by domain-wide comprehensive mutagenesis Alex Nisthal a,1,2 , Connie Y. Wang b , Marie L. Ary b , and Stephen L. Mayo a,c,1 a Division of Biology and Biological Engineering, California Institute of Technology, Pasadena, CA 91125; b Protabit, LLC, Pasadena, CA 91106; and c Division of Chemistry and Chemical Engineering, California Institute of Technology, Pasadena, CA 91125 Contributed by Stephen L. Mayo, July 3, 2019 (sent for review March 6, 2019; reviewed by Elizabeth M. Meiering and Timothy Whitehead) The accurate prediction of protein stability upon sequence muta- tion is an important but unsolved challenge in protein engineer- ing. Large mutational datasets are required to train computational predictors, but traditional methods for collecting stability data are either low-throughput or measure protein stability indirectly. Here, we develop an automated method to generate thermo- dynamic stability data for nearly every single mutant in a small 56-residue protein. Analysis reveals that most single mutants have a neutral effect on stability, mutational sensitivity is largely governed by residue burial, and unexpectedly, hydrophobics are the best tolerated amino acid type. Correlating the output of various stability-prediction algorithms against our data shows that nearly all perform better on boundary and surface positions than for those in the core and are better at predicting large-to-small mutations than small-to-large ones. We show that the most stable variants in the single-mutant landscape are better identified using combinations of 2 prediction algorithms and including more algo- rithms can provide diminishing returns. In most cases, poor in silico predictions were tied to compositional differences between the data being analyzed and the datasets used to train the algorithm. Finally, we find that strategies to extract stabilities from high- throughput fitness data such as deep mutational scanning are promising and that data produced by these methods may be applicable toward training future stability-prediction tools. thermodynamic stability | mutagenesis | protein engineering | protein stability prediction | protein G T hermodynamic stability is a fundamental property of proteins that significantly influences protein structure, function, ex- pression, and solubility. Efforts to identify the molecular deter- minants of protein stability and to engineer improvements have thus been crucial in the development and optimization of a wide range of biotechnology products, including industrial-grade en- zymes, antibodies, and other protein-based therapeutics and reagents (1–3). The ability to reliably predict the effect of mu- tations on protein stability would greatly facilitate engineering efforts, and much research has been devoted to developing computational tools for this purpose (4–10). Understanding how mutations affect stability can also shed light on various biological processes, including disease and drug resistance (11). Advances in genotyping and next-generation sequencing allow for the identification of significant numbers of missense mutations as- sociated with human disease (12). Fast and accurate protein sta- bility prediction could be used to quickly identify which of these mutations are likely to lead to disease phenotypes. However, the accurate prediction of the impact of an amino acid substitution on protein stability remains an unsolved chal- lenge in protein engineering. Correlation studies have shown that computational techniques can capture general trends, but fail to precisely predict the magnitude of mutational effects (13, 14). The success of these techniques is dependent on the quality of the input structure, conformational sampling, the free-energy function used to evaluate the mutant sequences, and impor- tantly, the data used for training and testing (8, 13, 15). Tradi- tionally, protein stability data are collected by generating and purifying a small set of selected protein variants for character- ization via calorimetry or spectroscopically measured chemical or thermal denaturation experiments. Values typically deter- mined include the chemical or thermal denaturation midpoint (C m or T m , respectively), the free energy of unfolding (ΔG), and the change in ΔG relative to wild type (WT) (ΔΔG). Although low-throughput, the widespread use of these methods has gen- erated a wealth of protein stability data over time, which has shaped our current understanding of protein structure–function relationships (16–19). Much of this work has been aggregated in the ProTherm (20) database, commonly used as a training data resource. Until recently, ProTherm was the largest public source of thermodynamic protein stability data, containing over 25,000 entries from 1,902 scientific articles. The database has been critical to the development of a variety of computational tools, from knowledge-based potentials exclusively trained on experi- mental data (6) to physics-based potentials with atomic resolution (7) and everything in between. Unfortunately, the ProTherm website is no longer being supported. The ProTherm data are still available, however, in ProtaBank (21), a recently developed online database for protein engineering data (https://www.protabank.org/). Although training and validation datasets from ProTherm have been widely used, ProTherm data suffer from 3 flaws: 1) experimental conditions vary widely among entries, requiring manual filtering to obtain comparable data, which results in smaller Significance Using liquid-handling automation, we constructed and mea- sured the thermodynamic stability of almost every single mu- tant of protein G (Gβ1), a small domain. This self-consistent dataset is the largest of its kind and offers unique opportuni- ties on 2 fronts: 1) insight into protein domain properties such as positional sensitivity and incorporated amino acid tolerance, and 2) service as a validation set for future efforts in protein stability prediction. As Gβ1 is a model system for protein folding and design, and its single-mutant landscape has been measured by deep mutational scanning, we expect our dataset to serve as a reference for studies aimed at extracting stability information from fitness data or developing high-throughput stability assays. Author contributions: A.N. and S.L.M. designed research; A.N. performed research; A.N. and C.Y.W. contributed new reagents/analytic tools; A.N., C.Y.W., and M.L.A. analyzed data; and A.N., C.Y.W., M.L.A., and S.L.M. wrote the paper. Reviewers: E.M.M., University of Waterloo; and T.W., University of Colorado Boulder. The authors declare no conflict of interest. Published under the PNAS license. Data deposition: The data reported in this paper have been deposited in Protabank, https://www.protabank.org/ (ID no. gwoS2haU3). 1 To whom correspondence may be addressed. Email: [email protected] or steve@mayo. caltech.edu. 2 Present address: Protein Engineering, Xencor, Inc., Monrovia, CA 91016. This article contains supporting information online at www.pnas.org/lookup/suppl/doi:10. 1073/pnas.1903888116/-/DCSupplemental. Published online August 1, 2019. www.pnas.org/cgi/doi/10.1073/pnas.1903888116 PNAS | August 13, 2019 | vol. 116 | no. 33 | 16367–16377 BIOPHYSICS AND COMPUTATIONAL BIOLOGY Downloaded by guest on February 12, 2022
Transcript
Protein stability engineering insights revealed bydomain-wide comprehensive mutagenesisAlex Nisthala,1,2, Connie Y. Wangb, Marie L. Aryb, and Stephen L. Mayoa,c,1
aDivision of Biology and Biological Engineering, California Institute of Technology, Pasadena, CA 91125; bProtabit, LLC, Pasadena, CA 91106; and cDivisionof Chemistry and Chemical Engineering, California Institute of Technology, Pasadena, CA 91125
Contributed by Stephen L. Mayo, July 3, 2019 (sent for review March 6, 2019; reviewed by Elizabeth M. Meiering and Timothy Whitehead)
The accurate prediction of protein stability upon sequence muta-tion is an important but unsolved challenge in protein engineer-ing. Large mutational datasets are required to train computationalpredictors, but traditional methods for collecting stability dataare either low-throughput or measure protein stability indirectly.Here, we develop an automated method to generate thermo-dynamic stability data for nearly every single mutant in a small56-residue protein. Analysis reveals that most single mutants havea neutral effect on stability, mutational sensitivity is largelygoverned by residue burial, and unexpectedly, hydrophobics arethe best tolerated amino acid type. Correlating the output ofvarious stability-prediction algorithms against our data shows thatnearly all perform better on boundary and surface positions thanfor those in the core and are better at predicting large-to-smallmutations than small-to-large ones. We show that the most stablevariants in the single-mutant landscape are better identified usingcombinations of 2 prediction algorithms and including more algo-rithms can provide diminishing returns. In most cases, poor in silicopredictions were tied to compositional differences between thedata being analyzed and the datasets used to train the algorithm.Finally, we find that strategies to extract stabilities from high-throughput fitness data such as deep mutational scanning arepromising and that data produced by these methods may beapplicable toward training future stability-prediction tools.
thermodynamic stability | mutagenesis | protein engineering | proteinstability prediction | protein G
Thermodynamic stability is a fundamental property of proteinsthat significantly influences protein structure, function, ex-
pression, and solubility. Efforts to identify the molecular deter-minants of protein stability and to engineer improvements havethus been crucial in the development and optimization of a widerange of biotechnology products, including industrial-grade en-zymes, antibodies, and other protein-based therapeutics andreagents (1–3). The ability to reliably predict the effect of mu-tations on protein stability would greatly facilitate engineeringefforts, and much research has been devoted to developingcomputational tools for this purpose (4–10). Understanding howmutations affect stability can also shed light on various biologicalprocesses, including disease and drug resistance (11). Advancesin genotyping and next-generation sequencing allow for theidentification of significant numbers of missense mutations as-sociated with human disease (12). Fast and accurate protein sta-bility prediction could be used to quickly identify which of thesemutations are likely to lead to disease phenotypes.However, the accurate prediction of the impact of an amino
acid substitution on protein stability remains an unsolved chal-lenge in protein engineering. Correlation studies have shownthat computational techniques can capture general trends, butfail to precisely predict the magnitude of mutational effects (13,14). The success of these techniques is dependent on the qualityof the input structure, conformational sampling, the free-energyfunction used to evaluate the mutant sequences, and impor-tantly, the data used for training and testing (8, 13, 15). Tradi-tionally, protein stability data are collected by generating and
purifying a small set of selected protein variants for character-ization via calorimetry or spectroscopically measured chemicalor thermal denaturation experiments. Values typically deter-mined include the chemical or thermal denaturation midpoint(Cm or Tm, respectively), the free energy of unfolding (ΔG), andthe change in ΔG relative to wild type (WT) (ΔΔG). Althoughlow-throughput, the widespread use of these methods has gen-erated a wealth of protein stability data over time, which hasshaped our current understanding of protein structure–functionrelationships (16–19). Much of this work has been aggregated inthe ProTherm (20) database, commonly used as a training dataresource. Until recently, ProTherm was the largest public sourceof thermodynamic protein stability data, containing over 25,000entries from 1,902 scientific articles. The database has beencritical to the development of a variety of computational tools,from knowledge-based potentials exclusively trained on experi-mental data (6) to physics-based potentials with atomic resolution(7) and everything in between. Unfortunately, the ProThermwebsite is no longer being supported. The ProTherm data are stillavailable, however, in ProtaBank (21), a recently developed onlinedatabase for protein engineering data (https://www.protabank.org/).Although training and validation datasets from ProTherm
have been widely used, ProTherm data suffer from 3 flaws: 1)experimental conditions vary widely among entries, requiringmanual filtering to obtain comparable data, which results in smaller
Significance
Using liquid-handling automation, we constructed and mea-sured the thermodynamic stability of almost every single mu-tant of protein G (Gβ1), a small domain. This self-consistentdataset is the largest of its kind and offers unique opportuni-ties on 2 fronts: 1) insight into protein domain properties suchas positional sensitivity and incorporated amino acid tolerance,and 2) service as a validation set for future efforts in proteinstability prediction. As Gβ1 is a model system for proteinfolding and design, and its single-mutant landscape has beenmeasured by deep mutational scanning, we expect our datasetto serve as a reference for studies aimed at extracting stabilityinformation from fitness data or developing high-throughputstability assays.
Author contributions: A.N. and S.L.M. designed research; A.N. performed research; A.N.and C.Y.W. contributed new reagents/analytic tools; A.N., C.Y.W., and M.L.A. analyzeddata; and A.N., C.Y.W., M.L.A., and S.L.M. wrote the paper.
Reviewers: E.M.M., University of Waterloo; and T.W., University of Colorado Boulder.
The authors declare no conflict of interest.
Published under the PNAS license.
Data deposition: The data reported in this paper have been deposited in Protabank,https://www.protabank.org/ (ID no. gwoS2haU3).1To whom correspondence may be addressed. Email: [email protected] or [email protected].
2Present address: Protein Engineering, Xencor, Inc., Monrovia, CA 91016.
This article contains supporting information online at www.pnas.org/lookup/suppl/doi:10.1073/pnas.1903888116/-/DCSupplemental.
datasets; 2) little information is included on unfolded or alterna-tively folded sequences, precluding training on this type of muta-tional data; and 3) results from alanine (Ala) scanning mutagenesisare overrepresented, biasing the dataset toward large-to-smallmutations. Thus, training or testing on ProTherm data may maskdeficiencies in computational algorithms or result in predictionsthat are biased toward particular features of the dataset. As manyof the stability-prediction tools available today rely on experimentaldata from ProTherm, it is perhaps not surprising that none is veryaccurate and all perform about the same (8, 13, 14, 22).Comprehensive mutagenesis studies, with stabilities measured
under fixed experimental conditions, could provide bettertraining data. The low-throughput nature of traditional methods,however, makes the collection of stability data for large numbersof protein variants unfeasible. Several strategies have been devisedto improve this process, including the use of genetic repressorsystems (23), plate-based fluorescence assays (24, 25), differentialscanning fluorimetry (26), and, more recently, yeast-displayedproteolysis (27). Unfortunately, these approaches generally makecompromises by either 1) tying an easy-to-measure but indirectprotein stability readout to large variant libraries, or 2) addressingthe throughput of stability determination, but not the laboriousnature of variant generation and purification.Here, we develop an automated method that addresses both of
these issues and apply it to obtain thermodynamic stability datafrom the comprehensive mutagenesis of an entire protein do-main—the 56-residue β1 domain of streptococcal protein G(Gβ1). Gβ1 was chosen for its small size, high amount of sec-ondary structure, and well-behaved WT sequence. Drawingboth inspiration and methodology from structural genomics, wecouple automated molecular biology procedures with a high-throughput plate-based stability determination method, result-ing in a 20-fold increase in throughput over traditional benchtopmethods. We applied our experimental pipeline to Gβ1 to pro-duce a dataset that maintains constant experimental conditions,includes data on nonfolded sequences, and features an unbiasedmutational distribution over 935 unique variants covering nearlyevery single mutant of Gβ1. Data in hand, we examine positional
sensitivity and amino acid tolerance, and evaluate several proteinstability-prediction algorithms and engineering strategies. Finally,we compare our dataset against one derived by deep mutationalscanning (DMS), a technique that can generate large mutationaldatasets via functional selections and deep sequencing (28, 29), andexplore whether stability data from DMS studies are applicabletoward training future protein stability-prediction tools.
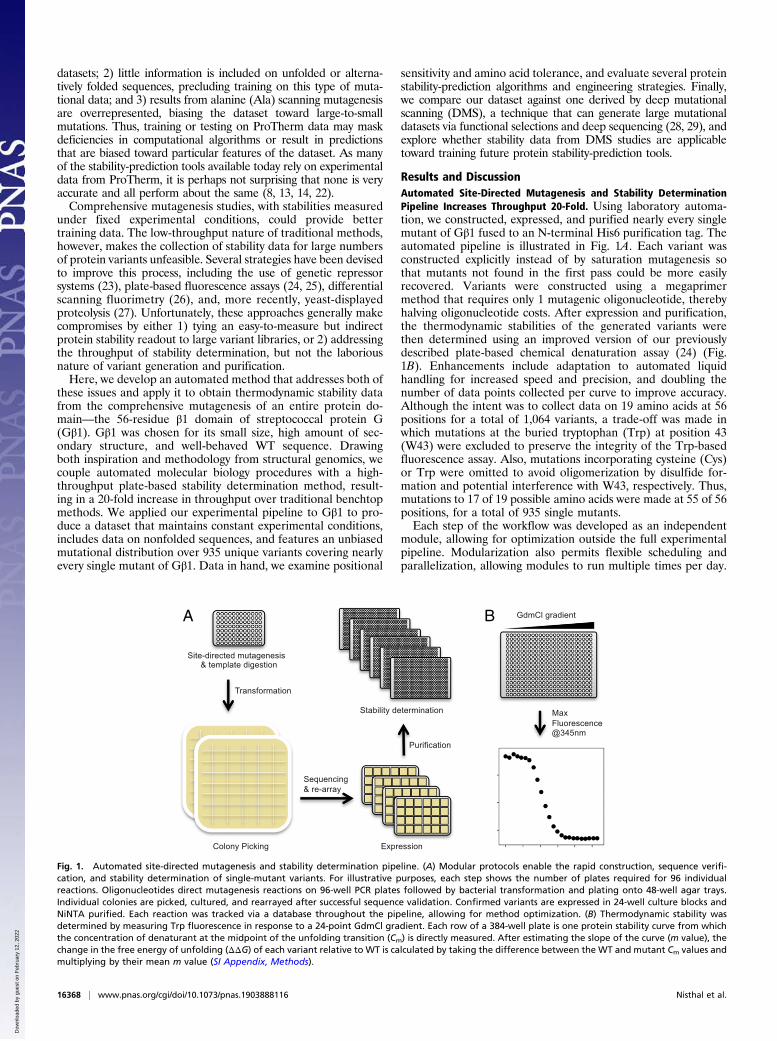
Results and DiscussionAutomated Site-Directed Mutagenesis and Stability DeterminationPipeline Increases Throughput 20-Fold. Using laboratory automa-tion, we constructed, expressed, and purified nearly every singlemutant of Gβ1 fused to an N-terminal His6 purification tag. Theautomated pipeline is illustrated in Fig. 1A. Each variant wasconstructed explicitly instead of by saturation mutagenesis sothat mutants not found in the first pass could be more easilyrecovered. Variants were constructed using a megaprimermethod that requires only 1 mutagenic oligonucleotide, therebyhalving oligonucleotide costs. After expression and purification,the thermodynamic stabilities of the generated variants werethen determined using an improved version of our previouslydescribed plate-based chemical denaturation assay (24) (Fig.1B). Enhancements include adaptation to automated liquidhandling for increased speed and precision, and doubling thenumber of data points collected per curve to improve accuracy.Although the intent was to collect data on 19 amino acids at 56positions for a total of 1,064 variants, a trade-off was made inwhich mutations at the buried tryptophan (Trp) at position 43(W43) were excluded to preserve the integrity of the Trp-basedfluorescence assay. Also, mutations incorporating cysteine (Cys)or Trp were omitted to avoid oligomerization by disulfide for-mation and potential interference with W43, respectively. Thus,mutations to 17 of 19 possible amino acids were made at 55 of 56positions, for a total of 935 single mutants.Each step of the workflow was developed as an independent
module, allowing for optimization outside the full experimentalpipeline. Modularization also permits flexible scheduling andparallelization, allowing modules to run multiple times per day.
A B
Fig. 1. Automated site-directed mutagenesis and stability determination pipeline. (A) Modular protocols enable the rapid construction, sequence verifi-cation, and stability determination of single-mutant variants. For illustrative purposes, each step shows the number of plates required for 96 individualreactions. Oligonucleotides direct mutagenesis reactions on 96-well PCR plates followed by bacterial transformation and plating onto 48-well agar trays.Individual colonies are picked, cultured, and rearrayed after successful sequence validation. Confirmed variants are expressed in 24-well culture blocks andNiNTA purified. Each reaction was tracked via a database throughout the pipeline, allowing for method optimization. (B) Thermodynamic stability wasdetermined by measuring Trp fluorescence in response to a 24-point GdmCl gradient. Each row of a 384-well plate is one protein stability curve from whichthe concentration of denaturant at the midpoint of the unfolding transition (Cm) is directly measured. After estimating the slope of the curve (m value), thechange in the free energy of unfolding (ΔΔG) of each variant relative to WT is calculated by taking the difference between the WT and mutant Cm values andmultiplying by their mean m value (SI Appendix, Methods).
16368 | www.pnas.org/cgi/doi/10.1073/pnas.1903888116 Nisthal et al.
For comparison, 8 d is a reasonable estimate for traditionalprocedures to construct, verify, express, purify, and measure thethermodynamic stability of 8 single mutants. Extrapolating to 935variants (the number in this study), traditional procedures wouldtake 935 d, or 2.5 y. In contrast, our platform can generate dataon 935 variants in 5 to 6 wk, a speedup of at least 20-fold.
Stability Determination of Gβ1 Single Mutants. We measured theTrp fluorescence of each variant in response to a 24-pointguanidinium chloride (GdmCl) gradient 2 to 6 times as biologicalreplicates. Each denaturation experiment generates an unfoldingcurve (Fig. 1B) from which we determined the concentration ofdenaturant at the midpoint of the unfolding transition (Cm), theΔG(H2O), and the slope (m value) using the linear extrapolationmethod (30, 31). While ΔΔG can be calculated in multiple ways(SI Appendix, Methods), we prefer the method that takes thedifference between the mutant and WT Cm values and multipliesit by their mean m value ð �mÞ (32) as shown in the followingequation:
ΔΔG= �m× ðCm mutant −Cm WTÞ,
where the individual mutant and WT m values are obtained bythe linear extrapolation method. This method was selected be-cause it is more precise yet in excellent agreement with themethod that takes the difference between ΔG(H2O) estimatesfor WT Gβ1 and each mutant protein (SI Appendix, Fig. S1).Using this equation, stabilizing mutations have positive ΔΔGvalues, and destabilizing mutations have negative values. Ofthe 935 variants analyzed, 105 failed the assumptions of thelinear extrapolation method (reversibility of folding/unfoldingand 2-state behavior) due to poor stability, presence of a foldingintermediate, or no expression (SI Appendix, Fig. S2). The 830variants that passed these criteria are referred to as the quanti-tative dataset, and the remaining 105 are referred to as thequalitative dataset. We observed minimal effects of the N-terminal His6 purification tag on Gβ1 stability, reflected by thestrong correlation (r = 0.95; P < 0.001) between literature valuesof untagged Gβ1 variants and corresponding values from ourdataset (SI Appendix, Fig. S3). The single-mutant stabilities(ΔΔGs) for the entire dataset (33) are shown as a heat mapin Fig. 2.
Stability Distribution of Gβ1 Single Mutants Is Primarily Neutral. TheΔΔG distribution of Gβ1 single mutants is primarily neutral(ΔΔG of 0 ± 1 kcal/mol) with a long tail of destabilizing variants(Fig. 3A). The median of the quantitative dataset is 0.05 kcal/molwith an interquartile range of 1.0 kcal/mol (Fig. 3C), and thefraction of positive, neutral, and negative mutations is 3%, 68%,and 29%, respectively. If we assume the qualitative data containsonly negative mutations, then our complete dataset shifts thefractions to 3%, 60%, and 37%, respectively. Summing thepositive and neutral mutations, almost two-thirds of the testedsingle mutants (63%) have at worst no effect on Gβ1 stability.The fraction of destabilizing mutations (37%) is on the low endcompared with an experimental dataset of 1,285 mutants fromProTherm, which shows that ∼50% of single mutants aredestabilizing (ΔΔG < 1 kcal/mol) (34, 35). The destabilizingfraction we obtained for Gβ1 would likely increase, however,upon making mutations to W43 and including Trp and Cysscanning variants as these residues are generally difficult tosubstitute in or out (36). Also, the Gβ1 domain itself may skewmutational outcomes as its small size results in a large surface-to-buried area ratio. This ratio likely contributes to fewer destabi-lizing mutations than larger proteins with larger cores, assumingthat most core mutations are destabilizing (17, 23, 37, 38).
Fig. 2. Single-mutant thermodynamic stability landscape of Gβ1. The ver-tical axis of the mutational matrix depicts the primary structure of Gβ1, withthe position and WT amino acid as indicated. Core positions as determinedby RESCLASS (4) are boxed. The horizontal axis depicts mutant amino acidsexamined in the study, grouped by amino acid type. Variants from thequantitative dataset are colored by their determined ΔΔG value where red isdestabilizing, blue is stabilizing, and white is neutral. Self-identity mutationssuch as M1M have ΔΔG = 0 and thus are colored white. Variants from thequalitative dataset are colored based on whether a folding intermediate wasdetected (purple) or whether the mutant did not express, was unfolded, orwas too destabilized to collect a quantitative measurement (black) (SI Ap-pendix, Fig. S2).
Nisthal et al. PNAS | August 13, 2019 | vol. 116 | no. 33 | 16369
Positional Sensitivity Is Governed by Residue Burial. The heat map inFig. 2, which is organized by primary structure, allows for agranular look at the distribution of mutational stability. We ob-serve 2 clear trends: 1) the mutational sensitivity (ΔΔG) of thedomain is largely determined by the position of the mutation, notthe amino acid identity, unless 2) the mutations are to glycine(Gly) or proline (Pro), for which most mutations are deleterious.Positions 3, 5, 26, 30, 41, 45, 52, and 54 are particularly sensitiveto mutation. If we map the positional sensitivity (median ΔΔG ateach position) onto the Gβ1 structure (Fig. 4), we see that residuesin the interior of the protein are more susceptible to destabilization.This is also observed when analyzing the distribution by tertiarystructure, but not by secondary structure (Fig. 3C). That is, classi-fying residues into core, boundary, or surface with the RESCLASSalgorithm (4) shows that the median ΔΔG for core residues is ∼1.5kcal/mol lower than that of the rest of the protein. In addition, thequalitative dataset, which contains mutants whose stabilities aredifficult to measure or are fully unfolded, includes 5-fold more corevariants than boundary or surface positions, adding further supportto this observation (Fig. 3B). Although this relationship has beenobserved with other datasets using a variety of proxies for proteinstability (17, 23, 37, 38), this study provides a comprehensiveanalysis at the whole domain level with direct thermodynamicstability measurements.As seen in Fig. 2, however, not all core positions behave the
same, as some are more sensitive to mutation than others. Forengineering purposes, it would be useful to identify specific
protein attributes that could serve as quantitative predictors ofpositional sensitivity. We therefore performed linear regressionwith 10-fold cross-validation on a large number of attributes thatmight impact protein stability. Attributes tested included mea-sures of residue burial, secondary structure type/propensity,structural flexibility, and the change upon mutation of residuedescriptors such as hydrophobicity, volume, and charge. The bestindividual predictors were measures of residue burial: depth ofthe Cβ atom (39, 40) and occluded surface packing (OSP) (41,42), with Pearson correlation coefficients (r) of 0.82 and 0.76,respectively (both Ps < 0.001). This demonstrates that not allcore positions are created equal, and that there is a direct re-lationship between how buried a position is and its sensitivityto mutation. Flexibility descriptors such as root-mean-squaredfluctuations (RMSFs) (from molecular dynamics simulations)or secondary structure descriptors such as α-helix propensityperformed less well (r = 0.42 and 0.06, respectively). We re-peated these analyses with sequence entropy (43) as an alter-native metric of positional sensitivity, and the conclusions remainthe same; Cβ depth and OSP were the 2 best predictors, with r =0.81 and 0.78, respectively (both Ps < 0.001). Combinations ofattributes were also tested, but these did not substantially im-prove predictability. Given the strong correlation between posi-tional sensitivity and residue burial indicators like OSP and Cβdepth, calculation of these measures should be among the firsttools employed when evaluating positions for substitution, pro-vided structural information is available.
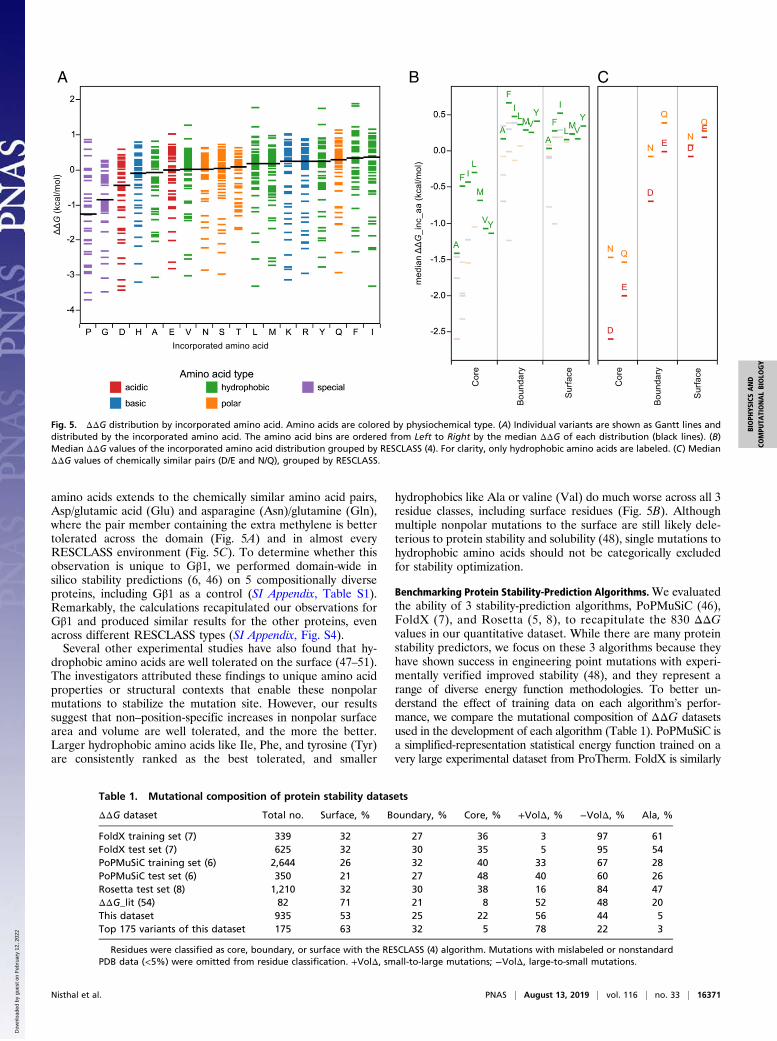
Hydrophobics Are the Best Tolerated Amino Acid Type. A commonpractice in protein redesign and optimization is to restrict coreresidues to nonpolar amino acids and only allow polar aminoacids at the surface. We tested the validity of this strategy withour quantitative dataset by calculating median ΔΔG by in-corporated amino acid and ranking the amino acids from worsttolerated to best tolerated across the entire domain (Fig. 5A). Ingeneral, the 2 worst amino acids for incorporation are Proand Gly, which is not surprising given their vastly differentRamachandran preferences compared with all other amino acids.Beyond secondary structure-breaking amino acids, the thirdworst tolerated amino acid, interestingly, is aspartic acid (Asp),which may be rationalized by the fact that it is very hydrophilic(44) and has one of the highest charge densities among theamino acids (45). Unexpectedly, hydrophobic amino acids, par-ticularly isoleucine (Ile) and phenylalanine (Phe), are among thebest tolerated residues across all Gβ1 positions. Even amongsurface positions, which make up over 50% of the dataset, Ile isthe most favored individual residue, and hydrophobic aminoacids as a whole are favored equally or better than the otheramino acid types (Fig. 5B). The preference for hydrophobic
A
C
B
Fig. 3. Stability distribution of Gβ1 single mutants. (A and B) The 935-member dataset is split between variants with quantitative data (gray)and those with only qualitative data (red) due to poor stability or misfolding.(A) The ΔΔG distribution is split into 0.25 kcal/mol bins. Variants belongingto the qualitative dataset are shown to the Left of the distribution, in-dicating values of ΔΔG less than −4 kcal/mol. (B) Variants are binned intocore, boundary, or surface using RESCLASS (4). (C) Box-and-whisker plots ofthe quantitative dataset describe the median, the quartile cutoffs, and theoutlier cutoffs of the ΔΔG distribution for all of the residues (All), binnedinto secondary structure classifications as defined by DSSP (63), or binned byRESCLASS. Outliers are shown as unfilled circles and are defined as pointsthat are 1.5× interquartile range above or below the third quartile or firstquartile, respectively.
Fig. 4. Positional sensitivity (median ΔΔG at each position) of Gβ1. Gβ1X-ray crystal structure (PDB ID: 1PGA) is colored by the positional sensitivityat each position. Side-chain atoms are shown for residues with a positionalsensitivity score less than zero (destabilized).
16370 | www.pnas.org/cgi/doi/10.1073/pnas.1903888116 Nisthal et al.
amino acids extends to the chemically similar amino acid pairs,Asp/glutamic acid (Glu) and asparagine (Asn)/glutamine (Gln),where the pair member containing the extra methylene is bettertolerated across the domain (Fig. 5A) and in almost everyRESCLASS environment (Fig. 5C). To determine whether thisobservation is unique to Gβ1, we performed domain-wide insilico stability predictions (6, 46) on 5 compositionally diverseproteins, including Gβ1 as a control (SI Appendix, Table S1).Remarkably, the calculations recapitulated our observations forGβ1 and produced similar results for the other proteins, evenacross different RESCLASS types (SI Appendix, Fig. S4).Several other experimental studies have also found that hy-
drophobic amino acids are well tolerated on the surface (47–51).The investigators attributed these findings to unique amino acidproperties or structural contexts that enable these nonpolarmutations to stabilize the mutation site. However, our resultssuggest that non–position-specific increases in nonpolar surfacearea and volume are well tolerated, and the more the better.Larger hydrophobic amino acids like Ile, Phe, and tyrosine (Tyr)are consistently ranked as the best tolerated, and smaller
hydrophobics like Ala or valine (Val) do much worse across all 3residue classes, including surface residues (Fig. 5B). Althoughmultiple nonpolar mutations to the surface are still likely dele-terious to protein stability and solubility (48), single mutations tohydrophobic amino acids should not be categorically excludedfor stability optimization.
Benchmarking Protein Stability-Prediction Algorithms.We evaluatedthe ability of 3 stability-prediction algorithms, PoPMuSiC (46),FoldX (7), and Rosetta (5, 8), to recapitulate the 830 ΔΔGvalues in our quantitative dataset. While there are many proteinstability predictors, we focus on these 3 algorithms because theyhave shown success in engineering point mutations with experi-mentally verified improved stability (48), and they represent arange of diverse energy function methodologies. To better un-derstand the effect of training data on each algorithm’s perfor-mance, we compare the mutational composition of ΔΔG datasetsused in the development of each algorithm (Table 1). PoPMuSiC isa simplified-representation statistical energy function trained on avery large experimental dataset from ProTherm. FoldX is similarly
A B C
Fig. 5. ΔΔG distribution by incorporated amino acid. Amino acids are colored by physiochemical type. (A) Individual variants are shown as Gantt lines anddistributed by the incorporated amino acid. The amino acid bins are ordered from Left to Right by the median ΔΔG of each distribution (black lines). (B)Median ΔΔG values of the incorporated amino acid distribution grouped by RESCLASS (4). For clarity, only hydrophobic amino acids are labeled. (C) MedianΔΔG values of chemically similar pairs (D/E and N/Q), grouped by RESCLASS.
Table 1. Mutational composition of protein stability datasets
ΔΔG dataset Total no. Surface, % Boundary, % Core, % +VolΔ, % −VolΔ, % Ala, %
FoldX training set (7) 339 32 27 36 3 97 61FoldX test set (7) 625 32 30 35 5 95 54PoPMuSiC training set (6) 2,644 26 32 40 33 67 28PoPMuSiC test set (6) 350 21 27 48 40 60 26Rosetta test set (8) 1,210 32 30 38 16 84 47ΔΔG_lit (54) 82 71 21 8 52 48 20This dataset 935 53 25 22 56 44 5Top 175 variants of this dataset 175 63 32 5 78 22 3
Residues were classified as core, boundary, or surface with the RESCLASS (4) algorithm. Mutations with mislabeled or nonstandardPDB data (<5%) were omitted from residue classification. +VolΔ, small-to-large mutations; −VolΔ, large-to-small mutations.
Nisthal et al. PNAS | August 13, 2019 | vol. 116 | no. 33 | 16371
trained, albeit with a smaller and more Ala-biased dataset, andmixes all-atom physical potentials with weighted statistical terms.Rosetta also mixes statistical and all-atom physical potentials,but is trained to recover native sequence compositions for pro-tein design. A recent study systematically explored the effect of19 different Rosetta parameter sets on single-mutant stabilityprediction (8), 4 of which are evaluated here. Three of the testedparameter sets use identical weights and terms but allow in-creasing amounts of backbone flexibility. That is, after side-chainrepacking, the structure either undergoes no energy minimization,constrained backbone minimization, or unconstrained backboneminimization. Initially described as row 3, row 16, and row 19 (8),we refer to these parameter sets here as NoMin, SomeMin, andFullMin, respectively. The fourth Rosetta parameter set evaluatedhere (SomeMin_ddg) combines constrained minimization withoptimized amino acid reference energies trained on single-mutantΔΔG data from ProTherm, similar to FoldX and PoPMuSiC.Pearson correlation coefficients were used to evaluate algorithmperformance overall (all mutations) as well as performance basedon tertiary structure (RESCLASS) and volume change (Table 2).As energies from physical potentials can be dramatically skewed byatomic clashes, we excluded mutations with exceptionally high clashenergies (clash outliers, see SI Appendix, Table S3). As might beexpected, clash outliers typically occur in core positions wherevolume is increased upon substitution. All correlations here havevalues of P < 0.001 except for those in the core, as detailedin Table 2.The Rosetta SomeMin method is the best-performing algo-
rithm overall with a Pearson correlation coefficient of 0.64. Theother methods perform less well at r = 0.56 (PoPMuSiC) and r =0.51 (FoldX). All of the algorithms scored lower on our datasetthan previously reported on independent test sets, where r valuesof 0.69 (Rosetta SomeMin) (8), 0.67 (PopMuSiC) (46), and 0.64(FoldX) (7) were obtained. Comparing the different Rosettamethods, we observe that increasing backbone flexibility de-creases the number of clash outliers, but does not necessarilyimprove overall performance. The constrained minimization inSomeMin considerably improves the correlation over NoMin,but unconstrained minimization in FullMin shows diminishingreturns in allowing increased flexibility, as observed previously(8). Notably, the Rosetta SomeMin_ddg method performedworse than the SomeMin method (r = 0.54 and 0.64, respec-tively), demonstrating a limitation of training all-atom potentialswith small, biased experimental datasets (Table 1).If we look at the Pearson correlation coefficient by residue
class, we find a general performance trend of boundary >
surface > core. Except for Rosetta NoMin, which performspoorly across all categories, the all-atom algorithms exhibit verystrong correlations in the boundary (r ∼ 0.7), with weaker cor-relations on the surface (r ∼ 0.5). This performance bump couldbe explained by the presence of explicitly modeled electrostaticand hydrogen bonding interactions between protein atoms in theboundary, whereas at the surface, all interactions with solvent(water) become aggregated and averaged out due to the natureof the algorithms. In contrast, PoPMuSiC likely performs moresimilarly across these 2 residue classes (r = 0.56 and r = 0.51,respectively) due to several terms in the statistical function thatare weighted by surface accessibility. All algorithms do a poorjob at predicting core mutations (r values range from 0.13 to0.37), possibly because these mutations are more likely to lead tostructural rearrangements that are not well captured by the algo-rithms (6–8). The observed differences in correlation accuracy byresidue class likely do not stem from differences in training data, asall 3 algorithms were trained on datasets that have very similarfractions of surface, boundary, and core residues (Table 1).The data were also analyzed by mutations that either reduce
side-chain volume (large to small, −VolΔ) or increase side-chainvolume (small to large, +VolΔ). Overall, across all methods,large-to-small mutations are better predicted than the inverse,which correlates with the composition of the training sets used inalgorithm development (Table 1).All algorithms were also evaluated by the Spearman correla-
tion coefficient to minimize penalties on skewed energies andinstead reward correct rank ordering. The differences found withthe Pearson method on the overall dataset are no longer ob-served (SI Appendix, Table S2). PoPMuSiC and all of the Rosettamethods perform about the same, with FoldX performing lesswell. However, the performance trend between residue classes isretained with boundary > surface > core, and the performanceedge for large-to-small mutations is widened when evaluated bythe Spearman coefficient. Because mutations that remove sub-stantial volume often create a destabilizing cavity (52), the di-rection of the stability change of large-to-small mutations is moreeasily predicted and indeed captured by all of the algorithmsequally well. The small-to-large mutation type can have very dif-ferent outcomes (stabilized backbone accommodation or under-packed/overpacked destabilization) and thus is harder to rank,much less predict accurately, as observed here. The trend in thevolume change data subset demonstrates why stability predictorsoften feature favorable correlation coefficients on their test sets,which nearly always contain a bias toward mutations to smallamino acids like Ala, as observed in Table 1.
Table 2. Algorithm performance by Pearson correlation
Predicted ΔΔGs from stability algorithms were compared with experimental ΔΔG values for Gβ1 single mutants in the quantitative dataset. Mutations withexceptionally high clash energies (clash outliers) were excluded when calculating correlation coefficients. Number of mutations is shown in parentheses.+VolΔ, small-to-large mutations; −VolΔ, large-to-small mutations. #P < 0.001; jjP = 0.07; **P = 0.193; ††P = 0.099; and ‡‡P = 0.005.*Level of backbone minimization after repacking for Rosetta methods.†Number of mutations with a calculated repulsive energy >2 SDs above the mean.‡Residues are classified as core, boundary, or surface using RESCLASS (4).§Rosetta parameter sets NoMin, SomeMin, and FullMin were initially described as row 3, row 16, and row 19, respectively (8).{Combines constrained backbone minimization with optimized reference energies trained on ProTherm single-mutant ΔΔG data.
16372 | www.pnas.org/cgi/doi/10.1073/pnas.1903888116 Nisthal et al.
Practical Stability Engineering with In Silico Methods. As shownabove and previously (13), highly accurate stability prediction(r > 0.8) is beyond current algorithms. However, this limitationhas not prevented the successful application of in silico tools tostabilize proteins and engineer protein interaction specificity(53). One common approach is to 1) generate stability predic-tions for every single mutant of a domain, 2) filter the stabilitypredictions by an arbitrary ΔΔG(predicted) cutoff, 3) experi-mentally verify the small number of mutants above the cutoff,and 4) combine the hits. Here, our objective is to identify the insilico method that best performs this task on our Gβ1 dataset.That is, determine which algorithm recovers the greater numberof stable variants (i.e., hits) near the top of its own predictedsingle-mutant list. We do this by calculating a couple of metricsacross the 2 sorted lists of experimental and predicted variants,and, starting from the most stable variant, sequentially increasethe number of mutants (N) that are compared. The first metric,percent enrichment (%E), records the percent overlap betweena list of experimentally verified mutants and a list of in silicopredictions:
%EðNÞ=ωðNÞN
,
where ω (N) is the number of mutants found in both the exper-imental and predicted lists when N mutants are compared. Thesecond metric, positive predictive value (PPV), first classifies ourexperimental dataset into “good” variants with ΔΔG > 0 and“bad” variants with ΔΔG ≤ 0, and then uses receiver operatingcharacteristic (ROC) methods to calculate the fraction of truepositives out of all positive predictions,
PPV ðNÞ= TPðNÞTPðNÞ+FPðNÞ,
where TP(N) is the number of true positives when comparinglists of N mutations and FP(N) is the number of false positiveswhen comparing lists of N mutations. Although both methodsfocus on positive predictions, %E is more sensitive to how sta-bility algorithms order their comprehensive single-mutant pre-dictions, whereas PPV will give a favorable score as long as themutants predicted are classified as “good” (ΔΔG > 0).Values of %E and PPV as a function of the number of mutants
(N) in the comparison, or %E(N) and PPV(N), were calculatedfor FoldX, PoPMuSiC, and the 4 Rosetta methods. All combi-nations of the in silico methods were also tested by taking themean of the predictions and then calculating %E(N) andPPV(N) as before. Focusing on the top 175 variants, whichcorrespond to ΔΔG > 0.5, we observe that the output values ingeneral improve as the number of compared variants is increased(Fig. 6 and SI Appendix, Fig. S5). This result is expected, astesting more variants will increase the chances of identifyinguseful mutations. Both metrics indicate that Rosetta NoMin as asingle algorithm returns the highest number of stabilizing mu-tations over the majority of variant cutoffs. Upon limiting N tothe top 20 variants, the Rosetta methods with backbone flexi-bility outperform Rosetta NoMin. This result advocates for do-ing more computational modeling when experimental bandwidthis limiting. When considering combinations of 2 algorithms overthe top 175 variants, the best performers are PoPMuSiC with anyRosetta protocol except SomeMin_ddg. These combinationshave a higher %E(N) and PPV(N) than any single or combina-tion of 2 algorithms when measuring the area under the curve(AUC) (SI Appendix, Fig. S6). Related work corroborates thisresult, showing that combinations of FoldX with other algorithmsoutperform FoldX alone in predicting the best single mutants(48, 53). However, no 3-algorithm combinations significantly
outperform the best 2-algorithm combinations, indicating dimin-ishing returns upon adding more algorithms, or at least the algo-rithms tested here.When benchmarked against our unbiased experimental data,
FoldX alone performed poorly regardless of the value of theΔΔG cutoff, but especially in the top 20 predicted variants (Fig.6 and SI Appendix, Fig. S5). Combining FoldX with RosettaNoMin showed no improvement in AUC over Rosetta NoMinalone (SI Appendix, Fig. S6), demonstrating that combinationsare sensitive to the quality of the input algorithms. Thus, it isperhaps not surprising that any 3-algorithm combination involvingFoldX failed to improve performance over the 2-algorithm com-binations. Similarly, the Rosetta SomeMin_ddg method laggedbehind the other Rosetta-based methods as a single algorithm andin all higher combinations (SI Appendix, Fig. S6). As FoldX andRosetta SomeMin_ddg are both all-atom potentials trained onsingle-mutant data, we surmised that their respective trainingdatasets were influencing their performance, as also shown bythe correlative metrics. Indeed, the top 175 variants of the Gβ1single-mutant landscape are enriched 3-fold in small-to-largemutations, a mutation class that is vastly underrepresented inthe training sets for FoldX and Rosetta SomeMin_ddg (Table 1).
Comparing with DMS Studies. By coupling high-throughput func-tional selections with next generation sequencing, DMS canprovide mutational data on thousands or even millions of vari-ants with relatively little experimental effort (28, 29). Thistechnology is being applied to an increasing number of proteinsand has the potential to supply a wealth of new data to trainstability-prediction tools (28), provided the DMS technique canbe properly validated. Serendipitously, a DMS study was per-formed on every single mutant and nearly every double mutantof Gβ1 (54), allowing for a direct comparison with the thermo-dynamic stability data presented here. Using a selection based on
A
B
Fig. 6. Comparing stability-prediction algorithms by positive predictivevalue, PPV. (A) PPV(N), as defined in the text, is plotted as a function of thenumber of variants included in the list comparison. Only the top 175 Gβ1single mutants are shown, sorted by ΔΔG. Each of the single algorithms and,for simplicity, only the best 2-algorithm combination (PoPMuSiC+RosettaNoMin) are shown, colored according to the legend. (B) As a reference,experimental ΔΔG values are plotted as a function of the ranked variantindex, a sorted list of the experimentally derived stability distribution.
Nisthal et al. PNAS | August 13, 2019 | vol. 116 | no. 33 | 16373
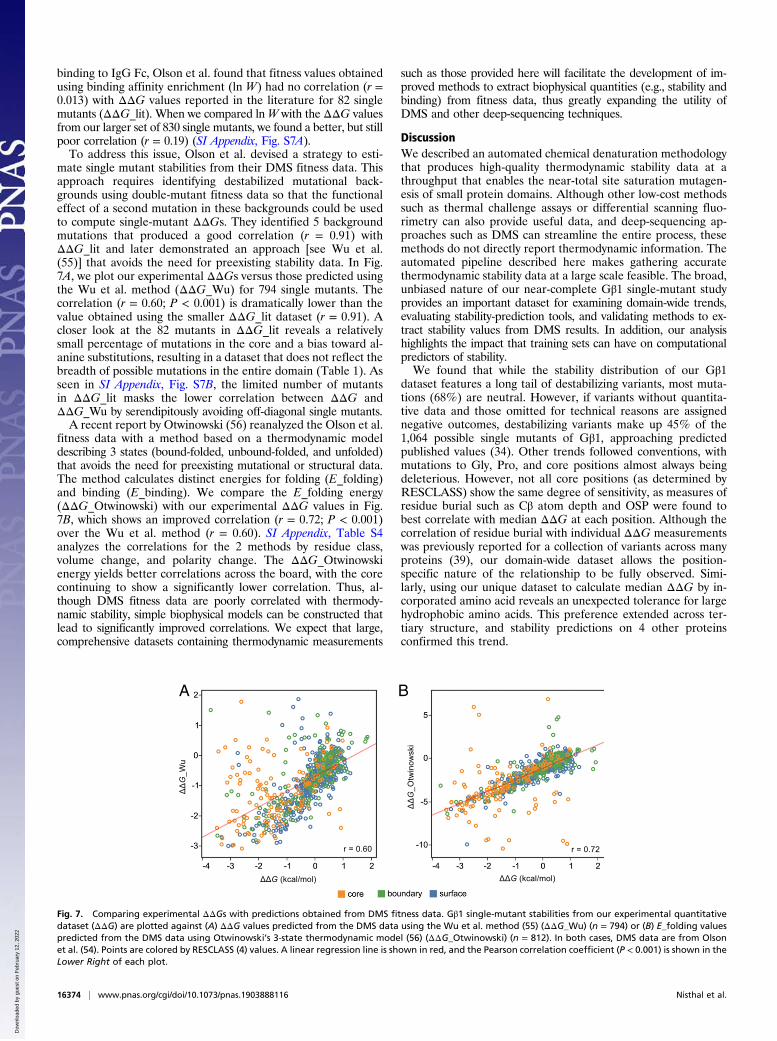
binding to IgG Fc, Olson et al. found that fitness values obtainedusing binding affinity enrichment (ln W) had no correlation (r =0.013) with ΔΔG values reported in the literature for 82 singlemutants (ΔΔG_lit). When we compared lnW with the ΔΔG valuesfrom our larger set of 830 single mutants, we found a better, but stillpoor correlation (r = 0.19) (SI Appendix, Fig. S7A).To address this issue, Olson et al. devised a strategy to esti-
mate single mutant stabilities from their DMS fitness data. Thisapproach requires identifying destabilized mutational back-grounds using double-mutant fitness data so that the functionaleffect of a second mutation in these backgrounds could be usedto compute single-mutant ΔΔGs. They identified 5 backgroundmutations that produced a good correlation (r = 0.91) withΔΔG_lit and later demonstrated an approach [see Wu et al.(55)] that avoids the need for preexisting stability data. In Fig.7A, we plot our experimental ΔΔGs versus those predicted usingthe Wu et al. method (ΔΔG_Wu) for 794 single mutants. Thecorrelation (r = 0.60; P < 0.001) is dramatically lower than thevalue obtained using the smaller ΔΔG_lit dataset (r = 0.91). Acloser look at the 82 mutants in ΔΔG_lit reveals a relativelysmall percentage of mutations in the core and a bias toward al-anine substitutions, resulting in a dataset that does not reflect thebreadth of possible mutations in the entire domain (Table 1). Asseen in SI Appendix, Fig. S7B, the limited number of mutantsin ΔΔG_lit masks the lower correlation between ΔΔG andΔΔG_Wu by serendipitously avoiding off-diagonal single mutants.A recent report by Otwinowski (56) reanalyzed the Olson et al.
fitness data with a method based on a thermodynamic modeldescribing 3 states (bound-folded, unbound-folded, and unfolded)that avoids the need for preexisting mutational or structural data.The method calculates distinct energies for folding (E_folding)and binding (E_binding). We compare the E_folding energy(ΔΔG_Otwinowski) with our experimental ΔΔG values in Fig.7B, which shows an improved correlation (r = 0.72; P < 0.001)over the Wu et al. method (r = 0.60). SI Appendix, Table S4analyzes the correlations for the 2 methods by residue class,volume change, and polarity change. The ΔΔG_Otwinowskienergy yields better correlations across the board, with the corecontinuing to show a significantly lower correlation. Thus, al-though DMS fitness data are poorly correlated with thermody-namic stability, simple biophysical models can be constructed thatlead to significantly improved correlations. We expect that large,comprehensive datasets containing thermodynamic measurements
such as those provided here will facilitate the development of im-proved methods to extract biophysical quantities (e.g., stability andbinding) from fitness data, thus greatly expanding the utility ofDMS and other deep-sequencing techniques.
DiscussionWe described an automated chemical denaturation methodologythat produces high-quality thermodynamic stability data at athroughput that enables the near-total site saturation mutagen-esis of small protein domains. Although other low-cost methodssuch as thermal challenge assays or differential scanning fluo-rimetry can also provide useful data, and deep-sequencing ap-proaches such as DMS can streamline the entire process, thesemethods do not directly report thermodynamic information. Theautomated pipeline described here makes gathering accuratethermodynamic stability data at a large scale feasible. The broad,unbiased nature of our near-complete Gβ1 single-mutant studyprovides an important dataset for examining domain-wide trends,evaluating stability-prediction tools, and validating methods to ex-tract stability values from DMS results. In addition, our analysishighlights the impact that training sets can have on computationalpredictors of stability.We found that while the stability distribution of our Gβ1
dataset features a long tail of destabilizing variants, most muta-tions (68%) are neutral. However, if variants without quantita-tive data and those omitted for technical reasons are assignednegative outcomes, destabilizing variants make up 45% of the1,064 possible single mutants of Gβ1, approaching predictedpublished values (34). Other trends followed conventions, withmutations to Gly, Pro, and core positions almost always beingdeleterious. However, not all core positions (as determined byRESCLASS) show the same degree of sensitivity, as measures ofresidue burial such as Cβ atom depth and OSP were found tobest correlate with median ΔΔG at each position. Although thecorrelation of residue burial with individual ΔΔG measurementswas previously reported for a collection of variants across manyproteins (39), our domain-wide dataset allows the position-specific nature of the relationship to be fully observed. Simi-larly, using our unique dataset to calculate median ΔΔG by in-corporated amino acid reveals an unexpected tolerance for largehydrophobic amino acids. This preference extended across ter-tiary structure, and stability predictions on 4 other proteinsconfirmed this trend.
A B
Fig. 7. Comparing experimental ΔΔGs with predictions obtained from DMS fitness data. Gβ1 single-mutant stabilities from our experimental quantitativedataset (ΔΔG) are plotted against (A) ΔΔG values predicted from the DMS data using the Wu et al. method (55) (ΔΔG_Wu) (n = 794) or (B) E_folding valuespredicted from the DMS data using Otwinowski’s 3-state thermodynamic model (56) (ΔΔG_Otwinowski) (n = 812). In both cases, DMS data are from Olsonet al. (54). Points are colored by RESCLASS (4) values. A linear regression line is shown in red, and the Pearson correlation coefficient (P < 0.001) is shown in theLower Right of each plot.
16374 | www.pnas.org/cgi/doi/10.1073/pnas.1903888116 Nisthal et al.
Evaluating 3 stability-prediction algorithms against our data-set, we found that all performed moderately and recapitulatedthe general trends of the data. The flexible backbone Rosettamethod (SomeMin) provided the best overall Pearson correla-tion (r = 0.64), but all of the Rosetta methods and PoPMuSiCperformed equally by the Spearman rank correlation coefficient.Except for PoPMuSiC, all methods showed higher correlations inthe boundary than on the surface (r = ∼0.7 and ∼0.5, re-spectively), all showed consistently lower correlations for muta-tions at core positions (r = 0.13 to 0.37), and nearly all werebetter at predicting large-to-small mutations than small-to-large ones.Overall, the Rosetta SomeMin method was the most accurate
stability algorithm tested here. It gives the best Pearson corre-lation for nearly every mutational category and is near the top innonparametric methods as well. However, Rosetta SomeMinand, to a greater extent, Rosetta FullMin require the most com-putational resources. For lower computational cost, PoPMuSiCprovides the next best correlation coefficients on our quantita-tive dataset. For identification of the most stable single mutants,the combination of PoPMuSiC and Rosetta NoMin gave the bestoverall performance, and their excellent individual computa-tional efficiencies should only increase their popularity. Thiscombination was at or near the top in each of the metrics tested,yielding enrichment values over 30% and PPVs over 90% afteranalyzing the predicted top 175 variants.DMS holds great promise as an extremely high-throughput
method for obtaining mutational data for entire protein do-mains. However, correlating the fitness data to thermodynamicquantities such as stability is not straightforward, given that theselection method provides only an indirect measure of stability.In comparing our ΔΔG values against strategies designed toextract stabilities from high-throughput fitness data, we find thata simple thermodynamic model that distinguishes binding andfolding energies results in a Pearson correlation coefficient of r =0.7. Even higher correlations are achieved by omitting corevariants, and this strategy could yield useful training sets in thenear term.Beyond the engineering insights described here, it is our hope
that our single-mutant dataset of thermodynamic stabilities willprove to be a powerful validation set for use in developing betterstability-prediction tools and better methods for deriving stabil-ities from high-throughput fitness data.
Materials and MethodsLiquid Handling Robotics. Automation of the experimental pipeline wasimplemented as described previously (57). A 2-m Freedom EVO (Tecan)liquid-handling robot featuring an 8-channel fixed-tip liquid-handling arm,a 96 disposable-tip single-channel liquid-handling arm, and a robotic plate-gripping arm was used to automate the majority of the experimentalpipeline. The robot’s deck features a fast-wash module, a refrigeratedmicroplate carrier, a microplate orbital shaker, a SPE vacuum system, anintegrated PTC-200 PCR machine (Bio-Rad Laboratories), stacks and hotelsfor microplates, and an integrated Infinite M1000 fluorescence microplatereader (Tecan). All automated molecular biology methods were developedde novo and optimized as necessary.
Site-Directed Mutagenesis. Variants were generated as described previously(57). The Gβ1 gene, with an N-terminal His6 tag, was inserted into pET11aunder control of an IPTG-inducible T7 promoter. Mutagenic oligonucleotideswere ordered from Integrated DNA Technologies in a 96-well format(150 μM concentration, 25-nmol scale) and purified by standard desalting.The site-directed mutagenesis reaction was performed in 2 parts: 1) dilutedmutagenic oligonucleotides were mixed with a master mix solution com-posed of Hot-start Phusion DNA polymerase (NEB), GC Phusion buffer,dNTPs, the plasmid template, and the nonmutagenic flanking oligonucleo-tide, followed by 2) mixing 1/4 of the first step product with a similar mastermix solution that omits the flanking oligonucleotide. After mutagenesis,samples were mixed into an 8%-by-volume Dpn1 (NEB) digestion reaction(37 °C, 1 h) to remove the parental template plasmid.
During development, reactions were diagnosed by E-Gel 96 (Invitrogen)electrophoresis systems, with loading performed by the liquid-handling ro-bot. Visualization of the desired first-step and second-step products wouldguarantee positive mutagenesis. Almost 85% of all site-directed mutagenesisreactions were successful in the first pass.
Bacterial Manipulation and Sequence Verification. The protocol for sequenceverification was performed as described previously (57). Dpn1-digestedproducts were mixed with chemically competent BL21 Gold DE3 cells (58)in a 20-μL total reaction volume, and incubated at 4 °C for 10 min. After heatshock (42 °C, 45 s) on the PCR machine, the bacterial transformations wererecovered by adding 100 μL of SOC media and shaken off robot at 1,200 rpmfor 1 h at 37 °C on a microplate shaker (Heidolph).
The transformation mixtures were plated by the liquid-handling robotonto 48-well lysogeny broth (LB) agar Qtrays (Genetix) and spread by sterilebeads (58). The Qtrays were incubated off robot for 14 h at 37 °C. For eachmutagenesis reaction, 8 colonies were picked by a colony-picking robot(Qbot; Genetix) into 384-well receiving plates (Genetix) filled with LB/10%glycerol. The 384-well receiving plates were incubated overnight at 37 °C,after which 2 of the 8 cultures per mutagenesis reaction were used to in-oculate 96-well microplates containing LB/10% glycerol. These 96-wellglycerol stock plates were grown overnight at 37 °C, replicated, and sentto Beckman Genomics for sequencing.
Following construction, work lists were generated for the liquid-handlingrobot to cherry-pick from the replicated 96-well glycerol stock plates andinoculate into 96-well master stock plates containing LB/10% glycerol. Themaster stock plates were then incubatedovernight at 37 °C and frozen at−80 °Cuntil needed.
Protein Expression and Purification. Protein expression and purification wereperformed as described previously (57). Small volumes from replicatedmaster stock plates were used to inoculate 5 mL of Instant TB auto-inductionmedia (Novagen) in 24-well round-bottom plates (Whatman). The 24-wellplates were incubated overnight, shaking at 250 rpm, at 37 °C. The expres-sion cultures were then pelleted and lysed with a sodium phosphate buffer(pH 8) containing CelLytic B (Sigma-Aldrich), lysozyme, and HC benzonase(Sigma-Aldrich). Lysates were then added directly to 96-well His-Select Ni-NTA resin filter plates (Sigma-Aldrich) and processed off-robot by centrifu-gation. His-tagged protein was washed and eluted in sodium phosphatebuffer (pH 8) containing 0 and 100 mM imidazole, respectively. Proteinsamples were diluted 5-fold into sodium phosphate buffer (pH 6.5), therebydiluting the final amount of imidazole in each sample before stabilitydetermination.
Plate-Based Stability Assay. Protein stability determination was performed asdescribed previously (57). Large volumes (0.2 L) of each concentration of a24-point gradient of GdmCl in sodium phosphate buffer (pH 6.5) wereconstructed and dispensed into 96-well deep-well plates by a multichannelpipettor. These reagent reservoirs, along with the 96-channel head on theliquid-handling robot, greatly simplified and sped up a previously describedplate-based stability assay (24). Each stability assay was composed of 24 in-dividual solutions containing 1 part purified protein to 4 parts GdmCl/buffersolution, and measured by the integrated plate reader for Trp fluorescence(excitation, 295 nm; emission, 341 nm). Six 384-well UV-Star plates (Greiner)were used for 1 replicate of each 96-well master stock plate. All variantswere measured 2 to 6 times. Data were analyzed as described previously(24). See SI Appendix, Methods for a discussion on ΔΔG calculationmethodology.
Positional Sensitivity. Positional sensitivity was evaluated via 2 metrics: (i) themedian ΔΔG value and (ii) sequence entropy. The median ΔΔG value foreach position (j) was calculated by finding the median of ΔΔG values for allmutations measured at j, where mutations in the qualitative dataset wereassigned a ΔΔG value of −4 kcal/mol. The sequence entropy at a position j
was calculated as sðjÞ =−P20
i=1pðjÞi lnpðjÞ
i where pðjÞi , the probability of a given
amino acid i at position j, was determined by pi =eΔΔGi=kT=P20
i=1eΔΔGi=kT . The
WT residue was assigned a ΔΔG value of zero and mutations in the quali-tative dataset were assigned a value of −4 kcal/mol. The positional sensitivityat each position was visualized on the crystal structure of Gβ1 (PDB ID: 1PGA)using VMD (59).
Protein Attributes. All structure-based attributes were calculated using thecrystal structure of Gβ1 (PDB ID: 1PGA). OSP (42) was calculated usingsoftware downloaded from http://pages.jh.edu/pfleming/sw/os/. RMSF
Nisthal et al. PNAS | August 13, 2019 | vol. 116 | no. 33 | 16375
was calculated over a 20-ns molecular-dynamics trajectory in full solventusing NAMD (60). The depth of the Cβ atom was calculated by the RESCLASSalgorithm (4) to decide core, boundary, and surface residues. Linear re-gression with 10-fold cross-validation was performed with scikit-learn (61) toidentify attributes that correlate highly with positional sensitivity. Recursivefeature elimination was also performed with scikit-learn using a ridge esti-mator, and 5-fold cross-validation was performed to evaluate combinationsof attributes. Recursive feature elimination was also performed with scikit-learn to evaluate combinations of attributes.
Stability-Prediction Algorithms. The crystal structure of Gβ1 (PDB ID: 1PGA) wasused as the input structure for all algorithms. The webserver for PoPMuSiC,version 3, located at http://www.dezyme.com, was used to perform a“Systematic” command on the Gβ1 crystal structure. A copy of FoldX (Ver-sion 3.0, beta 5) was retrieved from http://foldxsuite.crg.eu/. The crystalstructure was prepared by using the “RepairPDB” command to perform Asn,Gln, and His flips, alleviate small van der Waals clashes, and optimize WTrotamer packing. Every mutant in the dataset was constructed through the“BuildModel” command, and the difference in energy between the WTreference and the corresponding mutant was averaged over 5 trials. A copyof Rosetta (version 3.3) was retrieved from https://www.rosettacommons.org/.The ddg_monomer application was used to generate single-mutant stability
data from the Gβ1 crystal structure. We followed the available onlinedocumentation to prepare all necessary input files. Option sets described inthe documentation pertain to the various Rosetta iterations tested in thispaper (NoMin, low-resolution protocol; SomeMin, high-resolution protocol;FullMin, high-resolution protocol with an empty distance restraints file).
Statistical Visualization and Analysis. All plots were generated using Tableau.Custom Python scripts were developed to calculate the large number ofthermodynamic stability curve fits. Correlation coefficients (Pearson’s andSpearman’s) were calculated either in Tableau or in the software package R(version 3.2.2). The ROCR package for R was used for classification and ROCanalysis (62).
Data Availability. The ΔΔG distribution of Gβ1 single mutants generatedduring this work is publicly available in ProtaBank (https://www.protabank.org/),a protein engineering data repository, under the ID gwoS2haU3.
ACKNOWLEDGMENTS. A.N. thanks Jost Vielmetter for advice and feedbackon the automated platform. S.L.M. acknowledges grants from the NationalSecurity Science and Engineering Faculty Fellowship program and the DefenseAdvanced Research Projects Agency Protein Design Processes program.
1. A. S. Bommarius, M. F. Paye, Stabilizing biocatalysts. Chem. Soc. Rev. 42, 6534–6565(2013).
2. A. Goldenzweig, S. J. Fleishman, Principles of protein stability and their application incomputational design. Annu. Rev. Biochem. 87, 105–129 (2018).
3. R. Rouet, D. Lowe, D. Christ, Stability engineering of the human antibody repertoire.FEBS Lett. 588, 269–277 (2014).
4. B. I. Dahiyat, S. L. Mayo, De novo protein design: Fully automated sequence selection.Science 278, 82–87 (1997).
5. R. Das, D. Baker, Macromolecular modeling with Rosetta. Annu. Rev. Biochem. 77,363–382 (2008).
6. Y. Dehouck et al., Fast and accurate predictions of protein stability changes uponmutations using statistical potentials and neural networks: PoPMuSiC-2.0. Bio-informatics 25, 2537–2543 (2009).
7. R. Guerois, J. E. Nielsen, L. Serrano, Predicting changes in the stability of proteins andprotein complexes: A study of more than 1000 mutations. J. Mol. Biol. 320, 369–387(2002).
8. E. H. Kellogg, A. Leaver-Fay, D. Baker, Role of conformational sampling in computingmutation-induced changes in protein structure and stability. Proteins 79, 830–838(2011).
9. S. M. Malakauskas, S. L. Mayo, Design, structure and stability of a hyperthermophilicprotein variant. Nat. Struct. Biol. 5, 470–475 (1998).
10. F. Zheng, G. Grigoryan, Sequence statistics of tertiary structural motifs reflect proteinstability. PLoS One 12, e0178272 (2017).
11. D. E. V. Pires, J. Chen, T. L. Blundell, D. B. Ascher, In silico functional dissection ofsaturation mutagenesis: Interpreting the relationship between phenotypes andchanges in protein stability, interactions and activity. Sci. Rep. 6, 19848 (2016).
12. D. J. Burgess, Disease genetics: Network effects of disease mutations. Nat. Rev. Genet.16, 317 (2015).
13. V. Potapov, M. Cohen, G. Schreiber, Assessing computational methods for predictingprotein stability upon mutation: Good on average but not in the details. Protein Eng.Des. Sel. 22, 553–560 (2009).
14. S. Khan, M. Vihinen, Performance of protein stability predictors. Hum. Mutat. 31,675–684 (2010).
15. J. A. Davey, R. A. Chica, Optimization of rotamers prior to template minimizationimproves stability predictions made by computational protein design. Protein Sci. 24,545–560 (2015).
16. T. Alber, Mutational effects on protein stability. Annu. Rev. Biochem. 58, 765–798(1989).
17. J. U. Bowie, J. F. Reidhaar-Olson, W. A. Lim, R. T. Sauer, Deciphering the message inprotein sequences: Tolerance to amino acid substitutions. Science 247, 1306–1310(1990).
18. B. W. Matthews, Structural and genetic analysis of protein stability. Annu. Rev. Bio-chem. 62, 139–160 (1993).
19. A. R. Fersht, L. Serrano, Principles of protein stability derived from protein engi-neering experiments. Curr. Opin. Struct. Biol. 3, 75–83 (1993).
20. M. D. S. Kumar et al., ProTherm and ProNIT: Thermodynamic databases for proteinsand protein-nucleic acid interactions. Nucleic Acids Res. 34, D204–D206 (2006).
21. C. Y. Wang et al., ProtaBank: A repository for protein design and engineering data.Protein Sci. 27, 1113–1124 (2018).
22. T. J. Magliery, Protein stability: Computation, sequence statistics, and new experi-mental methods. Curr. Opin. Struct. Biol. 33, 161–168 (2015).
23. P. Markiewicz, L. G. Kleina, C. Cruz, S. Ehret, J. H. Miller, Genetic studies of the lacrepressor. XIV. Analysis of 4000 altered Escherichia coli lac repressors reveals essentialand non-essential residues, as well as “spacers” which do not require a specific se-quence. J. Mol. Biol. 240, 421–433 (1994).
24. B. D. Allen, A. Nisthal, S. L. Mayo, Experimental library screening demonstrates thesuccessful application of computational protein design to large structural ensembles.Proc. Natl. Acad. Sci. U.S.A. 107, 19838–19843 (2010).
25. J. P. Aucamp, A. M. Cosme, G. J. Lye, P. A. Dalby, High-throughput measurement ofprotein stability in microtiter plates. Biotechnol. Bioeng. 89, 599–607 (2005).
26. J. J. Lavinder, S. B. Hari, B. J. Sullivan, T. J. Magliery, High-throughput thermal scan-ning: A general, rapid dye-binding thermal shift screen for protein engineering.J. Am. Chem. Soc. 131, 3794–3795 (2009).
27. G. J. Rocklin et al., Global analysis of protein folding using massively parallel design,synthesis, and testing. Science 357, 168–175 (2017).
28. C. L. Araya, D. M. Fowler, Deep mutational scanning: Assessing protein function on amassive scale. Trends Biotechnol. 29, 435–442 (2011).
29. D. M. Fowler, S. Fields, Deep mutational scanning: A new style of protein science. Nat.Methods 11, 801–807 (2014).
30. C. N. Pace, Determination and analysis of urea and guanidine hydrochloride de-naturation curves. Methods Enzymol. 131, 266–280 (1986).
31. M. M. Santoro, D. W. Bolen, Unfolding free energy changes determined by the linearextrapolation method. 1. Unfolding of phenylmethanesulfonyl alpha-chymotrypsinusing different denaturants. Biochemistry 27, 8063–8068 (1988).
32. J. K. Myers, C. N. Pace, J. M. Scholtz, Denaturant m values and heat capacity changes:Relation to changes in accessible surface areas of protein unfolding. Protein Sci. 4,2138–2148 (1995).
33. A. Nisthal, Protein stability engineering insights revealed by domain-wide comprehensivemutagenesis. Protabank. https://www.protabank.org/study_analysis/gwoS2haU3/.Deposited 9 October, 2018.
34. N. Tokuriki, F. Stricher, J. Schymkowitz, L. Serrano, D. S. Tawfik, The stability effects ofprotein mutations appear to be universally distributed. J. Mol. Biol. 369, 1318–1332(2007).
35. N. Tokuriki, D. S. Tawfik, Stability effects of mutations and protein evolvability. Curr.Opin. Struct. Biol. 19, 596–604 (2009).
36. S. Henikoff, J. G. Henikoff, Amino acid substitution matrices from protein blocks.Proc. Natl. Acad. Sci. U.S.A. 89, 10915–10919 (1992).
37. W. Huang, J. Petrosino, M. Hirsch, P. S. Shenkin, T. Palzkill, Amino acid sequencedeterminants of beta-lactamase structure and activity. J. Mol. Biol. 258, 688–703(1996).
38. D. Rennell, S. E. Bouvier, L. W. Hardy, A. R. Poteete, Systematic mutation of bacte-riophage T4 lysozyme. J. Mol. Biol. 222, 67–88 (1991).
39. S. Chakravarty, R. Varadarajan, Residue depth: A novel parameter for the analysis ofprotein structure and stability. Structure 7, 723–732 (1999).
40. K. P. Tan, T. B. Nguyen, S. Patel, R. Varadarajan, M. S. Madhusudhan, Depth: A webserver to compute depth, cavity sizes, detect potential small-molecule ligand-bindingcavities and predict the pKa of ionizable residues in proteins. Nucleic Acids Res. 41,W314–W321 (2013).
41. N. Pattabiraman, K. B. Ward, P. J. Fleming, Occluded molecular surface: Analysis ofprotein packing. J. Mol. Recognit. 8, 334–344 (1995).
42. P. J. Fleming, F. M. Richards, Protein packing: Dependence on protein size, secondarystructure and amino acid composition. J. Mol. Biol. 299, 487–498 (2000).
43. W. S. J. Valdar, Scoring residue conservation. Proteins 48, 227–241 (2002).44. J. Kyte, R. F. Doolittle, A simple method for displaying the hydropathic character of a
protein. J. Mol. Biol. 157, 105–132 (1982).45. D. A. Dixon, W. N. Lipscomb, Electronic structure and bonding of the amino acids
containing first row atoms. J. Biol. Chem. 251, 5992–6000 (1976).46. Y. Dehouck, J. M. Kwasigroch, D. Gilis, M. Rooman, PoPMuSiC 2.1: A web server for
the estimation of protein stability changes upon mutation and sequence optimality.BMC Bioinformatics 12, 151 (2011).
47. S. Ayuso-Tejedor, O. Abián, J. Sancho, Underexposed polar residues and proteinstabilization. Protein Eng. Des. Sel. 24, 171–177 (2011).
48. A. Broom, Z. Jacobi, K. Trainor, E. M. Meiering, Computational tools help improveprotein stability but with a solubility tradeoff. J. Biol. Chem. 292, 14349–14361 (2017).
49. M. H. Cordes, R. T. Sauer, Tolerance of a protein to multiple polar-to-hydrophobicsurface substitutions. Protein Sci. 8, 318–325 (1999).
16376 | www.pnas.org/cgi/doi/10.1073/pnas.1903888116 Nisthal et al.
50. M. Machius, N. Declerck, R. Huber, G. Wiegand, Kinetic stabilization of Bacilluslicheniformis alpha-amylase through introduction of hydrophobic residues at thesurface. J. Biol. Chem. 278, 11546–11553 (2003).
51. D. Poso, R. B. Sessions, M. Lorch, A. R. Clarke, Progressive stabilization of intermediateand transition states in protein folding reactions by introducing surface hydrophobicresidues. J. Biol. Chem. 275, 35723–35726 (2000).
52. W. A. Baase, L. Liu, D. E. Tronrud, B. W. Matthews, Lessons from the lysozyme ofphage T4. Protein Sci. 19, 631–641 (2010).
53. O. Buß, J. Rudat, K. Ochsenreither, FoldX as protein engineering tool: Better thanrandom based approaches? Comput. Struct. Biotechnol. J. 16, 25–33 (2018).
54. C. A. Olson, N. C. Wu, R. Sun, A comprehensive biophysical description of pairwiseepistasis throughout an entire protein domain. Curr. Biol. 24, 2643–2651 (2014).
55. N. C. Wu, C. A. Olson, R. Sun, High-throughput identification of protein mutant stabilitycomputed from a double mutant fitness landscape. Protein Sci. 25, 530–539 (2016).
56. J. Otwinowski, Biophysical inference of epistasis and the effects of mutations onprotein stability and function. arXiv:1802.08744v2 (30 March 2018).
57. A. Nisthal, “Accelerating the interplay between theory and experiment in protein
design,” PhD thesis, California Institute of Technology, Pasadena, CA (2012).58. H. E. Klock, S. A. Lesley, The Polymerase Incomplete Primer Extension (PIPE) method
applied to high-throughput cloning and site-directed mutagenesis. Methods Mol.
Biol. 498, 91–103 (2009).59. W. Humphrey, A. Dalke, K. Schulten, VMD: Visual molecular dynamics. J. Mol. Graph.
14, 33–38, 27–28 (1996).60. J. C. Phillips et al., Scalable molecular dynamics with NAMD. J. Comput. Chem. 26,
1781–1802 (2005).61. F. Pedregosa, G. Varoquaux, A. Gramfort, V. Michel, B. Thirion, Scikit-learn: Machine
learning in Python. J. Mach. Learn. Res. 12, 2825–2830 (2011).62. T. Sing, O. Sander, N. Beerenwinkel, T. Lengauer, ROCR: Visualizing classifier per-
formance in R. Bioinformatics 21, 3940–3941 (2005).63. W. Kabsch, C. Sander, Dictionary of protein secondary structure: Pattern recognition
of hydrogen-bonded and geometrical features. Biopolymers 22, 2577–2637 (1983).
Nisthal et al. PNAS | August 13, 2019 | vol. 116 | no. 33 | 16377


![Increasing DNS Security and Stability through a Control ... Control... · The Domain Name System (DNS) [RFC1034] replaced this mechanism to provide domain name to IP address mappings](https://static.documents.pub/doc/80x56/5f04afca7e708231d40f3450/increasing-dns-security-and-stability-through-a-control-control-the-domain.jpg)


![Numerical Simulation of Dynamic Systems: Hw6 - Solution · Numerical Simulation of Dynamic Systems: Hw6 - Solution Homework 6 - Solution Stability Domain of GE4/AB3 [H5.3] Stability](https://static.documents.pub/doc/80x56/5e7953eef8d4e561644ac325/numerical-simulation-of-dynamic-systems-hw6-solution-numerical-simulation-of.jpg)


