+ All Categories
Home > Documents > Proton Exchange Membrane Electrolyzer Emulator for Power ...

Proton Exchange Membrane Electrolyzer Emulator for Power ...

Date post: 25-Feb-2022
Category:
Upload: others
View: 11 times
Download: 0 times
Share this document with a friend
26
HAL Id: hal-03165051 https://hal.univ-lorraine.fr/hal-03165051 Submitted on 10 Mar 2021 HAL is a multi-disciplinary open access archive for the deposit and dissemination of sci- entific research documents, whether they are pub- lished or not. The documents may come from teaching and research institutions in France or abroad, or from public or private research centers. L’archive ouverte pluridisciplinaire HAL, est destinée au dépôt et à la diffusion de documents scientifiques de niveau recherche, publiés ou non, émanant des établissements d’enseignement et de recherche français ou étrangers, des laboratoires publics ou privés. Proton Exchange Membrane Electrolyzer Emulator for Power Electronics Testing Applications Burin Yodwong, Damien Guilbert, Melika Hinaje, Matheepot Phattanasak, Wattana Kaewmanee, Gianpaolo Vitale To cite this version: Burin Yodwong, Damien Guilbert, Melika Hinaje, Matheepot Phattanasak, Wattana Kaewmanee, et al.. Proton Exchange Membrane Electrolyzer Emulator for Power Electronics Testing Applications. Processes, MDPI, 2021, 9 (3), pp.498. 10.3390/pr9030498. hal-03165051
Transcript

HAL Id: hal-03165051https://hal.univ-lorraine.fr/hal-03165051

Submitted on 10 Mar 2021

HAL is a multi-disciplinary open accessarchive for the deposit and dissemination of sci-entific research documents, whether they are pub-lished or not. The documents may come fromteaching and research institutions in France orabroad, or from public or private research centers.

L’archive ouverte pluridisciplinaire HAL, estdestinée au dépôt et à la diffusion de documentsscientifiques de niveau recherche, publiés ou non,émanant des établissements d’enseignement et derecherche français ou étrangers, des laboratoirespublics ou privés.

Proton Exchange Membrane Electrolyzer Emulator forPower Electronics Testing Applications

Burin Yodwong, Damien Guilbert, Melika Hinaje, Matheepot Phattanasak,Wattana Kaewmanee, Gianpaolo Vitale

To cite this version:Burin Yodwong, Damien Guilbert, Melika Hinaje, Matheepot Phattanasak, Wattana Kaewmanee, etal.. Proton Exchange Membrane Electrolyzer Emulator for Power Electronics Testing Applications.Processes, MDPI, 2021, 9 (3), pp.498. 10.3390/pr9030498. hal-03165051

Processes 2021, 9, 498. https://doi.org/10.3390/pr9030498 www.mdpi.com/journal/processes

Article

Proton Exchange Membrane Electrolyzer Emulator for Power

Electronics Testing Applications

Burin Yodwong 1,2, Damien Guilbert 1, Melika Hinaje 1, Matheepot Phattanasak 2, Wattana Kaewmanee 2 and

Gianpaolo Vitale 3,*

1 Group of Research in Electrical Engineering of Nancy (GREEN), Université de Lorraine,

F‐54400 Nancy, France; burin.yodwong@univ‐lorraine.fr (B.Y.); damien.guilbert@univ‐lorraine.fr (D.G.);

melika.hinaje@univ‐lorraine.fr (M.H.) 2 Department of Teacher Training in Electrical Engineering, Faculty of Technical Education, King Mongkut’s

University of Technology North Bangkok (KMUTNB), Bangkok 10800, Thailand;

[email protected] (M.P.); [email protected] (W.K.) 3 ICAR, Institute for High Performance Computing and Networking, National Research Council of Italy,

90146 Palermo, Italy

* Correspondence: [email protected]

Abstract: This article aims to develop a proton exchange membrane (PEM) electrolyzer emulator.

This emulator is realized through an equivalent electrical scheme. It allows taking into consideration

the dynamic operation of PEM electrolyzers, which is generally neglected in the literature. PEM

electrolyzer dynamics are reproduced by the use of supercapacitors, due to the high value of the

equivalent double‐layer capacitance value. Steady‐state and dynamics operations are investigated

in this work. The design criteria are addressed. The PEM electrolyzer emulator is validated by using

a 400‐W commercial PEM electrolyzer. This emulator is conceived to test new DC‐DC converters to

supply the PEM ELs and their control as well, avoiding the risk to damage a real electrolyzer for

experiment purposes. The proposed approach is valid both for a single cell and for the whole stack

emulation.

Keywords: PEM electrolyzer; emulator; steady‐state operation; dynamic operation;

power electronics

1. Introduction

Over the last decade, hydrogen production through water electrolysis has gained a

growing interest to overcome the environmental issues with the use of fossil fuels (e.g.,

natural gas reforming), and many research projects dealing with hydrogen have been pro‐

posed [1,2]. The water electrolysis process is carried out by an electrolyzer (EL). The EL is

an electrochemical device using electricity to split pure water into oxygen and hydrogen.

Currently, ELs can be ranged in size from small, appliance‐size equipment (fit from small‐

scale distributed hydrogen production to large‐scale), and central production facilities

which could be supplied by renewable energy sources (RES) [2]. In any case, the commer‐

cially available size of ELs depends on their technology. Indeed, the two main available

EL technologies in the market are alkaline, and proton exchange membrane (PEM) [3,4].

On one hand, the first technology is the most mature and widespread since it has been

used since the mid‐1960s. The main advantages are cheap catalysts, high lifetime, and gas

purities [4]. However, it suffers from operating at low current densities, limiting its de‐

velopment in emerging markets of great potential. From the flexibility point of view, al‐

kaline ELs are not suitable in the load‐following operation required by coupling them

with RES [5,6]. At present, several megawatt ELs are deployed in the industry for large‐

scale hydrogen production [5].

Citation: Yodwong, B.; Guilbert, D.;

Hinaje, M.; Phattanasak, M.;

Kaewmanee, W.; Vitale, G. Proton

Exchange Membrane Electrolyzer

Emulator for Power Electronics

Testing Applications. Processes 2021,

9, 498. https://doi.org/10.3390/

pr9030498

Academic Editors: Giosue Giacoppo

and Bruno Auvity

Received: 1 February 2021

Accepted: 7 March 2021

Published: 10 March 2021

Publisher’s Note: MDPI stays neu‐

tral with regard to jurisdictional

claims in published maps and insti‐

tutional affiliations.

Copyright: © 2021 by the authors. Li‐

censee MDPI, Basel, Switzerland.

This article is an open access article

distributed under the terms and con‐

ditions of the Creative Commons At‐

tribution (CC BY) license (http://crea‐

tivecommons.org/licenses/by/4.0/).

Processes 2021, 9, 498 2 of 25

In comparison, PEM technology has been developed since the 1960s to overcome the

above‐mentioned issues to alkaline technology [3,7]. Indeed, this technology can operate

at high current densities (around 2 A.cm−2) and offers high flexibility when coupling with

RES; which are considered as very dynamic sources. As a result, during dynamic opera‐

tions, PEM ELs can capture the energy from RES [6,8]. In this work, PEM technology is

considered based on its main advantages.

The main drawback of PEM ELs is mainly related to their high cost since expensive

catalyst materials (e.g., iridium, and platinum) are used both at the anode and the cathode

[3]. It represents a restriction especially for research purposes dealing with supply systems

for EL. To cope with this important issue, this work is mainly focused on the realization

of a PEM EL emulator to be used for experimental objectives. An emulator of an electrical

system, considered as a dipole, is an equivalent system in which voltage and current be‐

have as in the real source such an experimental facility allows to carry out measurements

and tests as with the real one. It can be employed for different purposes such as a test tool

for new DC‐DC converters and their control without using a real EL, which may be dam‐

aged during experiments. The proposed emulator has been designed to reproduce the

dynamics of the electrolyzer under various operating conditions with a low cost equiva‐

lent circuit.

In recent years, research on hydrogen technologies has intensified to meet challeng‐

ing issues and to make easier their large‐scale dissemination and integration for different

applications (transportation, energy storage, power‐to‐gas, and industry) [9–12]. For fuel

cell (FC) applications, intensive research has been carried out for control and fault recon‐

struction purposes such as the enhancement of the maximum FC net power through a

sliding mode variable structure control [13], the observation of the system states based on

a second‐order sliding mode observer [14], the minimization of the hydrogen consump‐

tion through a state machine control applied to an FC/supercapacitor hybrid tramway

[15], and the optimization of the FC net power and the decrease of oxygen starvation

through a model‐based robust control [16]. In these works, a real‐time FC emulation sys‐

tem has been employed to validate the developed control strategies.

Moreover, in the literature, many PEM FCs emulators have been developed over the

last decade [17–21] for different purposes such as assessing the performance of DC‐DC

converters including their control and energy management strategies in DC microgrid.

This demonstrates that the development of FC emulators is an important topic for the

integration of these hydrogen devices in electric vehicles and distributed power genera‐

tion systems. It should be underlined that the emulation of an FC remains challenging due

to the parameters to be considered such as the air‐feed subsystem, the hydrogen supply

subsystem, the humidify subsystem, and the cooling subsystem; it has encouraged re‐

searchers to develop emulators. Compared to PEM FCs, the development of PEM EL em‐

ulators has not gained a lot of attention from researchers since this topic is not representa‐

tive in the literature. Indeed, a few PEM EL emulators have been reported [22,23]. In

[22,23], the authors have developed a power electronics‐based power‐hardware‐in‐loop

emulator. The main difference between both works is the use of the DC‐DC converter

(either boost converter [22] or buck converter [23]). In both reported works, only static

operations of the PEM ELs are considered with the emulator; whereas dynamic operations

are crucial when dealing with RES. In addition, both emulators reported are based on two

stages: the power electronics stage and the control stage. Firstly, the power electronics

stage includes the DC power supply and the DC‐DC converter (power switch, inductor,

and capacitor). Secondly, the control stage combines the measurement sensors (current

and voltage at the input of the emulator), driver boards to drive the DC‐DC converter,

and control prototyping systems to implement the control laws to ensure the performance

of the EL emulator. Both needed stages make the development of EL emulators challeng‐

ing and expensive due to the use of many components and devices. In any case, to repro‐

duce the EL dynamics, it is necessary a reference model in which the response is not in‐

stantaneous but varying according to the dynamics of the EL one wants to emulate. For

Processes 2021, 9, 498 3 of 25

this reason, even if the EL can be considered as a load from the supply, the use of pro‐

grammable power load does not allow the correct reproduction of transients unless a dy‐

namic reference model is adopted. Based on this observation, the objective of this work is

to design and realize a “physical” PEM EL emulator based on an equivalent electrical cir‐

cuit developed in previous work [24], minimizing consequently the number of compo‐

nents and devices. The main contribution consists of the use of a linear circuit reproducing

the physical model of the EL. The proposed circuit is tested as a load of the EL’s supply

since the dissipated power can be easily managed. However, the same circuit can deliver

the current reference for a given voltage to be used in a programmable load; since it is an

expensive solution suitable only for high power, this approach has not been considered.

Another advantage of our approach is the absence of parasitic high‐frequency signals due

to switching elements. Considering that the supply is given by switching converters, it

has the advantage to avoid mutual interference with the production of sub‐harmonics that

are not present in the real system.

The effectiveness of analyzing the transfer function of a power converter loaded by a

dynamic equivalent circuit of an electrolyzer has been demonstrated in [25], whereby

comparing the transfer function of a stack converter with a simple resistive model and

with a dynamic model with constant parameters a different behavior affecting the stability

has been retrieved. Since in practical operation, the electrolyzer shows a dynamic behav‐

ior, it justifies designing the emulator proposed in this paper.

Furthermore, the developed PEM EL emulator takes into consideration dynamic op‐

erations that bring a novelty compared to the current state‐of‐the‐art [22,23]. Dynamic op‐

erations occur when coupling with RES. Since one of the key issues for PEM EL systems

is the design and control of DC‐DC converters, the realized emulator could be useful for

this purpose. The realized PEM EL emulator is validated both for static and dynamic op‐

erations by using a 400‐W commercial PEM EL. The obtained results with the developed

PEM EL emulator show a good agreement with the real static‐dynamic behavior of the

real EL.

After this introduction providing the current state‐of‐the‐art of PEM FC and EL em‐

ulators, Section 2 deals with the use of emulators in RES exploitation and explains the

difference in the design of a PEM EL emulator. Section 3 analyzes the static and dynamic

operations of PEM ELs for modeling purposes. Then, in Section 4, based on the experi‐

ments, the PEM EL emulator based on an equivalent electrical scheme is introduced and

realized. Afterward, in Section 5, an error analysis between the developed emulator and

experiments is carried out. Finally, in Section 6, experimental tests are carried out on the

emulator prototype to validate it.

2. The Role of Emulators in RES Exploitation

The use of emulators has been successfully assessed for RES exploitation research

activities. It is mainly due to the need for repeatable test conditions; this constraint is

hardly satisfied since weather conditions are often subjected to abrupt variations. In ad‐

dition, the use of an emulator is very helpful for laboratory tests since it allows a cheaper

test rig to be built. As a matter of fact, in general, an emulator is less expensive and less

dangerous compared to the real plant to be emulated; in particular when using EL emu‐

lators no hydrogen is produced during test. For this reason, much research related to em‐

ulators has been conducted to reduce the overall cost and improve the dynamic response

during the last year as it is shown in this section.

The structure of an emulator is composed of a model of the system to be emulated, it

gives referencing parameters to a power conversion system whose output is the feedback

to the model. The photovoltaic (PV) emulators are active circuits able to reproduce the

voltage vs. current characteristic of a PV source [26]. Different approaches have been pro‐

posed to assess the model that can be based on an equivalent electrical circuit or on an

interpolation model [25] or identifying the PV source by test in operating conditions [27].

Processes 2021, 9, 498 4 of 25

The aim is to reproduce particular situations as the partial shading [28,29] to test maxi‐

mum power tracking algorithms and to obtain a good dynamic reproducing the real var‐

iation of the plant [28,30]. In [31], the PV characteristic is by a linear circuit considering a

low power application; anyway to achieve a good efficiency of the power conversion sys‐

tem the switching converters are preferred [28,29,32]. Similarly, the FC emulator allows

the behavior of FC to be represented including all the auxiliaries of the system and avoid‐

ing the waste of hydrogen and the purchase of cells as well as any cell damage [18,33,34].

In [17], the authors have proposed an emulator based on an equivalent electrical circuit

model. In comparison, in [18–20], the developed emulators are based on DC‐DC convert‐

ers; whereas in [21], the emulator is based on a low‐cost microcontroller. Similar features

are exhibited by battery emulators where a power switching converter is controlled to

reproduce the bi‐directional flow of energy [35,36].

Many interesting emulators have allowed testing wind plants. The turbine can be

emulated by a suitable controlled motor that is coupled to the generator [37,38] by emu‐

lating the generator behavior by a suitable controlled three‐phase power converter [38,39].

Differently, the load emulators exploit the characteristic of a power converter to show a

variable impedance that can be used for loading PV sources or FCs as in [40] or as an

electric machine to be connected to a grid under various load conditions [41] for microgrid

test [42–45].

The emulation of an EL shows some differences compared to the above‐mentioned

emulator. The EL represents a load for a power converter which must fit the voltage of

the supply to the voltage required by the EL. The use of RES to produce hydrogen has

changed the requirement of the model that must be able to reproduce a correct behavior

in dynamic conditions. High‐power industrial alkaline EL supplied by the grid are usually

operated in stationary conditions, hence they can be emulated simply by an equivalent

resistance. Differently, PEM ELs are available also for low power and are suitable to be

supplied by RES through a converter [46]; on the other hand, a more accurate model is

required [47]. Even if the EL can be considered as a load, the use of a programmable load,

suitable for obtaining static operation, does not reproduce the transients unless a reference

model is used. It is preferable to avoid programmable loads based on switching converters

to emulate a PEM EL to avoid interference with the converter the supplies that same PEM

EL. For this reason, the design of a PEM EL reveals different from the above‐described

emulators. It is based on an equivalent passive circuit whose components reproduce the

physical behavior of the PEM meaning the anode and cathode reaction and the membrane

including dynamics. In addition, it adopts a linear circuit to correct the I‐V static charac‐

teristic and to retrieve the internal voltage. It enables the produced hydrogen to be ob‐

tained since it is calculated by multiplying the internal voltage for the current. The static

and dynamic characterization procedures of a real PEM EL are described in the following

section.

3. Static and Dynamic Characterization of the Electrolyzer

In this part, static and dynamic characterizations have been carried out on a commer‐

cial PEM EL for modeling purposes. The specifications of the commercial PEM EL NMH2

1000 from HELIOCENTRIS company used for the experiments are given in Table 1. Static

characterization consists of collecting experimental data (current, voltage) during static

conditions (set pressure and temperature) to obtain the static voltage–current curve of the

studied PEM EL. By comparison, the dynamic characterization is carried out by supplying

the EL with dynamic current profiles (simulating the coupling of PEM EL with RES) and

then, to observe the voltage response of the studied PEM EL, highlighting its dynamics.

Dynamic characterization is crucial to better understand the dynamics of the PEM EL and

to lead up to its modeling by an equivalent electrical circuit.

Despite so many contributions that have been reported in the literature regarding the

development of PEM EL models [24,48], dynamic operations are generally not taken into

Processes 2021, 9, 498 5 of 25

consideration in modeling the EL. Like PEM FCs, ELs are electrochemical devices requir‐

ing time to respond to dynamic operations due to the move of charge into the EL. A first

analysis of the PEM EL responses according to dynamic input energy has been reported

in previous work [24]. By taking into consideration their dynamics, it enables enhancing

the accuracy of the model. The development of accurate PEM EL models is very useful to

simulate hydrogen production systems based on RES and to develop efficient controllers

for power electronics. Dealing with RES for hydrogen production, the dynamics of both

two systems must be considered. In fact, the speed of the variation of the energy produced

by a RES is usually different from the speed of the energy that can be absorbed by the EL.

This phenomenon can be reproduced only by considering the dynamics of the EL. Partic‐

ularly, when the energy delivered by the RES varies abruptly, the EL requires more time

to vary its operating point; in the meantime, there is a need that the intermediate DC‐bus

of the converter must be properly designed (or provided by an auxiliary storage system)

to avoid overvoltages. A simple static model of the EL is not suitable since it receives all

the energy variations instantaneously; it does not correspond to the real practice. For this

reason, this article focuses the attention on this aspect. In [25], it has been shown that the

dynamic behavior of the electrolyzer significantly changes the transfer function of a power

converter loaded by the same electrolyzer. In this section, the responses of a commercial

PEM EL are investigated based on dynamic current profiles, both rise and fall current.

Table 1. Specifications of the proton exchange membrane (PEM) electrolyzer.

Parameters Value Unit

Rated electrical power 400 W

Stack current range 8 V

Stack current range 0–50 A

Max. outlet pressure 10.5 bar

Cells number, N 3 ‐

Active area Section 50 cm2

Max. Hydrogen flow rate at STP

(Standard Temperature and

Pressure, 20 °C and 1 bar)

1 slpm (standard liter per minute)

P = 1 bar, T = 15 °C

3.1. Static Operation

First of all, the static voltage‐curve of the studied PEM EL has been experimentally

retrieved, it is shown in Figure 1. It can be noted that the PEM stack voltage increases

when increasing the current supplying the EL. However, from a current value approxi‐

mately equal to 7 A (i.e., 0.14 A.cm−2), the stack voltage remains constant. Usually, a con‐

stant voltage region does not exist for a proper electrolyzer. Despite this observation has

not yet been reported in the literature, some explanations can be given from the author’s

point of view. The investigated PEM EL was equipped at the beginning of its use in the

laboratory with a power switching converter providing an excessive current ripple. This

operation modified the EL characteristic introducing the saturation of the voltage. The

operation of the emulator has been limited to the linear part of the I–V curve before satu‐

ration. During tests proposed in this article, the identification of the static and dynamic

curve of the experimental points has been retrieved by a pure current source. As concerns

the static characterization, the current source is programmed by the virtual control panel

to supply current in a suitable range; for each point, the voltage is measured obtaining the

static characteristic as shown in Figure 1. For this test, only the stack of the PEM EL is used

and directly connected to a DC power supply. It should be remarked that, even if the U‐I

static curve is not theoretically correct, it represents our case study, consequently, the em‐

ulator has been conceived to reproduce the constant voltage region as well. It will be ob‐

tained by an additional circuit whose operation does not affect the normal operation re‐

gion and can be removed for emulating an electrolyzer without saturation.

Processes 2021, 9, 498 6 of 25

Figure 1. Static voltage‐current waveform.

3.2. Dynamic Operation and Analysis

The dynamic characterization plays a crucial role in the emulation; as a matter of fact,

differently from high power Alkaline ELs, the PEM EL shows a different behavior varying

the frequency. In practice, power electronics converters for PEM EL supplied by the grid

are based on a single‐phase diode rectifier and a DC‐DC buck converter. The rectifier is

mandatory to convert an AC voltage to a DC voltage, but it used alone does not meet the

low DC voltage required by the PEM EL since the DC voltage generated from the rectifier

is quite high. Hence, a DC‐DC buck converter is needed to supply the EL. On one hand,

it is important to note that the use of power electronics produces low and high‐frequency

current ripple. Generally, low‐frequency current ripple is generated by the rectifier (equal

twice the frequency of the power grid; in our case, 100 Hz); while the high‐frequency cur‐

rent ripple is produced by the DC‐DC buck converter (due to the high switching fre‐

quency; in our case, 20 kHz). By using a commercial power converter the output voltage

is affected both by low and high‐frequency ripple; it influences the current that suffers

from the same distortion. Many works have been reported in the literature to investigate

the effects of low and high‐frequency current ripples on PEM FC stack [49–52], and more

recently on alkaline EL [53,54]. In these relevant works, it has been demonstrated that low

and high‐frequency current ripple may affect the lifetime and performance of FC and EL

during their operation. The PEM EL can be characterized in the frequency domain by

measuring the frequency response in a suitable range or in the time domain by the step

response.

Since the purpose of our emulator is focused on the behavior with RES subjected to

abrupt variations, the time domain characterization based on the step current response

has been performed.

Several dynamic tests have been performed; particularly, the tests showing the oper‐

ation with the current step from 2 to 7 A and vice‐versa are shown in this article since they

are very challenging for the wide span of the current to supply the EL. All tests performed

with small current variations have shown lower errors as shown in the section devoted to

results. Therefore, it implies that the equivalent electrical model proposed in Section 4 to

realize the emulator is quite accurate. On the other hand, since the equivalent capacitances

of the model depend on the current, as shown in [55], the choice of constant values capac‐

itors with values available on the market imposes a trade‐off. It implies that, for example,

the bubbles’ possible formation should modify the dynamic response making inappropri‐

ate the equivalent capacitor of the model. As a consequence, the maximum error is ex‐

pected for abrupt transients. In particular, the steps from 2 A to 8 A and vice versa repre‐

sent the worst case. Finally, the adoption of the supercapacitor is chosen only for practical

purposes to avoid the connection of multiple parallels of the traditional capacitor. Obvi‐

ously, it does not mean that the internal behavior can be assumed as a double‐layer ca‐

pacitor.

The objective of this subsection is to analyze the response of the EL when supplying

it with a rise or fall current. The obtained results are reported in Figures 2 and 3. A high

Processes 2021, 9, 498 7 of 25

time scale for both tests (i.e., 5 s.div−1) has been chosen to emphasize the dynamics of the

PEM EL and the steady‐state operation as well.

As can be observed, the PEM EL responds quickly as a result of a step current (i.e.,

rise or fall). It is one of the most important features required for ELs when coupling with

RES since their operations are characterized by very fast dynamics. As a result of a step

current to supply the PEM EL, an immediate rise in PEM EL stack voltage, and after a

slow final rise before reaching its steady‐state value can be noticed. The immediate voltage

rise is linked to the membrane operation since only the protons can go through it; whereas

the slow voltage rise highlights the dynamics of the EL both at the anode and the cathode.

Based on previously reported works, this slow voltage rise is assimilated to the activation

overvoltage. In the first test (i.e., Figure 2), the final steady‐state value (around 8 V) is

reached approximately in 37 s; while for the second test (i.e., Figure 3), the final steady‐

state value is reached in 33 s. The slight difference between the curves obtained with the

rising and falling of the current are well expected since the impedance seen by the EL is

different during the step‐up and the step‐down of the supplied current. Moreover, during

the step‐up of the current, the EL current is forced by the power converter, during the

step‐down the EL must remove the excess charge to decrease the voltage at its terminals;

this is done by varying the production of hydrogen. Of course, by our emulator with fixed

parameters, it is not possible to reproduce both curves and a trade‐off is required.

Figure 2. Response of the PEM electrolyzer as a result of a rise current.

Processes 2021, 9, 498 8 of 25

Figure 3. Response of the PEM electrolyzer as a result of a fall current.

3.3. Discussion

As reported in the previous subsection, the two tests are characterized by different

dynamics. Indeed, for the first test, the steady‐state stack voltage is reached slowly; while

for the second test, the dynamics are a little faster than the first test. Between the two tests,

the required time to stabilize a steady‐state operation is long. For the first test, the reac‐

tions inside the EL are slower than the second test since the expected steady‐state value is

equal to the rated stack voltage (i.e., around 8 V). If the expected steady‐state value was

lower than the rated stack voltage, the required time to reach the steady‐state value would

be shorter. These slow dynamics are particularly noticeable for a current range included

between 4 and 7 A. In comparison, for the second test, the needed time to stabilize the EL

to its steady‐state voltage value is also long due to the slowness of the movement of the

electrons inside the EL. In both cases, two dynamics can be emphasized, one faster corre‐

sponding to the cathode reaction, and the last one slower corresponding to the anode re‐

action based on a previous work reported in [24]. According to the input energy supplying

the EL, the dynamics can be mainly dominated by the anode reaction (i.e., slower) or the

cathode reaction (i.e., faster) [24].

Finally, based on performed experiments, the dynamics are particularly noticeable

up to a current range up to 8 A. This is linked with the obtained static voltage‐curve in

Figure 1 where the stack voltage remains constant above 7 A despite the rated current of

the EL is equal to 50 A. Some comments have been provided in Section 3.2 to explain this

important issue.

Based on this analysis of the results, the main objective of the next section is to pro‐

vide the proposed PEM EL emulator and the guidelines to realize the emulator.

4. PEM Electrolyzer Emulator

4.1. Equivalent Electrical Scheme

As shown in the previous section, the studied PEM EL features a slow and fast dy‐

namic behavior, commonly known as the “charge double‐layer” effect, as reported for

PEM FCs [56]. Basically, between the electrode and the electrolyte, there is a layer of

charge, which can store electrical charge, and as a result, energy. This “charge double‐

layer” behaves like a capacitor. On one hand, the accumulation of charges produces an

electrical voltage, which corresponds to the activation overvoltage both at the anode and

the cathode. Therefore, when the current suddenly changes, the activation overvoltages

Processes 2021, 9, 498 9 of 25

both at the anode and the cathode take some time before following the change in current.

On the other hand, the ohmic overvoltage responds immediately as a result of a change

in the current, as can be observed in Figures 2 and 3. Hence, an equivalent electrical

scheme can be developed and enables separating the activation overvoltage at the anode

and the cathode. The proposed equivalent electrical circuit is reported in Figure 4.

Figure 4. PEM electrolyzer equivalent electrical circuit.

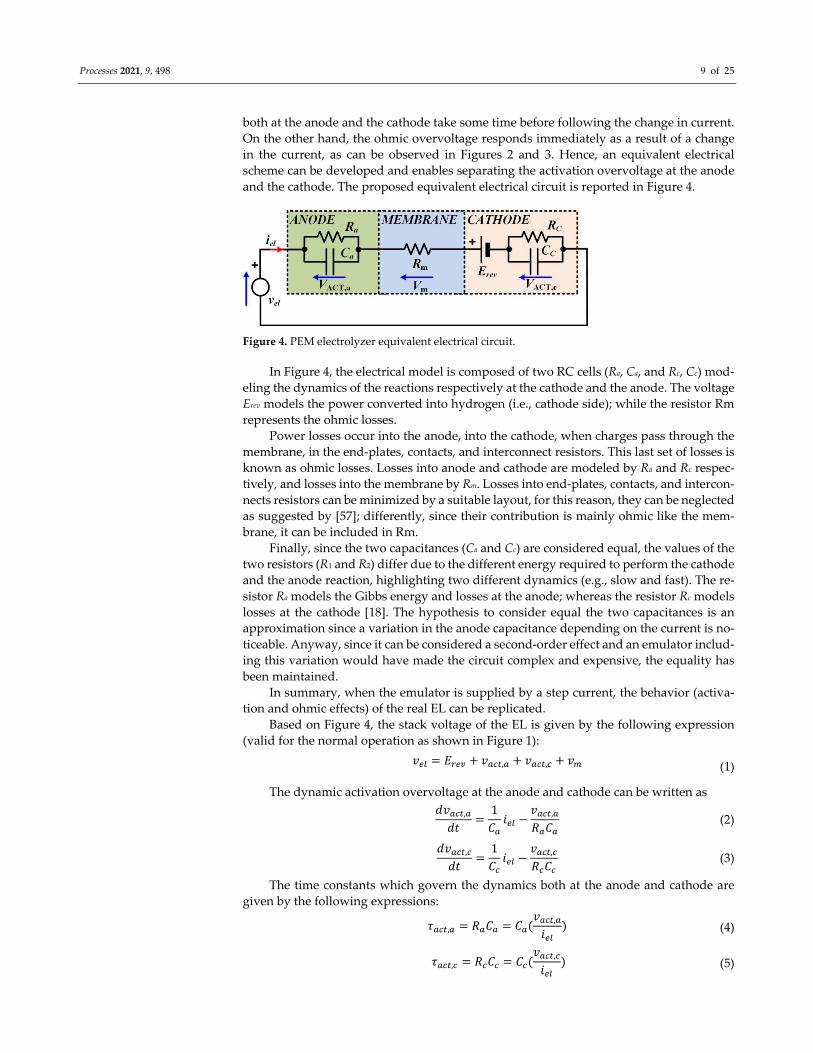
In Figure 4, the electrical model is composed of two RC cells (Ra, Ca, and Rc, Cc) mod‐

eling the dynamics of the reactions respectively at the cathode and the anode. The voltage

Erev models the power converted into hydrogen (i.e., cathode side); while the resistor Rm

represents the ohmic losses.

Power losses occur into the anode, into the cathode, when charges pass through the

membrane, in the end‐plates, contacts, and interconnect resistors. This last set of losses is

known as ohmic losses. Losses into anode and cathode are modeled by Ra and Rc respec‐

tively, and losses into the membrane by Rm. Losses into end‐plates, contacts, and intercon‐

nects resistors can be minimized by a suitable layout, for this reason, they can be neglected

as suggested by [57]; differently, since their contribution is mainly ohmic like the mem‐

brane, it can be included in Rm.

Finally, since the two capacitances (Ca and Cc) are considered equal, the values of the

two resistors (R1 and R2) differ due to the different energy required to perform the cathode

and the anode reaction, highlighting two different dynamics (e.g., slow and fast). The re‐

sistor Ra models the Gibbs energy and losses at the anode; whereas the resistor Rc models

losses at the cathode [18]. The hypothesis to consider equal the two capacitances is an

approximation since a variation in the anode capacitance depending on the current is no‐

ticeable. Anyway, since it can be considered a second‐order effect and an emulator includ‐

ing this variation would have made the circuit complex and expensive, the equality has

been maintained.

In summary, when the emulator is supplied by a step current, the behavior (activa‐

tion and ohmic effects) of the real EL can be replicated.

Based on Figure 4, the stack voltage of the EL is given by the following expression

(valid for the normal operation as shown in Figure 1):

𝑣 𝐸 𝑣 , 𝑣 , 𝑣 (1)

The dynamic activation overvoltage at the anode and cathode can be written as

𝑑𝑣 ,

𝑑𝑡1𝐶𝑖

𝑣 ,

𝑅 𝐶 (2)

𝑑𝑣 ,

𝑑𝑡1𝐶𝑖

𝑣 ,

𝑅 𝐶 (3)

The time constants which govern the dynamics both at the anode and cathode are

given by the following expressions:

𝜏 , 𝑅 𝐶 𝐶𝑣 ,

𝑖 (4)

𝜏 , 𝑅 𝐶 𝐶𝑣 ,

𝑖 (5)

Processes 2021, 9, 498 10 of 25

The ohmic overvoltage vm is expressed by the following equation:

𝑣 𝑅 𝑖 (6)

The energy efficiency (i.e., ratio between the power converted into hydrogen and the

electrical power) can be expressed based on the equivalent electrical circuit [24]:

𝜂𝑃𝑃

𝐸 𝑖𝐸 𝑖 𝑅 𝑅 𝑅 𝑖

(7)

Finally, the hydrogen flow rate (mol.s−1) is expressed as follows [58]:

𝑁𝐻𝜂 .𝑛 . 𝑖𝑧.𝐹

(8)

where

𝜂F = Faraday’s efficiency resulting in the ratio between the measured hydrogen flow rate

and the theoretical hydrogen flow rate which could be produced according to the input

energy. Based on experiments, 𝜂F = 0.96. nc = number of cells of the EL.

iel = EL current (A).

z = number of electrons exchanged during the reaction. For H2, z = 2.

F = Faraday’s constant, 96,485 (C.mol−1).

4.2. Equivalent Electrical Scheme

First of all, before realizing the emulator prototype, the different parameters of the

equivalent electrical model appearing in Figure 4 have to be assessed. In summary, there

are six parameters to determine: the reversible voltage Erev, the resistors Ra, Rc, and Rm

respectively of the anode, cathode, and membrane, and finally, the two capacitors Ca and

Cc for the anode and cathode. Based on the work reported in [24], the reversible voltage

Erev and the membrane resistor Rm can be determined from a static model identification;

whereas the remaining four parameters (i.e., Ra, Rc, Ca, Cc) can be assessed by using a dy‐

namic model identification. This identification consists of analyzing the transient opera‐

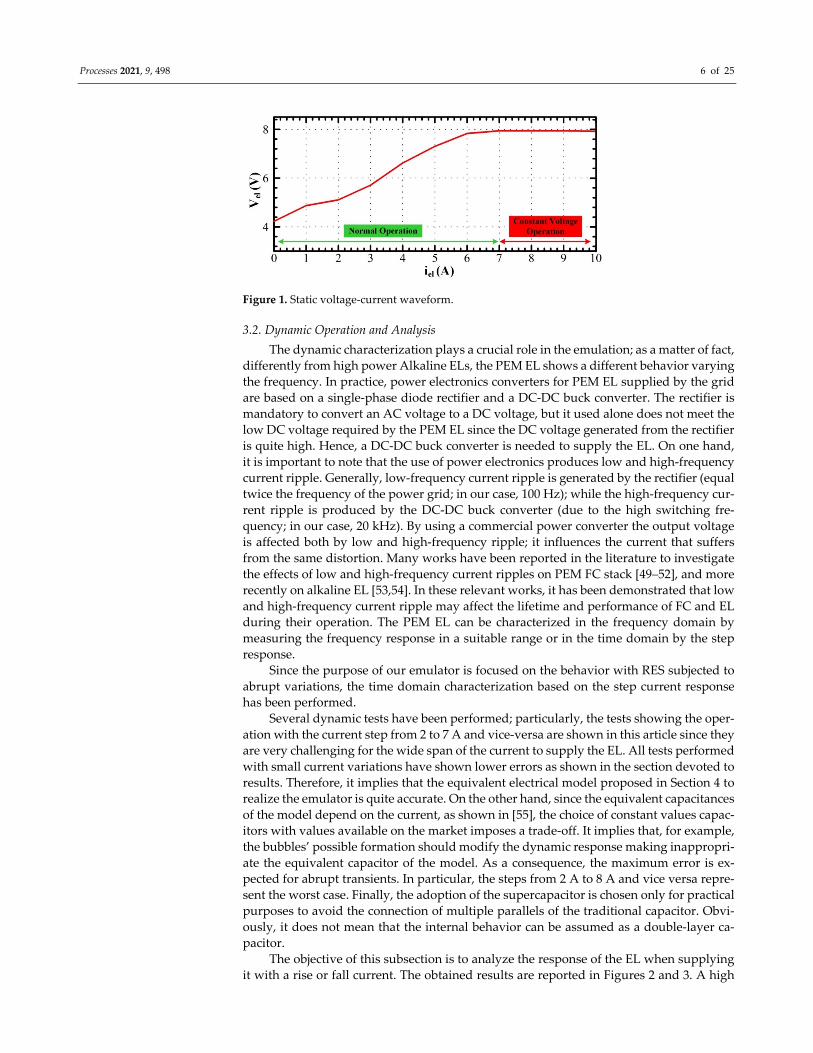
tion as shown in Figures 2 and 3. A least‐squares regression algorithm has been used to

estimate the time constant of the transient operation, then the parameters of the activation

resistors and double‐layer capacitor [24]. It has to be noted that the equivalent double‐

layer capacitor estimated for this study is approximately equal to 37 F; while the values

reported for PEM FCs are of the order of a few Farads [56]. These values are too high to

be reproduced in a circuit by the classic electrolytic capacitors. For this reason, superca‐

pacitors have been adopted. In addition, based on the experiments reported in Figures 2

and 3, the dynamics of the PEM EL may change according to the operating conditions (i.e.,

input current supplying the EL). As a result, the estimated parameters in [24] are not op‐

timal for any operating condition but present a good agreement with the real dynamic

behavior of the EL. For this reason, these parameters have been considered to realize a

PEM EL emulator prototype. The proposed approach can be extended to different PEM

ELs by performing the identification of the parameters of the model as explained in [24].

The values of the estimated parameters for the model are provided in Table 2. It has to be

noted that the PEM EL prototype has been developed for a current range of up 20 A. For

this reason, all the resistors (i.e., Ra, Rc, and Rm) have been chosen so that they can dissipate

the power up to 20 A.

Processes 2021, 9, 498 11 of 25

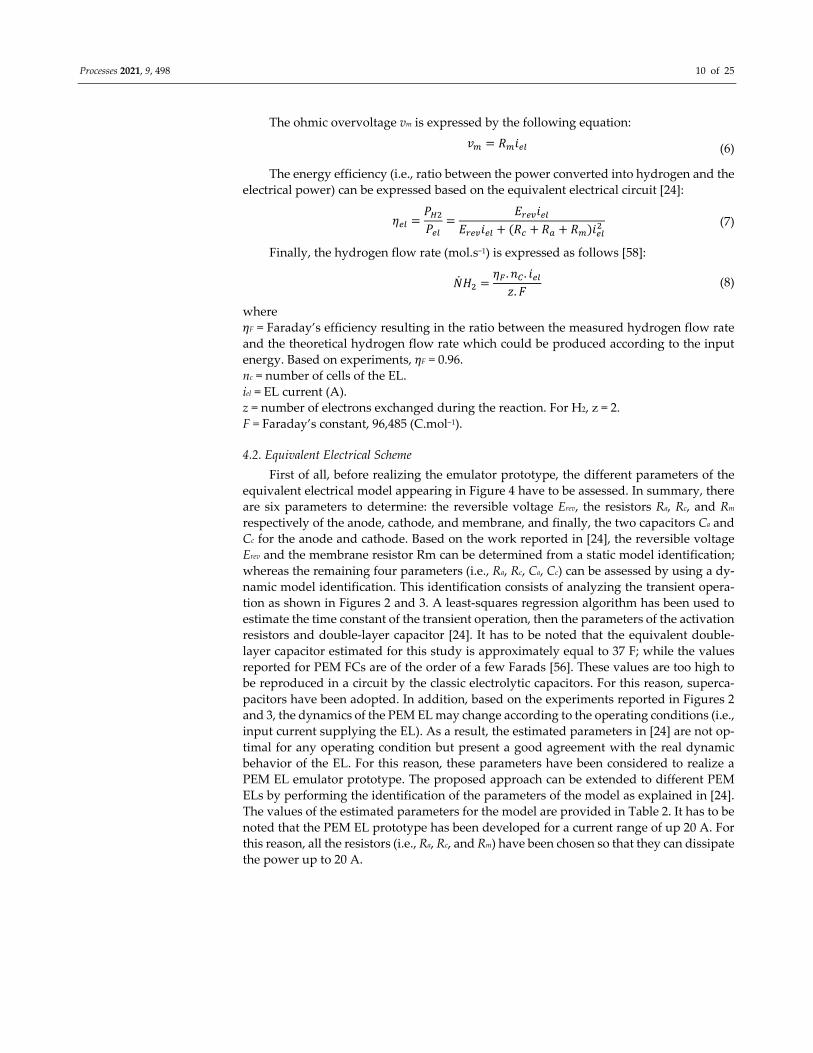
Table 2. Values of the estimated parameters for the PEM electrolyzer emulator.

Parameters Value Unit

Erev 4.38 V

Rm 0.088 Ω

Ra 0.318 Ω

Rc 0.035 Ω

Ca 37.26 F

Cc 37.26 F

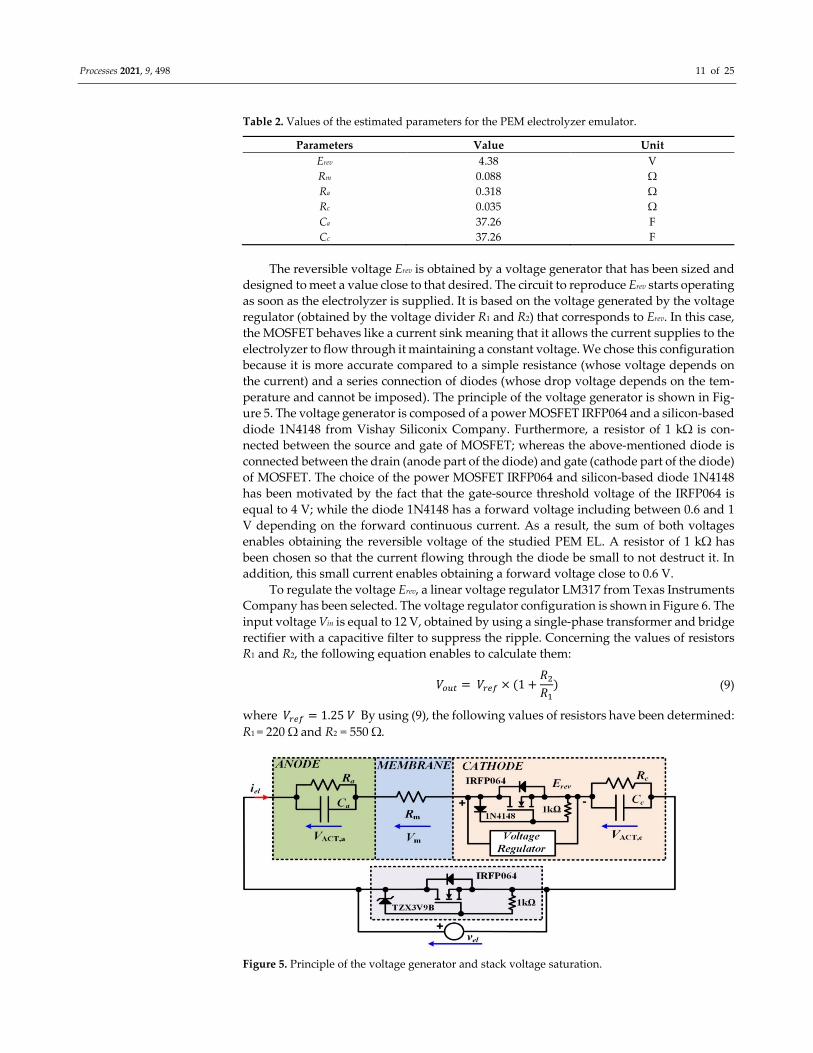
The reversible voltage Erev is obtained by a voltage generator that has been sized and

designed to meet a value close to that desired. The circuit to reproduce Erev starts operating

as soon as the electrolyzer is supplied. It is based on the voltage generated by the voltage

regulator (obtained by the voltage divider R1 and R2) that corresponds to Erev. In this case,

the MOSFET behaves like a current sink meaning that it allows the current supplies to the

electrolyzer to flow through it maintaining a constant voltage. We chose this configuration

because it is more accurate compared to a simple resistance (whose voltage depends on

the current) and a series connection of diodes (whose drop voltage depends on the tem‐

perature and cannot be imposed). The principle of the voltage generator is shown in Fig‐

ure 5. The voltage generator is composed of a power MOSFET IRFP064 and a silicon‐based

diode 1N4148 from Vishay Siliconix Company. Furthermore, a resistor of 1 kΩ is con‐

nected between the source and gate of MOSFET; whereas the above‐mentioned diode is

connected between the drain (anode part of the diode) and gate (cathode part of the diode)

of MOSFET. The choice of the power MOSFET IRFP064 and silicon‐based diode 1N4148

has been motivated by the fact that the gate‐source threshold voltage of the IRFP064 is

equal to 4 V; while the diode 1N4148 has a forward voltage including between 0.6 and 1

V depending on the forward continuous current. As a result, the sum of both voltages

enables obtaining the reversible voltage of the studied PEM EL. A resistor of 1 kΩ has

been chosen so that the current flowing through the diode be small to not destruct it. In

addition, this small current enables obtaining a forward voltage close to 0.6 V.

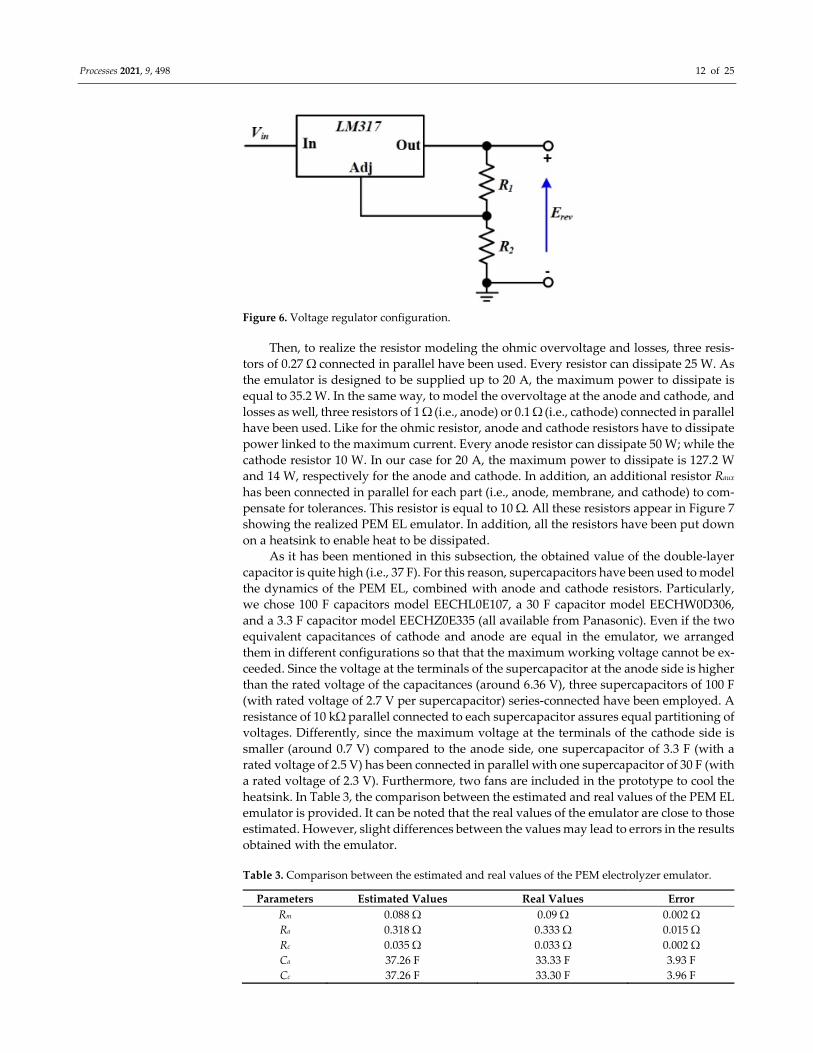
To regulate the voltage Erev, a linear voltage regulator LM317 from Texas Instruments

Company has been selected. The voltage regulator configuration is shown in Figure 6. The

input voltage Vin is equal to 12 V, obtained by using a single‐phase transformer and bridge

rectifier with a capacitive filter to suppress the ripple. Concerning the values of resistors

R1 and R2, the following equation enables to calculate them:

𝑉 𝑉 1𝑅𝑅

(9)

where 𝑉 1.25 𝑉 By using (9), the following values of resistors have been determined:

R1 = 220 Ω and R2 = 550 Ω.

Figure 5. Principle of the voltage generator and stack voltage saturation.

Processes 2021, 9, 498 12 of 25

Figure 6. Voltage regulator configuration.

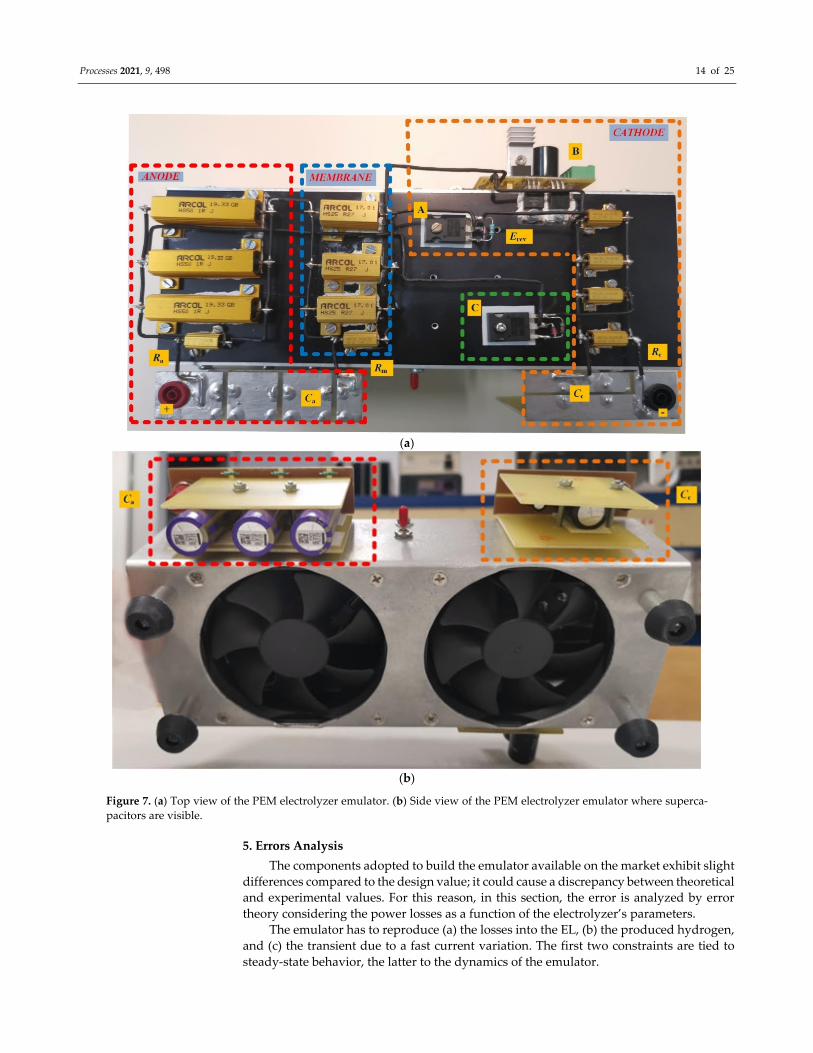
Then, to realize the resistor modeling the ohmic overvoltage and losses, three resis‐

tors of 0.27 Ω connected in parallel have been used. Every resistor can dissipate 25 W. As

the emulator is designed to be supplied up to 20 A, the maximum power to dissipate is

equal to 35.2 W. In the same way, to model the overvoltage at the anode and cathode, and

losses as well, three resistors of 1 Ω (i.e., anode) or 0.1 Ω (i.e., cathode) connected in parallel

have been used. Like for the ohmic resistor, anode and cathode resistors have to dissipate

power linked to the maximum current. Every anode resistor can dissipate 50 W; while the

cathode resistor 10 W. In our case for 20 A, the maximum power to dissipate is 127.2 W

and 14 W, respectively for the anode and cathode. In addition, an additional resistor Raux

has been connected in parallel for each part (i.e., anode, membrane, and cathode) to com‐

pensate for tolerances. This resistor is equal to 10 Ω. All these resistors appear in Figure 7

showing the realized PEM EL emulator. In addition, all the resistors have been put down

on a heatsink to enable heat to be dissipated.

As it has been mentioned in this subsection, the obtained value of the double‐layer

capacitor is quite high (i.e., 37 F). For this reason, supercapacitors have been used to model

the dynamics of the PEM EL, combined with anode and cathode resistors. Particularly,

we chose 100 F capacitors model EECHL0E107, a 30 F capacitor model EECHW0D306,

and a 3.3 F capacitor model EECHZ0E335 (all available from Panasonic). Even if the two

equivalent capacitances of cathode and anode are equal in the emulator, we arranged

them in different configurations so that that the maximum working voltage cannot be ex‐

ceeded. Since the voltage at the terminals of the supercapacitor at the anode side is higher

than the rated voltage of the capacitances (around 6.36 V), three supercapacitors of 100 F

(with rated voltage of 2.7 V per supercapacitor) series‐connected have been employed. A

resistance of 10 kΩ parallel connected to each supercapacitor assures equal partitioning of

voltages. Differently, since the maximum voltage at the terminals of the cathode side is

smaller (around 0.7 V) compared to the anode side, one supercapacitor of 3.3 F (with a

rated voltage of 2.5 V) has been connected in parallel with one supercapacitor of 30 F (with

a rated voltage of 2.3 V). Furthermore, two fans are included in the prototype to cool the

heatsink. In Table 3, the comparison between the estimated and real values of the PEM EL

emulator is provided. It can be noted that the real values of the emulator are close to those

estimated. However, slight differences between the values may lead to errors in the results

obtained with the emulator.

Table 3. Comparison between the estimated and real values of the PEM electrolyzer emulator.

Parameters Estimated Values Real Values Error

Rm 0.088 Ω 0.09 Ω 0.002 Ω

Ra 0.318 Ω 0.333 Ω 0.015 Ω

Rc 0.035 Ω 0.033 Ω 0.002 Ω

Ca 37.26 F 33.33 F 3.93 F

Cc 37.26 F 33.30 F 3.96 F

Processes 2021, 9, 498 13 of 25

Finally, the circuit board to generate the reversible voltage Erev is shown in Figure 7a

(see dotted box B) and the power MOSFET IRFP064 and silicon‐based diode 1N4148 are

shown in the same figure (see dotted box A). Figure 7b shows a side view showing super‐

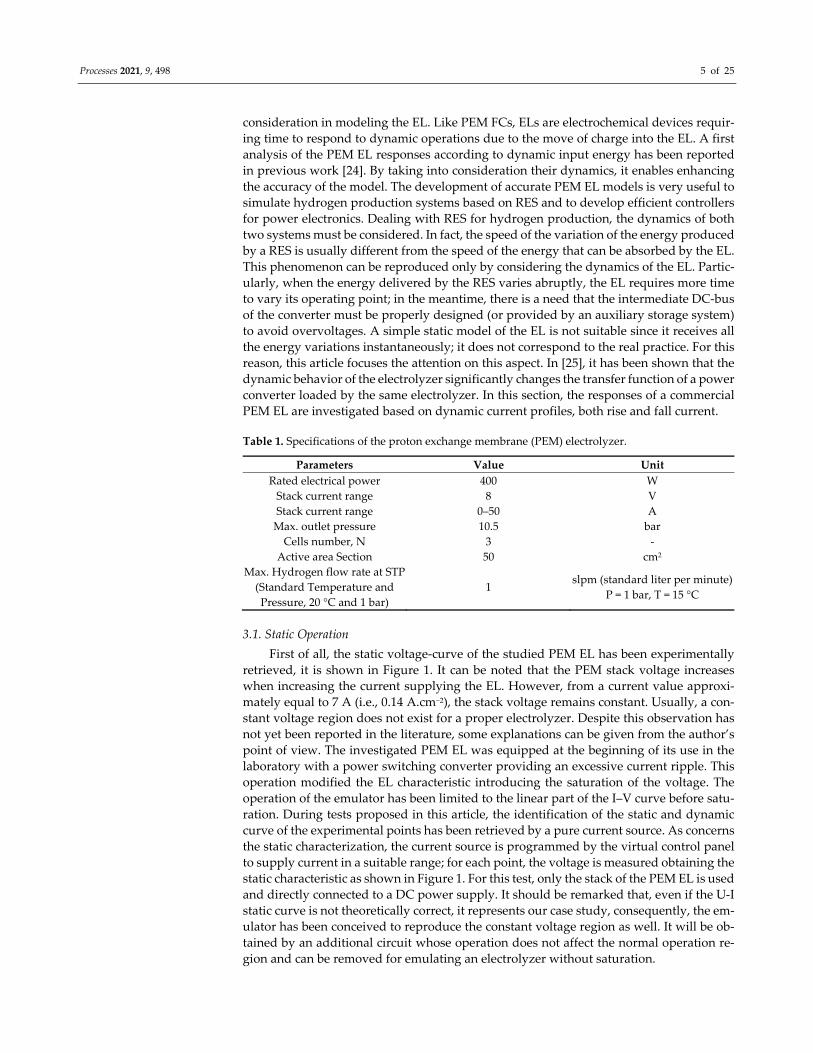
capacitors to emulate dynamic behavior. In addition, based on Figure 1 and the analysis

reported in Section 3.1, the operation at a constant stack voltage (i.e., 8 V) has been taken

into consideration when realizing the PEM EL emulator prototype. To reproduce such

behavior, the voltage cannot exceed 8 V. The circuit reproducing the saturation is a voltage

clamp based on the power MOSFET IRFP064. The operation can be described as follows:

when the voltage between Drain and Source is lower than 8 V, the zener diode acts as a

reverse‐biased diode, no current can flow through it, the voltage applied between the gate

and the source of the MOSFET is null and the device remains in blocking zone represent‐

ing an open circuit with high impedance; as a consequence, it does not influence the op‐

eration of the parallel‐connected circuit representing the emulator in linear operation

(which shows a low impedance). Differently, when the voltage applied to the emulator

tries to overcome 8 V, the zener diode goes in zener zone and behaves as a voltage gener‐

ator, a zener current of 5 mA flowing through imposes a voltage between the gate and the

source of the MOSFET so that it is biased to exhibit a voltage between Drain and Source

of 8 V. We chose these values to approximate at the best the “knee” shown by the static

U‐I curve avoiding an edge due to abrupt transitions, from linear to saturation, as well as

in the real circuit. It could be underlined that this circuit does not require an external acti‐

vation since it starts operating automatically when the voltage of the electrolyzer ap‐

proaches 8 V. The power MOSFET IRFP064 and the Zener diode TZX3V9B have been cho‐

sen given that the gate‐source threshold voltage of the IRFP064 is equal to 4 V; whereas

the TZX3V9B has a max Zener voltage equal to 4 V. Thus, the sum of both voltages allows

obtaining the rated stack voltage of the studied PEM EL. The power MOSFET IRFP064

and Zener diode TZX3V9B are shown in Figure 7a (see dotted box C). The circuits adopted

for reproducing the reversible voltage and the stack saturation allow the emulator to be

fitted for different ELs. In fact, the reversible voltage is based on a reference voltage that

can be chosen according to the desired value. It could also be varied depending on the

current with a suitable linear driver. The stack saturation circuit allows the voltage to re‐

main constant when the current increases over a threshold that can be set based on the EL

behavior. These design considerations make the proposed circuit more general. Finally, it

has to be underlined that, being a passive circuit the power to be dissipated, can be

cheaply managed up to few kW, above this limit, the use of the different solution for the

emulator has to be considered. For example, the proposed circuit can be used to calculate

the current reference to be amplified by a programmable load.

Processes 2021, 9, 498 14 of 25

(a)

(b)

Figure 7. (a) Top view of the PEM electrolyzer emulator. (b) Side view of the PEM electrolyzer emulator where superca‐

pacitors are visible.

5. Errors Analysis

The components adopted to build the emulator available on the market exhibit slight

differences compared to the design value; it could cause a discrepancy between theoretical

and experimental values. For this reason, in this section, the error is analyzed by error

theory considering the power losses as a function of the electrolyzer’s parameters.

The emulator has to reproduce (a) the losses into the EL, (b) the produced hydrogen,

and (c) the transient due to a fast current variation. The first two constraints are tied to

steady‐state behavior, the latter to the dynamics of the emulator.

Processes 2021, 9, 498 15 of 25

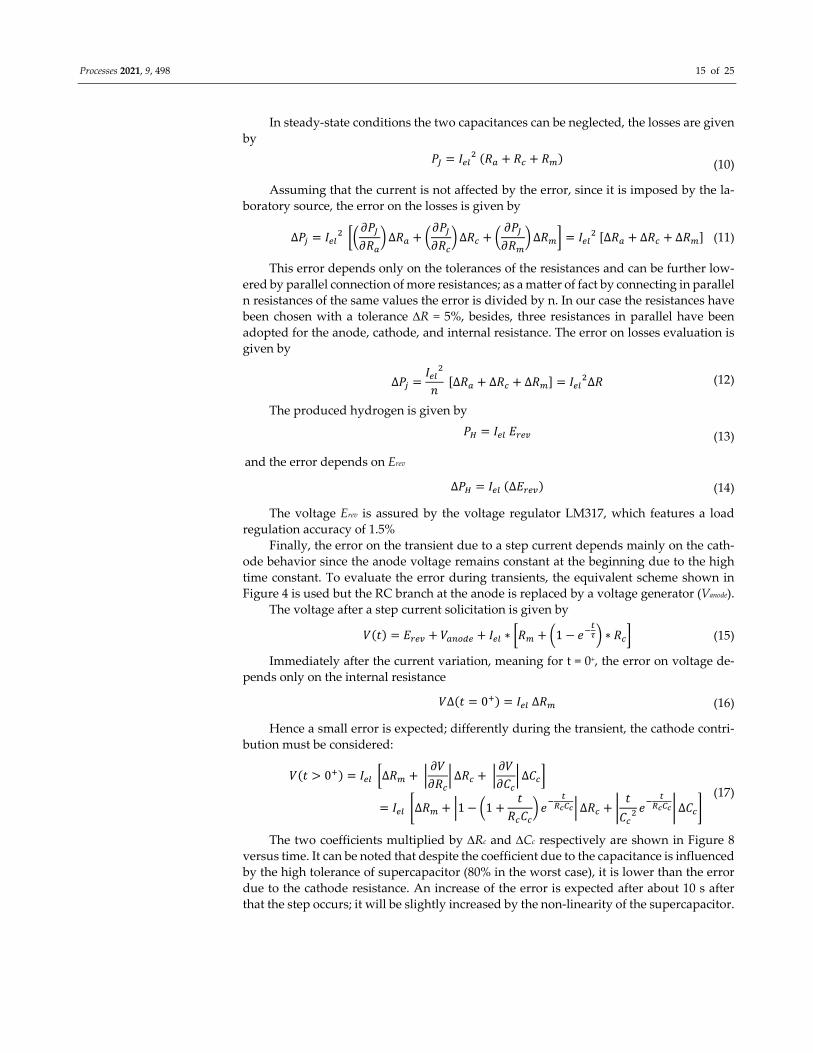
In steady‐state conditions the two capacitances can be neglected, the losses are given

by

𝑃 𝐼 𝑅 𝑅 𝑅 (10)

Assuming that the current is not affected by the error, since it is imposed by the la‐

boratory source, the error on the losses is given by

∆𝑃 𝐼 𝜕𝑃𝜕𝑅

∆𝑅𝜕𝑃𝜕𝑅

∆𝑅𝜕𝑃𝜕𝑅

∆𝑅 𝐼 ∆𝑅 ∆𝑅 ∆𝑅 (11)

This error depends only on the tolerances of the resistances and can be further low‐

ered by parallel connection of more resistances; as a matter of fact by connecting in parallel

n resistances of the same values the error is divided by n. In our case the resistances have

been chosen with a tolerance R = 5%, besides, three resistances in parallel have been

adopted for the anode, cathode, and internal resistance. The error on losses evaluation is

given by

∆𝑃𝐼𝑛

∆𝑅 ∆𝑅 ∆𝑅 𝐼 ∆𝑅 (12)

The produced hydrogen is given by

𝑃 𝐼 𝐸 (13)

and the error depends on Erev

∆𝑃 𝐼 ∆𝐸 (14)

The voltage Erev is assured by the voltage regulator LM317, which features a load

regulation accuracy of 1.5%

Finally, the error on the transient due to a step current depends mainly on the cath‐

ode behavior since the anode voltage remains constant at the beginning due to the high

time constant. To evaluate the error during transients, the equivalent scheme shown in

Figure 4 is used but the RC branch at the anode is replaced by a voltage generator (Vanode).

The voltage after a step current solicitation is given by

𝑉 𝑡 𝐸 𝑉 𝐼 ∗ 𝑅 1 𝑒 ∗ 𝑅 (15)

Immediately after the current variation, meaning for t = 0+, the error on voltage de‐

pends only on the internal resistance

𝑉∆ 𝑡 0 𝐼 ∆𝑅 (16)

Hence a small error is expected; differently during the transient, the cathode contri‐

bution must be considered:

𝑉 𝑡 0 𝐼 ∆𝑅 𝜕𝑉𝜕𝑅

∆𝑅 𝜕𝑉𝜕𝐶

∆𝐶

𝐼 ∆𝑅 1 1𝑡

𝑅 𝐶𝑒 ∆𝑅

𝑡

𝐶𝑒 ∆𝐶

(17)

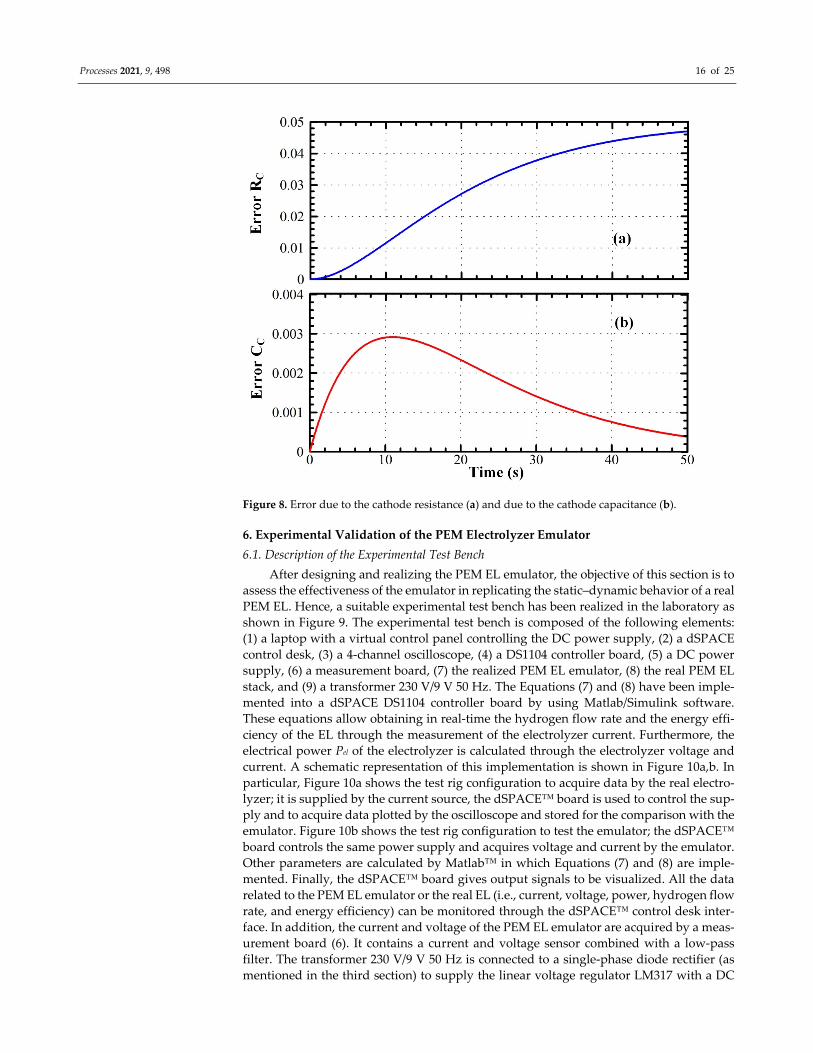
The two coefficients multiplied by Rc and Cc respectively are shown in Figure 8

versus time. It can be noted that despite the coefficient due to the capacitance is influenced

by the high tolerance of supercapacitor (80% in the worst case), it is lower than the error

due to the cathode resistance. An increase of the error is expected after about 10 s after

that the step occurs; it will be slightly increased by the non‐linearity of the supercapacitor.

Processes 2021, 9, 498 16 of 25

Figure 8. Error due to the cathode resistance (a) and due to the cathode capacitance (b).

6. Experimental Validation of the PEM Electrolyzer Emulator

6.1. Description of the Experimental Test Bench

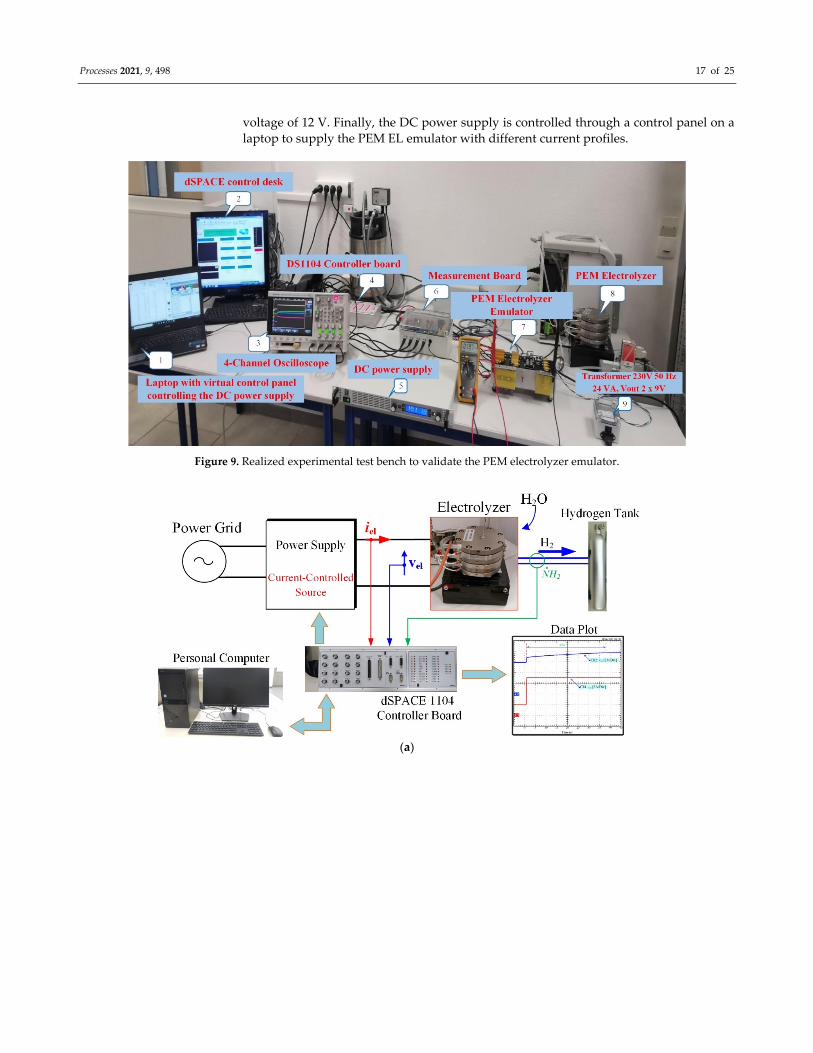
After designing and realizing the PEM EL emulator, the objective of this section is to

assess the effectiveness of the emulator in replicating the static–dynamic behavior of a real

PEM EL. Hence, a suitable experimental test bench has been realized in the laboratory as

shown in Figure 9. The experimental test bench is composed of the following elements:

(1) a laptop with a virtual control panel controlling the DC power supply, (2) a dSPACE

control desk, (3) a 4‐channel oscilloscope, (4) a DS1104 controller board, (5) a DC power

supply, (6) a measurement board, (7) the realized PEM EL emulator, (8) the real PEM EL

stack, and (9) a transformer 230 V/9 V 50 Hz. The Equations (7) and (8) have been imple‐

mented into a dSPACE DS1104 controller board by using Matlab/Simulink software.

These equations allow obtaining in real‐time the hydrogen flow rate and the energy effi‐

ciency of the EL through the measurement of the electrolyzer current. Furthermore, the

electrical power Pel of the electrolyzer is calculated through the electrolyzer voltage and

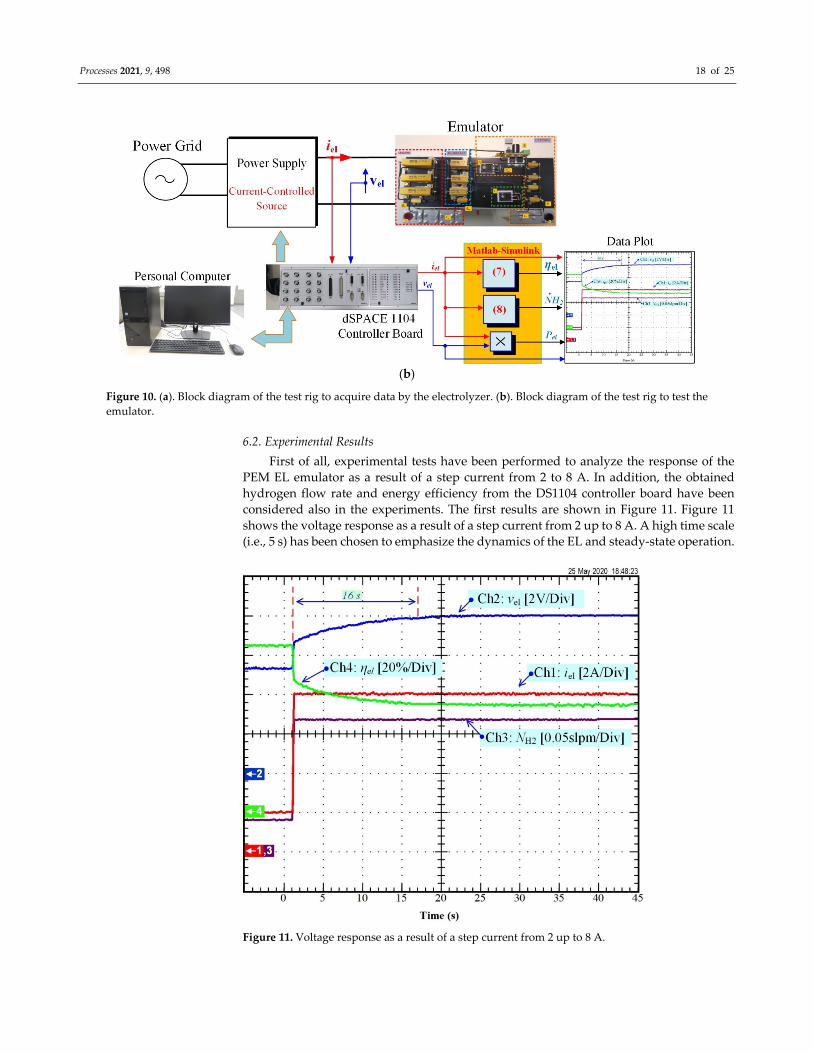
current. A schematic representation of this implementation is shown in Figure 10a,b. In

particular, Figure 10a shows the test rig configuration to acquire data by the real electro‐

lyzer; it is supplied by the current source, the dSPACE™ board is used to control the sup‐

ply and to acquire data plotted by the oscilloscope and stored for the comparison with the

emulator. Figure 10b shows the test rig configuration to test the emulator; the dSPACE™

board controls the same power supply and acquires voltage and current by the emulator.

Other parameters are calculated by Matlab™ in which Equations (7) and (8) are imple‐

mented. Finally, the dSPACE™ board gives output signals to be visualized. All the data

related to the PEM EL emulator or the real EL (i.e., current, voltage, power, hydrogen flow

rate, and energy efficiency) can be monitored through the dSPACE™ control desk inter‐

face. In addition, the current and voltage of the PEM EL emulator are acquired by a meas‐

urement board (6). It contains a current and voltage sensor combined with a low‐pass

filter. The transformer 230 V/9 V 50 Hz is connected to a single‐phase diode rectifier (as

mentioned in the third section) to supply the linear voltage regulator LM317 with a DC

Processes 2021, 9, 498 17 of 25

voltage of 12 V. Finally, the DC power supply is controlled through a control panel on a

laptop to supply the PEM EL emulator with different current profiles.

Figure 9. Realized experimental test bench to validate the PEM electrolyzer emulator.

(a)

Processes 2021, 9, 498 18 of 25

(b)

Figure 10. (a). Block diagram of the test rig to acquire data by the electrolyzer. (b). Block diagram of the test rig to test the

emulator.

6.2. Experimental Results

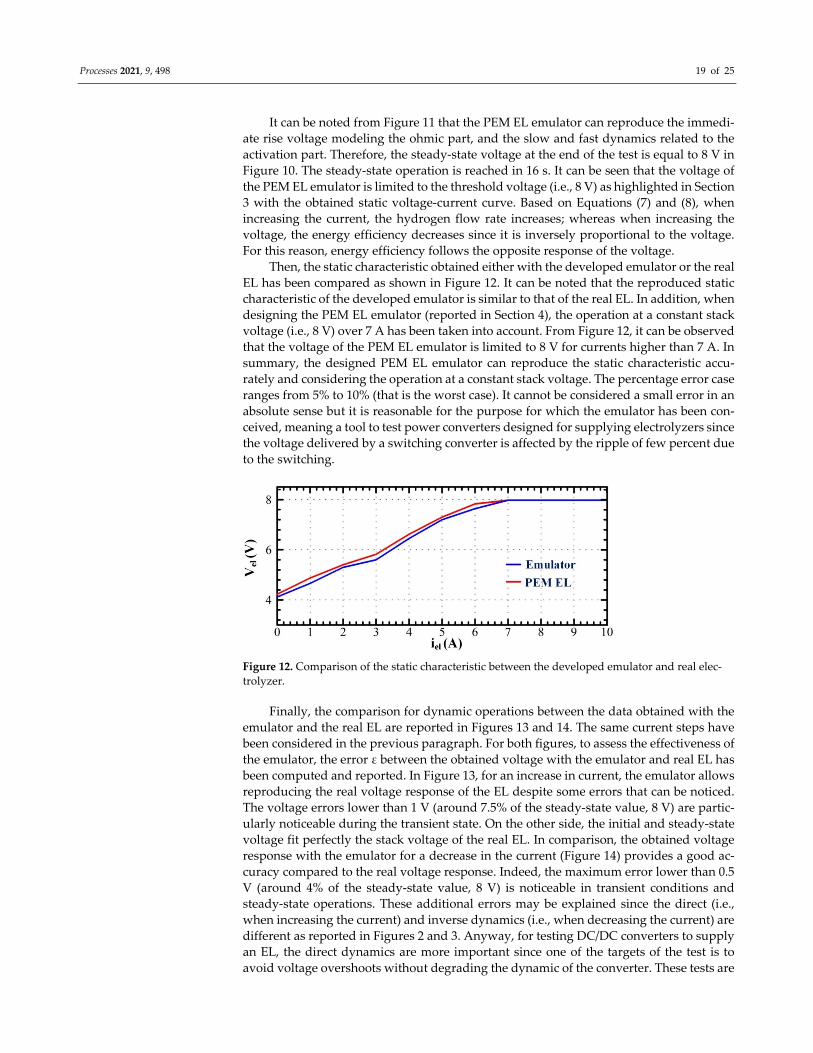
First of all, experimental tests have been performed to analyze the response of the

PEM EL emulator as a result of a step current from 2 to 8 A. In addition, the obtained

hydrogen flow rate and energy efficiency from the DS1104 controller board have been

considered also in the experiments. The first results are shown in Figure 11. Figure 11

shows the voltage response as a result of a step current from 2 up to 8 A. A high time scale

(i.e., 5 s) has been chosen to emphasize the dynamics of the EL and steady‐state operation.

Figure 11. Voltage response as a result of a step current from 2 up to 8 A.

Processes 2021, 9, 498 19 of 25

It can be noted from Figure 11 that the PEM EL emulator can reproduce the immedi‐

ate rise voltage modeling the ohmic part, and the slow and fast dynamics related to the

activation part. Therefore, the steady‐state voltage at the end of the test is equal to 8 V in

Figure 10. The steady‐state operation is reached in 16 s. It can be seen that the voltage of

the PEM EL emulator is limited to the threshold voltage (i.e., 8 V) as highlighted in Section

3 with the obtained static voltage‐current curve. Based on Equations (7) and (8), when

increasing the current, the hydrogen flow rate increases; whereas when increasing the

voltage, the energy efficiency decreases since it is inversely proportional to the voltage.

For this reason, energy efficiency follows the opposite response of the voltage.

Then, the static characteristic obtained either with the developed emulator or the real

EL has been compared as shown in Figure 12. It can be noted that the reproduced static

characteristic of the developed emulator is similar to that of the real EL. In addition, when

designing the PEM EL emulator (reported in Section 4), the operation at a constant stack

voltage (i.e., 8 V) over 7 A has been taken into account. From Figure 12, it can be observed

that the voltage of the PEM EL emulator is limited to 8 V for currents higher than 7 A. In

summary, the designed PEM EL emulator can reproduce the static characteristic accu‐

rately and considering the operation at a constant stack voltage. The percentage error case

ranges from 5% to 10% (that is the worst case). It cannot be considered a small error in an

absolute sense but it is reasonable for the purpose for which the emulator has been con‐

ceived, meaning a tool to test power converters designed for supplying electrolyzers since

the voltage delivered by a switching converter is affected by the ripple of few percent due

to the switching.

Figure 12. Comparison of the static characteristic between the developed emulator and real elec‐

trolyzer.

Finally, the comparison for dynamic operations between the data obtained with the

emulator and the real EL are reported in Figures 13 and 14. The same current steps have

been considered in the previous paragraph. For both figures, to assess the effectiveness of

the emulator, the error ε between the obtained voltage with the emulator and real EL has

been computed and reported. In Figure 13, for an increase in current, the emulator allows

reproducing the real voltage response of the EL despite some errors that can be noticed.

The voltage errors lower than 1 V (around 7.5% of the steady‐state value, 8 V) are partic‐

ularly noticeable during the transient state. On the other side, the initial and steady‐state

voltage fit perfectly the stack voltage of the real EL. In comparison, the obtained voltage

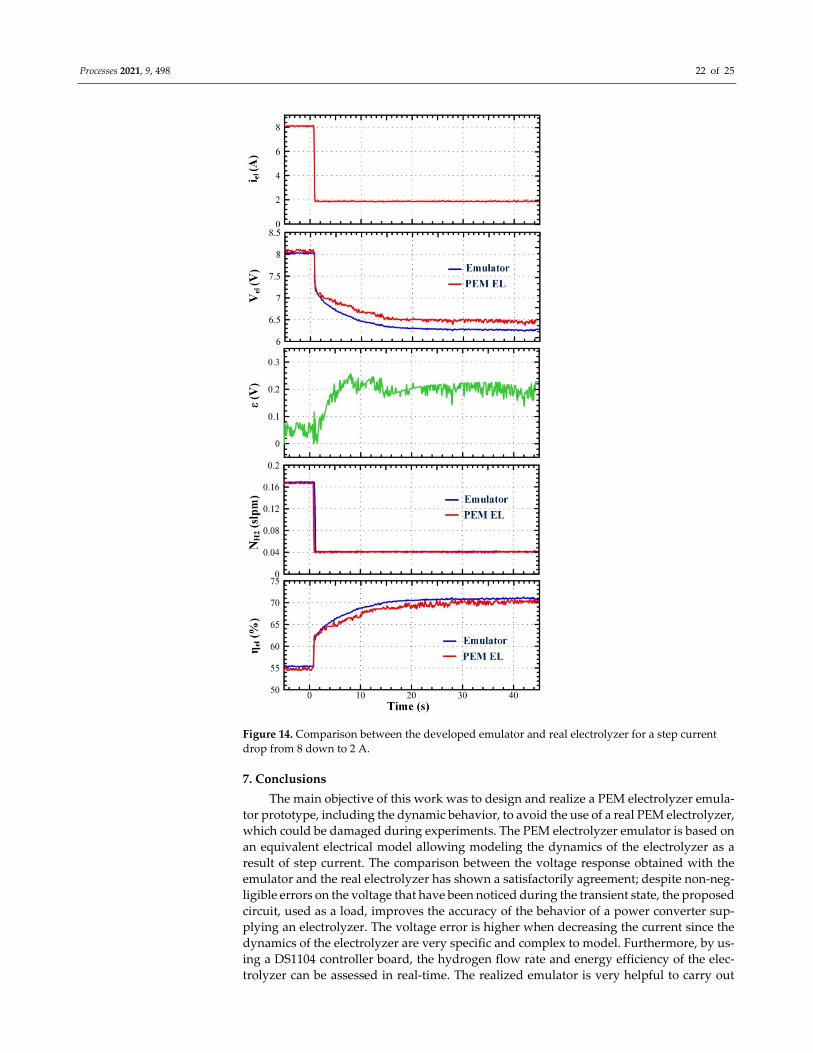
response with the emulator for a decrease in the current (Figure 14) provides a good ac‐

curacy compared to the real voltage response. Indeed, the maximum error lower than 0.5

V (around 4% of the steady‐state value, 8 V) is noticeable in transient conditions and

steady‐state operations. These additional errors may be explained since the direct (i.e.,

when increasing the current) and inverse dynamics (i.e., when decreasing the current) are

different as reported in Figures 2 and 3. Anyway, for testing DC/DC converters to supply

an EL, the direct dynamics are more important since one of the targets of the test is to

avoid voltage overshoots without degrading the dynamic of the converter. These tests are

Processes 2021, 9, 498 20 of 25

among the most dangerous for a real EL. For further investigation, it would be interested

to investigate the direct and inverse dynamics of different PEM ELs models to conclude

about the modeling of dynamics. In any case, this emulator allows replicating with accu‐

racy the real voltage response of the EL by minimizing the errors (the maximum percent‐

age error is equal to 8.75%).

As expected, the maximum error occurs during transient for t = 10 s after the step

current. It is coherent with the adoption of constant capacitances and with error analysis

shown in Figure 8 where the maximum error occurs in the proximity of t = 10 s.

As concerns the difference exhibited from the voltage during the step‐up and the

step‐down of the current, it should be underlined that they depend both on the different

behavior of the electrolyzer and the different impedance of the power current supply. By

adopting a constant parameter emulator, as in this paper, as a load for testing power con‐

verters, this behavior does not affect the stability. Indeed, the assumption of the same dy‐

namic profiles is sufficient to study the transfer function of a power converter loaded by

an emulator [25].

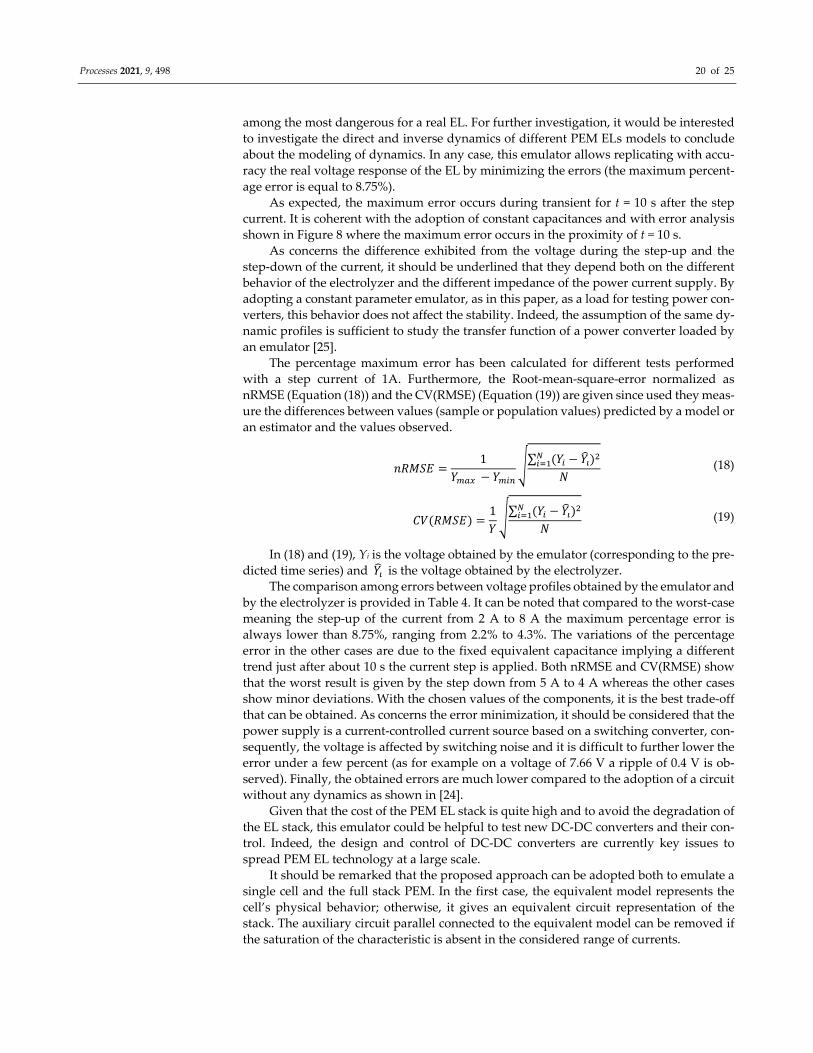
The percentage maximum error has been calculated for different tests performed

with a step current of 1A. Furthermore, the Root‐mean‐square‐error normalized as

nRMSE (Equation (18)) and the CV(RMSE) (Equation (19)) are given since used they meas‐

ure the differences between values (sample or population values) predicted by a model or

an estimator and the values observed.

𝑛𝑅𝑀𝑆𝐸1

𝑌 𝑌∑ 𝑌 𝑌

𝑁 (18)

𝐶𝑉 𝑅𝑀𝑆𝐸1𝑌

∑ 𝑌 𝑌𝑁

(19)

In (18) and (19), Yi is the voltage obtained by the emulator (corresponding to the pre‐

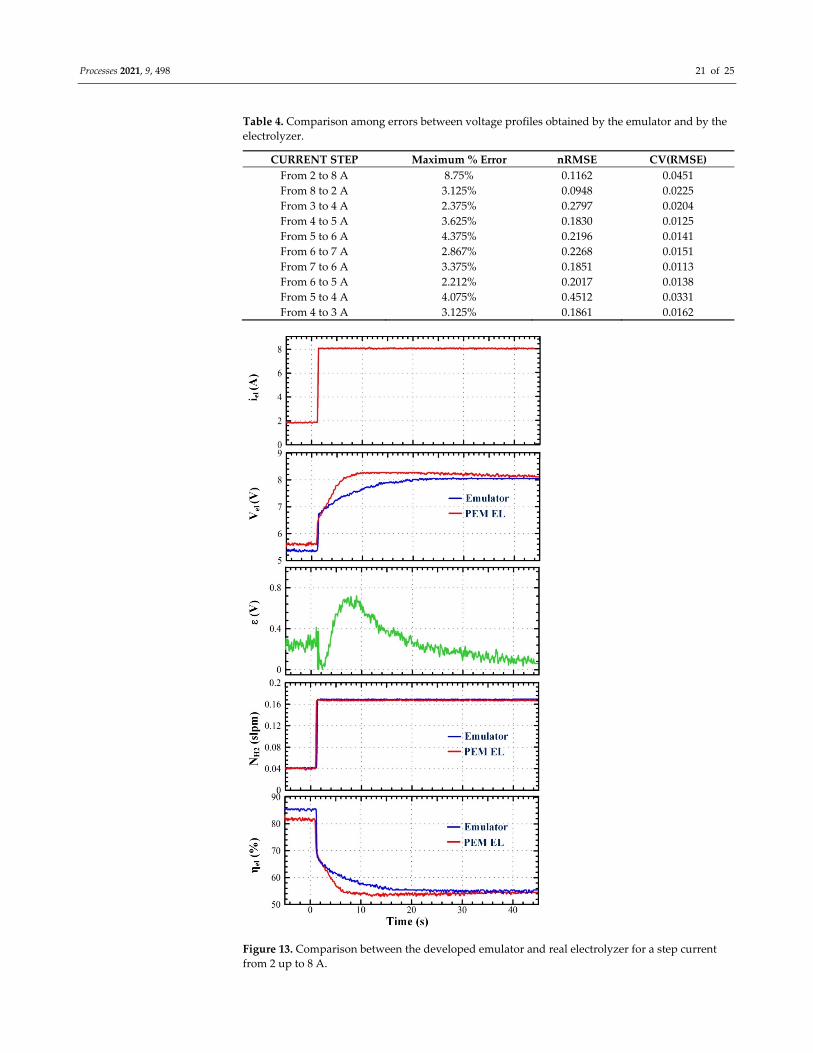
dicted time series) and 𝑌 is the voltage obtained by the electrolyzer. The comparison among errors between voltage profiles obtained by the emulator and

by the electrolyzer is provided in Table 4. It can be noted that compared to the worst‐case

meaning the step‐up of the current from 2 A to 8 A the maximum percentage error is

always lower than 8.75%, ranging from 2.2% to 4.3%. The variations of the percentage

error in the other cases are due to the fixed equivalent capacitance implying a different

trend just after about 10 s the current step is applied. Both nRMSE and CV(RMSE) show

that the worst result is given by the step down from 5 A to 4 A whereas the other cases

show minor deviations. With the chosen values of the components, it is the best trade‐off

that can be obtained. As concerns the error minimization, it should be considered that the

power supply is a current‐controlled current source based on a switching converter, con‐

sequently, the voltage is affected by switching noise and it is difficult to further lower the

error under a few percent (as for example on a voltage of 7.66 V a ripple of 0.4 V is ob‐

served). Finally, the obtained errors are much lower compared to the adoption of a circuit

without any dynamics as shown in [24].

Given that the cost of the PEM EL stack is quite high and to avoid the degradation of

the EL stack, this emulator could be helpful to test new DC‐DC converters and their con‐

trol. Indeed, the design and control of DC‐DC converters are currently key issues to

spread PEM EL technology at a large scale.

It should be remarked that the proposed approach can be adopted both to emulate a

single cell and the full stack PEM. In the first case, the equivalent model represents the

cell’s physical behavior; otherwise, it gives an equivalent circuit representation of the

stack. The auxiliary circuit parallel connected to the equivalent model can be removed if

the saturation of the characteristic is absent in the considered range of currents.

Processes 2021, 9, 498 21 of 25

Table 4. Comparison among errors between voltage profiles obtained by the emulator and by the

electrolyzer.

CURRENT STEP Maximum % Error nRMSE CV(RMSE)

From 2 to 8 A 8.75% 0.1162 0.0451

From 8 to 2 A 3.125% 0.0948 0.0225

From 3 to 4 A 2.375% 0.2797 0.0204

From 4 to 5 A 3.625% 0.1830 0.0125

From 5 to 6 A 4.375% 0.2196 0.0141

From 6 to 7 A 2.867% 0.2268 0.0151

From 7 to 6 A 3.375% 0.1851 0.0113

From 6 to 5 A 2.212% 0.2017 0.0138

From 5 to 4 A 4.075% 0.4512 0.0331

From 4 to 3 A 3.125% 0.1861 0.0162

Figure 13. Comparison between the developed emulator and real electrolyzer for a step current

from 2 up to 8 A.

Processes 2021, 9, 498 22 of 25

Figure 14. Comparison between the developed emulator and real electrolyzer for a step current

drop from 8 down to 2 A.

7. Conclusions

The main objective of this work was to design and realize a PEM electrolyzer emula‐

tor prototype, including the dynamic behavior, to avoid the use of a real PEM electrolyzer,

which could be damaged during experiments. The PEM electrolyzer emulator is based on

an equivalent electrical model allowing modeling the dynamics of the electrolyzer as a

result of step current. The comparison between the voltage response obtained with the

emulator and the real electrolyzer has shown a satisfactorily agreement; despite non‐neg‐

ligible errors on the voltage that have been noticed during the transient state, the proposed

circuit, used as a load, improves the accuracy of the behavior of a power converter sup‐

plying an electrolyzer. The voltage error is higher when decreasing the current since the

dynamics of the electrolyzer are very specific and complex to model. Furthermore, by us‐

ing a DS1104 controller board, the hydrogen flow rate and energy efficiency of the elec‐

trolyzer can be assessed in real‐time. The realized emulator is very helpful to carry out

Processes 2021, 9, 498 23 of 25

experiments. Indeed, it can be used for different purposes such as experimenting with

new DC‐DC converters and their control. Design and control of DC‐DC converters are

currently challenging issues so that the PEM electrolyzer can access a larger market. The

main advantages of this PEM electrolyzer emulator are its simplicity and cheap cost (since

it adopts components normally available on the market), compared to the reported PEM

electrolyzer emulators mainly based on power electronics. These emulators are more com‐

plex to the practical realization due to the design and sizing of the DC‐DC converter in‐

cluding its control. On the other hand, a trade‐off is necessary to reproduce transients in

different operating conditions to minimize the error between the real system and the em‐

ulator, since the emulator reproduces in the same way both step up and step down tran‐

sients. From the perspective of this work, it would be interested to enhance the effective‐

ness of the emulator in reproducing accurately the inverse dynamics when decreasing the

current. In addition, the proposed approach can be used both for emulating a single cell

or the whole stack.

Author Contributions: conceptualization, B.Y., D.G., M.P., W.K., M.H., and G.V.; methodology,

B.Y., D.G., M.P., W.K., M.H., and G.V.; validation, B.Y. and D.G.; investigation, B.Y. and D.G.; writ‐

ing—original draft preparation, D.G.; writing—review and editing, B.Y. and D.G. All authors have

read and agreed to the published version of the manuscript.

Funding: This research work is financially supported by the Office of the Higher Education Com‐

mission of Thailand and King Mongkut’s University of Technology North Bangkok, Thailand. Con‐

tract no. KMUTNB‐NRU‐57‐09.

Institutional Review Board Statement: Not applicable.

Informed Consent Statement: Not applicable.

Data Availability Statement: The data presented in this study are available on request from the

corresponding author. The data are not publicly available due to their current utilization for future

works involving the authors of this paper.

Acknowledgments: The authors would like to thank sincerely the French Embassy in Bangkok

(Thailand) and Campus France in supporting Burin Yodwong’s Thesis within the framework of the

Franco‐Thai scholarship program. In addition, the authors are very thankful to Serge Merafina, tech‐

nician at the IUT de Longwy, for his valuable help and advice to design and realize the PEM elec‐

trolyzer emulator. Finally, this work was supported partly by the french PIA project «Lorraine Uni‐

versité d’Excellence», reference ANR‐15‐IDEX‐04‐LUE.

Conflicts of Interest: The authors declare no conflict of interest.

References

1. Nikolaidis, P.; Poullikkas, A. A comparative overview of hydrogen production processes. Renew. Sustain. Energy Rev. 2017, 67,

597–611, doi:10.1016/j.rser.2016.09.044.

2. Available online: https://www.hydrogen.energy.gov/annual_review19_report.htm (accessed on 21 January 2021).

3. Kumar, S.S.; Himabindu, V. Hydrogen production by PEM water electrolysis—A review. Mater. Sci. Energy Technol. 2019, 2,

442–454, doi:10.1016/j.mset.2019.03.002.

4. David, M.; Ocampo‐Martínez, C.; Sánchez‐Peña, R. Advances in alkaline water electrolyzers: A review. J. Energy Storage 2019,

23, 392–403, doi:10.1016/j.est.2019.03.001.

5. Millet, P.; Grigoriev, S. Water Electrolysis Technologies. Renew. Hydrog. Technol. 2013, 19–41, doi:10.1016/b978‐0‐444‐56352‐

1.00002‐7.

6. Mohammadi, A.; Mehrpooya, M. A comprehensive review on coupling different types of electrolyzer to renewable energy

sources. Energy 2018, 158, 632–655, doi:10.1016/j.energy.2018.06.073.

7. Lee, C.‐Y.; Chen, C.‐H.; Li, S.‐C.;

8. Wang, Y.‐S. Development and application of flexible integrated microsensor as real‐time monitoring tool in proton exchange

membrane water electrolyzer. Renew. Energy 2019, 143, 906–914, doi:10.1016/j.renene.2019.05.071.

9. Sharifian, S.; Kolur, N.A.; Harasek, M. Transient simulation and modeling of photovoltaic‐PEM water electrolysis. Energy

Sources Part A Recover. Util. Environ. Eff. 2019, 42, 1097–1107, doi:10.1080/15567036.2019.1602220.

10. Heris, M.‐N.; Mirzaei, M.A.; Asadi, S.; Mohammadi‐Ivatloo, B.; Zare, K.; Jebelli, H.; Marzband, M. Evaluation of hydrogen

storage technology in risk‐constrained stochastic scheduling of multi‐carrier energy systems considering power, gas and heat‐

ing network constraints. Int. J. Hydrog. Energy 2020, 45, 30129–30141, doi:10.1016/j.ijhydene.2020.08.090.

Processes 2021, 9, 498 24 of 25

11. Szima, S.; Cormos, C.‐C. Techno—Economic assessment of flexible decarbonized hydrogen and power co‐production based on

natural gas dry reforming. Int. J. Hydrog. Energy 2019, 44, 31712–31723, doi:10.1016/j.ijhydene.2019.10.115.

12. Liu, B.; Liu, S.; Guo, S.; Zhang, S. Economic study of a large‐scale renewable hydrogen application utilizing surplus renewa‐ble

energy and natural gas pipeline transportation in China. Int. J. Hydrog. Energy 2020, 45, 1385–1398.

13. Acar, C.; Dincer, I. The potential role of hydrogen as a sustainable transportation fuel to combat global warming. Int. J. Hydrog.

Energy 2020, 45, 3396–3406, doi:10.1016/j.ijhydene.2018.10.149.

14. Li, Q.; Yang, W.; Yin, L.; Chen, W. Real‐Time Implementation of Maximum Net Power Strategy Based on Sliding Mode Vari‐

able Structure Control for Proton‐Exchange Membrane Fuel Cell System. IEEE Trans. Transp. Electrif. 2020, 6, 288–297.

15. Laghrouche, S.; Liu, J.; Ahmed, F.S.; Harmouche, M.; Wack, M. Adaptive Second‐Order Sliding Mode Observer‐Based Fault

Reconstruction for PEM Fuel Cell Air‐Feed System. IEEE Trans. Control. Syst. Technol. 2015, 23, 1098–1109,

doi:10.1109/tcst.2014.2361869.

16. Li, Q.; Su, B.; Pu, Y.; Han, Y.; Wang, T.; Yin, L.; Chen, W. A State Machine Control Based on Equivalent Consumption Mini‐

mization for Fuel Cell/ Supercapacitor Hybrid Tramway. IEEE Trans. Transp. Electrif. 2019, 5, 552–564.

17. Liu, J.; Gao, Y.; Su, X.; Wack, M.; Wu, L. Disturbance‐Observer‐Based Control for Air Management of PEM Fuel Cell Systems

via Sliding Mode Technique. IEEE Trans. Control Syst. Technol. 2019, 27, 1129–1138, doi:10.1109/tcst.2018.2802467.

18. Samosir, A.S.; Anwari, M.; Yatim, A.H.M. A simple PEM fuel cell emulator using electrical circuit model. In Proceedings of the

2010 Conference Proceedings IPEC, Singapore, 27–29 October 2010.

19. Marsala, G.; Pucci, M.; Vitale, G.; Cirrincione, M.; Miraoui, A. A prototype of a fuel cell PEM emulator based on a buck con‐

verter. Appl. Energy 2009, 86, 2192–2203.

20. Fei, G.; Blunier, B.; Miraoui, A. PEM Fuel Cell Stack Modeling for Real‐Time Emulation in Hardware‐in‐the‐Loop Applica‐tions.

IEEE Trans. Energy Convers. 2011, 26, 184–194.

21. Rezzak, D.; Khoucha, F.; Benbouzid, M.; Kheloui, A.; Mamoune, A. A DC‐DC converter‐based PEM fuel cell system emulator.

In Proceedings of the 2011 International Conference on Power Engineering, Energy and Electrical Drives, Malaga, Spain, 11–13

May 2011.

22. García‐Vite, P.M.; Reyes‐García, B.L.; Valdez‐Hernández, C.L.; Martínez‐Salazar, A. Microcontroller‐based emulation of a PEM

fuel cell. Int. J. Hydrog. Energy 2020, 45, 13767–13776, doi:10.1016/j.ijhydene.2019.10.034.

23. Ruuskanen, V.; Koponen, J.; Huoman, K.; Kosonen, A.; Niemelä, M.; Ahola, J. PEM water electrolyzer model for a pow‐er‐

hardware‐in‐loop simulator. Int. J. Hydrog. Energy 2017, 42, 10775–10784.

24. Zhou, T.; Francois, B. Modeling and control design of hydrogen production process for an active hydrogen/wind hybrid power

system. Int. J. Hydrog. Energy 2009, 34, 21–30, doi:10.1016/j.ijhydene.2008.10.030.

25. Guilbert, D.; Vitale, G. Dynamic Emulation of a PEM Electrolyzer by Time Constant Based Exponential Model. Energies 2019,

12, 750, doi:10.3390/en12040750.

26. Guilbert, D.; Sorbera, D.; Vitale, G. A stacked interleaved DC‐DC buck converter for proton exchange membrane electrolyzer

applications: Design and experimental validation. Int. J. Hydrog. Energy 2020, 45, 64–79, doi:10.1016/j.ijhydene.2019.10.238.

27. Ayop, R.; Tan, C.W. A comprehensive review on photovoltaic emulator. Renew. Sustain. Energy Rev. 2017, 80, 430–452,

doi:10.1016/j.rser.2017.05.217.

28. Mai, T.D.; De Breucker, S.; Baert, K.; Driesen, J. Reconfigurable emulator for photovoltaic modules under static partial shading

conditions. Sol. Energy 2017, 141, 256–265, doi:10.1016/j.solener.2016.11.050.

29. Di Piazza, M.C.; Vitale, G. Photovoltaic field emulation including dynamic and partial shadow conditions. Appl. Energy 2010,

87, 814–823, doi:10.1016/j.apenergy.2009.09.036.

30. Di Piazza, M.; Ragusa, A.; Vitale, G. Identification of photovoltaic array model parameters by robust linear regression methods.

Renew. Energy Power Qual. J. 2009, 1, 143–149.

31. Ayop, R.; Tan, C.W. Rapid Prototyping of Photovoltaic Emulator Using Buck Converter Based on Fast Convergence Resistance

Feedback Method. IEEE Trans. Power Electron. 2019, 34, 8715–8723, doi:10.1109/tpel.2018.2886927.

32. Schofield, D.; Foster, M.; Stone, D. Low‐cost solar emulator for evaluation of maximum power point tracking methods. Electron.

Lett. 2011, 47, 208–209, doi:10.1049/el.2010.2930.

33. Kim, Y.; Lee, W.; Pedram, M.; Chang, N. Dual‐mode power regulator for photovoltaic module emulation. Appl. Energy 2013,

101, 730–739, doi:10.1016/j.apenergy.2012.07.025.

34. De Beer, C.; Barendse, P.; Khan, A. Development of an HT PEM Fuel Cell Emulator Using a Multiphase Interleaved DC–DC

Converter Topology. IEEE Trans. Power Electron. 2012, 28, 1120–1131, doi:10.1109/TPEL.2012.2208481.

35. Kwan, T.H.; Yao, Q. A Cost Effective Experimental Emulator for Fuel Cell Based Combined Heat and Power Systems. Energy

Procedia 2019, 158, 1437–1448, doi:10.1016/j.egypro.2019.01.347.

36. Li, T.; Chen, Y.; Gou, H.Y.; Chen, X.Y.; Tang, M.G.; Lei, Y. A DC Voltage Swell Compensator Based on SMES Emulator and

Lead‐Acid Battery. IEEE Trans. Appl. Supercond. 2019, 29, 1–4, doi:10.1109/tasc.2019.2894017.

37. Farag, S.; Lerman, C.; Lineykin, S.; Kuperman, A. Off‐the‐Shelf Power Supply‐Based Battery/Supercapacitor Emulator for

Charger Functionality Testing. IEEE Trans. Transp. Electrif. 2016, 2, 129–139, doi:10.1109/tte.2016.2543965.

38. Cirrincione, M.; Pucci, M.; Vitale, G. Growing Neural Gas (GNG)‐Based Maximum Power Point Tracking for High‐Performance

Wind Generator With an Induction Machine. IEEE Trans. Ind. Appl. 2011, 47, 861–872, doi:10.1109/TIA.2010.2102994.

39. Mohammadi, E.; Fadaeinedjad, R.; Naji, H.R. Using a new wind turbine emulator to analyze tower shadow and yaw error

effects. Energy Convers. Manag. 2018, 174, 378–387, doi:10.1016/j.enconman.2018.08.049.

Processes 2021, 9, 498 25 of 25

40. Ashourianjozdani, M.; Lopes, L.; Pillay, P. Power Electronic Converter Based PMSG Emulator: A Testbed for Renewable En‐

ergy Experiments. IEEE Trans. Ind. Appl. 2018, 54, 3626–3636.

41. Wollz, D.H.; da Silva, S.A.O.; Sampaio, L.P. Real‐time monitoring of an electronic wind turbine emulator based on the dynamic

PMSG model using a graphical interface. Renew. Energy 2020, 155, 296–308, doi:10.1016/j.renene.2020.03.096.

42. Duran, E.; Andújar, J.; Segura, F.; Barragán, A.; Andujar‐Márquez, J.M.; Piña, A.J.B. A high‐flexibility DC load for fuel cell and

solar arrays power sources based on DC–DC converters. Appl. Energy 2011, 88, 1690–1702, doi:10.1016/j.apenergy.2010.11.002.

43. Rao, Y.S.; Chandorkar, M.C. Real‐Time Electrical Load Emulator Using Optimal Feedback Control Technique. IEEE Trans. Ind.

Electron. 2009, 57, 1217–1225, doi:10.1109/tie.2009.2037657.

44. Wang, J.; Yang, L.; Ma, Y.; Wang, J.; Tolbert, L.M.; Wang, F.; Tomsovic, K. Static and dynamic power system load emulation in

a converter‐based reconfigurable power grid emulator. In Proceedings of the 2014 IEEE Energy Conversion Congress and

Exposition (ECCE), Pittsburgh, PA, USA, 14–18 September 2014.

45. Kesler, M.; Ozdemir, E.; Kisacikoglu, M.C.; Tolbert, L.M. Power Converter‐Based Three‐Phase Nonlinear Load Emulator for a

Hardware Testbed System. IEEE Trans. Power Electron. 2014, 29, 5806–5812, doi:10.1109/tpel.2014.2301815.

46. Vijay, A.S.; Chandorkar, M.C.; Doolla, S. A System Emulator for AC Microgrid Testing. IEEE Trans. Ind. Appl. 2019, 55, 6538–

6547, doi:10.1109/tia.2019.2942275.

47. Yodwong, B.; Guilbert, D.; Phattanasak, M.; Kaewmanee, W.; Hinaje, M.; Vitale, G. AC‐DC Converters for Electrolyzer Ap‐

plications: State of the Art and Future Challenges. Electronics 2020, 9, 912.

48. Yodwong, B.; Guilbert, D.; Phattanasak, M.; Kaewmanee, W.; Hinaje, M.; Vitale, G. Proton Exchange Membrane Electrolyzer

Modeling for Power Electronics Control: A Short Review. C J. Carbon Res. 2020, 6, 29, doi:10.3390/c6020029.

49. Falcão, D.; Pinto, A. A review on PEM electrolyzer modelling: Guidelines for beginners. J. Clean. Prod. 2020, 261, 121184,

doi:10.1016/j.jclepro.2020.121184.

50. Fontes, G.; Turpin, C.; Astier, S.; Meynard, T.A. Interactions Between Fuel Cells and Power Converters: Influence of Current

Harmonics on a Fuel Cell Stack. IEEE Trans. Power Electron. 2007, 22, 670–678, doi:10.1109/tpel.2006.890008.

51. Wahdame, B.; Girardot, L.; Hissel, D.; Harel, F.; François, X.; Candusso, D.; Péra, M.C.; Dumercy, L. Impact of power converter

current ripple on the durability of a fuel cell stack. In Proceedings of the 2008 IEEE International Symposium on Industrial

Electronics, Cambridge, UK, 30 June–2 July 2008.

52. Gemmen, R.S. Analysis for the Effect of Inverter Ripple Current on Fuel Cell Operating Condition. J. Fluids Eng. 2003, 125, 576–

585, doi:10.1115/1.1567307.

53. Zhan, Y.; Guo, Y.; Zhu, J.; Liang, B.; Yang, B. Comprehensive influences measurement and analysis of power converter low

frequency current ripple on PEM fuel cell. Int. J. Hydrog. Energy 2019, 44, 31352–31359, doi:10.1016/j.ijhydene.2019.09.231.

54. Ursúa, A.; Marroyo, L.; Gubía, E.; Gandia, L.M.; Dieguez, P.M.; Sanchis, P. Influence of the power supply on the energy effi‐

ciency of an alkaline water electrolyser. Int. J. Hydrog. Energy 2009, 34, 3221–3233, doi:10.1016/j.ijhydene.2009.02.017.

55. Ursúa, A.; Sanchis, P.; Marroyo, L. Electric Conditioning and Efficiency of Hydrogen Production Systems and Their Integra‐

tion with Renewable Energies. In Renewable Hydrogen Technologies, Elsevier; 2013; pp. 333–360. Available online: https://www.sci‐

encedirect.com/science/article/pii/B9780444563521000143 (accessed on 9 March 2021).

56. Guilbert, D.; Vitale, G. Variable Parameters Model of a PEM Electrolyzer Based Model Reference Adaptive System Approach.

In Proceedings of the 2020 IEEE International Conference on Environment and Electrical Engineering and 2020 IEEE Industrial

and Commercial Power Systems Europe (EEEIC/I&CPS Europe), Madrid, Spain, 9–12 June 2020.

57. Pukrushpan, J.T. Modeling and Control of Fuel Cell Systems and Fuel Processors. Ph.D. Thesis, The University of Michigan,

Ann Arbor, MI, USA, 2003.

58. Ayivor, P.K.S.; Torres, J.; van der Meijden, R. Pluijm and B. Stouwie. Modelling of Large Size Electrolyzer for Electrical Grid

Stability Studies in Real Time Digital Simulation. In Proceedings of the 3rd International Hybrid Power Systems Workshop,

Tenerife, Spain, 8–9 May 2018.

59. Ulleberg, O. Modeling of advanced alkaline electrolyzers: A system simulation approach. Int. J. Hydrog. Energy 2003, 28, 21–33,

doi:10.1016/s0360‐3199(02)00033‐2.


Recommended