91
Province Lake Watershed Plan Final Presentation Province Lake 2014 Annual Meeting Province Lake Golf Club July 19, 2014

Province Lake Watershed Plan Final Presentation
Province Lake 2014 Annual Meeting Province Lake Golf Club
July 19, 2014

PRESENTATION AGENDA
i. Overview- Description of the Watershed Planning Process (Forrest Bell, FB Environmental)
ii. Water Quality & Sources of Pollution
(Jennifer Jespersen, FB Environmental)
iii. Water Quality Goal & Actions Needed (Forrest Bell)
iv. Funding the Plan and Measuring Success (Forrest Bell)
v. Next Steps (Linda Schier, AWWA and Sally Soule NH DES)
vi. Questions/Discussion (Watershed Citizens)

Your Lake is Precious.

What is a Watershed?
A watershed is an area of land that drains into a lake or river.
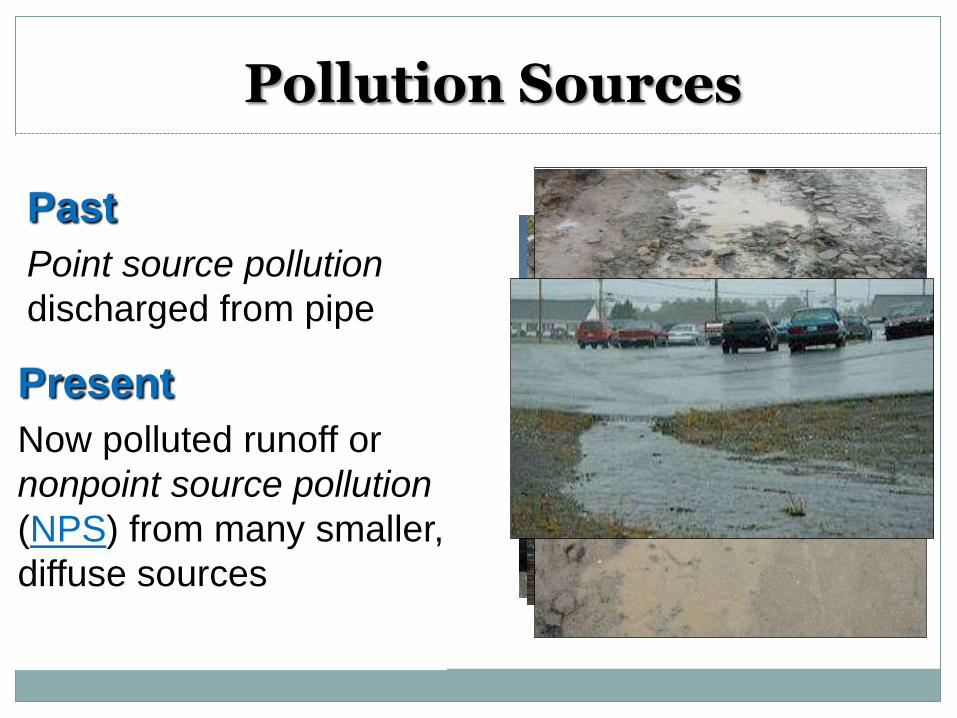
Pollution Sources
Past
Point source pollution
discharged from pipe
Present
Now polluted runoff or
nonpoint source pollution
(NPS) from many smaller,
diffuse sources

The Trophic Scale of Lakes
Oligotrophic Mesotrophic Eutrophic
Low Nutrients
High Nutrients

The Trophic Scale of Lakes
Oligotrophic Mesotrophic Eutrophic
DES has total phosphorus thresholds for general lake assessment in NH.
NH DES: 8 ppb
NH DES:
12 ppb
Every lake is different. Trophic condition is evaluated with a variety of methods.
Province 14.3 ppb

10,000’s YEARS IN NATURAL CONDITIONS
10’s to 100’s YEARS UNDER HUMAN INFLUENCE
Speeding aging of lakes

Phosphorus
Phosphorus is one of the major nutrients needed for plant growth.
Naturally present in small amounts.
Generally, as phosphorus increases, the amount of algae also increases.
Too Much P= Algae Blooms, Low DO, Fish Kills!
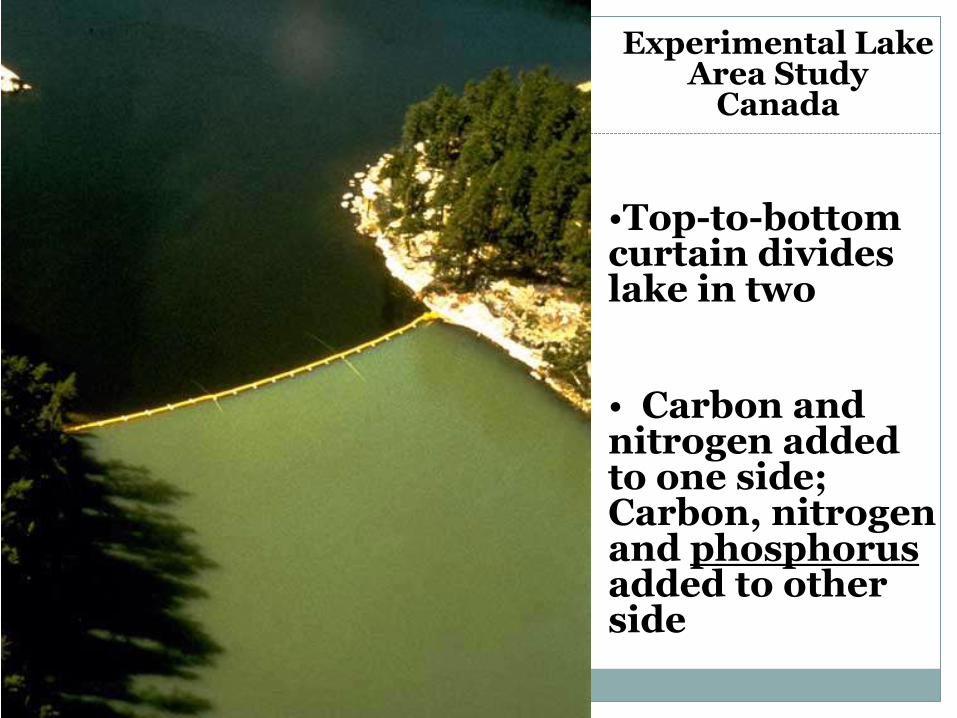
Experimental Lake Area Study
Canada
•Top-to-bottom curtain divides lake in two
• Carbon and nitrogen added to one side; Carbon, nitrogen and phosphorus added to other side

A Quick Note about Measuring Phosphorus…
100 kg of Phosphorus or 220 pounds = 7.8 28-lb bags of Rock Phosphate Fertilizer*
(1 kilogram = 2.2 pounds)
*23.99 ea. From eLawnGarden.com

So what – that doesn’t seem like much!
Soil in this area is about 0.02% Phosphorus*
•As much as 420 tons per year of sediment per year estimated to reach
Province Lake.
•220 lbs of P would be found in these 42 dump trucks of soil that may
reach the lake EACH YEAR!
*(San Clements et al., 2010)

Forested Watershed
Developed Watershed
5 to 10 times the amount of phosphorus
in the runoff from the developed area.

Water Quality & Property Values
Declining property values
affect individual landowners
and economics of entire
communities.
With property rights comes
property responsibility.

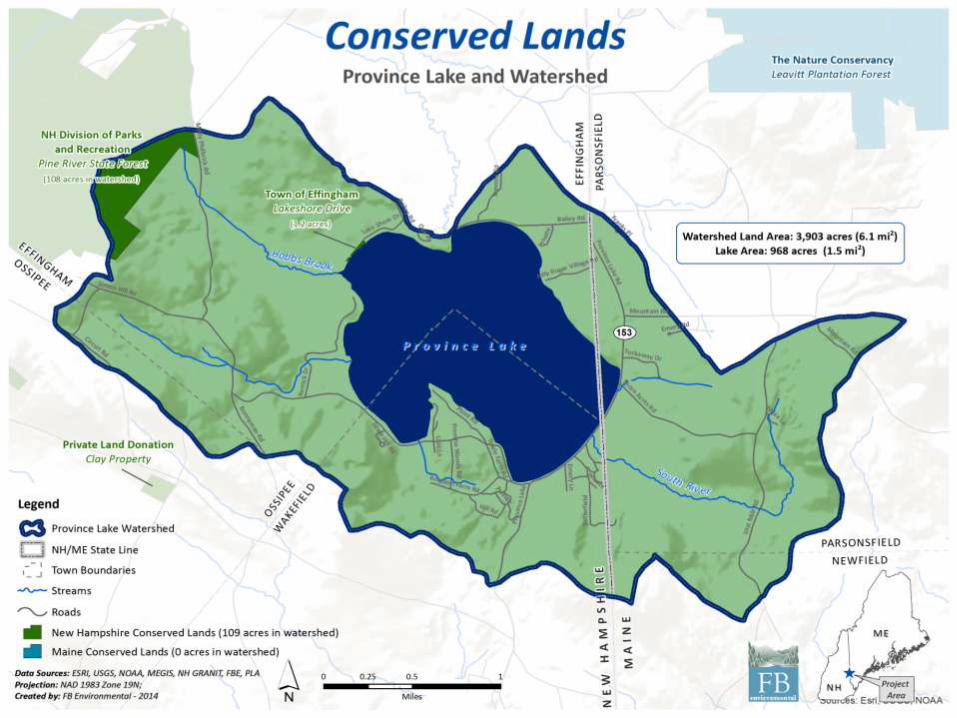
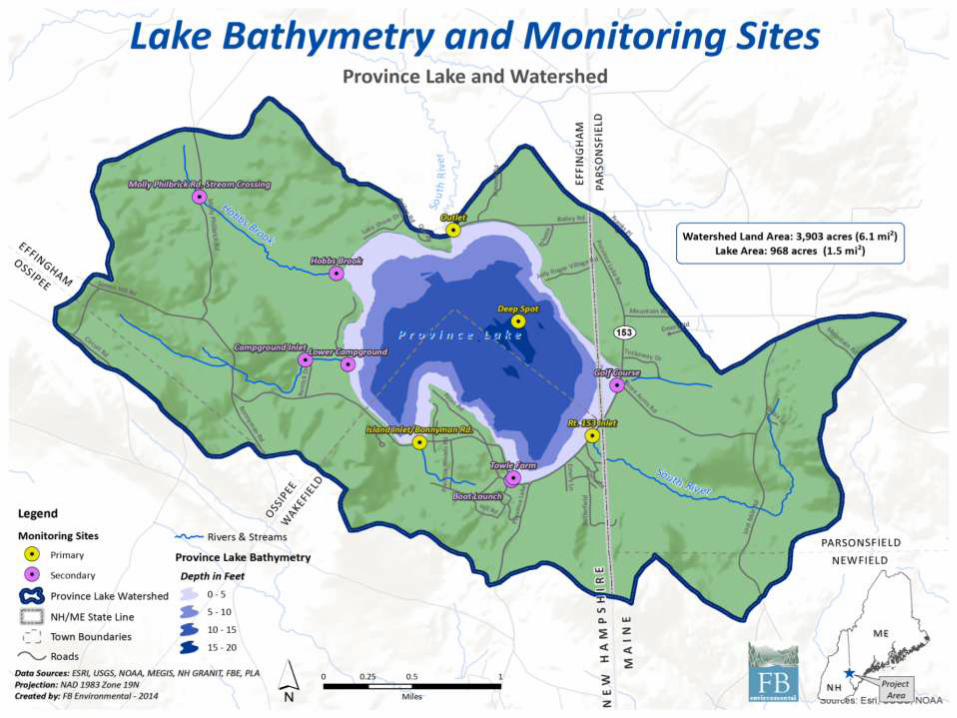
Physical Characteristics
Province Lake
2 States, 3 Towns
Lake Area ~ 967 acres
Watershed – 3903 acres
Avg. depth – 9 feet
Max. depth – 16 feet
Low Flushing Rate- 1.1/year
Shallow, non-stratified –
wind driven system
Small Watershed relative to
lake surface area

A Rapidly Growing Region
Town 1960 1970 1980 1990 2000 2010Numeric Change
1960–2010
Percent Change
1960–2010
Average Annual
Growth Rate
Parsonsfield, ME 869 971 1,089 1,472 1,584 1,898 1,029 118% 1.18%
Wakefield, NH 1,223 1,420 2,237 3,057 4,252 5,078 3,855 315% 3.15%
Effingham, NH 329 360 599 941 1,273 1,465 1,136 345% 3.45%
Combined 2,421 2,751 3,925 5,470 7,109 8,441 6,020 249% 2.49%


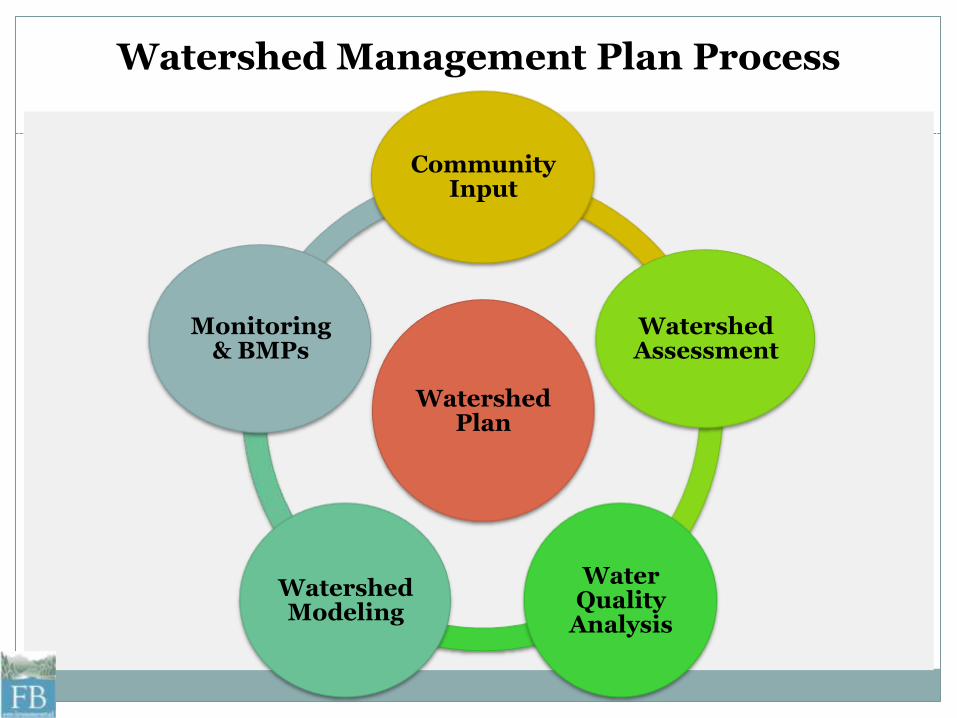
Watershed Management Plan Process
Watershed Plan
Community Input
Watershed Assessment
Water Quality
Analysis
Watershed Modeling
Monitoring & BMPs

Project Timeline
Started in March 2013
Completing in Summer
2014
Water Quality Analysis
Identify Pollutant Sources
Set Water Quality Goal
Finalize Management Plan
3 Public Meetings
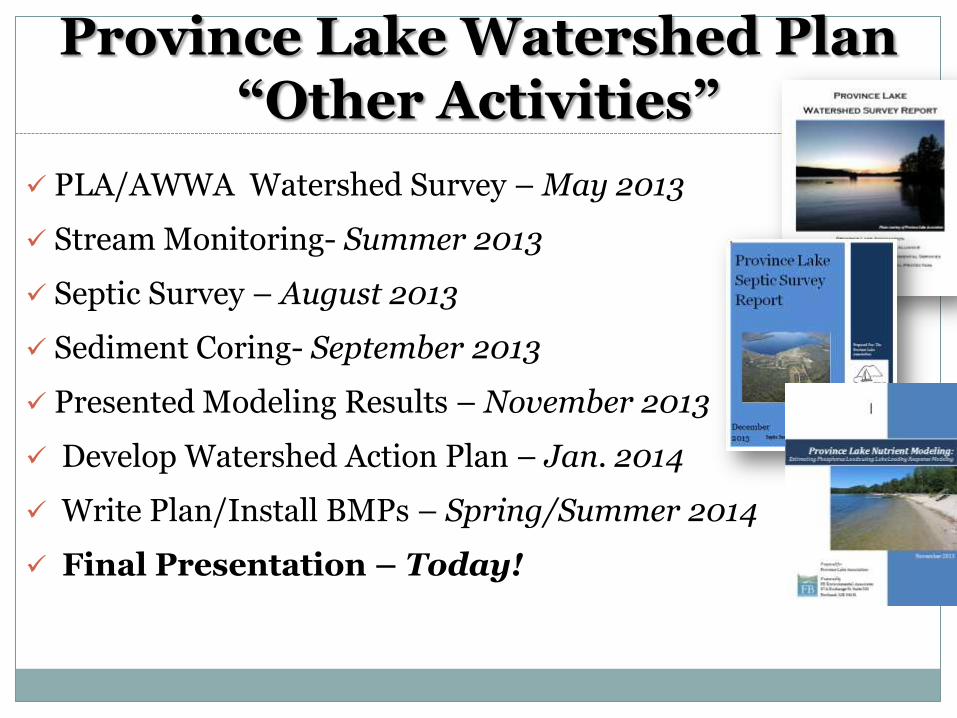
PLA/AWWA Watershed Survey – May 2013
Stream Monitoring- Summer 2013
Septic Survey – August 2013
Sediment Coring- September 2013
Presented Modeling Results – November 2013
Develop Watershed Action Plan – Jan. 2014
Write Plan/Install BMPs – Spring/Summer 2014
Final Presentation – Today!
Province Lake Watershed Plan “Other Activities”

Thank You Dr. Jim Haney!

Outstanding Public Participation

PROVINCE LAKE WATER QUALITY
SUMMARY & RECOMMENDATIONS

PROVINCE LAKE IS IMPAIRED!
ASSESSMENT OF WATER QUALITY
AQUATIC LIFE
pH Total Phosphorus Chl-a
FISH CONSUMPTION
Mercury
PRIMARY CONTACT RECREATION
Reoccurring Cyanobacteria Blooms “Scums”


Source: Jody Connor, NHDES
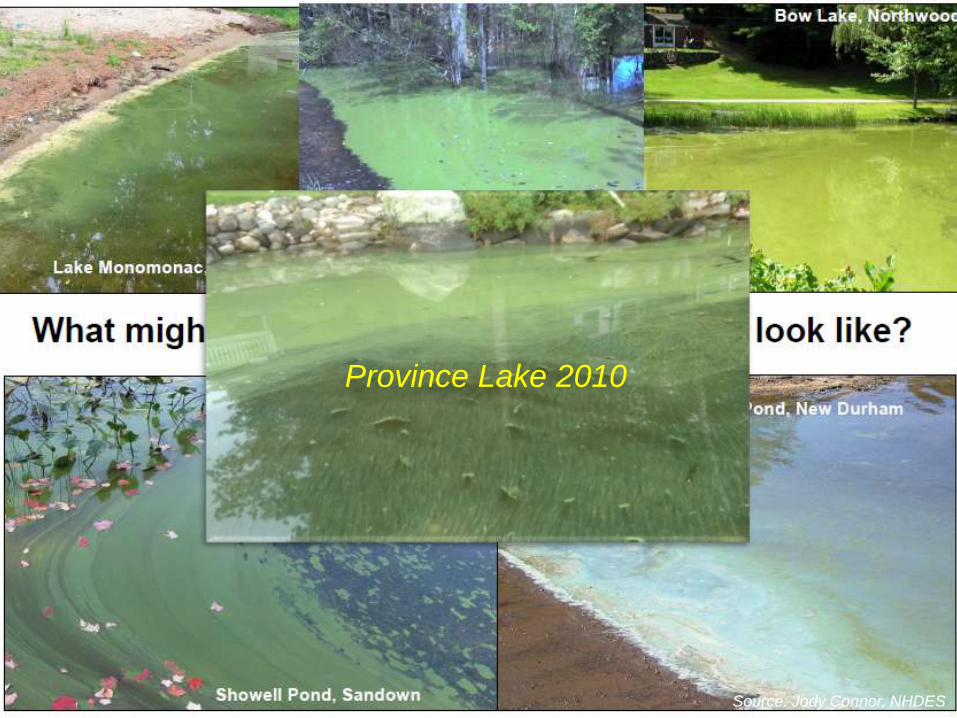
Source: Jody Connor, NHDES
Province Lake 2010

The Trophic Scale of Lakes
Oligotrophic Mesotrophic Eutrophic
Province 14.3 ppb
Low Nutrients
High Nutrients
“Dramatic Increase” Toxicity of
Phytoplankton 9 – 10 ppb
NH DES: 8 ppb
NH DES: 12 ppb

Shallow
Well-Mixed
Large Photic Zone
Long Fetch (Wind)

Lake Stratification
http://water.epa.gov
Source: gvsu.edu

WATER QUALITY ANALYSIS
Summarize WQ Data
Compare to WQ Standards
Present Trends
Provide Recommendations
Set a Reasonable
&
Achievable Target

WATER QUALITY ANALYSIS
Water Clarity (Secchi Disk Transparency or SDT)
Total Phosphorus (TP)
Chlorophyll-a (Chl-a)
Dissolved Oxygen & Temperature
Color, pH & Turbidity were also assessed
NO SILVER BULLET!
0
5
10
15
20
25
30
35
40
1979 1987 1991 1992 1993 1994 1995 1996 2006
(PC
U)
Historical Apparent Color
Deep Spot- Mean, Annual, Seasonal, Epilimnetic Province Lake, Effingham, NH
OTHER FACTORS:
Hurricane Irene (2011)
Hurricane Sandy (2012)

ASSESSMENT OF WATER QUALITY
“Nutrient Indicator” = Phosphorus
“Response Indicator” = Chlorophyll-a
TOO MUCH PHOSPHORUS!
Oligotrophic Mesotrophic Eutrophic
Province 14.3 ppb
Low Nutrients
High Nutrients
NH DES: 8 ppb
NH DES: 12 ppb

ASSESSMENT OF WATER QUALITY
“Nutrient Indicator” = Phosphorus
“Response Indicator” = Chlorophyll-a
TOO MUCH PHOSPHORUS!
Oligotrophic Mesotrophic Eutrophic
Province 10.8 ppb
Low Nutrients
High Nutrients
8 ppb 12 ppb
Province 14.3 ppb

WATER QUALITY GOAL
Prevent Cyanobacteria Blooms
Reduce In-lake Total Phosphorus
14.3 ppb to 10.8 ppb
25% reduction
1) Reasonable 2) Attainable 3) Scientifically-Sound

Phosphorus Load Model for Province Lake

Help Study Cause & Effect;
Make Predictions Using Different Pollutant Scenarios;
Used to Trace Water & Phosphorus through the Watershed.
Why Use Modeling?

Inputs:
Land Use
Septic Systems
Subwatershed boundaries
Bathymetry
Precipitation
Waterfowl
WQ data as “reality check”
What Goes Into a Model?
0
5
10
15
20
25
30
35
40
1979 1987 1991 1992 1993 1994 1995 1996 2006(P
CU
)
Historical Apparent Color
Deep Spot- Mean, Annual, Seasonal, Epilimnetic Province Lake, Effingham, NH

What Does the Model Tell Us?
Modeled TP concentration is 14.3 ppb
Same as Province Lake Measured Water Quality
Phosphorus Load Estimate: That’s 1,034 lbs P/year! 469 kg P/year

Where is all the “P” Coming From?
469 kg/year Phosphorus to Province Lake
Watershed Runoff 280 kg/yr 60%
Wastewater Systems 107 kg/yr 23%
Atmospheric 78 kg/yr 16%
Waterfowl 3.5 kg/yr 1%
Atmosphere 16% Waterfowl
1%
Wastewater 23%
Watershed Runoff
60%
By Category

What is the Greatest Source of P?
280 kg/year P from Watershed Runoff
Developed Land* 158 kg/yr 56%
Forests 107 kg/yr 38%
Agriculture 14 kg/yr 5%
Wetlands 2 kg/yr 1%
*Developed land covers 12% of the watershed, forests 84%.
Developed 56%
Agriculture 5%
Forest 38%
Wetlands 1%
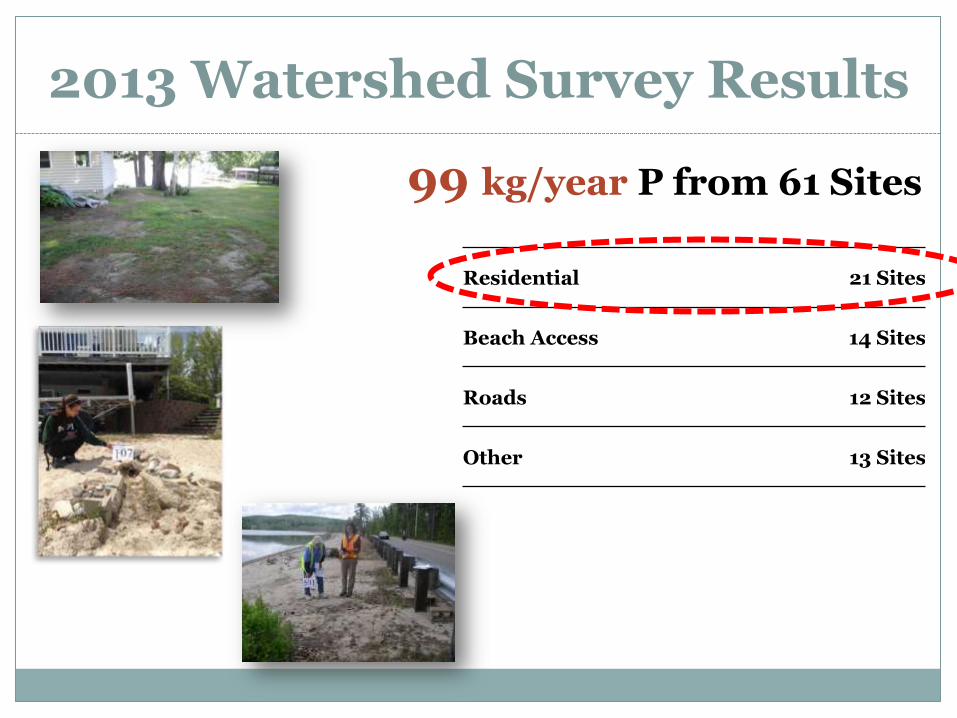
2013 Watershed Survey Results
99 kg/year P from 61 Sites
Residential 21 Sites
Beach Access 14 Sites
Roads 12 Sites
Other 13 Sites

2013 Watershed Survey Results
99 kg/year P from 61 Sites
Residential 21 Sites
Beach Access 14 Sites
Roads 12 Sites
Other 13 Sites
Prioritized – TOP 20


“P” from Wastewater
469 kg/year Phosphorus to Province Lake
Watershed Runoff 280 kg/yr 60%
Wastewater Systems 107 kg/yr 23%
Atmospheric 78 kg/yr 16%
Waterfowl 3.5 kg/yr 1%
Atmosphere 16% Waterfowl
1%
Wastewater 23%
Watershed Runoff
60%
By Category

2013 Septic Survey Results
Provides a “Snapshot” of Systems (220 Responses)
2nd Largest Source of P to Lake
HIGH % of OLD SYSTEMS (>25 Years)
HIGH # of “Non-Septic” systems

Wastewater Breakdown
107 kg/year P from wastewater systems
16.8
48.3
38.9
0.02 3.2
0
5
10
15
20
25
30
35
40
45
50
Ph
os
ph
or
us
(k
g/y
ea
r)
P Load by System Type
81% of wastewater load from septics >25 yr old, cesspools,
outhouses.

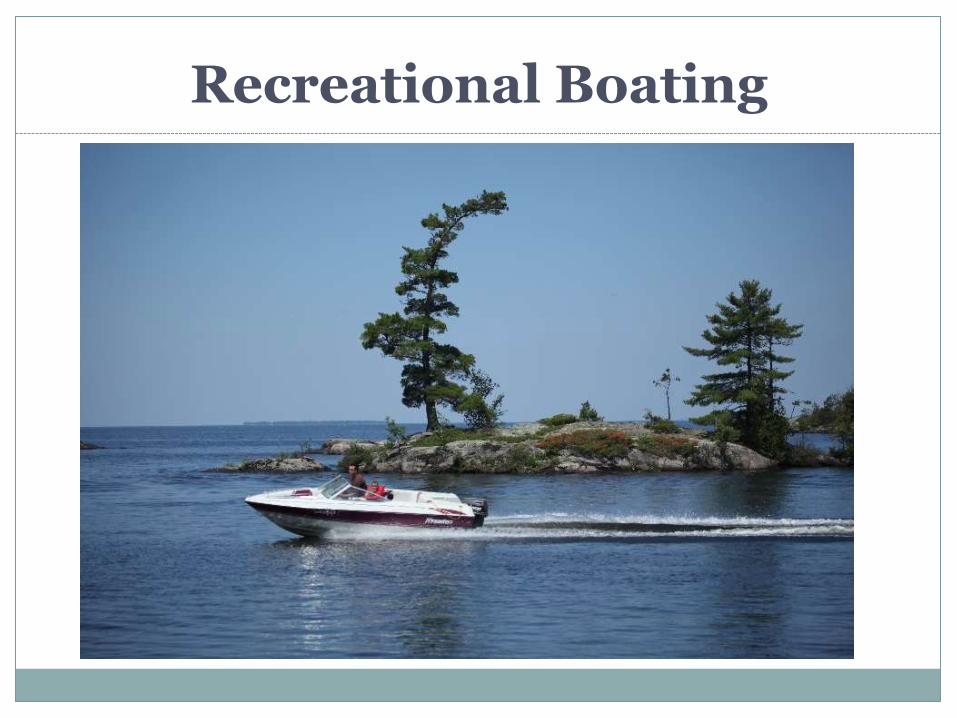
Recreational Boating

Boat Induced Turbulence:
Rapid increase in turbidity & available phosphorus
Increased algal growth
Degradation of light climate
Recreational boat traffic may lead to: Persistence of elevated trophic status
Domination of the phytoplankton community by harmful cyanobacteria

What About Future Sources of P?
www.syringarealty.com

Province Lake Buildout Analysis
How Much?
• Under current zoning, how much land is currently available for development?
Where &
When?
• How will the town’s appearance change over time?
Effects?
• What effect will the development have on Province Lake?

Buildout Analysis - Inputs
Buildout Results
Growth Rates
Zoning
Existing Buildings
Development Constraints
Assumptions

Buildout Results Total Buildable Land
Total Buildable Area Province Lake Watershed
3,591 acres*
2,347 acres of buildable land (65% of total area)
*Excludes area encompassed by Ossipee and Newfield
Buildable Area by Town Wakefield – 501 ac. (75%) Effingham – 1,142 ac. (66%) Parsonsfield – 704 ac. (60%)
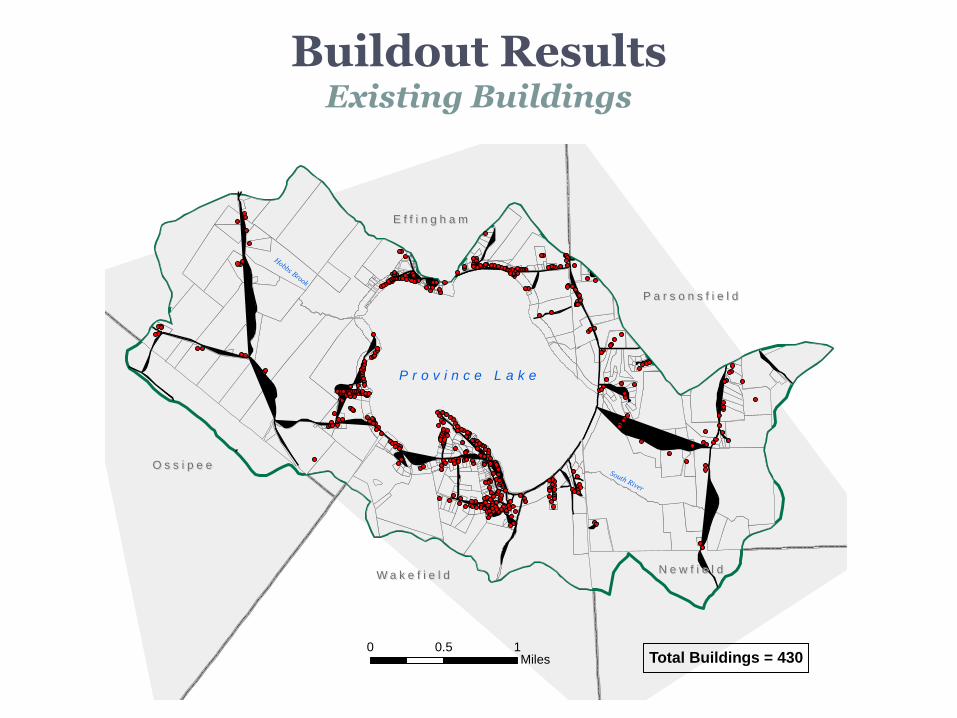
Buildout Results Existing Buildings
Hobbs Brook
South River
P a r s o n s f i e l dP a r s o n s f i e l d
N e w f i e l dN e w f i e l d
E f f i n g h a mE f f i n g h a m
W a k e f i e l dW a k e f i e l d
O s s i p e eO s s i p e e
P r o v i n c e L a k e
±
0 0.5 1Miles Total Buildings = 430
Aa
a
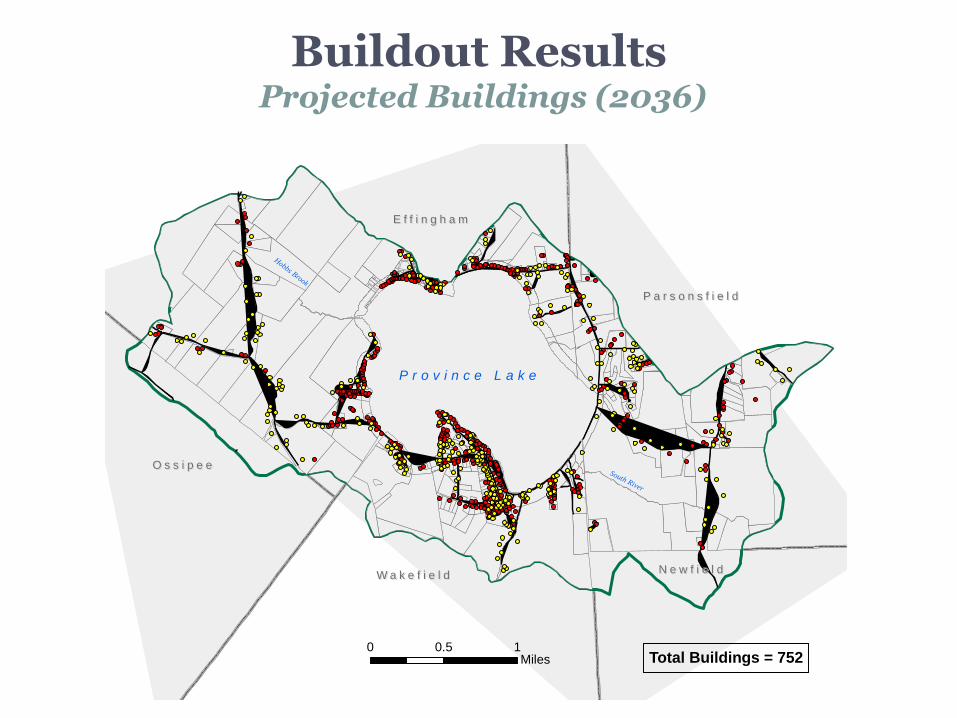
Buildout Results Projected Buildings (2036)
Hobbs Brook
South River
P a r s o n s f i e l dP a r s o n s f i e l d
N e w f i e l dN e w f i e l d
E f f i n g h a mE f f i n g h a m
W a k e f i e l dW a k e f i e l d
O s s i p e eO s s i p e e
P r o v i n c e L a k e
±
0 0.5 1Miles Total Buildings = 752
Aa
a
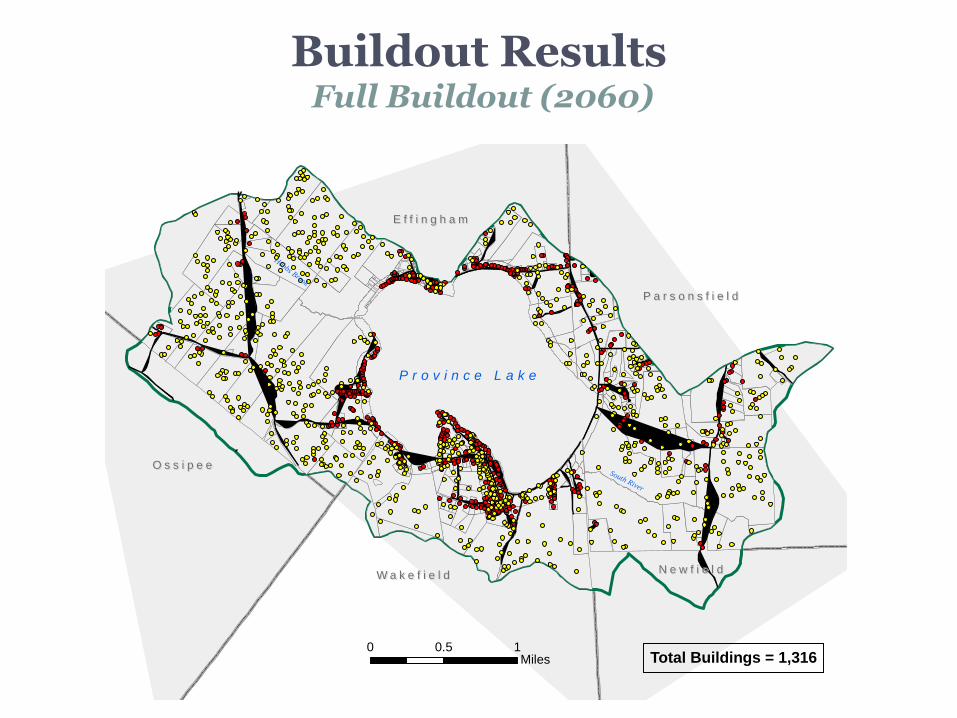
Hobbs Brook
South River
P a r s o n s f i e l dP a r s o n s f i e l d
N e w f i e l dN e w f i e l d
E f f i n g h a mE f f i n g h a m
W a k e f i e l dW a k e f i e l d
O s s i p e eO s s i p e e
P r o v i n c e L a k e
±
0 0.5 1Miles Total Buildings = 1,316
Buildout Results Full Buildout (2060)
Aa
a

Now 2036 2060
Percent Increase 0% 23% 62%
Past, Present & Future
Phosphorus from the Land

Past, Present & Future Phosphorus in the Lake
Goal = 10.8 ppb (- 113 kg P/yr)
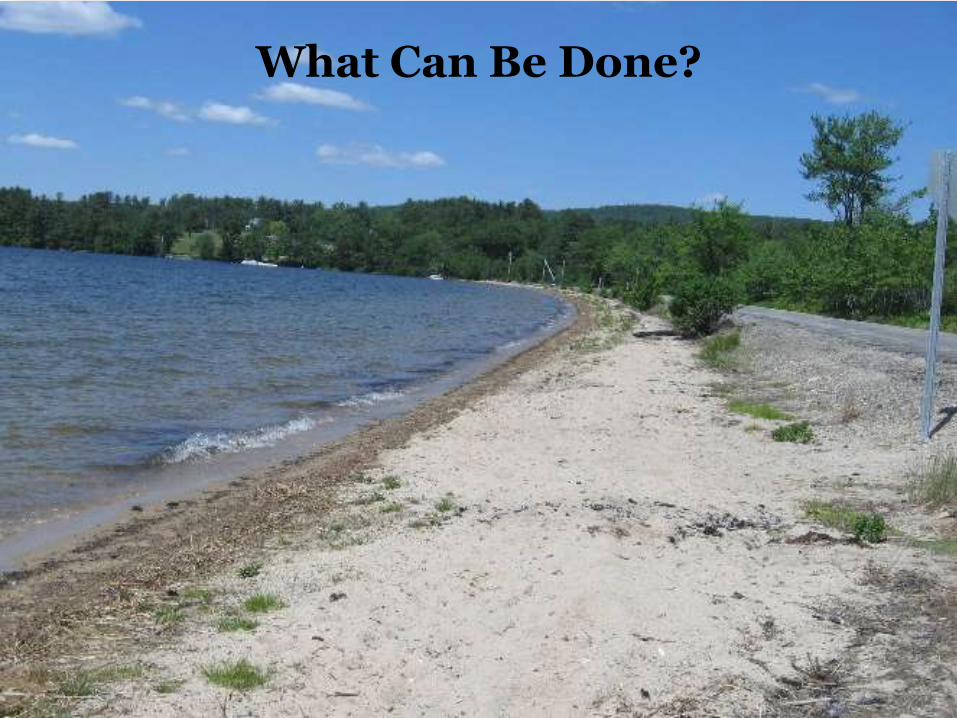
What Can Be Done?

Water Quality Goal and Actions Needed

25% Reduction
*Does not include internal loading reductions
Category
Estimated Load
Reduction
(lbs TP/yr)
Septic Systems 44 - 55
Shoreline BMPs 66 - 99
Roads 110 - 165
Ordinances & Land
Conservation
187 - 209
Boating TBD
Water Quality Monitoring N/A
TOTAL EST. LOAD REDUCTION 407 - 528 lbs/yr

Focus Area: Septic Systems

P Load Reductions Where Can They Come From?
Installing Effective BMPs at High Priority Sites
[66 – 99 lbs P/yr]
Top 20 BMPs= 76% of P
Reduction Goal
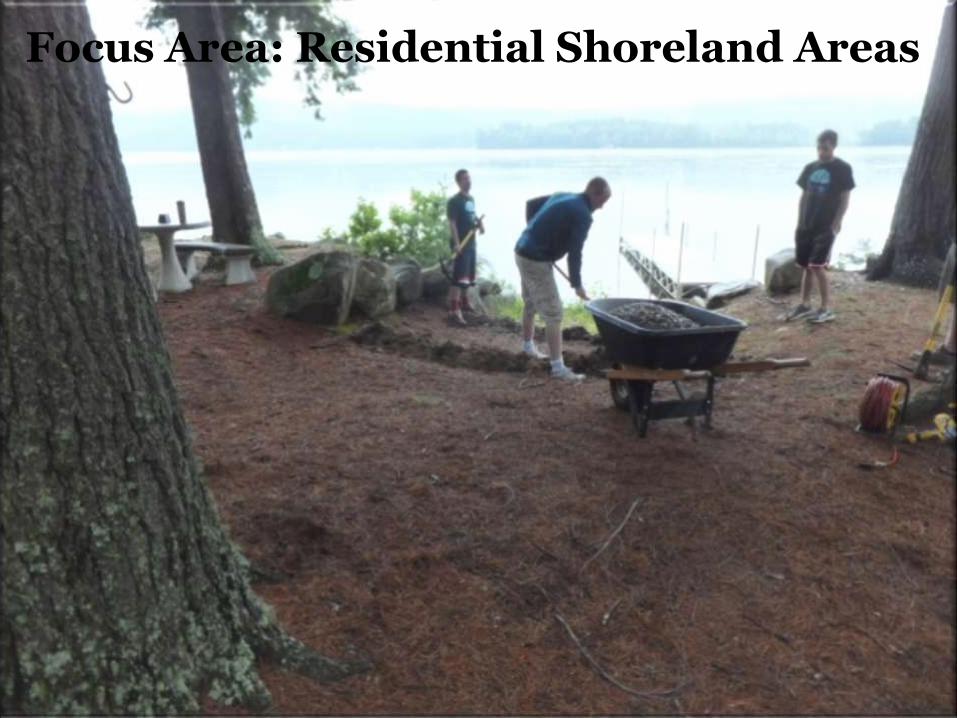
Focus Area: Residential Shoreland Areas

Focus Area: Route 153
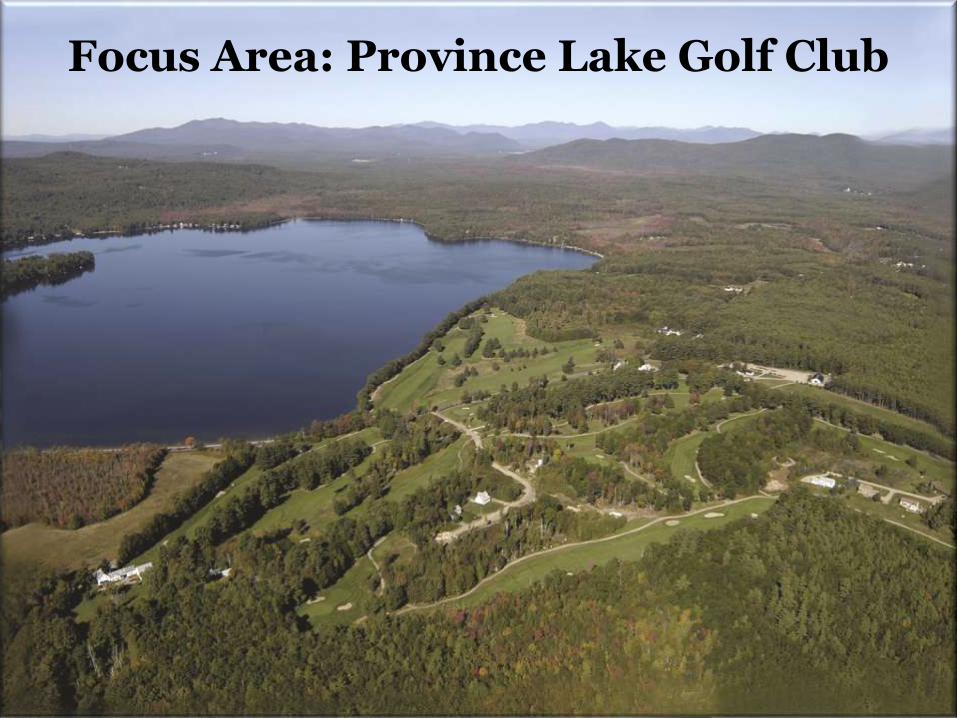
Focus Area: Province Lake Golf Club

Future Development
www.syringarealty.com
Stormwater/ LID Ordinance
Protect Large Parcels (>10 acres)
Weeklypakcet.com

THE ACTION PLAN
The Province Lake Watershed Management Plan Steering
Committee should work toward improving and implementing the
action plan that helps address threats identified within the
following six major categories:
1) Septic Systems
2) Shoreline Best Management Practices (BMPs)
3) Roads
4) Municipal Ordinances and Land Conservation
5) Recreation/Boating
6) Water Quality Monitoring
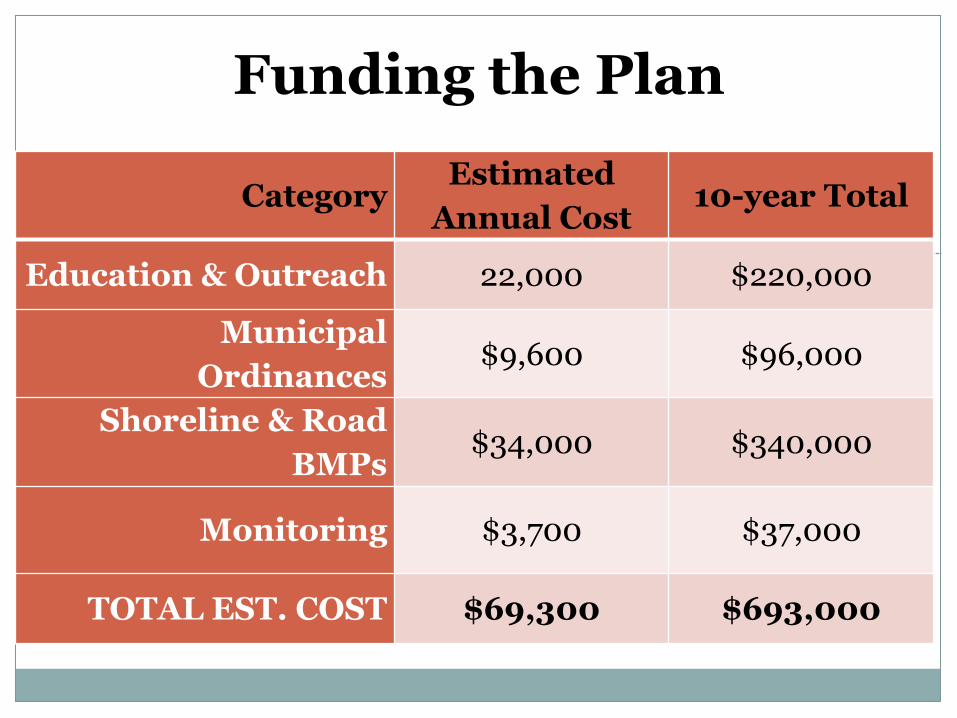
Funding the Plan
Category Estimated
Annual Cost 10-year Total
Education & Outreach 22,000 $220,000
Municipal
Ordinances $9,600 $96,000
Shoreline & Road
BMPs $34,000 $340,000
Monitoring $3,700 $37,000
TOTAL EST. COST $69,300 $693,000

Measuring Progress
Environmental – Improved
Water Quality – less frequent and intense cyanobacteria blooms
Programmatic – Number of
and Effectiveness of BMPs
Social – More Volunteers; More
Education and Participation
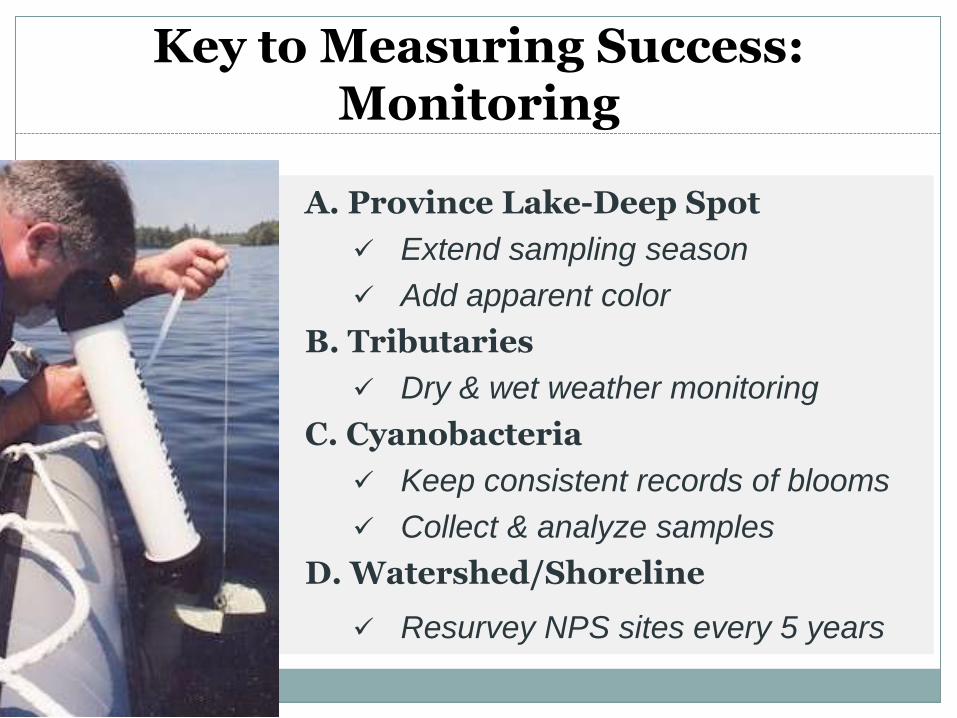
Key to Measuring Success: Monitoring
A. Province Lake-Deep Spot
Extend sampling season
Add apparent color
B. Tributaries
Dry & wet weather monitoring
C. Cyanobacteria
Keep consistent records of blooms
Collect & analyze samples
D. Watershed/Shoreline
Resurvey NPS sites every 5 years

Your Lake is Precious
and YOU Can Help!

Next Steps for Province Lake

Next steps for Province Lake
The Acton Wakefield Watersheds Alliance and PLA
applied for a NH Watershed Assistance Grant for 2015-
2016 to address the following action items:
Septic Systems • Coordinate with septic haulers to
arrange for group pump out discounts
• Identify high risk septic systems and provide funding for professional septic evaluations. A program will be developed to provide cost-share funding for failing systems.

Next Steps for Province Lake BMPs
AWWA & the PLA will coordinate
with ME & NH DOTs and local
residents to develop a plan to
address pollutant load issues from
Route 153.
AWWA will work with the Province
Lake Golf Club to install buffer
plantings along the streams and
lakeshore of the course.
The AWWA Youth Conservation
Corps will work with landowners to
address residential polluted runoff
issues
The Town of Wakefield DPW
will correct additional chronic
erosion issues along
Bonnyman Road. Towle
Farm Road intersection
project is in progress
partnering with the UNH
Stormwater Center.

Next steps for Province Lake Land Conservation
• A workshop will be held for owners of large parcels within the
watersheds to inform them of forest management opportunities

Next steps for Province Lake Recreation & Boating
• Healthy Lake Boating flyers will be developed and distributed

Next steps for Province Lake
Water Quality Monitoring
• Continue with current lake monitoring with the additional
parameters of apparent color, alkalinity, chloride, bacteria and total nitrogen
• Recruit additional monitors to sample tributaries • Employ canine detection to determine source of high bacteria
levels

Next steps for Province Lake
• Looking for Volunteers – if you are interested in volunteering
during the next 2-year phase of the Province Lake project please contact Linda Schier with AWWA or Pete Dinger of PLA. There will be a number of opportunities to be involved.

Next steps for Province Lake
We need your input! For your time today to count as match for
our NHDES grant and so that we can be sure to address the issues that concern you please complete your survey form right now.
Everyone who completes and turns in a survey will be entered to win a $30 gift certificate for dinner at the Wakefield Inn.

Questions?


