25
Provincial General Hospital Ratnapura Statistical Report – 3 rd Quarter- 2018 Director PGH Ratnapura
Provincial General Hospital Ratnapura
Statistical Report – 3rd Quarter- 2018
Director PGH Ratnapura
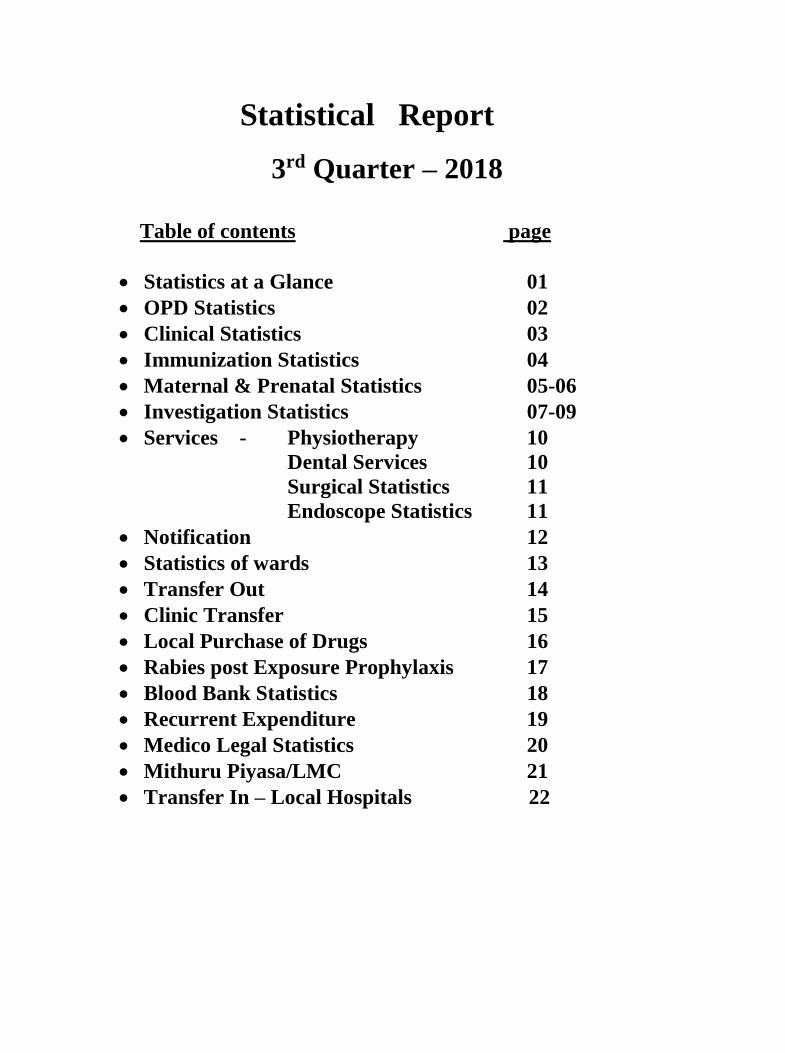
Statistical Report 3rd Quarter – 2018
Table of contents page
• Statistics at a Glance 01 • OPD Statistics 02 • Clinical Statistics 03 • Immunization Statistics 04 • Maternal & Prenatal Statistics 05-06 • Investigation Statistics 07-09 • Services - Physiotherapy 10
Dental Services 10
Surgical Statistics 11
Endoscope Statistics 11 • Notification 12 • Statistics of wards 13 • Transfer Out 14 • Clinic Transfer 15 • Local Purchase of Drugs 16 • Rabies post Exposure Prophylaxis 17 • Blood Bank Statistics 18 • Recurrent Expenditure 19 • Medico Legal Statistics 20 • Mithuru Piyasa/LMC 21 • Transfer In – Local Hospitals 22

SUMMARY - 3rd
Quarter - 2018
Description 3rd
Quarter
General Statistics No of Beds 1400
No of Admissions 34262
No of Discharges 33541
No of Inpatient days 90170
Bed Occupancy Ratio (%) 71.6
Average duration of stay (Day) 2.7
Patients Turn Over Rate 24.4
No of Deliveries (Total) 1892
No of NVD 1012
No of LSCS 830
No of Vacum Deliveries 29
No of Forcep Deliveries 21
LSCS Rate % 43.9
Number of Birth (Total) 1924
Live Births 1906
<2500g 394
>2500g 1512
Low births weight rate % 17.0
Still births - IUD on Admission 18
- IUD while in ward
- IUD During Labour
Still Birth Rate (100) - IUD on Admission 0.93
- IUD while in ward
- IUD During Labour
Number of OPD Patients (Avg.per Day) 1108
Total Number of Hospital Deaths 443
- Death within 48 hrs of admission 181
- On Admission deaths 38
Death Rate(%) 1.30
No of Transfers T.C.U. 380
Local purchase of drugs (Rs.) 4312595
Maternal & Perinatal Statistics
Description
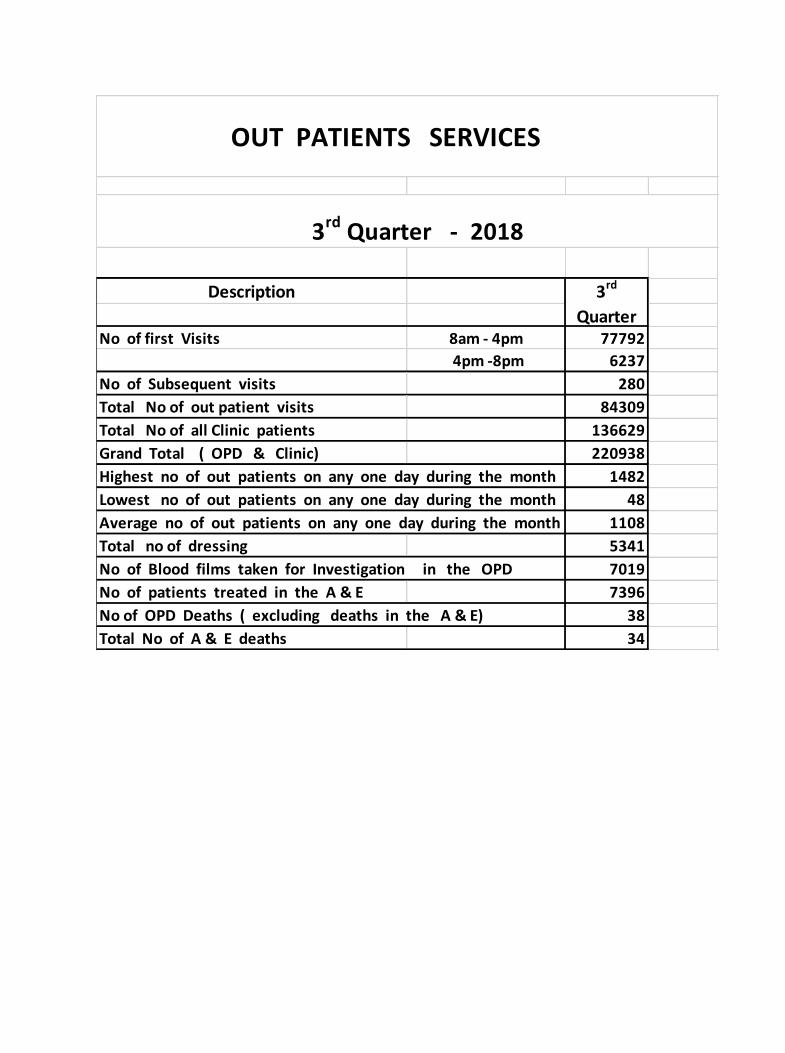
No of first Visits 8am - 4pm 77792
4pm -8pm 6237
No of Subsequent visits 280
Total No of out patient visits 84309
Total No of all Clinic patients 136629
Grand Total ( OPD & Clinic) 220938
Highest no of out patients on any one day during the month 1482
Lowest no of out patients on any one day during the month 48
Average no of out patients on any one day during the month 1108
Total no of dressing 5341
No of Blood films taken for Investigation in the OPD 7019
No of patients treated in the A & E 7396
No of OPD Deaths ( excluding deaths in the A & E) 38
Total No of A & E deaths 34
OUT PATIENTS SERVICES
3rd Quarter - 2018
3rd
Quarter
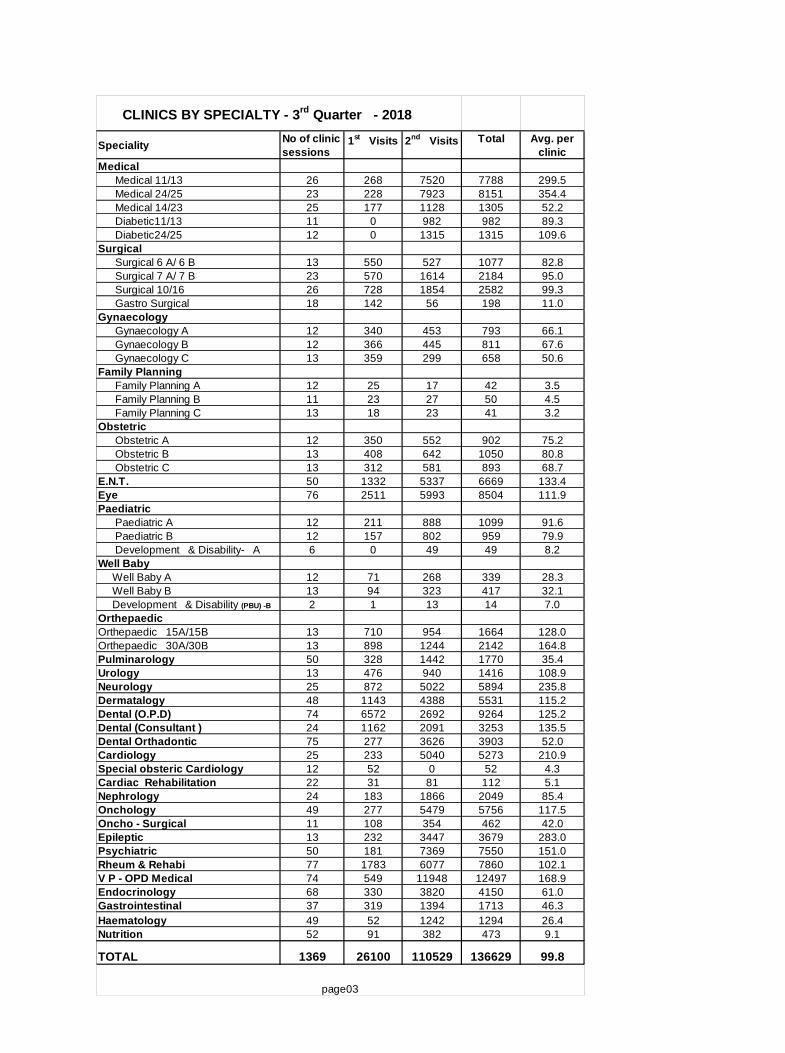
CLINICS BY SPECIALTY - 3rd
Quarter - 2018
SpecialityNo of clinic
sessions1
st Visits 2
nd Visits Total Avg. per
clinic
Medical
Medical 11/13 26 268 7520 7788 299.5
Medical 24/25 23 228 7923 8151 354.4
Medical 14/23 25 177 1128 1305 52.2
Diabetic11/13 11 0 982 982 89.3
Diabetic24/25 12 0 1315 1315 109.6
Surgical
Surgical 6 A/ 6 B 13 550 527 1077 82.8
Surgical 7 A/ 7 B 23 570 1614 2184 95.0
Surgical 10/16 26 728 1854 2582 99.3
Gastro Surgical 18 142 56 198 11.0
Gynaecology
Gynaecology A 12 340 453 793 66.1
Gynaecology B 12 366 445 811 67.6
Gynaecology C 13 359 299 658 50.6
Family Planning
Family Planning A 12 25 17 42 3.5
Family Planning B 11 23 27 50 4.5
Family Planning C 13 18 23 41 3.2
Obstetric
Obstetric A 12 350 552 902 75.2
Obstetric B 13 408 642 1050 80.8
Obstetric C 13 312 581 893 68.7
E.N.T. 50 1332 5337 6669 133.4
Eye 76 2511 5993 8504 111.9
Paediatric
Paediatric A 12 211 888 1099 91.6
Paediatric B 12 157 802 959 79.9
Development & Disability- A 6 0 49 49 8.2
Well Baby
Well Baby A 12 71 268 339 28.3
Well Baby B 13 94 323 417 32.1
Development & Disability (PBU) -B 2 1 13 14 7.0
Orthepaedic
Orthepaedic 15A/15B 13 710 954 1664 128.0
Orthepaedic 30A/30B 13 898 1244 2142 164.8
Pulminarology 50 328 1442 1770 35.4
Urology 13 476 940 1416 108.9
Neurology 25 872 5022 5894 235.8
Dermatalogy 48 1143 4388 5531 115.2
Dental (O.P.D) 74 6572 2692 9264 125.2
Dental (Consultant ) 24 1162 2091 3253 135.5
Dental Orthadontic 75 277 3626 3903 52.0
Cardiology 25 233 5040 5273 210.9
Special obsteric Cardiology 12 52 0 52 4.3
Cardiac Rehabilitation 22 31 81 112 5.1
Nephrology 24 183 1866 2049 85.4
Onchology 49 277 5479 5756 117.5
Oncho - Surgical 11 108 354 462 42.0
Epileptic 13 232 3447 3679 283.0
Psychiatric 50 181 7369 7550 151.0
Rheum & Rehabi 77 1783 6077 7860 102.1
V P - OPD Medical 74 549 11948 12497 168.9
Endocrinology 68 330 3820 4150 61.0
Gastrointestinal 37 319 1394 1713 46.3
Haematology 49 52 1242 1294 26.4
Nutrition 52 91 382 473 9.1
TOTAL 1369 26100 110529 136629 99.8
page03
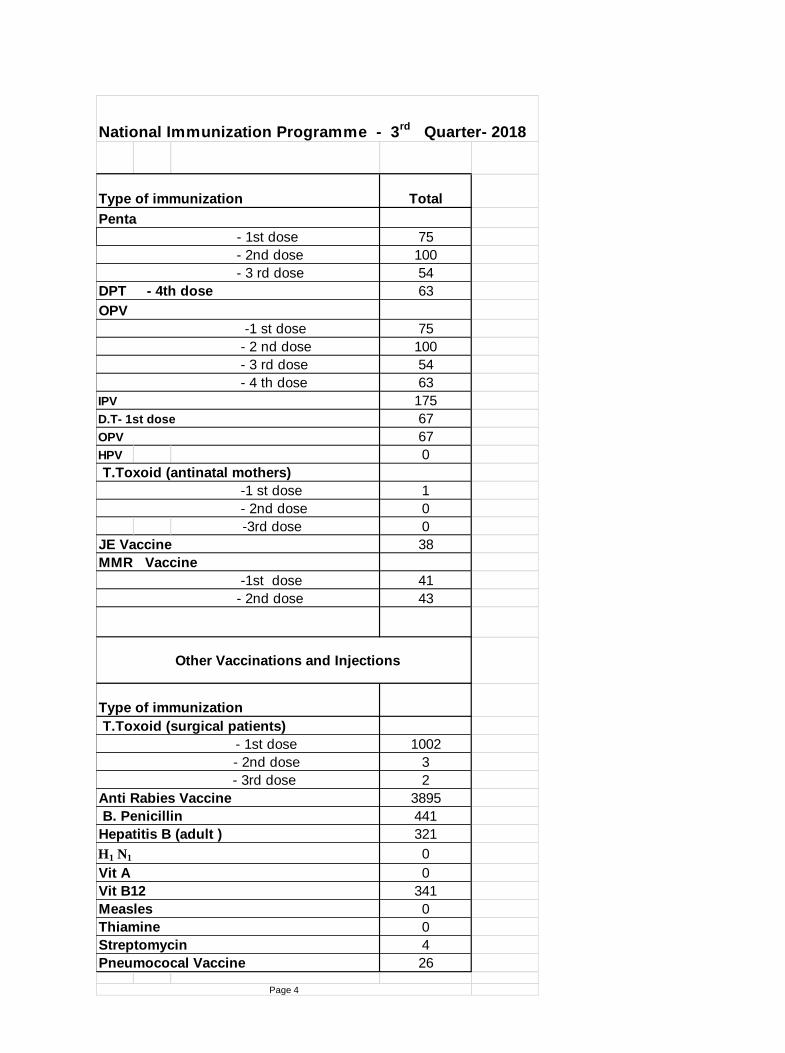
Type of immunization Total
Penta
75
100
54
63
75
100
54
63
175
67
67
HPV 0
T.Toxoid (antinatal mothers)
1
0
-3rd dose 0
38
41
43
Type of immunization
T.Toxoid (surgical patients)
1002
3
2
3895
441
321
0
0
341
0
0
4
Pneumococal Vaccine 26
National Immunization Programme - 3rd
Quarter- 2018
- 1st dose
- 2nd dose
- 3 rd dose
DPT - 4th dose
OPV
-1 st dose
- 2 nd dose
- 3 rd dose
- 4 th dose
IPV
D.T- 1st dose
OPV
-1 st dose
- 2nd dose
JE Vaccine
MMR Vaccine
-1st dose
- 2nd dose
Other Vaccinations and Injections
- 1st dose
- 2nd dose
- 3rd dose
Measles
Thiamine
Streptomycin
Page 4
Anti Rabies Vaccine
B. Penicillin
Hepatitis B (adult )
H1 N1
Vit A
Vit B12
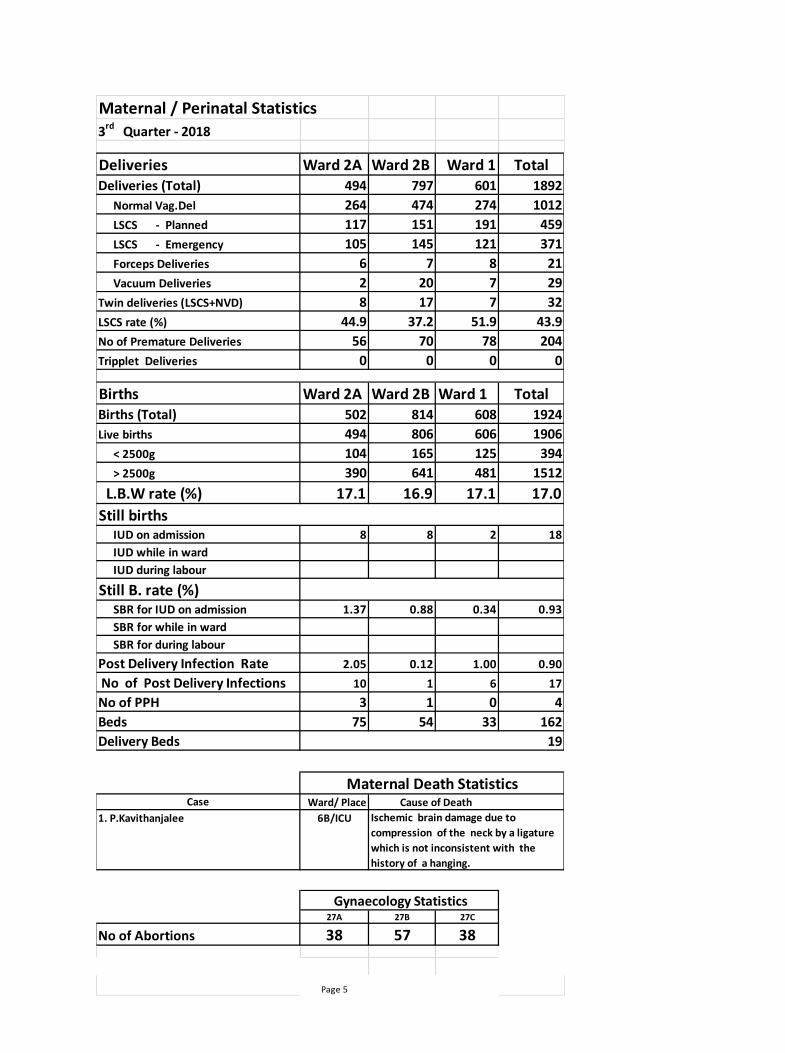
Maternal / Perinatal Statistics
3rd
Quarter - 2018
Deliveries Ward 2A Ward 2B Ward 1 TotalDeliveries (Total) 494 797 601 1892
Normal Vag.Del 264 474 274 1012
LSCS - Planned 117 151 191 459
LSCS - Emergency 105 145 121 371
Forceps Deliveries 6 7 8 21
Vacuum Deliveries 2 20 7 29
Twin deliveries (LSCS+NVD) 8 17 7 32
LSCS rate (%) 44.9 37.2 51.9 43.9
No of Premature Deliveries 56 70 78 204
Tripplet Deliveries 0 0 0 0
Births Ward 2A Ward 2B Ward 1 TotalBirths (Total) 502 814 608 1924
Live births 494 806 606 1906
< 2500g 104 165 125 394
> 2500g 390 641 481 1512
L.B.W rate (%) 17.1 16.9 17.1 17.0
Still births IUD on admission 8 8 2 18
IUD while in ward
IUD during labour
Still B. rate (%) SBR for IUD on admission 1.37 0.88 0.34 0.93
SBR for while in ward
SBR for during labour
Post Delivery Infection Rate 2.05 0.12 1.00 0.90
No of Post Delivery Infections 10 1 6 17
No of PPH 3 1 0 4
Beds 75 54 33 162
Delivery Beds
Case Ward/ Place
1. P.Kavithanjalee 6B/ICU
27A 27B 27C
No of Abortions 38 57 38
Page 5
Gynaecology Statistics
19
Maternal Death Statistics Cause of Death
Ischemic brain damage due to
compression of the neck by a ligature
which is not inconsistent with the
history of a hanging.
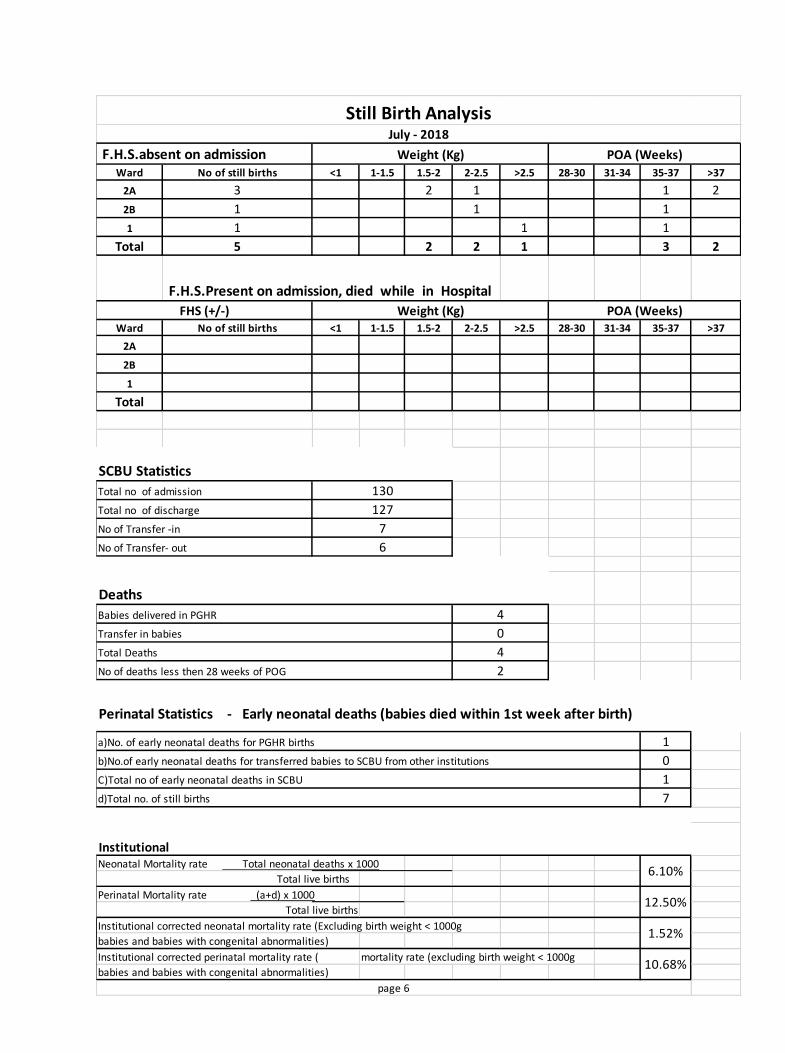
Ward No of still births <1 1-1.5 1.5-2 2-2.5 >2.5 28-30 31-34 35-37 >37
2A 3 2 1 1 2
2B 1 1 1
1 1 1 1
Total 5 2 2 1 3 2
F.H.S.Present on admission, died while in Hospital
Ward No of still births <1 1-1.5 1.5-2 2-2.5 >2.5 28-30 31-34 35-37 >37
2A
2B
1
Total
SCBU Statistics
Deaths
Perinatal Statistics - Early neonatal deaths (babies died within 1st week after birth)
1
0
1
7
Neonatal Mortality rate Total neonatal deaths x 1000
Total live births
Perinatal Mortality rate (a+d) x 1000
Total live births
Institutional corrected neonatal mortality rate (Excluding birth weight < 1000g
babies and babies with congenital abnormalities)
Institutional corrected perinatal mortality rate ( mortality rate (excluding birth weight < 1000g
babies and babies with congenital abnormalities)
FHS (+/-) Weight (Kg) POA (Weeks)
Still Birth AnalysisJuly - 2018
F.H.S.absent on admission Weight (Kg) POA (Weeks)
Total no of admission 130
Total no of discharge 127
No of Transfer -in 7
a)No. of early neonatal deaths for PGHR births
No of Transfer- out 6
Babies delivered in PGHR 4
Transfer in babies 0
Total Deaths 4
No of deaths less then 28 weeks of POG 2
1.52%
10.68%
page 6
b)No.of early neonatal deaths for transferred babies to SCBU from other institutions
C)Total no of early neonatal deaths in SCBU
d)Total no. of still births
Institutional
6.10%
12.50%
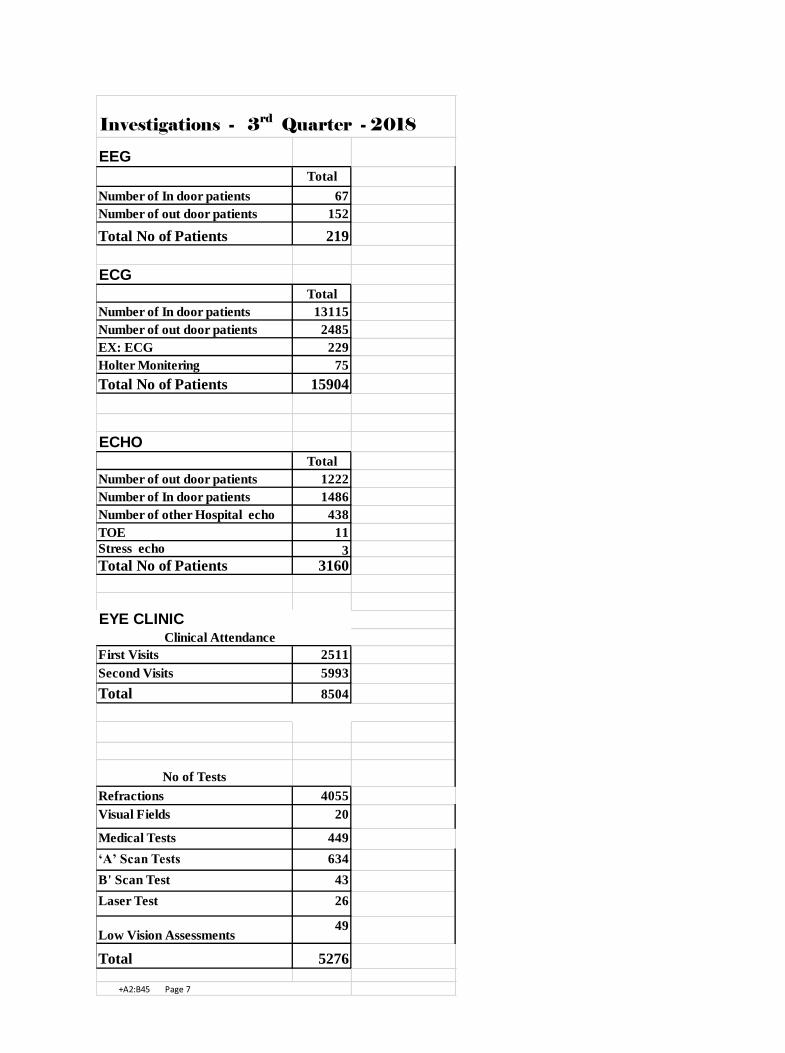
Investigations - 3rd Quarter - 2018
EEG
Total
Number of In door patients 67
Number of out door patients 152
Total No of Patients 219
ECG
Total
Number of In door patients 13115
Number of out door patients 2485
EX: ECG 229
Holter Monitering 75
Total No of Patients 15904
ECHO
Total
Number of out door patients 1222
Number of In door patients 1486
Number of other Hospital echo 438
TOE 11
Stress echo 3
Total No of Patients 3160
EYE CLINIC Clinical Attendance
First Visits 2511
Second Visits 5993
Total 8504
No of Tests
Refractions 4055
Visual Fields 20
Medical Tests 449
‘A’ Scan Tests 634
B' Scan Test 43
Laser Test 26
Low Vision Assessments49
Total 5276
+A2:B45 Page 7

Investigations - 3rd Quarter - 2018
Radiological Investigations
Investigation O.H GHR Total
Plain X- Ray 5680 5680
Inward X-Ray 310 310
A & E Plain X-Ray 124 20949 21073
Inward X-Ray 373 373
HSG 1 1
Barium Enema 0
Barium Swallow 4 4
Barium Meal 0
IVP 44 44
CT Scan 256 5830 6086
US Scan 160 5772 5932
MCUG 2 2
Urethrogram 6 6
Doppler scan 173 173
FNAC 100 100
Myelogram (C.T. Lumber) 0
Sialogram 0
Angiogram 0
Nephorogram 0
Others 3 3
Ultra sound guided biopsy 28 28
C. T guided biopsy 4 4
Ultra sound guided Aspiration 26 26
C-Aram Machine Used 159 159
Dental 1060 1060
Catheter bulb puncture 2 2
Pigtail drainage 31 31
ERCP 10 10
T.P.M 10 10
Mammogram 4 87 91
7 7
Total 544 40671 41215
Total No of X-Rays 34098
Speech & Language Therapy Unit
No of first Visit 231
No of second visit314
TOTAL 545
Page 8
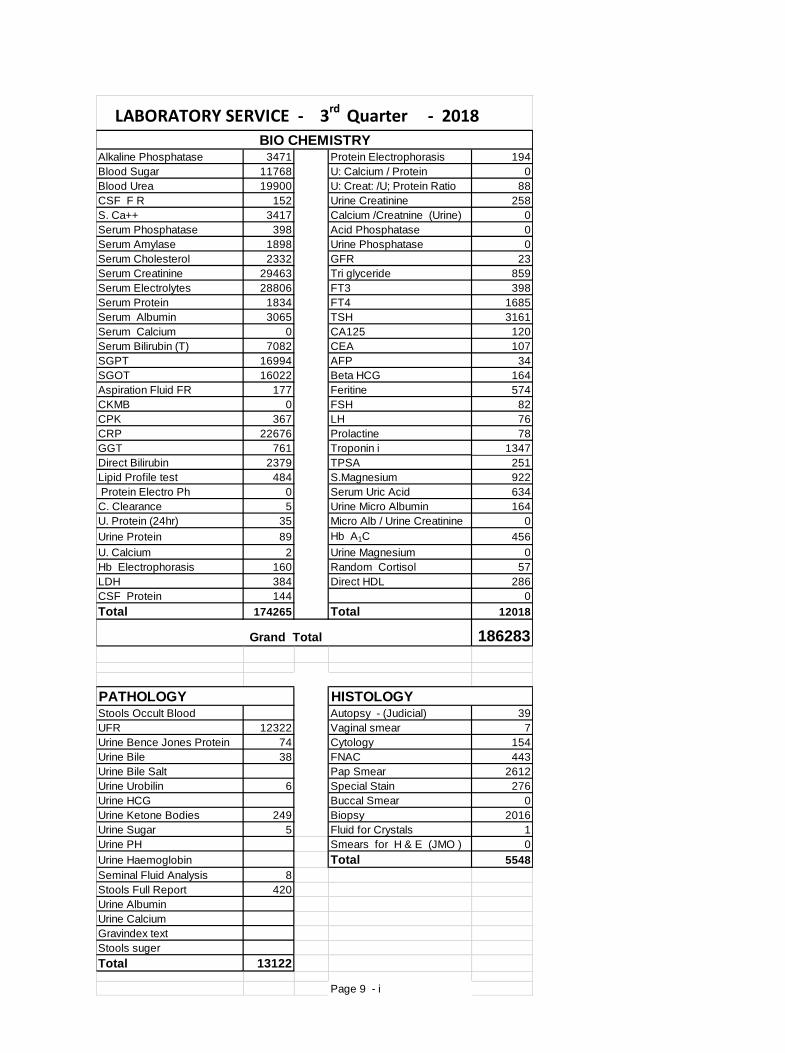
LABORATORY SERVICE - 3rd Quarter - 2018
Alkaline Phosphatase 3471 Protein Electrophorasis 194
Blood Sugar 11768 U: Calcium / Protein 0
Blood Urea 19900 U: Creat: /U; Protein Ratio 88
CSF F R 152 Urine Creatinine 258
S. Ca++ 3417 Calcium /Creatnine (Urine) 0
Serum Phosphatase 398 Acid Phosphatase 0
Serum Amylase 1898 Urine Phosphatase 0
Serum Cholesterol 2332 GFR 23
Serum Creatinine 29463 Tri glyceride 859
Serum Electrolytes 28806 FT3 398
Serum Protein 1834 FT4 1685
Serum Albumin 3065 TSH 3161
Serum Calcium 0 CA125 120
Serum Bilirubin (T) 7082 CEA 107
SGPT 16994 AFP 34
SGOT 16022 Beta HCG 164
Aspiration Fluid FR 177 Feritine 574
CKMB 0 FSH 82
CPK 367 LH 76
CRP 22676 Prolactine 78
GGT 761 Troponin i 1347
Direct Bilirubin 2379 TPSA 251
Lipid Profile test 484 S.Magnesium 922
Protein Electro Ph 0 Serum Uric Acid 634
C. Clearance 5 Urine Micro Albumin 164
U. Protein (24hr) 35 Micro Alb / Urine Creatinine 0
Urine Protein 89 Hb A1C 456
U. Calcium 2 Urine Magnesium 0
Hb Electrophorasis 160 Random Cortisol 57
LDH 384 Direct HDL 286
CSF Protein 144 0
Total 174265 Total 12018
186283
PATHOLOGYStools Occult Blood Autopsy - (Judicial) 39
UFR 12322 Vaginal smear 7
Urine Bence Jones Protein 74 Cytology 154
Urine Bile 38 FNAC 443
Urine Bile Salt Pap Smear 2612
Urine Urobilin 6 Special Stain 276
Urine HCG Buccal Smear 0
Urine Ketone Bodies 249 Biopsy 2016
Urine Sugar 5 Fluid for Crystals 1
Urine PH Smears for H & E (JMO ) 0
Urine Haemoglobin Total 5548
Seminal Fluid Analysis 8
Stools Full Report 420
Urine Albumin
Urine Calcium
Gravindex text
Stools suger
Total 13122
Page 9 - i
BIO CHEMISTRY
Grand Total
HISTOLOGY
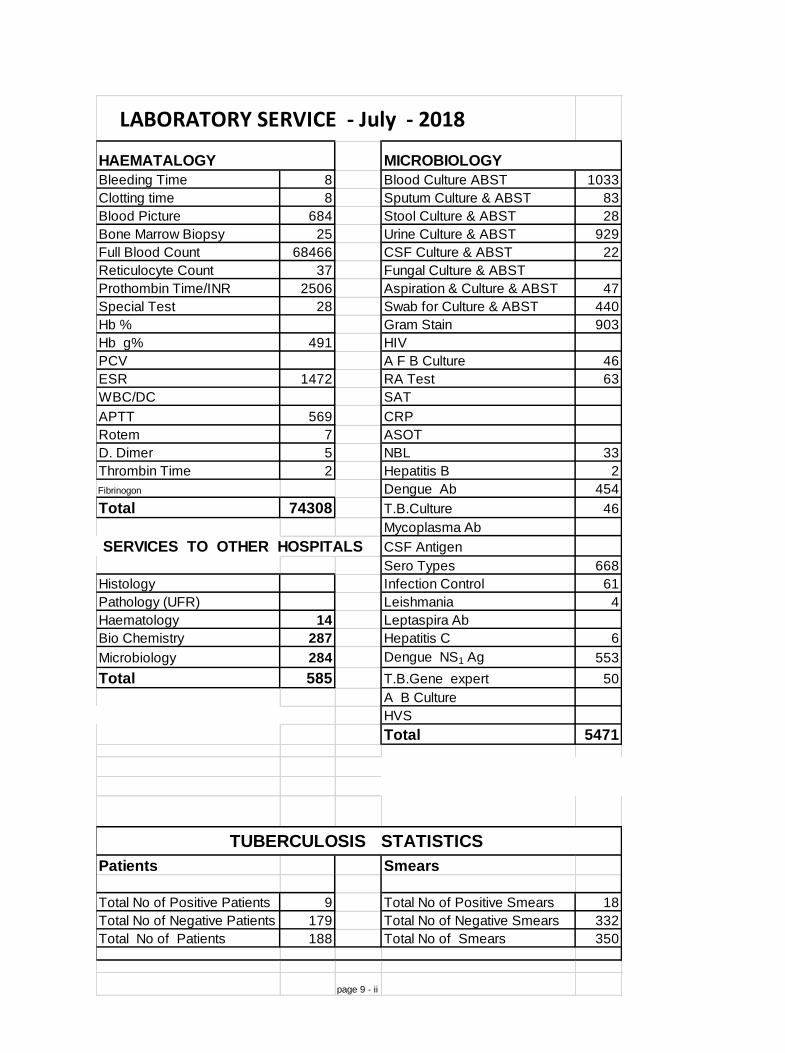
LABORATORY SERVICE - July - 2018
HAEMATALOGY MICROBIOLOGY
Bleeding Time 8 Blood Culture ABST 1033
Clotting time 8 Sputum Culture & ABST 83
Blood Picture 684 Stool Culture & ABST 28
Bone Marrow Biopsy 25 Urine Culture & ABST 929
Full Blood Count 68466 CSF Culture & ABST 22
Reticulocyte Count 37 Fungal Culture & ABST
Prothombin Time/INR 2506 Aspiration & Culture & ABST 47
Special Test 28 Swab for Culture & ABST 440
Hb % Gram Stain 903
Hb g% 491 HIV
PCV A F B Culture 46
ESR 1472 RA Test 63
WBC/DC SAT
APTT 569 CRP
Rotem 7 ASOT
D. Dimer 5 NBL 33
Thrombin Time 2 Hepatitis B 2
Fibrinogon Dengue Ab 454
Total 74308 T.B.Culture 46
Mycoplasma Ab
SERVICES TO OTHER HOSPITALS CSF Antigen
Sero Types 668
Histology Infection Control 61
Pathology (UFR) Leishmania 4
Haematology 14 Leptaspira Ab
Bio Chemistry 287 Hepatitis C 6
Microbiology 284 Dengue NS1 Ag 553
Total 585 T.B.Gene expert 50
A B Culture
HVS
Total 5471
Patients Smears
Total No of Positive Patients 9 Total No of Positive Smears 18
Total No of Negative Patients 179 Total No of Negative Smears 332
Total No of Patients 188 Total No of Smears 350
page 9 - ii
TUBERCULOSIS STATISTICS

Services - 3rd Quarter - 2018
PhysiotherapyNumber of In ward Patients 5092
Number of Units 15276
Number of out patients 3970
Number of Units 11912
Total No of Patients 9062
Total No of Units 27188
Dental Unit StatistcsMinor Operations Under LA 455
Prosthetic Dentistry 16
Restorative Dentistry 359
Oral Surgery Under GA 136
Total of referral patients from other wards 257
Others & Oral Medicine 1611
From Other Wards 37
Total 2871
Dental (OPD) UnitTemporary Filling 1023
Glass Ionomer Cement 2050
Amalgam 0
Composit 130
Scaling 363
Root Canal Therapy 432
Mummification 208
Extraction 1883
F.Gel Applied 71
Fissure Sealant 50
Others 2977
Total 9187
Orthodontic UnitNo of Plate Delivery 10
No of Repairs Delivery 73
No of Impression taken 77
No of Fixed Appliance Treatment 1362
No of Qyadhelix & RME 0
palatel Arch & lingual Arch 1
Wax 6
GIC (Bite rasing)+ Amalgum 0
Bond - up 25
Total 1554 Page 10
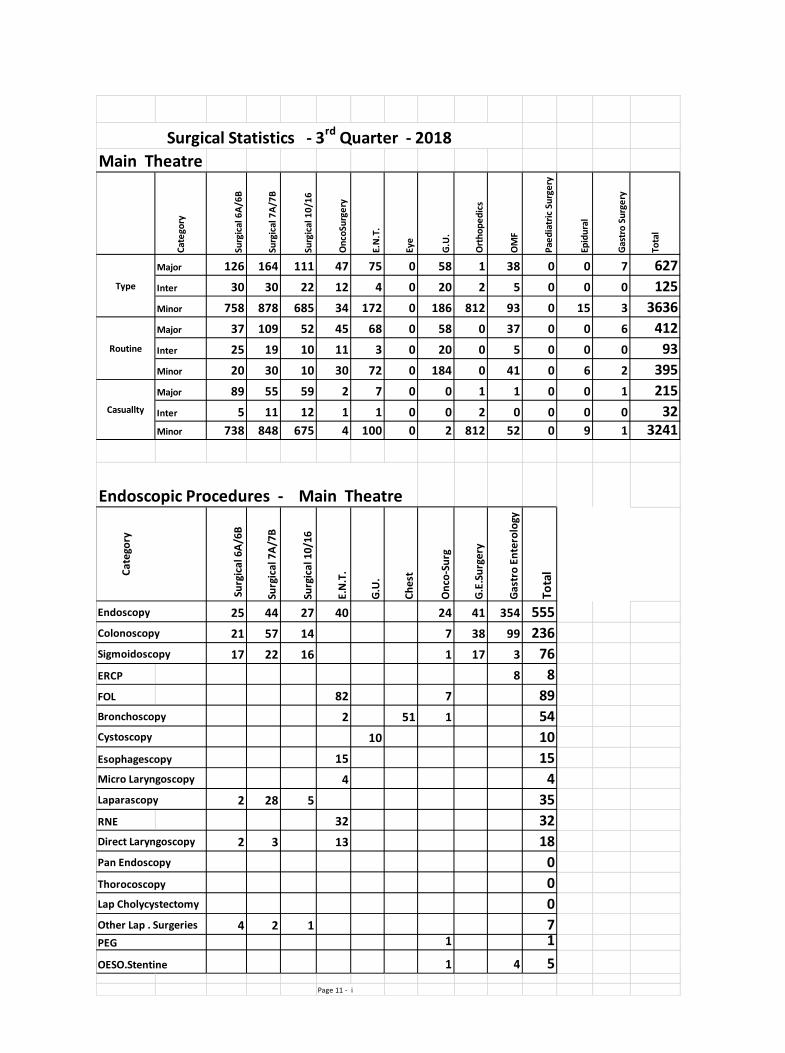
Main TheatreC
ate
gory
Surg
ical
6A
/6B
Surg
ical
7A
/7B
Surg
ical
10
/16
On
coSu
rge
ry
E.N
.T.
Eye
G.U
.
Ort
ho
pe
dic
s
OM
F
Pae
dia
tric
Su
rge
ry
Epid
ura
l
Gas
tro
Su
rge
ry
Tota
l
Major 126 164 111 47 75 0 58 1 38 0 0 7 627
Inter 30 30 22 12 4 0 20 2 5 0 0 0 125
Minor 758 878 685 34 172 0 186 812 93 0 15 3 3636
Major 37 109 52 45 68 0 58 0 37 0 0 6 412
Inter 25 19 10 11 3 0 20 0 5 0 0 0 93
Minor 20 30 10 30 72 0 184 0 41 0 6 2 395
Major 89 55 59 2 7 0 0 1 1 0 0 1 215
Inter 5 11 12 1 1 0 0 2 0 0 0 0 32Minor 738 848 675 4 100 0 2 812 52 0 9 1 3241
Endoscopic Procedures - Main Theatre
Cat
ego
ry
Su
rgic
al 6
A/6
B
Surg
ical
7A
/7B
Surg
ical
10
/16
E.N
.T.
G.U
.
Ch
est
On
co-S
urg
G.E
.Su
rge
ry
Gas
tro
En
tero
logy
Tota
l
Endoscopy 25 44 27 40 24 41 354 555
Colonoscopy 21 57 14 7 38 99 236
Sigmoidoscopy 17 22 16 1 17 3 76
ERCP 8 8
FOL 82 7 89
Bronchoscopy 2 51 1 54
10 10
Esophagescopy 15 15
Micro Laryngoscopy 4 4
Laparascopy 2 28 5 35
RNE 32 32
Direct Laryngoscopy 2 3 13 18
Pan Endoscopy 0
Thorocoscopy 0
Lap Cholycystectomy 0
Other Lap . Surgeries 4 2 1 7PEG 1 1
OESO.Stentine 1 4 5
Page 11 - i
Surgical Statistics - 3rd Quarter - 2018
Type
Routine
Casuallty
Cystoscopy
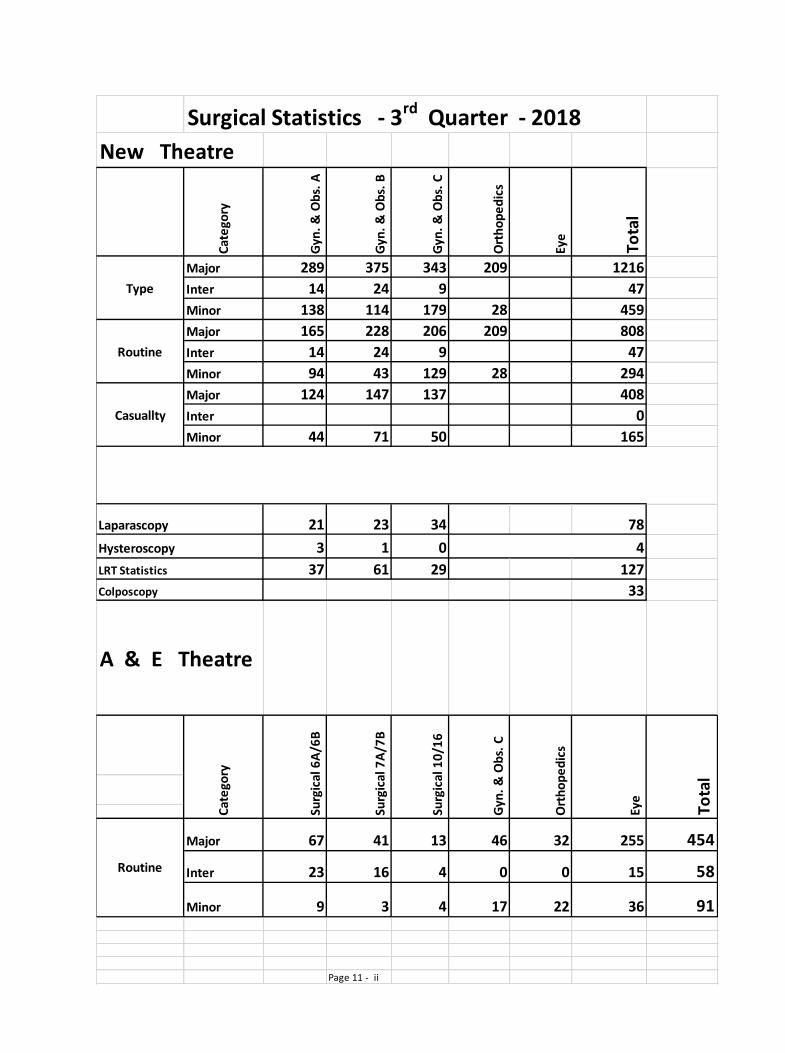
Surgical Statistics - 3rd Quarter - 2018
New Theatre
Cat
ego
ry
Gyn
. &
Ob
s. A
Gyn
. &
Ob
s. B
Gyn
. &
Ob
s. C
Ort
ho
pe
dic
s
Eye
Tota
l
Major 289 375 343 209 1216
Type Inter 14 24 9 47
Minor 138 114 179 28 459
Major 165 228 206 209 808
Routine Inter 14 24 9 47
Minor 94 43 129 28 294
Major 124 147 137 408
Casuallty Inter 0
Minor 44 71 50 165
Laparascopy 21 23 34 78
Hysteroscopy 3 1 0 4
LRT Statistics 37 61 29 127
Colposcopy 33
A & E Theatre
Major 67 41 13 46 32 255 454
Routine Inter 23 16 4 0 0 15 58
Minor 9 3 4 17 22 36 91
Page 11 - ii
Eye
Tota
l
Cat
ego
ry
Surg
ical
6A
/6B
Surg
ical
7A
/7B
Surg
ical
10
/16
Gyn
. &
Ob
s. C
Ort
ho
pe
dic
s
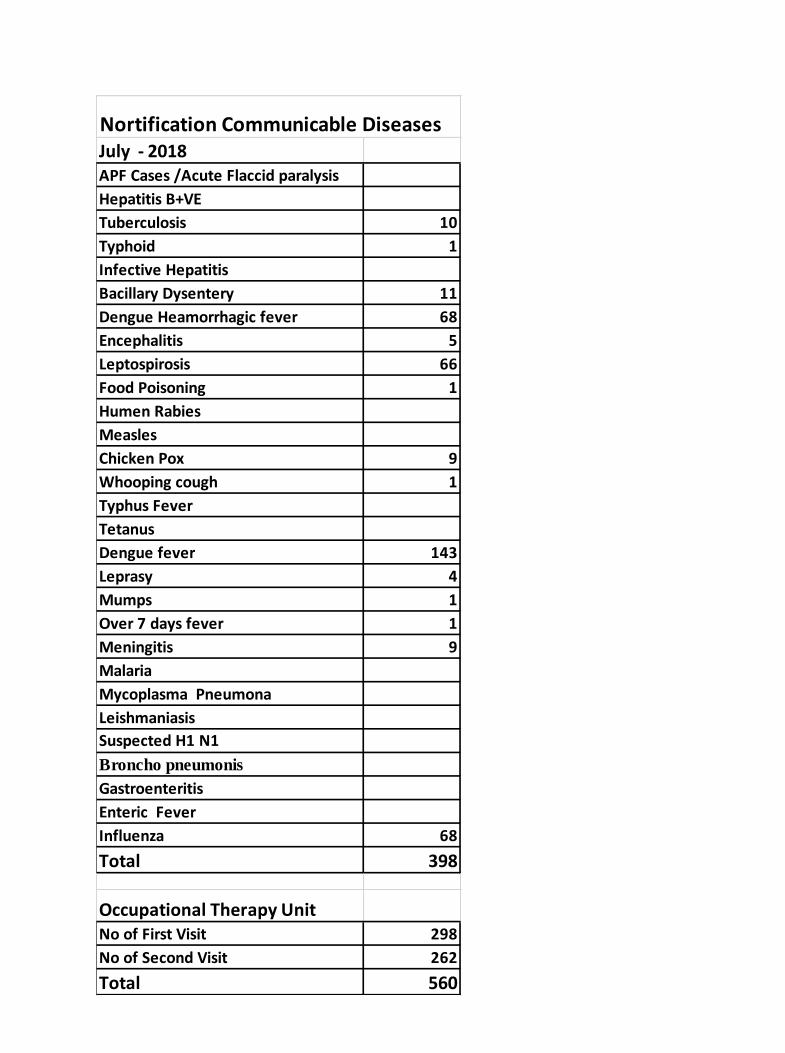
Nortification Communicable DiseasesJuly - 2018APF Cases /Acute Flaccid paralysis
Hepatitis B+VE
Tuberculosis 10
Typhoid 1
Infective Hepatitis
Bacillary Dysentery 11
Dengue Heamorrhagic fever 68
Encephalitis 5
Leptospirosis 66
Food Poisoning 1
Humen Rabies
Measles
Chicken Pox 9
Whooping cough 1
Typhus Fever
Tetanus
Dengue fever 143
Leprasy 4
Mumps 1
Over 7 days fever 1
Meningitis 9
Malaria
Mycoplasma Pneumona
Leishmaniasis
Suspected H1 N1
Broncho pneumonis
Gastroenteritis
Enteric Fever
Influenza 68
Total 398
Occupational Therapy UnitNo of First Visit 298
No of Second Visit 262
Total 560
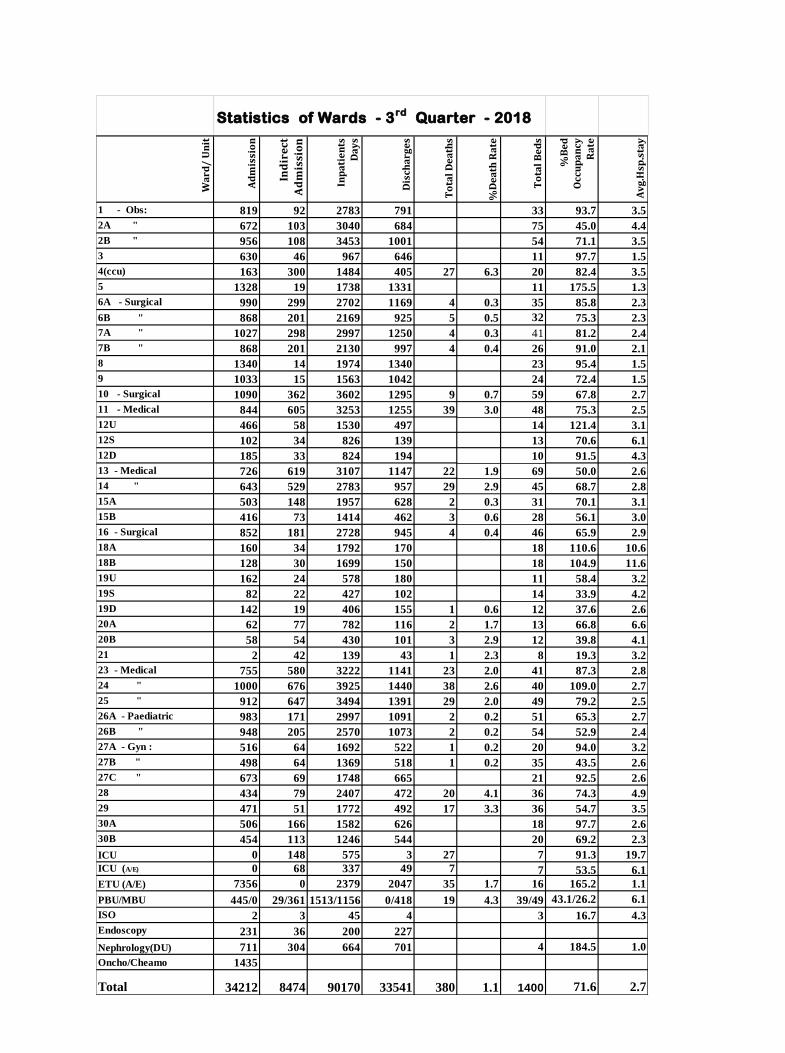
Statistics of Wards - 3rd
Quarter - 2018
Wa
rd/
Un
it
Ad
mis
sio
n
Ind
ire
ct
Ad
mis
sio
n
Inp
ati
en
ts
Da
ys
Dis
cha
rge
s
To
tal
De
ath
s
%D
ea
th R
ate
To
tal
Be
ds
%B
ed
Occ
up
an
cy
Ra
te
Av
g.H
sp.s
tay
1 - Obs: 819 92 2783 791 33 93.7 3.5
2A " 672 103 3040 684 75 45.0 4.4
2B " 956 108 3453 1001 54 71.1 3.5
3 630 46 967 646 11 97.7 1.5
4(ccu) 163 300 1484 405 27 6.3 20 82.4 3.5
5 1328 19 1738 1331 11 175.5 1.3
6A - Surgical 990 299 2702 1169 4 0.3 35 85.8 2.3
6B " 868 201 2169 925 5 0.5 32 75.3 2.3
7A " 1027 298 2997 1250 4 0.3 41 81.2 2.4
7B " 868 201 2130 997 4 0.4 26 91.0 2.1
8 1340 14 1974 1340 23 95.4 1.5
9 1033 15 1563 1042 24 72.4 1.5
10 - Surgical 1090 362 3602 1295 9 0.7 59 67.8 2.7
11 - Medical 844 605 3253 1255 39 3.0 48 75.3 2.5
12U 466 58 1530 497 14 121.4 3.1
12S 102 34 826 139 13 70.6 6.1
12D 185 33 824 194 10 91.5 4.3
13 - Medical 726 619 3107 1147 22 1.9 69 50.0 2.6
14 " 643 529 2783 957 29 2.9 45 68.7 2.8
15A 503 148 1957 628 2 0.3 31 70.1 3.1
15B 416 73 1414 462 3 0.6 28 56.1 3.0
16 - Surgical 852 181 2728 945 4 0.4 46 65.9 2.9
18A 160 34 1792 170 18 110.6 10.6
18B 128 30 1699 150 18 104.9 11.6
19U 162 24 578 180 11 58.4 3.2
19S 82 22 427 102 14 33.9 4.2
19D 142 19 406 155 1 0.6 12 37.6 2.6
20A 62 77 782 116 2 1.7 13 66.8 6.6
20B 58 54 430 101 3 2.9 12 39.8 4.1
21 2 42 139 43 1 2.3 8 19.3 3.2
23 - Medical 755 580 3222 1141 23 2.0 41 87.3 2.8
24 " 1000 676 3925 1440 38 2.6 40 109.0 2.7
25 " 912 647 3494 1391 29 2.0 49 79.2 2.5
26A - Paediatric 983 171 2997 1091 2 0.2 51 65.3 2.7
26B " 948 205 2570 1073 2 0.2 54 52.9 2.4
27A - Gyn : 516 64 1692 522 1 0.2 20 94.0 3.2
27B " 498 64 1369 518 1 0.2 35 43.5 2.6
27C " 673 69 1748 665 21 92.5 2.6
28 434 79 2407 472 20 4.1 36 74.3 4.9
29 471 51 1772 492 17 3.3 36 54.7 3.5
30A 506 166 1582 626 18 97.7 2.6
30B 454 113 1246 544 20 69.2 2.3
ICU 0 148 575 3 27 7 91.3 19.7
ICU (A/E) 0 68 337 49 7 7 53.5 6.1
ETU (A/E) 7356 0 2379 2047 35 1.7 16 165.2 1.1
PBU/MBU 445/0 29/361 1513/1156 0/418 19 4.3 39/49 43.1/26.2 6.1
ISO 2 3 45 4 3 16.7 4.3
Endoscopy 231 36 200 227
Nephrology(DU) 711 304 664 701 4 184.5 1.0
Oncho/Cheamo 1435
Total 34212 8474 90170 33541 380 1.1 1400 71.6 2.7
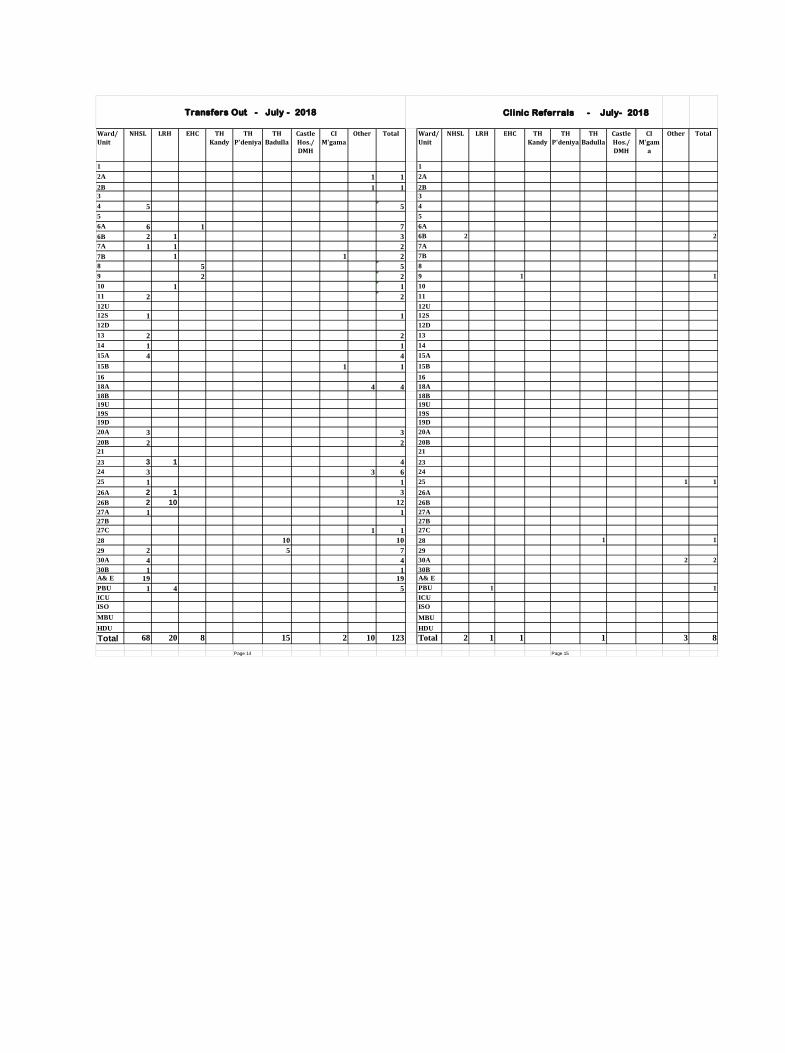
Clinic Referrals - July- 2018
Ward/
Unit
NHSL LRH EHC TH
Kandy
TH
P'deniya
TH
Badulla
Castle
Hos./
DMH
CI
M'gama
Other Total Ward/
Unit
NHSL LRH EHC TH
Kandy
TH
P'deniya
TH
Badulla
Castle
Hos./
DMH
CI
M'gam
a
Other Total
1 1
2A 1 1 2A
2B 1 1 2B
3 3
4 5 5 4
5 5
6A 6 1 7 6A
6B 2 1 3 6B 2 2
7A 1 1 2 7A
7B 1 1 2 7B
8 5 5 8
9 2 2 9 1 1
10 1 1 10
11 2 2 11
12U 12U
12S 1 1 12S
12D 12D
13 2 2 13
14 1 1 14
15A 4 4 15A
15B 1 1 15B
16 16
18A 4 4 18A
18B 18B
19U 19U
19S 19S
19D 19D
20A 3 3 20A
20B 2 2 20B
21 21
23 3 1 4 23
24 3 3 6 24
25 1 1 25 1 1
26A 2 1 3 26A
26B 2 10 12 26B
27A 1 1 27A
27B 27B
27C 1 1 27C
28 10 10 28 1 1
29 2 5 7 29
30A 4 4 30A 2 2
30B 1 1 30B
A& E 19 19 A& E
PBU 1 4 5 PBU 1 1
ICU ICU
ISO ISO
MBU MBU
HDU HDU
Total 68 20 8 15 2 10 123 Total 2 1 1 1 3 8
Page 14 Page 15
Transfers Out - July - 2018

Local Purchase of Drugs - July - 2018
Ward/ Unit Price(Rs.)
1
2A
2B
3
4
5
6A 69600.00
6B
7A
7B 39330.00
8
9
10 111660.00
11 229425.0012U
12S
12D
13 39330.00
14 32775.00
15A 5059.00
15B
16 134740.00
18A
18B
19U
19S
19D
20A
20B
21
23 70470.00
24
25
26A
26B
27A
27B
27C
28
29 35506.25
30A
30B
A & E
PBU/ MBU
ICU 823158.55
ISO
OT -MAIN
OT -NEW
ECG Unit
Surgical Clinic
OPD INJ .Room
All Units
Labour Room
Skin Clinic
Dental Clinic
Onco. Unit
Gyn. Clinic
Chemotherapy Unit
Hematology Unit
ICU (A & E) 4540.00
Total (Rs.) 1595593.80
Page 16
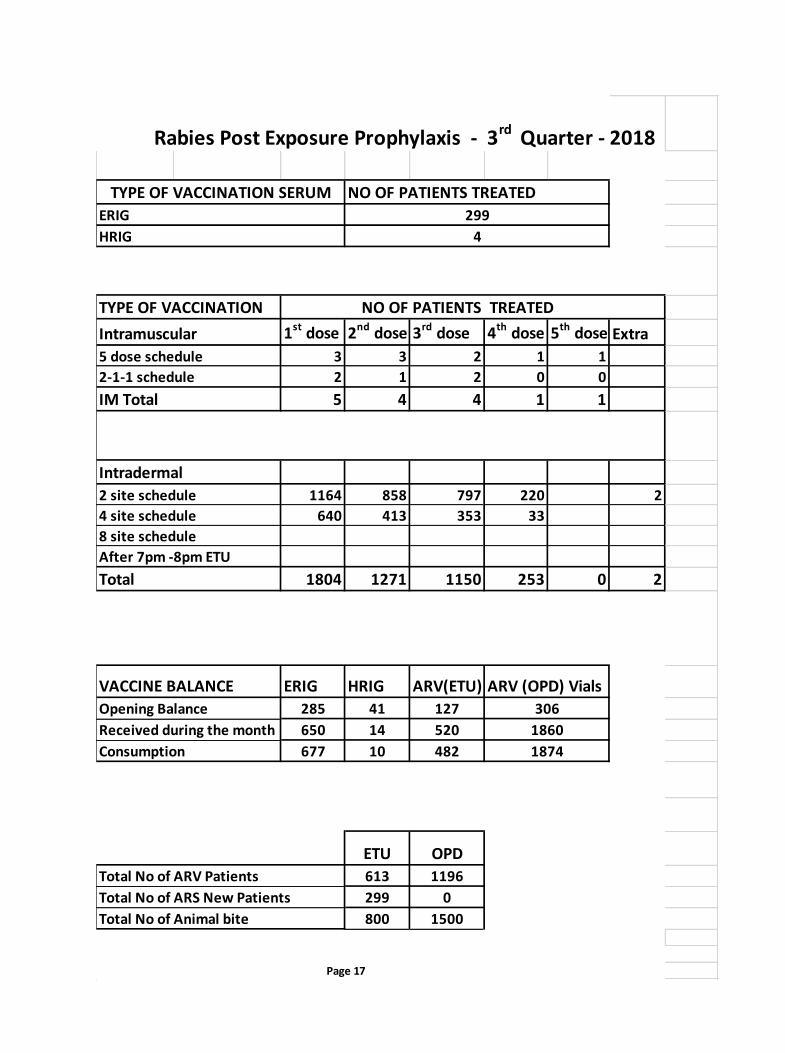
Rabies Post Exposure Prophylaxis - 3rd Quarter - 2018
NO OF PATIENTS TREATED
1st dose 2nd dose 3rd dose 4th dose 5th dose Extra
3 3 2 1 1
2 1 2 0 0
5 4 4 1 1
Intradermal
1164 858 797 220 2
640 413 353 33
1804 1271 1150 253 0 2
VACCINE BALANCE ERIG HRIG ARV(ETU) ARV (OPD) Vials
285 41 127
Received during the month 650 14 520
677 10 482
ETU OPD
Total No of ARV Patients 613 1196
Total No of ARS New Patients 299 0
Total No of Animal bite 800 1500
Page 17
Opening Balance 306
1860
Consumption 1874
Total
TYPE OF VACCINATION No OF PATIENTS TREATED
Intramuscular
5 dose schedule
2-1-1 schedule
IM Total
2 site schedule
4 site schedule
8 site schedule
After 7pm -8pm ETU
TYPE OF VACCINATION SERUM NO OF PATIENTS TREATED
ERIG 299
HRIG 4
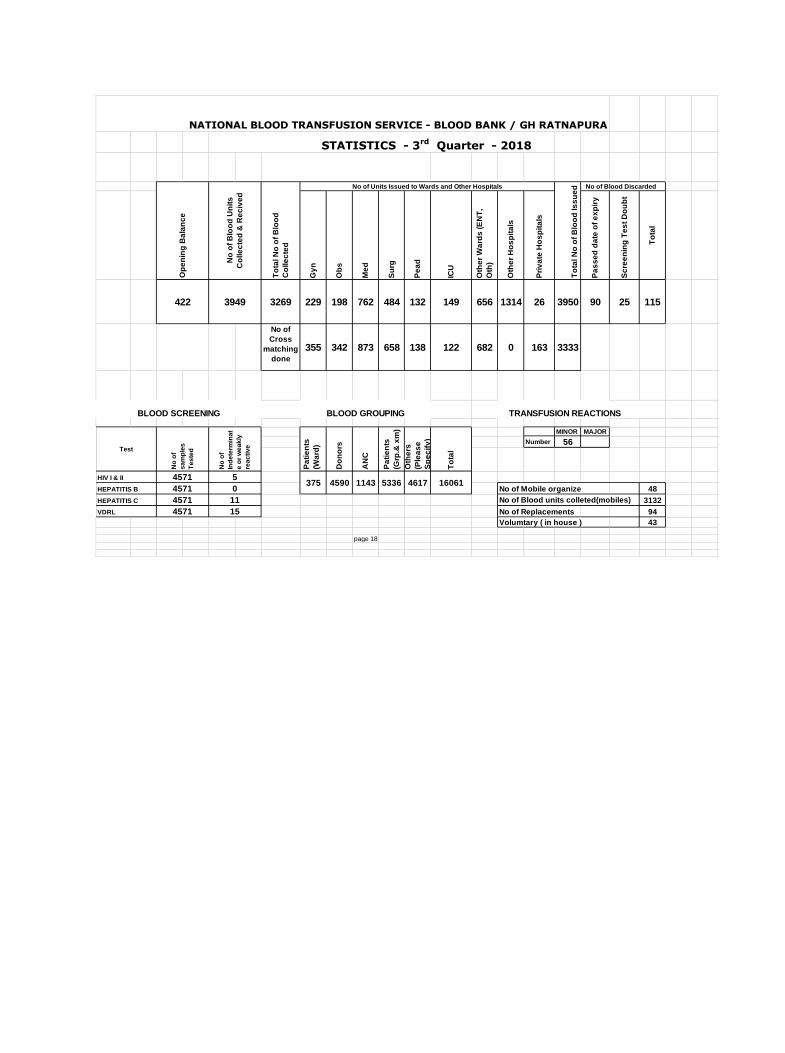
NATIONAL BLOOD TRANSFUSION SERVICE - BLOOD BANK / GH RATNAPURA
STATISTICS - 3rd Quarter - 2018
No of Blood Discarded
Gy
n
Ob
s
Me
d
Su
rg
Pe
ad
ICU
Oth
er
Wa
rds
(E
NT
,
Oth
)
Oth
er
Ho
sp
ita
ls
Pri
va
te H
os
pit
als
Pa
ss
ed
da
te o
f e
xp
iry
Sc
ree
nin
g T
es
t D
ou
bt
To
tal
3269 229 198 762 484 132 149 656 1314 26 3950 90 25 115
No of
Cross
matching
done
355 342 873 658 138 122 682 0 163 3333
TRANSFUSION REACTIONS
MINOR MAJOR
Number 56
No of Mobile organize 48
3132
No of Replacements 94
Volumtary ( in house ) 43
page 18
No of Blood units colleted(mobiles)
VDRL 4571 15
16061HEPATITIS B 4571 0
HEPATITIS C 4571 11
Oth
ers
(Ple
as
e
Sp
ec
ify
)
To
tal
HIV I & II 4571 5375 4590 1143 5336 4617
BLOOD SCREENING BLOOD GROUPING
Test
No
of
sa
mp
les
Te
ste
d
No
of
Ind
ete
rmin
at
e o
r w
ea
kly
rea
cti
ve
Pa
tie
nts
(Wa
rd)
Do
no
rs
AN
C
Pa
tie
nts
(Grp
.& x
m)
Op
en
ing
Ba
lan
ce
No
of
Blo
od
Un
its
Co
lle
cte
d &
Re
civ
ed
To
tal N
o o
f B
loo
d
Co
lle
cte
d
No of Units Issued to Wards and Other Hospitals
To
tal N
o o
f B
loo
d Is
su
ed
422 3949

Type Expenditure
1001 Staff Salary 68,921,912.34
1002 OT Medical Officers 24,163,056.98
OT Nurses 18,107,841.81
OT Other Staff 10,958,488.97
1003 Other Allowances 36,865,465.73
Loan
1101 Travailing Allowances (MO) 14,369.95
Travailing Allowances (Nurses) 43,109.86
Travailing Allowances (Other Staff) 229,919.29
1201 Stationary 363,085.90
1202 Fuel 869,588.20
1203 Foods & Uniforms 6,824,039.13
LP Gas
1204 Bio Gas
Medical Supplies 9,476,090.38
1205-i Maintenance of sewerage
1205-ii Other Supplies 2,086,071.10
1301 Repair of Vehicles 62,283.60
1302 Repairing of Machines 8,700.00
1303 Building Repairs 2,109,438.25
1401 Transport Charges 50,000.00
1402 Telephone & Postal 1,582,377.29
1403 Electricity 10,902,977.90
Water 2,055,800.95
1404 Tax Charges
1405 Laundering
Security & Cleaning
Other
1409 JMO Vehicles(Fuel) 69,180.00
1202 JMO Vehicles(Fuel)
1506 Loan Interest 1,428,521.75
Other
TOTAL 197,192,319.38
Type Expenditure
2002(ii)02 Bio Medical services
2001(ii) Building Maintenance 3,244,320.22
2002 (ii) Maintenance of Electricity
2003 (ii) Maintenance of Vehicales
2103-3 Medical Equipments
2103 (ii)04 Lab Equipments
2002(ii) Air Condition
2002(02) Maintenance & Service 3,928,640.02
2102(02) Medical Equipments service
2002(02) Service Agreement
20102(ii) Office Equipments 364,210.00
2104(ii) Water Supplies Services
2103(ii) Medical Equipments
2103 Liquid Oxygen
2103 Dental Equipments
2103 (ii) Kva 500 Generator
2103 (ii) Maintenance of Insinareter
2103 (11) Telephone Services
2103 (11) Air Condition
2103-11(01) Medical Equipments
2103-(11) Hospital Equipments
2104(11) Electricity Supply of Accident Ward
2401-4 Training Programmes
2502 Training Programmes - MO
1/12/2502 Training Programmes
2502(ii) Estoblishing Stroke Unit
80-2502-(11)cNew Incelator Mechine
2502-20(11) Disaster Reasal Traning
2502(ii) Orthopeadic Unit
2401(11) In Service Training Progrmmes 185,560.00
2103(11) Meshnery & Equipments
2002(11) Medical Equipments service
2103-1(11) Medical Supplies
7,722,730.24
page 19
RECURENT EXPENDITURE BY SOURCE OF FUNDS - July - 2018
CAPITAL - EXPENDITURE BY VOTE
TOTAL

3rd
Quarter - 2018
Post Mortems by Manner of Deaths
Manner of Deaths No. of Post MortemsNatural 75
Suicide 18
Accidents 19
Homicide 1
Pending Investigation 52
Total 165
Medico Legal ExaminationsMLEF Category Number of MLEFAssault ( stab,cut,….etc) 495
Accidents (Road Trafic) 480
Child Abuse 51
Sexual Assaults 20
Drunkenness 56
Abortion
Burns 8
Examination for (sexual/RTA/other)
Examination of accused brought by Police 52
and referred by Court
Sampling for DNA
Fire arm /Trap gun injuries 2
Accidental Injuries( machinery, fall ..etc)
Torture
Wife battery/Husband battery 54
Poisoning
Bite
Incomplete
Strangulation
Stabbing
Hanging
Self Inflicted- Other
Not Concented for Examination 9
Electricution
Total No of Clinical Cases Received
Accidents - others 6
Total 1233
page 20
Medico Legal Statistics
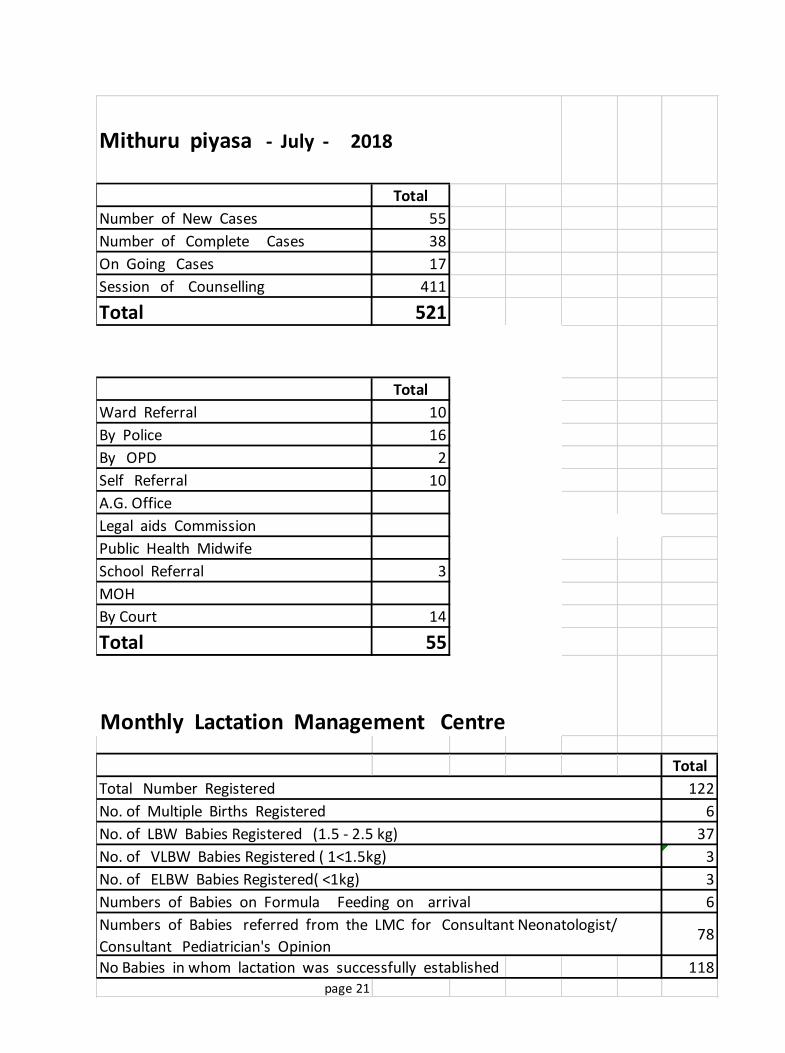
Total
Number of New Cases 55
Number of Complete Cases 38
On Going Cases 17
Session of Counselling 411
Total 521
Total
Ward Referral 10
By Police 16
By OPD 2
Self Referral 10
A.G. Office
Legal aids Commission
Public Health Midwife
School Referral 3
MOH
By Court 14
Total 55
Monthly Lactation Management Centre
Total
122
6
37
3
3
6
No Babies in whom lactation was successfully established 118page 21
Numbers of Babies on Formula Feeding on arrival
Numbers of Babies referred from the LMC for Consultant Neonatologist/
Consultant Pediatrician's Opinion 78
Mithuru piyasa - July - 2018
Total Number Registered
No. of Multiple Births Registered
No. of LBW Babies Registered (1.5 - 2.5 kg)
No. of VLBW Babies Registered ( 1<1.5kg)
No. of ELBW Babies Registered( <1kg)

Transfers in Local Hospitals
No1 Embilipitiya 77
2 Balangoda 206
3 Kahawatta 193
4 Pelmadulla 32
5 Godakawela 5
6 Ranwala
7 Pallebedda 6
8 Kalthota
9 Endana
10 Belihuloya
11 Nivithigala 70
12 Kalawana 137
13 Kiribathgala 33
14 Kiriella 75
15 Ayagama 45
16 Pothupitiya 63
17 Eheliyagoda 154
18 Erathna 41
19 Theppanawa 18
20 Gallella 66
21 Gilimale 31
22 Hapugasthanna 1
23 Alupola 12
24 Rakwana 3
25 Kolonna
26 Weligepola
27 Maratenna
28 Mahawalathenna
29 Sooriyakanda
30 Kiriporuwa
31 Deniyagala
32 Ayurwedic
33 Weragama 1
34 Hunuwala
35 Opanayaka
36 Sooriyaara
37 Omalpe
38 Udawalawa
39 Dombagammana
40 Others 3
1272
July - 2018
Local hospital
Total
page 22


![Knowledge, attitude and predictors of diabetic retinopathy ...[5]. A 41% diabetic retinopathy prevalence was reported in Embu provincial Hospital, which is a Ministry of Health provincial](https://static.documents.pub/doc/80x56/5e672ea66648ca498151ae1a/knowledge-attitude-and-predictors-of-diabetic-retinopathy-5-a-41-diabetic.jpg)


