137
2009-2018 FORECAST REPORT OF CAPACITY, ENERGY, LOADS, AND TRANSMISSION System Planning April 2009

2009-2018 FORECAST REPORT OF CAPACITY, ENERGY, LOADS, AND TRANSMISSION
System Planning
April 2009


CELT Report - April 2009 Page i ISO New England Inc.
Introduction 2009 ISO New England (ISO-NE) Control Area Forecast Attached is the April 2009 issue of the “2009-2018 Forecast Report of Capacity, Energy, Loads, and Transmission” (CELT Report). This forecast report can be considered a source of assumptions for use in electric planning and reliability studies, and fulfills in part the reporting requirements of the Department of Energy (DOE), North American Electric Reliability Corporation (NERC) - Reliability Assessment Subcommittee (RAS), Northeast Power Coordinating Council (NPCC), and New England Power Pool (NEPOOL). Supplementary information will be filed with DOE's Energy Information Administration (EIA) and the Federal Energy Regulatory Commission (FERC).
This forecast report provides assumptions for the ISO New England Control Area and not for all of New England. However, the Total New England Load and Total New England Capacity are included in the Section 1 summaries for reference purposes.
In Section 1, the ISO New England Control Area reference load forecast may be characterized as having a fifty percent chance of being exceeded. The load forecast distributions for the years 2009 through 2018 are included on Page 6 of this report. Additional information on the load forecast, including the forecast bandwidths, is available on the ISO New England web site (see links below). Also included in this year’s CELT Report are two new Demand Response reports in Sections 1.9 and 1.10. These include the 2008 actual monthly enrollment data for the demand response programs by load zone and market. This year the Summary of Generation Additions and Reratings sections (previously 1.4 and 1.6) have not been included in the CELT Report.
Capacity information through the winter of 2009/2010 is based on the generator Seasonal Claimed Capabilities.1 Thereafter, the CELT Report takes into account the current generating capacity supply obligations for the Forward Capacity Market’s (FCM) 2010-2011 and 2011-2012 Capacity Commitment Periods at the time of publication. These include new and existing generating resources, demand resources, as well as firm imports. Beginning in summer 2010, the CELT generating capacity included in the Section 1 totals is consistent with the generating resources that have Forward Capacity Market obligations. The last capacity assumption, in this case the obligation for the 2011-2012 Capacity Commitment Period, is carried through and assumed to remain in place through the end of the CELT reporting period.
In addition, new resources that are not included in the FCM obligations, but are part of the ISO New England Generator Interconnection Queue2 and are expected to become commercial in 2009, are also included in the CELT Report. The new resources included in the CELT Report are only a small portion of the new generating projects in the ISO New England Generator Interconnection Queue. Commencing with the summer 2010, only the 2010-2012 FCM obligations are represented.
1 For more information on generating assets, refer to the Seasonal Claimed Capability Report at: http://www.iso-ne.com/genrtion_resrcs/snl_clmd_cap/index.html. 2 The Generator Interconnection Queue is posted on the ISO New England website at http://www.iso-ne.com/genrtion_resrcs/nwgen_inter/status/index.html.

Introduction 2009 ISO New England (ISO-NE) Control Area Forecast (Continued)
CELT Report - April 2009 Page ii ISO New England Inc.
The capacity totals include capacity associated with demand resources. Prior to summer 2010, the demand response capacity in Section 1 is based on the amount of demand response available at the time of the 2008 summer and 2008/09 winter peaks. Beginning in summer 2010, the values are based on demand resources with obligations in FCM. Imports participating in the 2010-2012 FCM are also included in the CELT Report. Section 2 lists generating assets by Lead Participant and includes EIA Plant Codes. Section 3 lists all of the units by fuel/unit type.
New this year is Section 4, “Forward Capacity Market Resource Capabilities.” The October 31, 2008 Forward Capacity Market (FCM)/Queue Amendments filing (FERC Docket ER09237 http://www.iso-ne.com/regulatory/ferc/filings/2008/oct/er09-237-000_10-8-31_fcm_queue.pdf) established the Capacity Network Resource Capability (CNRC) values for each generating resource. It is the first time this information has been provided in a public document.
The CNRC defines the amount of Capacity Network Resource Interconnection Service Rights that must be maintained for the generator. The CNRC also defines whether an Interconnection Request is required for a proposed increase in Capacity Network Resource Capability in accordance with Schedule 22 and 23 of the Tariff (Large/Small Generator Interconnection Procedures, http://www.iso-ne.com/regulatory/tariff/sect_2/index.html) and whether an initial interconnection analysis is required under FCM qualification for a proposed increase in output from an Existing Generating Capacity Resource. Section 4.1 lists the CNRC values available at the time of publication of the CELT Report for generating assets by resource. Section 4.2, “Multi-Year Obligation Resources,” is a list of FCM resources with a capacity supply obligation, in which an election has been made to offer their capacity for up to four additional and consecutive Capacity Commitment Periods in compliance with Section III.13.1.1.2.2.4 of Market Rule 1.
Section 5 lists links associated with transmission related documents available on our website at: http://www.iso-ne.com. Appendix A defines the commonly used terms and abbreviations used in this report. Appendix B provides a list of the Federal Information Processing Standard (FIPS) Codes and the list of Regional System Plan (RSP) Subareas, used in Section 4.1.
CELT Reports and related documents and are available on the ISO New England website at:
http://www.iso-ne.com/trans/celt/report/index.html http://www.iso-ne.com/trans/celt/fsct_detail/index.html http://www.iso-ne.com/genrtion_resrcs/snl_clmd_cap/index.html http://www.iso-ne.com/trans/rsp/index.html http://www.iso-ne.com/genrtion_resrcs/nwgen_inter/index.html http://www.iso-ne.com/genrtion_resrcs/nwgen_inter/status/index.html
Any comments regarding the information contained herein would be greatly appreciated. Please do not hesitate to contact ISO New England at [email protected].
CELT Report - April 2009 Page iii ISO New England Inc.
Preface This 2009 edition of the "Forecast Report of Capacity, Energy, Loads and Transmission" (CELT) reflects a load forecast based upon demographic, economic, and market information available on January 1, 2009 for publication in April 2009. Accordingly, this CELT edition supersedes prior CELT publications. This report presents the ISO-NE Control Area 2009-2018 forecast of:
• Electric energy demand and peak load; • Existing ISO-NE Control Area electrical capacity and proposed changes; • Scheduled and proposed transmission changes; with listings of existing and summaries of proposed generation projects.
Generating asset details are represented in three sections of this report for three different periods. Section 2.1 Existing Capability by Lead Participant captures a snapshot of January 1, 2009. Section 3.1 Existing Winter Capability by Fuel/Unit Type captures a snapshot of the Winter Peak on December 8, 2008. Section 3.2 Expected Summer Capability by Fuel/Unit Type attempts to capture the values currently known in our system for the Summer of 2009. This report represents the efforts of Market Participants' staffs, jointly with ISO-NE, under the review of the Load Forecasting and Reliability Committees. Additional information regarding the documentation of the electric energy demand and peak load forecasts presented in this report may be found on ISO-NE’s web site at:
http://www.iso-ne.com/trans/celt/fsct_detail/index.html

CELT Report - April 2009 Page iv ISO New England Inc.
Table of Contents
Introduction ............................................................................................ i 2009 ISO New England (ISO-NE) Control Area Forecast ....................... i
Preface .................................................................................................. iii
Section 1 Summaries ............................................................................................ 1 1.1 Summer Peak Capabilities and Load Forecast (MW) ....................... 1 1.2 Winter Peak Capabilities and Load Forecast (MW) .......................... 2 1.3 Summary of Summer Capability by Fuel/Unit Type .......................... 3 1.4 Summary of Winter Capability by Fuel/Unit Type ............................. 4 1.5 Actual and Forecasted Energy and Peak Loads .............................. 5 1.6 Seasonal Peak Load Forecast Distributions ..................................... 6 1.7 Demand Response Ready to Respond Available in 2008 ................ 7 1.8 Demand Response Approved Available in 2008 .............................. 9
Section 2 Control Area Capability ...................................................................... 11 2.1 Existing Capability by Lead Participant ........................................... 11 2.1 Endnotes ......................................................................................... 70 2.2 Net of Purchases and Sales ........................................................... 71 2.3 Deactivated Units Removed from ISO-NE Control Area Capability 72
Section 3 Capability by Fuel/Unit Type .............................................................. 73 3.1 Existing Winter Capability by Fuel/Unit Type .................................. 73 3.2 Expected Summer Capability by Fuel/Unit Type ............................ 81
Section 4 Forward Capacity Market Resource Capabilities ............................ 88 4.1 Capacity Network Resource Capability (CNRC) List ..................... 88 4.2 Multi-Year Obligation Resources ................................................. 115
Section 5 Transmission Information ............................................................... 117 5.1 Links ............................................................................................. 117
Appendix A ....................................................................................... 118 A.1 Definitions .................................................................................... 118 A.2 Company Abbreviations ............................................................... 121 A.3 Column Abbreviations .................................................................. 124
Appendix B ....................................................................................... 127 B.1 Federal Information Processing Standard (FIPS) Codes ............ 127 B.2 Regional System Plan (RSP) Subarea Descriptions ................... 128

2009-2018 FORECAST REPORT OF
CAPACITY, ENERGY, LOADS AND TRANSMISSION
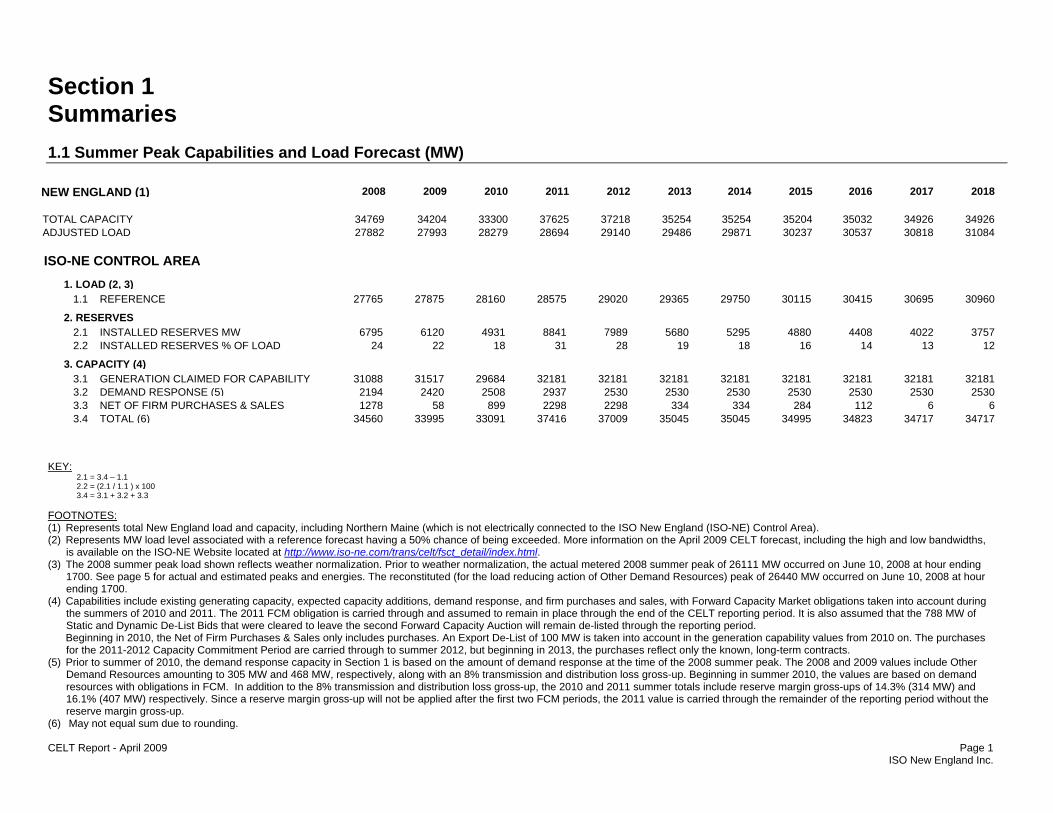
KEY: 2.1 = 3.4 – 1.1 2.2 = (2.1 / 1.1 ) x 100 3.4 = 3.1 + 3.2 + 3.3 FOOTNOTES: (1) Represents total New England load and capacity, including Northern Maine (which is not electrically connected to the ISO New England (ISO-NE) Control Area). (2) Represents MW load level associated with a reference forecast having a 50% chance of being exceeded. More information on the April 2009 CELT forecast, including the high and low bandwidths,
is available on the ISO-NE Website located at http://www.iso-ne.com/trans/celt/fsct_detail/index.html. (3) The 2008 summer peak load shown reflects weather normalization. Prior to weather normalization, the actual metered 2008 summer peak of 26111 MW occurred on June 10, 2008 at hour ending
1700. See page 5 for actual and estimated peaks and energies. The reconstituted (for the load reducing action of Other Demand Resources) peak of 26440 MW occurred on June 10, 2008 at hour ending 1700.
(4) Capabilities include existing generating capacity, expected capacity additions, demand response, and firm purchases and sales, with Forward Capacity Market obligations taken into account during the summers of 2010 and 2011. The 2011 FCM obligation is carried through and assumed to remain in place through the end of the CELT reporting period. It is also assumed that the 788 MW of Static and Dynamic De-List Bids that were cleared to leave the second Forward Capacity Auction will remain de-listed through the reporting period.
Beginning in 2010, the Net of Firm Purchases & Sales only includes purchases. An Export De-List of 100 MW is taken into account in the generation capability values from 2010 on. The purchases for the 2011-2012 Capacity Commitment Period are carried through to summer 2012, but beginning in 2013, the purchases reflect only the known, long-term contracts.
(5) Prior to summer of 2010, the demand response capacity in Section 1 is based on the amount of demand response at the time of the 2008 summer peak. The 2008 and 2009 values include Other Demand Resources amounting to 305 MW and 468 MW, respectively, along with an 8% transmission and distribution loss gross-up. Beginning in summer 2010, the values are based on demand resources with obligations in FCM. In addition to the 8% transmission and distribution loss gross-up, the 2010 and 2011 summer totals include reserve margin gross-ups of 14.3% (314 MW) and 16.1% (407 MW) respectively. Since a reserve margin gross-up will not be applied after the first two FCM periods, the 2011 value is carried through the remainder of the reporting period without the reserve margin gross-up.
(6) May not equal sum due to rounding. CELT Report - April 2009 Page 1 ISO New England Inc.
ISO-NE CONTROL AREA
2008 201720162015201420132012201120102009 2018NEW ENGLAND (1)
TOTAL CAPACITY 34769 34204 33300 37625 37218 35254 35254 35204 35032 34926 34926ADJUSTED LOAD 27882 27993 28279 28694 29140 29486 29871 30237 30537 30818 31084
1. LOAD (2, 3) 1.1 REFERENCE 3096030695304153011529750293652902028575281602787527765
2. RESERVES 2.1 INSTALLED RESERVES MW 375740224408488052955680798988414931612067952.2 INSTALLED RESERVES % OF LOAD 1213141618192831182224
3. CAPACITY (4) 3.1 GENERATION CLAIMED FOR CAPABILITY 32181321813218132181321813218132181321812968431517310883.2 DEMAND RESPONSE (5) 253025302530253025302530253029372508242021943.3 NET OF FIRM PURCHASES & SALES 66112284334334229822988995812783.4 TOTAL (6) 3471734717348233499535045350453700937416330913399534560
Section 1 Summaries 1.1 Summer Peak Capabilities and Load Forecast (MW)
Section 1 - Summaries
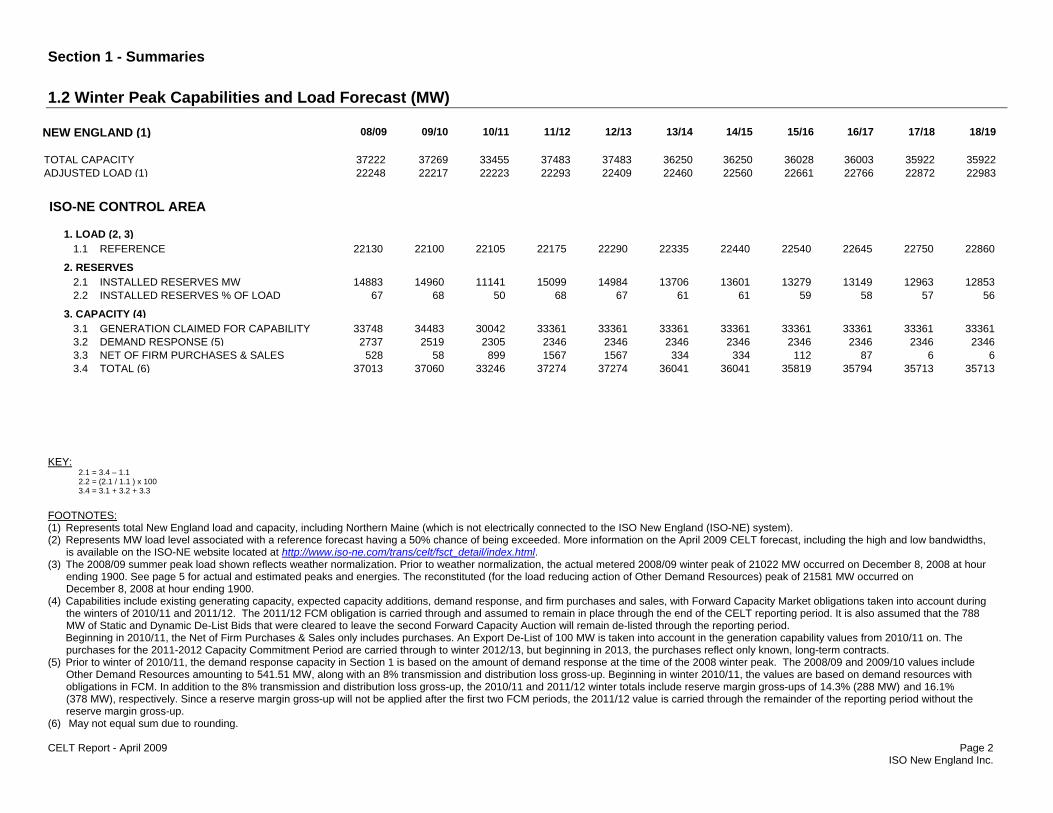
KEY: 2.1 = 3.4 – 1.1 2.2 = (2.1 / 1.1 ) x 100 3.4 = 3.1 + 3.2 + 3.3
FOOTNOTES: (1) Represents total New England load and capacity, including Northern Maine (which is not electrically connected to the ISO New England (ISO-NE) system). (2) Represents MW load level associated with a reference forecast having a 50% chance of being exceeded. More information on the April 2009 CELT forecast, including the high and low bandwidths,
is available on the ISO-NE website located at http://www.iso-ne.com/trans/celt/fsct_detail/index.html. (3) The 2008/09 summer peak load shown reflects weather normalization. Prior to weather normalization, the actual metered 2008/09 winter peak of 21022 MW occurred on December 8, 2008 at hour
ending 1900. See page 5 for actual and estimated peaks and energies. The reconstituted (for the load reducing action of Other Demand Resources) peak of 21581 MW occurred on December 8, 2008 at hour ending 1900.
(4) Capabilities include existing generating capacity, expected capacity additions, demand response, and firm purchases and sales, with Forward Capacity Market obligations taken into account during the winters of 2010/11 and 2011/12. The 2011/12 FCM obligation is carried through and assumed to remain in place through the end of the CELT reporting period. It is also assumed that the 788 MW of Static and Dynamic De-List Bids that were cleared to leave the second Forward Capacity Auction will remain de-listed through the reporting period.
Beginning in 2010/11, the Net of Firm Purchases & Sales only includes purchases. An Export De-List of 100 MW is taken into account in the generation capability values from 2010/11 on. The purchases for the 2011-2012 Capacity Commitment Period are carried through to winter 2012/13, but beginning in 2013, the purchases reflect only known, long-term contracts.
(5) Prior to winter of 2010/11, the demand response capacity in Section 1 is based on the amount of demand response at the time of the 2008 winter peak. The 2008/09 and 2009/10 values include Other Demand Resources amounting to 541.51 MW, along with an 8% transmission and distribution loss gross-up. Beginning in winter 2010/11, the values are based on demand resources with obligations in FCM. In addition to the 8% transmission and distribution loss gross-up, the 2010/11 and 2011/12 winter totals include reserve margin gross-ups of 14.3% (288 MW) and 16.1% (378 MW), respectively. Since a reserve margin gross-up will not be applied after the first two FCM periods, the 2011/12 value is carried through the remainder of the reporting period without the reserve margin gross-up.
(6) May not equal sum due to rounding. CELT Report - April 2009 Page 2 ISO New England Inc.
ISO-NE CONTROL AREA
08/09 17/1816/1715/1614/1513/1412/1311/1210/1109/10 18/19NEW ENGLAND (1)
TOTAL CAPACITY 37222 37269 33455 37483 37483 36250 36250 36028 36003 35922 35922ADJUSTED LOAD (1) 22248 22217 22223 22293 22409 22460 22560 22661 22766 22872 22983
1. LOAD (2, 3) 1.1 REFERENCE 2286022750226452254022440223352229022175221052210022130
2. RESERVES 2.1 INSTALLED RESERVES MW 12853129631314913279136011370614984150991114114960148832.2 INSTALLED RESERVES % OF LOAD 5657585961616768506867
3. CAPACITY (4) 3.1 GENERATION CLAIMED FOR CAPABILITY 33361333613336133361333613336133361333613004234483337483.2 DEMAND RESPONSE (5) 234623462346234623462346234623462305251927373.3 NET OF FIRM PURCHASES & SALES 668711233433415671567899585283.4 TOTAL (6) 3571335713357943581936041360413727437274332463706037013
1.2 Winter Peak Capabilities and Load Forecast (MW)

Section 1 - Summaries
FOOTNOTES: (1) Gas/oil units are not necessarily fully operable on both fuels. New wind project nameplate ratings have been used where expected output data is not currently available. (2) Purchases and sales are with entities outside the ISO-NE Control Area boundary. Beginning in 2010, the Net of Firm Purchases & Sales only includes purchases. An Export De-List of 100 MW is
taken into account in the generation capability values from 2010 on. The purchases for the 2011-2012 Capacity Commitment Period are carried through to summer 2012, but beginning in 2013, the purchases reflect only the known, long-term contracts.
(3) May not equal sum due to rounding. (4) Capabilities include existing generating capacity, expected capacity additions, demand response, and firm purchases and sales, with Forward Capacity Market obligations taken into account during
the summers of 2010 and 2011. The 2011 FCM obligation is carried through and assumed to remain in place through the end of the CELT reporting period. It is also assumed that the 788 MW of Static and Dynamic De-List Bids that were cleared to leave the second Forward Capacity Auction will remain de-listed through the reporting period.
CELT Report - April 2009 Page 3 ISO New England Inc.
2008 201720162015201420132012201120102009 2018
NUCLEAR STEAM 4548 4541 4533 4668 4668 4668 4668 4668 4668 4668 4668
HYDRO (DAILY CYCLE - PONDAGE) 331 320 284 302 302 302 302 302 302 302 302HYDRO (DAILY CYCLE - RUN OF RIVER) 634 497 321 326 326 326 326 326 326 326 326HYDRO (PUMPED STORAGE) 1689 1689 1435 1589 1589 1589 1589 1589 1589 1589 1589HYDRO (WEEKLY CYCLE) 876 878 823 867 867 867 867 867 867 867 867
GAS COMBINED CYCLE 7279 7330 6914 7356 7356 7356 7356 7356 7356 7356 7356GAS/OIL COMBINED CYCLE 3941 4019 3776 4648 4648 4648 4648 4648 4648 4648 4648
GAS COMBUSTION (GAS) TURBINE 417 536 547 927 927 927 927 927 927 927 927GAS/OIL COMBUSTION (GAS) TURBINE 384 492 466 471 471 471 471 471 471 471 471OIL COMBUSTION (GAS) TURBINE 1022 1070 1054 1053 1053 1053 1053 1053 1053 1053 1053
COAL STEAM 2745 2745 2540 2684 2684 2684 2684 2684 2684 2684 2684GAS STEAM 21 21 19 21 21 21 21 21 21 21 21GAS/OIL STEAM 2994 2986 2862 2983 2983 2983 2983 2983 2983 2983 2983OIL STEAM 3104 3126 3005 3107 3107 3107 3107 3107 3107 3107 3107
GAS INTERNAL COMBUSTION 0 0 0 0 0 0 0 0 0 0 0OIL INTERNAL COMBUSTION 155 184 133 150 150 150 150 150 150 150 150
BIO/REFUSE 942 993 953 934 934 934 934 934 934 934 934
WIND TURBINE 5 89 10 89 89 89 89 89 89 89 89
GAS FUEL CELL 0 0 8 8 8 8 8 8 8 8 8MISC. OTHER 0 1 0 0 0 0 0 0 0 0 0
DEMAND RESPONSE 2194 2420 2508 2937 2530 2530 2530 2530 2530 2530 2530
NET OF PURCHASES AND SALES (2) 1278 58 899 2298 2298 334 334 284 112 6 6
TOTAL ISO-NE CONTROL AREA CAPACITY (3) (4) 34560 3499533995 33091 37416 37009 35045 35045 34823 34717 34717
1.3 Summary of Summer Capability by Fuel/Unit Type(1)
Section 1 - Summaries
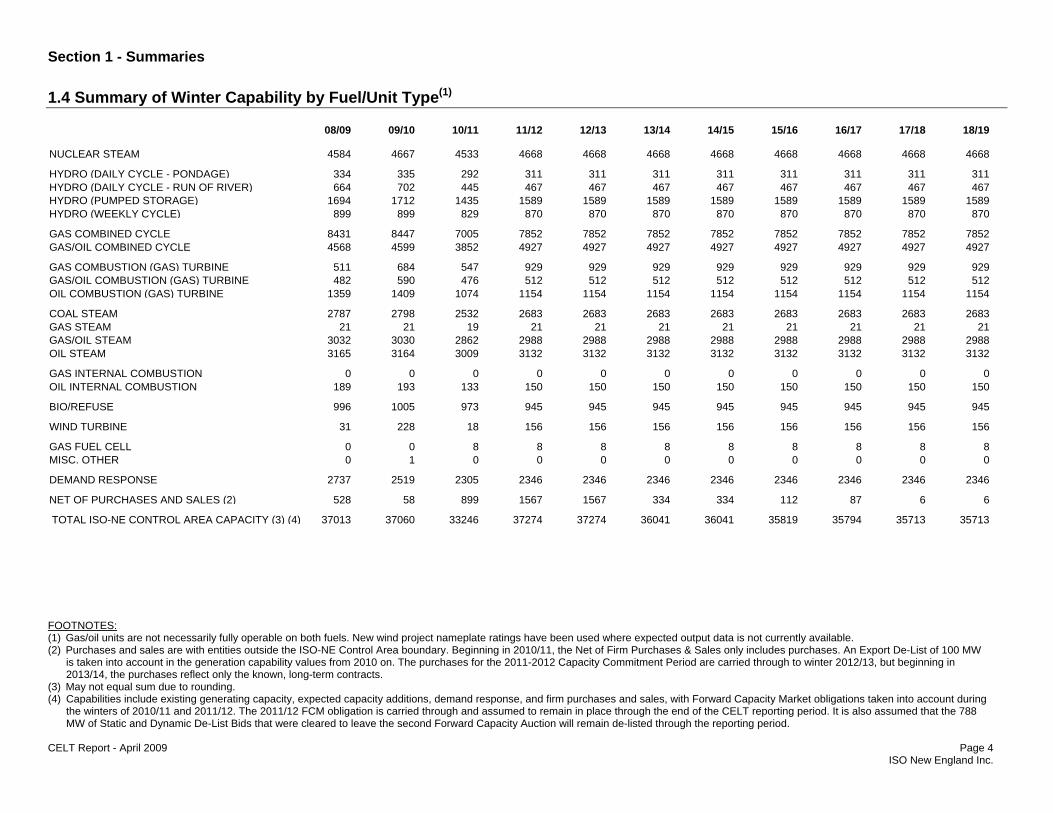
FOOTNOTES: (1) Gas/oil units are not necessarily fully operable on both fuels. New wind project nameplate ratings have been used where expected output data is not currently available. (2) Purchases and sales are with entities outside the ISO-NE Control Area boundary. Beginning in 2010/11, the Net of Firm Purchases & Sales only includes purchases. An Export De-List of 100 MW
is taken into account in the generation capability values from 2010 on. The purchases for the 2011-2012 Capacity Commitment Period are carried through to winter 2012/13, but beginning in 2013/14, the purchases reflect only the known, long-term contracts.
(3) May not equal sum due to rounding. (4) Capabilities include existing generating capacity, expected capacity additions, demand response, and firm purchases and sales, with Forward Capacity Market obligations taken into account during
the winters of 2010/11 and 2011/12. The 2011/12 FCM obligation is carried through and assumed to remain in place through the end of the CELT reporting period. It is also assumed that the 788 MW of Static and Dynamic De-List Bids that were cleared to leave the second Forward Capacity Auction will remain de-listed through the reporting period.
CELT Report - April 2009 Page 4 ISO New England Inc.
08/09 17/1816/1715/1614/1513/1412/1311/1210/1109/10 18/19
4584 4667 4533 4668 4668 4668 4668 4668 4668 4668NUCLEAR STEAM 4668
334 335 292 311 311 311 311 311 311 311HYDRO (DAILY CYCLE - PONDAGE) 311664 702 445 467 467 467 467 467 467 467HYDRO (DAILY CYCLE - RUN OF RIVER) 467
1694 1712 1435 1589 1589 1589 1589 1589 1589 1589HYDRO (PUMPED STORAGE) 1589899 899 829 870 870 870 870 870 870 870HYDRO (WEEKLY CYCLE) 870
8431 8447 7005 7852 7852 7852 7852 7852 7852 7852GAS COMBINED CYCLE 78524568 4599 3852 4927 4927 4927 4927 4927 4927 4927GAS/OIL COMBINED CYCLE 4927
511 684 547 929 929 929 929 929 929 929GAS COMBUSTION (GAS) TURBINE 929482 590 476 512 512 512 512 512 512 512GAS/OIL COMBUSTION (GAS) TURBINE 512
1359 1409 1074 1154 1154 1154 1154 1154 1154 1154OIL COMBUSTION (GAS) TURBINE 1154
2787 2798 2532 2683 2683 2683 2683 2683 2683 2683COAL STEAM 268321 21 19 21 21 21 21 21 21 21GAS STEAM 21
3032 3030 2862 2988 2988 2988 2988 2988 2988 2988GAS/OIL STEAM 29883165 3164 3009 3132 3132 3132 3132 3132 3132 3132OIL STEAM 3132
0 0 0 0 0 0 0 0 0 0GAS INTERNAL COMBUSTION 0189 193 133 150 150 150 150 150 150 150OIL INTERNAL COMBUSTION 150
996 1005 973 945 945 945 945 945 945 945BIO/REFUSE 945
31 228 18 156 156 156 156 156 156 156WIND TURBINE 156
0 0 8 8 8 8 8 8 8 8GAS FUEL CELL 80 1 0 0 0 0 0 0 0 0MISC. OTHER 0
2737 2519 2305 2346 2346 2346 2346 2346 2346 2346DEMAND RESPONSE 2346
528 58 899 1567 1567 334 334 112 87 6NET OF PURCHASES AND SALES (2) 6
TOTAL ISO-NE CONTROL AREA CAPACITY (3) (4) 37013 3581937060 33246 37274 37274 36041 36041 35794 35713 35713
1.4 Summary of Winter Capability by Fuel/Unit Type(1)

Section 1 - Summaries
FOOTNOTES: A ACTUAL (1) Recognizing that the seasonal peaks usually occur within a few months of the year, the forecasted monthly peaks of July and August have been replaced by the summer peak, and December and
January have been replaced by the winter peak. (2) Winter beginning in December of the year shown. (3) May not equal sum due to rounding. (4) Forecasted value only. (5) Compound Annual Growth Rate (%). CELT Report - April 2009 Page 5 ISO New England Inc.
JAN FEB MAR APR MAY JUN JUL AUG SEP OCT NOV DEC
2008 ACTUAL
MONTHLY PEAK LOAD - MW 21782 20498 18377 16992 17926 26111 24723 22192 22204 17685 19362 21022MONTHLY NET ENERGY - GWH 11751 10877 11002 9814 9896 11338 13021 11569 10615 10185 10293 11387
JAN FEB MAR APR MAY JUN JUL AUG SEP OCT NOV DEC
2009 FORECAST
MONTHLY PEAK LOAD - MW 20701 21160 20130 17705 20005 24570 27875 27875 22070 18545 19925 22100AMONTHLY NET ENERGY - GWH 12004 10399 11020 8787 10235 10738 12703 13114 9799 9696 10570 12095A
JAN FEB MAR APR MAY JUN JUL AUG SEP OCT NOV DEC
2010 FORECAST
MONTHLY PEAK LOAD - MW 22100 21145 20130 17705 20100 24755 28160 28160 22175 18550 19925 22105MONTHLY NET ENERGY - GWH 12142 10383 11004 8773 10262 10769 12740 13153 9826 9668 10544 12065
2008 2009 2010 2011 2012 2013 2014 2015 2016 2017 2018 2009 to 2018 CAGR (5)
SUMMER PEAK - MW 26111 27875 28160 28575 29020 29365 29750 30115 30415 30695 30960 1.2AWINTER PEAK - MW (2) 21022 22100 22105 22175 22290 22335 22440 22540 22645 22750 22860 0.4ANET ANNUAL ENERGY - GWH (3) 131739 131315 131330 132350 134015 134635 136085 137540 139025 140565 142125 0.9A (4)
1.5 Actual and Forecasted Energy and Peak Loads(1)

Section 1 - Summaries
FOOTNOTES: (1) WTHI - a three-day weighted temperature-humidity index for eight New England weather stations. WTHI is the weather variable used in producing the summer peak load forecast. For more
information on the weather variables see http://www.iso-ne.com/trans/celt/fsct_detail/. (2) Dry-bulb temperature (in degrees Fahrenheit) shown in the summer season is for informational purposes only. (3) Dry-bulb temperature (in degrees Fahrenheit) shown in the winter season is a weighted value from eight New England weather stations. CELT Report - April 2009 Page 6 ISO New England Inc.
1.6 Seasonal Peak Load Forecast Distributions
Peak Load Forecast at Milder Than Expected Weather
Reference Forecast at Expected Weather Peak Load Forecast at More Extreme Than Expected Weather
Summer (MW) 2009 26575 26835 27085 27485 27875 28250 28575 29110 29780 30320 2010 26830 27100 27350 27765 28160 28545 28880 29425 30110 30665 2011 27225 27500 27755 28175 28575 28965 29305 29860 30580 31150 2012 27650 27930 28185 28615 29020 29415 29760 30325 31075 31665 2013 27980 28260 28520 28955 29365 29765 30115 30685 31470 32070 2014 28345 28630 28895 29335 29750 30155 30510 31085 31900 32515 2015 28695 28980 29250 29695 30115 30525 30885 31470 32305 32930 2016 28980 29270 29540 29990 30415 30830 31195 31780 32635 33270 2017 29245 29540 29810 30265 30695 31115 31480 32075 32950 33590 2018 29500 29795 30070 30525 30960 31385 31750 32350 33235 33885
WTHI (1) 78.8 79 79.3 79.7 80.1 80.5 80.8 81.4 82 82.5 Dry-Bulb Temperature (2) 88.5 88.9 89.2 89.9 90.4 91.2 92.2 92.9 94.2 95.4
Probability of Forecast Being Exceeded 90% 80% 70% 60% 50% 40% 30% 20% 10% 5%
Winter (MW) 2009/10 21640 21755 21830 21925 22100 22250 22400 22535 22850 23145 2010/11 21645 21760 21835 21930 22105 22255 22405 22540 22855 23150 2011/12 21715 21830 21905 22000 22175 22325 22475 22610 22925 23220 2012/13 21825 21940 22020 22115 22290 22440 22595 22730 23040 23335 2013/14 21875 21990 22065 22165 22335 22490 22645 22780 23085 23380 2014/15 21975 22090 22165 22260 22440 22590 22745 22880 23185 23480 2015/16 22070 22190 22265 22360 22540 22695 22845 22985 23285 23580 2016/17 22175 22290 22370 22465 22645 22800 22950 23090 23390 23685 2017/18 22275 22395 22470 22570 22750 22905 23060 23200 23500 23790
2018/19 22385 22505 22580 22680 22860 23015 23170 23310 23605 23900
Dry-Bulb Temperature (3) 10.8 9.7 9.1 8.3 6.8 5.6 4.4 3.3 0.9 -1.3

Section 1 - Summaries
FOOTNOTES: (1) May not equal sum due to rounding. (2) Does not include Transmission and Distribution Loss or Reserve Margin Gross-Up. CELT Report - April 2009 Page 7 ISO New England Inc.
AprilFebruary October December August NovemberMarchJanuary May June September
July Load Zone
1,350Assets CT 1,366 1,381 1,397 1,427 1,418 1,412 1,439 1,442 1,454 1,468 1,495 7.3RT Price 7.3 7.3 7.3 7.3 7.3 7.3 7.3 7.3 7.3 7.3 7.3
737.1RT 30-Min 739.8 750.9 754.3 758.8 741.3 717.9 733.6 735.5 761.9 732.9 735.7-RT 2-Hour - - - - - - - - - - --Profiled - - - - - - - - - - -
52Assets ME 50 54 53 57 58 59 62 67 69 79 89-RT Price - - - - - - - - - - -
319.6RT 30-Min 316.8 324.5 325.3 329.1 329.8 321.0 321.0 336.0 338.9 340.9 346.0 78.6RT 2-Hour 78.6 82.8 73.8 75.5 75.5 72.7 85.0 115.0 122.8 122.8 132.1 11.0Profiled 11.0 11.0 11.0 11.0 11.0 11.0 11.0 11.0 11.0 11.0 11.0
299Assets NEMA 302 313 339 348 360 370 371 381 400 414 428 31.0RT Price 30.9 30.9 30.9 30.9 30.9 30.9 30.1 30.2 31.0 30.8 30.8
117.9RT 30-Min 117.2 119.7 127.7 130.9 132.6 135.8 137.7 139.8 151.2 170.7 175.1-RT 2-Hour - - - - 8.0 - 1.6 1.6 7.9 6.9 6.9-Profiled - - - - - - - - - - -
71Assets NH 69 75 77 88 96 106 108 118 126 132 149 4.5RT Price 4.5 4.5 4.5 4.5 4.5 4.5 4.5 4.5 4.5 4.5 4.5 68.5RT 30-Min 63.9 38.3 33.8 41.4 48.2 56.6 57.6 60.4 68.5 70.1 112.4 1.7RT 2-Hour 3.7 3.7 3.7 3.9 1.1 1.1 1.1 2.1 2.2 3.1 3.1
-Profiled - - - - - - - - - - -
195Assets RI 195 197 198 204 204 208 211 213 219 225 229 16.5RT Price 16.5 16.5 16.5 16.5 16.5 16.5 16.5 16.3 16.5 16.5 16.5 54.9RT 30-Min 53.9 54.4 54.5 56.5 56.5 57.7 63.4 65.3 67.1 68.6 71.9 5.0RT 2-Hour 5.0 5.0 5.0 5.0 5.0 5.4 6.1 6.6 6.6 6.6 6.6
-Profiled - - - - - - - - - - -
1.7 Demand Response Ready to Respond Available in 2008(1, 2)

Section 1 - Summaries
FOOTNOTES: (1) May not equal sum due to rounding. (2) Does not include Transmission and Distribution Loss or Reserve Margin Gross-Up. CELT Report - April 2009 Page 8 ISO New England Inc.
AprilFebruary October December August NovemberMarchJanuary May June September
July Load Zone
240Assets SEMA 232 238 252 265 268 275 276 286 294 302 307 10.6RT Price 9.7 9.7 9.8 9.8 9.6 9.6 9.3 9.1 9.1 8.9 8.7 50.3RT 30-Min 46.0 47.9 53.3 59.4 62.0 66.3 68.7 73.2 79.9 85.2 86.3 3.6RT 2-Hour 3.6 4.5 4.5 4.5 7.3 7.5 8.2 8.7 10.1 9.8 10.2
-Profiled - - - - - - - - - - -
58Assets VT 62 63 62 61 62 69 69 76 78 94 110 6.3RT Price 6.3 6.3 6.3 6.3 6.3 6.3 6.3 5.9 5.9 5.9 2.9 39.6RT 30-Min 40.8 36.1 22.8 22.7 22.8 25.4 24.9 30.2 32.7 43.1 66.2 11.3RT 2-Hour 12.0 12.0 6.9 2.9 2.9 2.9 2.9 2.9 2.9 5.9 12.9 5.9Profiled 5.9 5.9 5.9 5.9 5.9 5.9 5.9 5.9 5.9 5.9 5.9
289Assets WCMA 301 304 309 321 326 338 337 352 364 372 385 21.9RT Price 22.1 21.9 22.3 22.4 22.1 22.0 20.6 20.5 18.6 17.5 17.5 80.0RT 30-Min 86.8 90.4 87.5 89.6 99.2 102.9 105.2 106.8 122.6 130.1 138.0 19.2RT 2-Hour 17.8 17.8 18.0 23.0 23.0 19.1 19.7 23.1 23.9 24.4 25.2
-Profiled - - - - - - - - - - -
1,702.0MW Total 1,700.0 1,701.7 1,685.4 1,717.5 1,729.2 1,706.4 1,748.4 1,818.0 1,908.9 1,929.2 2,033.7
2,554Assets 2,577 2,625 2,687 2,771 2,792 2,837 2,873 2,935 3,004 3,086 3,192
98.0RT Price 97.2 97.0 97.5 97.6 97.1 97.0 94.5 93.7 92.8 91.3 88.1
1,467.8RT 30-Min 1,465.2 1,462.1 1,459.2 1,488.4 1,492.4 1,483.7 1,512.2 1,547.3 1,622.8 1,641.5 1,731.7
119.3RT 2-Hour 120.7 125.7 111.8 114.7 122.8 108.9 124.8 160.1 176.4 179.5 197.1
16.9Profiled 16.9 16.9 16.9 16.9 16.9 16.9 16.9 16.9 16.9 16.9 16.9

Section 1 - Summaries
FOOTNOTES: (1) May not equal sum due to rounding. (2) Does not include Transmission and Distribution Loss or Reserve Margin Gross-Up. CELT Report - April 2009 Page 9 ISO New England Inc.
AprilFebruary October December August NovemberMarchJanuary May June September
July Load Zone
64Assets CT 55 50 43 46 41 33 24 15 15 11 11-RT Price - - - - - - - - - - -
21.4RT 30-Min 19.8 19.3 15.8 18.7 10.6 13.8 7.7 6.0 5.9 3.2 3.6-RT 2-Hour - - - - - - - - - - --Profiled - - - - - - - - - - -
1Assets ME 1 - 1 1 1 3 8 6 6 7 4-RT Price - - - - - - - - - - --RT 30-Min - - .4 .4 .4 .4 1.3 .6 .6 1.6 .4
4.3RT 2-Hour 4.3 - - - - 11.3 2.4 2.3 2.3 8.9 2.6-Profiled - - - - - - - - - - -
-Assets NEMA 1 1 1 2 1 3 12 7 10 4 5-RT Price - - - - - - .1 - - - --RT 30-Min .6 .6 .2 .1 - .3 2.9 .9 41.6 .8 1.1-RT 2-Hour - - - .3 .3 .7 1.0 1.0 .5 .3 .3-Profiled - - - - - - - - - - -
1Assets NH 1 2 1 1 7 7 10 3 3 1 1-RT Price - - - - - - - - - - --RT 30-Min 1.0 1.1 1.0 1.0 2.6 2.7 3.8 1.9 .4 .4 .5
2.0RT 2-Hour - - - - 1.0 1.0 1.0 - .8 - --Profiled - - - - - - - - - - -
-Assets RI - - 3 4 6 3 4 1 2 1 1-RT Price - - - - - - - - - - --RT 30-Min - - .7 .7 1.3 - 1.2 - .4 - --RT 2-Hour - - 1.0 1.5 1.5 1.2 3.5 3.0 3.0 3.0 3.0-Profiled - - - - - - - - - - -
1.8 Demand Response Approved Available in 2008(1, 2)
Section 1 - Summaries
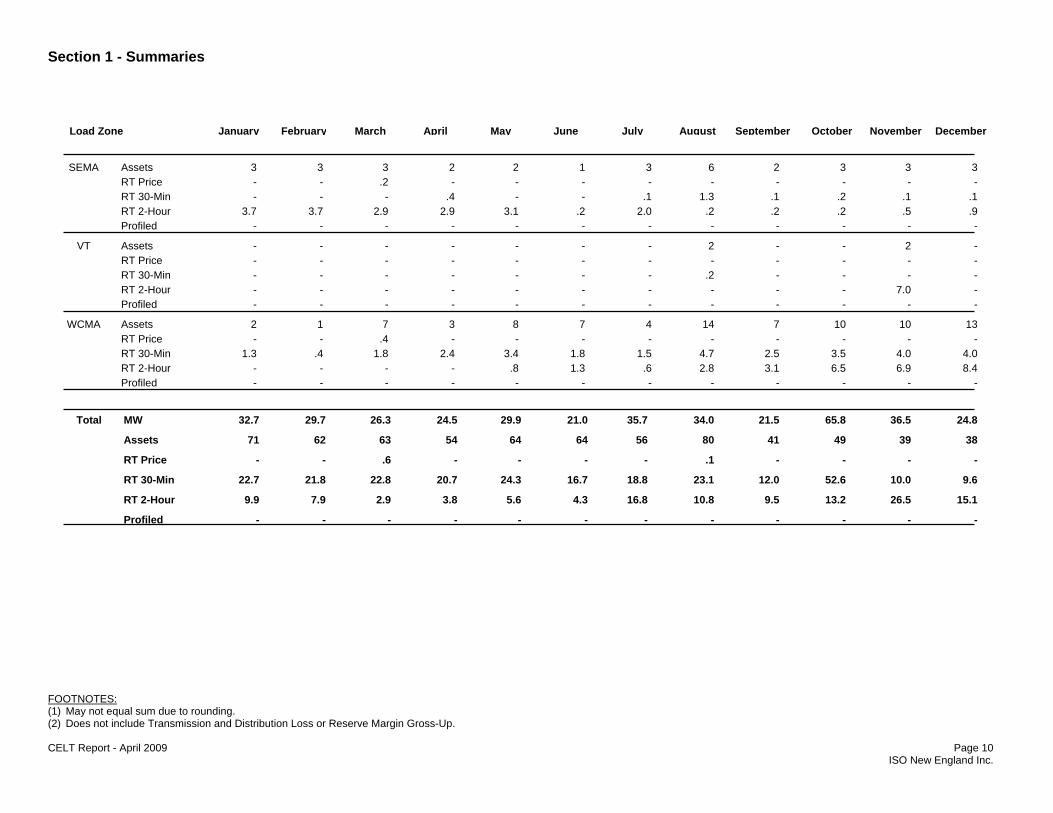
FOOTNOTES: (1) May not equal sum due to rounding. (2) Does not include Transmission and Distribution Loss or Reserve Margin Gross-Up. CELT Report - April 2009 Page 10 ISO New England Inc.
AprilFebruary October December August NovemberMarchJanuary May June September
July Load Zone
3Assets SEMA 3 3 2 2 1 3 6 2 3 3 3-RT Price - .2 - - - - - - - - --RT 30-Min - - .4 - - .1 1.3 .1 .2 .1 .1
3.7RT 2-Hour 3.7 2.9 2.9 3.1 .2 2.0 .2 .2 .2 .5 .9-Profiled - - - - - - - - - - -
-Assets VT - - - - - - 2 - - 2 --RT Price - - - - - - - - - - --RT 30-Min - - - - - - .2 - - - --RT 2-Hour - - - - - - - - - 7.0 --Profiled - - - - - - - - - - -
2Assets WCMA 1 7 3 8 7 4 14 7 10 10 13-RT Price - .4 - - - - - - - - -
1.3RT 30-Min .4 1.8 2.4 3.4 1.8 1.5 4.7 2.5 3.5 4.0 4.0-RT 2-Hour - - - .8 1.3 .6 2.8 3.1 6.5 6.9 8.4-Profiled - - - - - - - - - - -
32.7MW Total 29.7 26.3 24.5 29.9 21.0 35.7 34.0 21.5 65.8 36.5 24.8
71Assets 62 63 54 64 64 56 80 41 49 39 38
-RT Price - .6 - - - - .1 - - - -
22.7RT 30-Min 21.8 22.8 20.7 24.3 16.7 18.8 23.1 12.0 52.6 10.0 9.6
9.9RT 2-Hour 7.9 2.9 3.8 5.6 4.3 16.8 10.8 9.5 13.2 26.5 15.1
-Profiled - - - - - - - - - - -
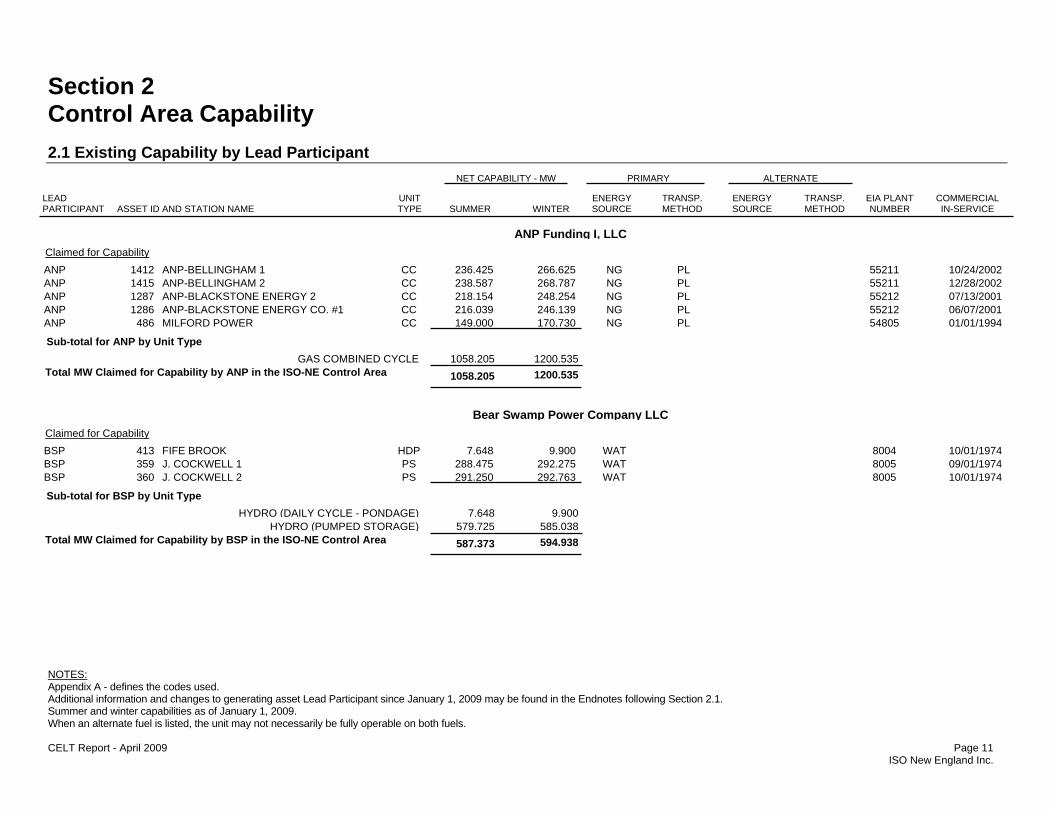
NOTES: Appendix A - defines the codes used. Additional information and changes to generating asset Lead Participant since January 1, 2009 may be found in the Endnotes following Section 2.1. Summer and winter capabilities as of January 1, 2009. When an alternate fuel is listed, the unit may not necessarily be fully operable on both fuels. CELT Report - April 2009 Page 11 ISO New England Inc.
LEAD PARTICIPANT ASSET ID AND STATION NAME
COMMERCIAL IN-SERVICE
ENERGY SOURCE
PRIMARYNET CAPABILITY - MW
EIA PLANT NUMBER
TRANSP. METHODWINTERSUMMER
UNITTYPE
ENERGY SOURCE
ALTERNATE
TRANSP. METHOD
Claimed for Capability ANP 1412 ANP-BELLINGHAM 1 CC 236.425 266.625 NG PL 55211 10/24/2002 ANP 1415 ANP-BELLINGHAM 2 CC 238.587 268.787 NG PL 55211 12/28/2002 ANP 1287 ANP-BLACKSTONE ENERGY 2 CC 218.154 248.254 NG PL 55212 07/13/2001 ANP 1286 ANP-BLACKSTONE ENERGY CO. #1 CC 216.039 246.139 NG PL 55212 06/07/2001 ANP 486 MILFORD POWER CC 149.000 170.730 NG PL 54805 01/01/1994 Sub-total for ANP by Unit Type
GAS COMBINED CYCLE 1058.205 1200.535Total MW Claimed for Capability by ANP in the ISO-NE Control Area 1058.205 1200.535
ANP Funding I, LLC
Claimed for Capability BSP 413 FIFE BROOK HDP 7.648 9.900 WAT 8004 10/01/1974 BSP 359 J. COCKWELL 1 PS 288.475 292.275 WAT 8005 09/01/1974 BSP 360 J. COCKWELL 2 PS 291.250 292.763 WAT 8005 10/01/1974 Sub-total for BSP by Unit Type
HYDRO (DAILY CYCLE - PONDAGE) 7.648 9.900HYDRO (PUMPED STORAGE) 579.725 585.038
Total MW Claimed for Capability by BSP in the ISO-NE Control Area 587.373 594.938
Bear Swamp Power Company LLC
Section 2 Control Area Capability 2.1 Existing Capability by Lead Participant
Section 2 - Control Area Capability
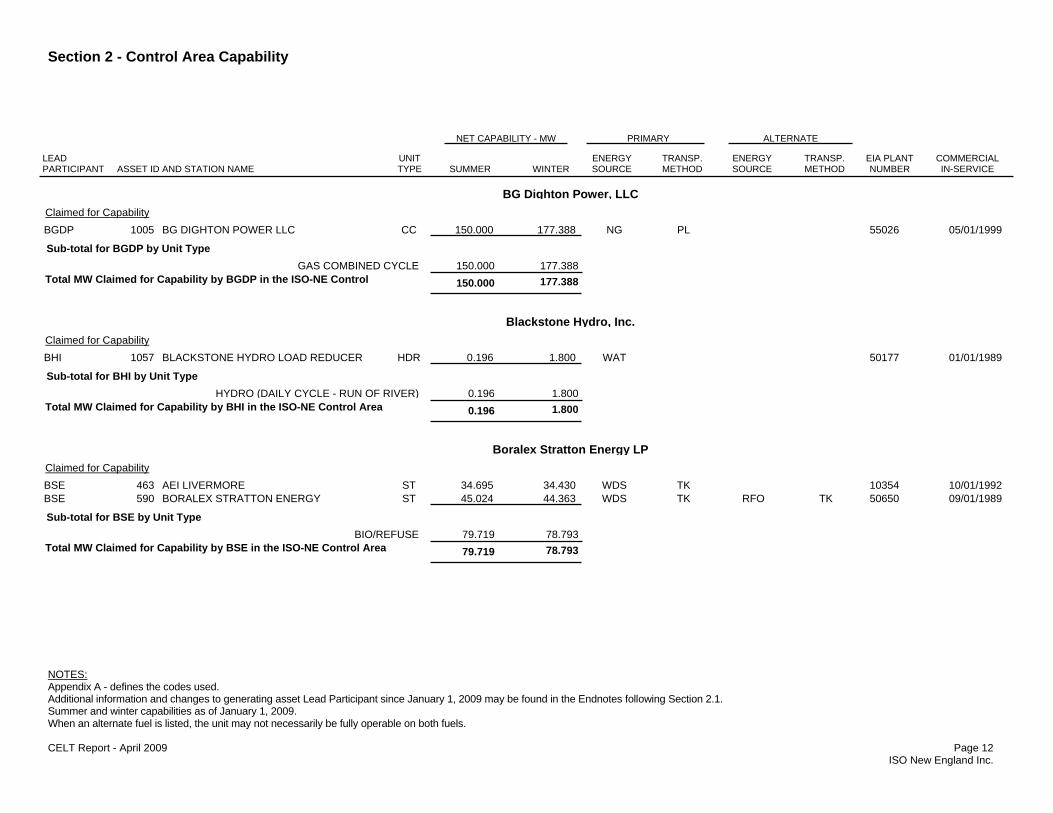
NOTES: Appendix A - defines the codes used. Additional information and changes to generating asset Lead Participant since January 1, 2009 may be found in the Endnotes following Section 2.1. Summer and winter capabilities as of January 1, 2009. When an alternate fuel is listed, the unit may not necessarily be fully operable on both fuels. CELT Report - April 2009 Page 12 ISO New England Inc.
LEAD PARTICIPANT ASSET ID AND STATION NAME
COMMERCIAL IN-SERVICE
ENERGY SOURCE
PRIMARYNET CAPABILITY - MW
EIA PLANT NUMBER
TRANSP. METHODWINTERSUMMER
UNITTYPE
ENERGY SOURCE
ALTERNATE
TRANSP. METHOD
Claimed for Capability BGDP 1005 BG DIGHTON POWER LLC CC 150.000 177.388 NG PL 55026 05/01/1999 Sub-total for BGDP by Unit Type
GAS COMBINED CYCLE 150.000 177.388Total MW Claimed for Capability by BGDP in the ISO-NE Control 150.000 177.388
BG Dighton Power, LLC
Claimed for Capability BHI 1057 BLACKSTONE HYDRO LOAD REDUCER HDR 0.196 1.800 WAT 50177 01/01/1989 Sub-total for BHI by Unit Type
HYDRO (DAILY CYCLE - RUN OF RIVER) 0.196 1.800Total MW Claimed for Capability by BHI in the ISO-NE Control Area 0.196 1.800
Blackstone Hydro, Inc.
Claimed for Capability BSE 463 AEI LIVERMORE ST 34.695 34.430 WDS TK 10354 10/01/1992 BSE 590 BORALEX STRATTON ENERGY ST 45.024 44.363 WDS TK RFO TK 50650 09/01/1989 Sub-total for BSE by Unit Type
BIO/REFUSE 79.719 78.793Total MW Claimed for Capability by BSE in the ISO-NE Control Area 79.719 78.793
Boralex Stratton Energy LP
Section 2 - Control Area Capability
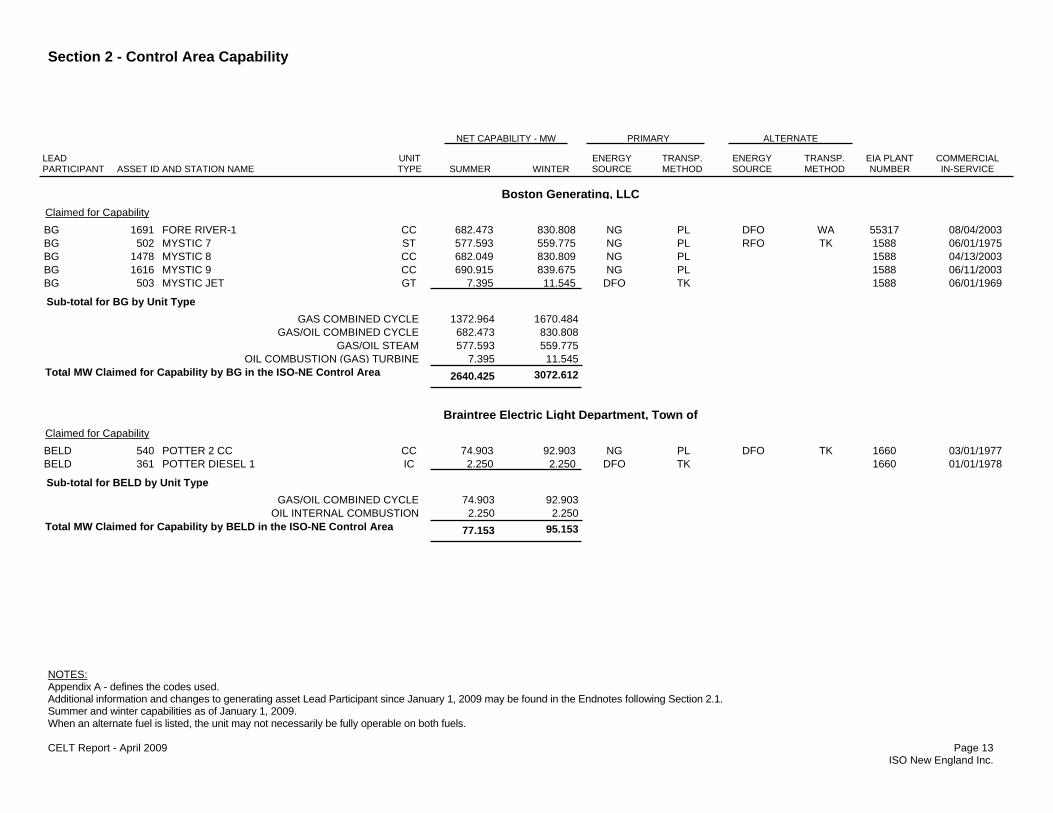
NOTES: Appendix A - defines the codes used. Additional information and changes to generating asset Lead Participant since January 1, 2009 may be found in the Endnotes following Section 2.1. Summer and winter capabilities as of January 1, 2009. When an alternate fuel is listed, the unit may not necessarily be fully operable on both fuels. CELT Report - April 2009 Page 13 ISO New England Inc.
LEAD PARTICIPANT ASSET ID AND STATION NAME
COMMERCIAL IN-SERVICE
ENERGY SOURCE
PRIMARYNET CAPABILITY - MW
EIA PLANT NUMBER
TRANSP. METHODWINTERSUMMER
UNITTYPE
ENERGY SOURCE
ALTERNATE
TRANSP. METHOD
Claimed for Capability BG 1691 FORE RIVER-1 CC 682.473 830.808 NG PL DFO WA 55317 08/04/2003 BG 502 MYSTIC 7 ST 577.593 559.775 NG PL RFO TK 1588 06/01/1975 BG 1478 MYSTIC 8 CC 682.049 830.809 NG PL 1588 04/13/2003 BG 1616 MYSTIC 9 CC 690.915 839.675 NG PL 1588 06/11/2003 BG 503 MYSTIC JET GT 7.395 11.545 DFO TK 1588 06/01/1969 Sub-total for BG by Unit Type
GAS COMBINED CYCLE 1372.964 1670.484GAS/OIL COMBINED CYCLE 682.473 830.808
GAS/OIL STEAM 577.593 559.775OIL COMBUSTION (GAS) TURBINE 7.395 11.545
Total MW Claimed for Capability by BG in the ISO-NE Control Area 2640.425 3072.612
Boston Generating, LLC
Claimed for Capability BELD 540 POTTER 2 CC CC 74.903 92.903 NG PL DFO TK 1660 03/01/1977 BELD 361 POTTER DIESEL 1 IC 2.250 2.250 DFO TK 1660 01/01/1978 Sub-total for BELD by Unit Type
GAS/OIL COMBINED CYCLE 74.903 92.903OIL INTERNAL COMBUSTION 2.250 2.250
Total MW Claimed for Capability by BELD in the ISO-NE Control Area 77.153 95.153
Braintree Electric Light Department, Town of

Section 2 - Control Area Capability
NOTES: Appendix A - defines the codes used. Additional information and changes to generating asset Lead Participant since January 1, 2009 may be found in the Endnotes following Section 2.1. Summer and winter capabilities as of January 1, 2009. When an alternate fuel is listed, the unit may not necessarily be fully operable on both fuels. CELT Report - April 2009 Page 14 ISO New England Inc.
LEAD PARTICIPANT ASSET ID AND STATION NAME
COMMERCIAL IN-SERVICE
ENERGY SOURCE
PRIMARYNET CAPABILITY - MW
EIA PLANT NUMBER
TRANSP. METHODWINTERSUMMER
UNITTYPE
ENERGY SOURCE
ALTERNATE
TRANSP. METHOD
Claimed for Capability BEM 10424 GREAT LAKES - BERLIN HDR 13.658 16.273 WAT 54639 06/22/2004 BEM 424 GREAT LAKES - MILLINOCKET HW 89.817 101.852 WAT 55830 03/01/1987 BEM 539 PONTOOK HYDRO HDR 8.227 10.004 WAT 50741 12/01/1986 BEM 11424 RUMFORD FALLS HDR 31.686 36.693 WAT 10493 07/06/2006 Sub-total for BEM by Unit Type
HYDRO (DAILY CYCLE - RUN OF RIVER) 53.571 62.970HYDRO (WEEKLY CYCLE) 89.817 101.852
Total MW Claimed for Capability by BEM in the ISO-NE Control Area 143.388 164.822
Brookfield Energy Marketing Inc.
Claimed for Capability BED 363 BURLINGTON GT GT 17.970 22.241 DFO TK 3754 07/01/1971 BED 474 J C MCNEIL ST 52.000 54.000 WDS TK NG PL 589 02/01/1984 Sub-total for BED by Unit Type
BIO/REFUSE 52.000 54.000OIL COMBUSTION (GAS) TURBINE 17.970 22.241
Total MW Claimed for Capability by BED in the ISO-NE Control Area 69.970 76.241
Burlington Electric Department
Section 2 - Control Area Capability
NOTES: Appendix A - defines the codes used. Additional information and changes to generating asset Lead Participant since January 1, 2009 may be found in the Endnotes following Section 2.1. Summer and winter capabilities as of January 1, 2009. When an alternate fuel is listed, the unit may not necessarily be fully operable on both fuels. CELT Report - April 2009 Page 15 ISO New England Inc.
LEAD PARTICIPANT ASSET ID AND STATION NAME
COMMERCIAL IN-SERVICE
ENERGY SOURCE
PRIMARYNET CAPABILITY - MW
EIA PLANT NUMBER
TRANSP. METHODWINTERSUMMER
UNITTYPE
ENERGY SOURCE
ALTERNATE
TRANSP. METHOD
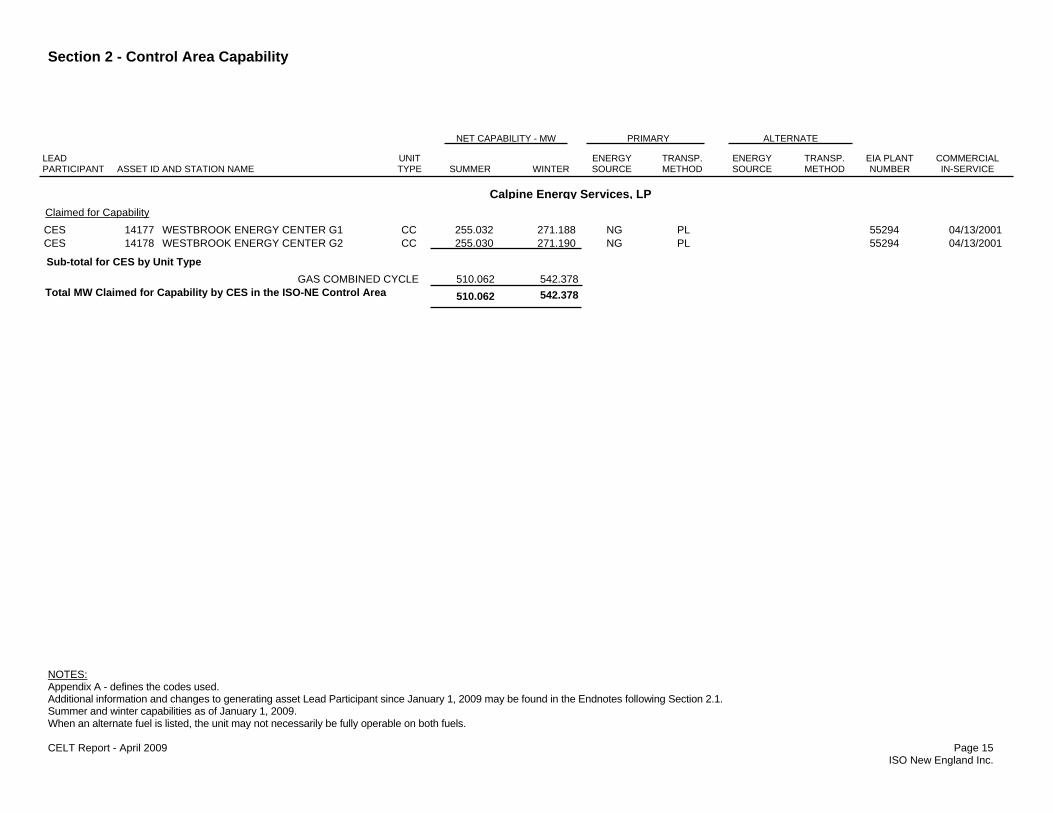
Claimed for Capability CES 14177 WESTBROOK ENERGY CENTER G1 CC 255.032 271.188 NG PL 55294 04/13/2001 CES 14178 WESTBROOK ENERGY CENTER G2 CC 255.030 271.190 NG PL 55294 04/13/2001 Sub-total for CES by Unit Type
GAS COMBINED CYCLE 510.062 542.378Total MW Claimed for Capability by CES in the ISO-NE Control Area 510.062 542.378
Calpine Energy Services, LP
Section 2 - Control Area Capability
NOTES: Appendix A - defines the codes used. Additional information and changes to generating asset Lead Participant since January 1, 2009 may be found in the Endnotes following Section 2.1. Summer and winter capabilities as of January 1, 2009. When an alternate fuel is listed, the unit may not necessarily be fully operable on both fuels. CELT Report - April 2009 Page 16 ISO New England Inc.
LEAD PARTICIPANT ASSET ID AND STATION NAME
COMMERCIAL IN-SERVICE
ENERGY SOURCE
PRIMARYNET CAPABILITY - MW
EIA PLANT NUMBER
TRANSP. METHODWINTERSUMMER
UNITTYPE
ENERGY SOURCE
ALTERNATE
TRANSP. METHOD
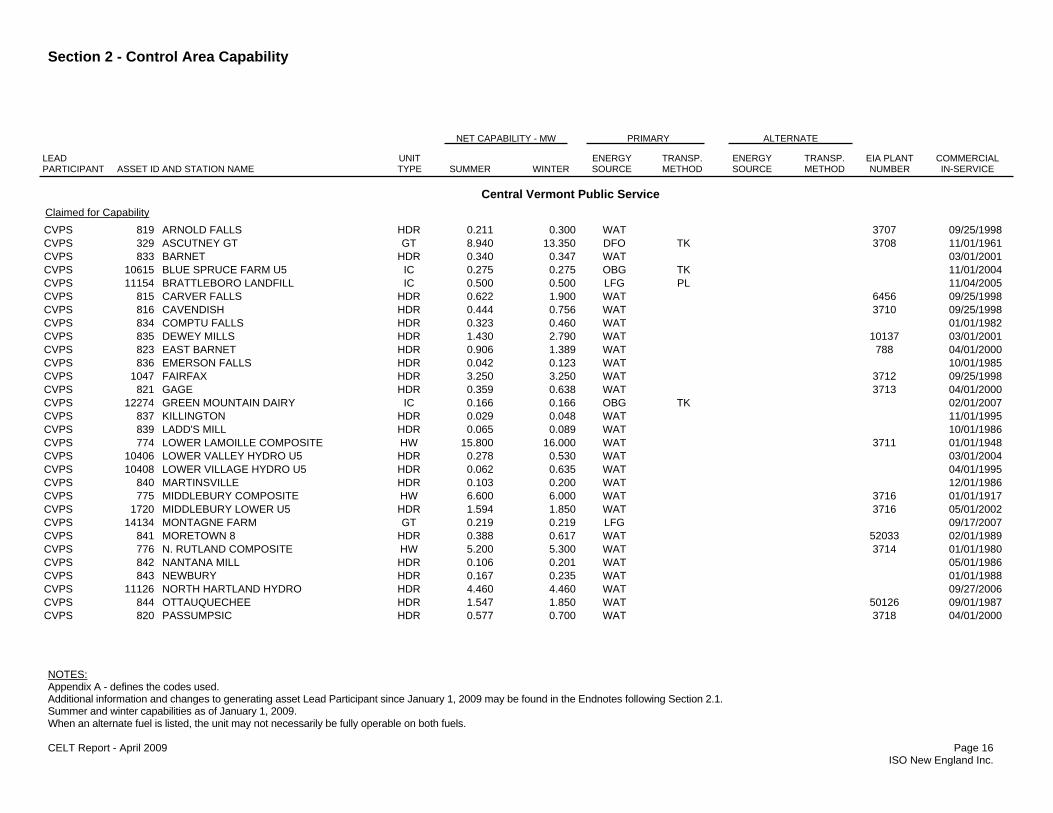
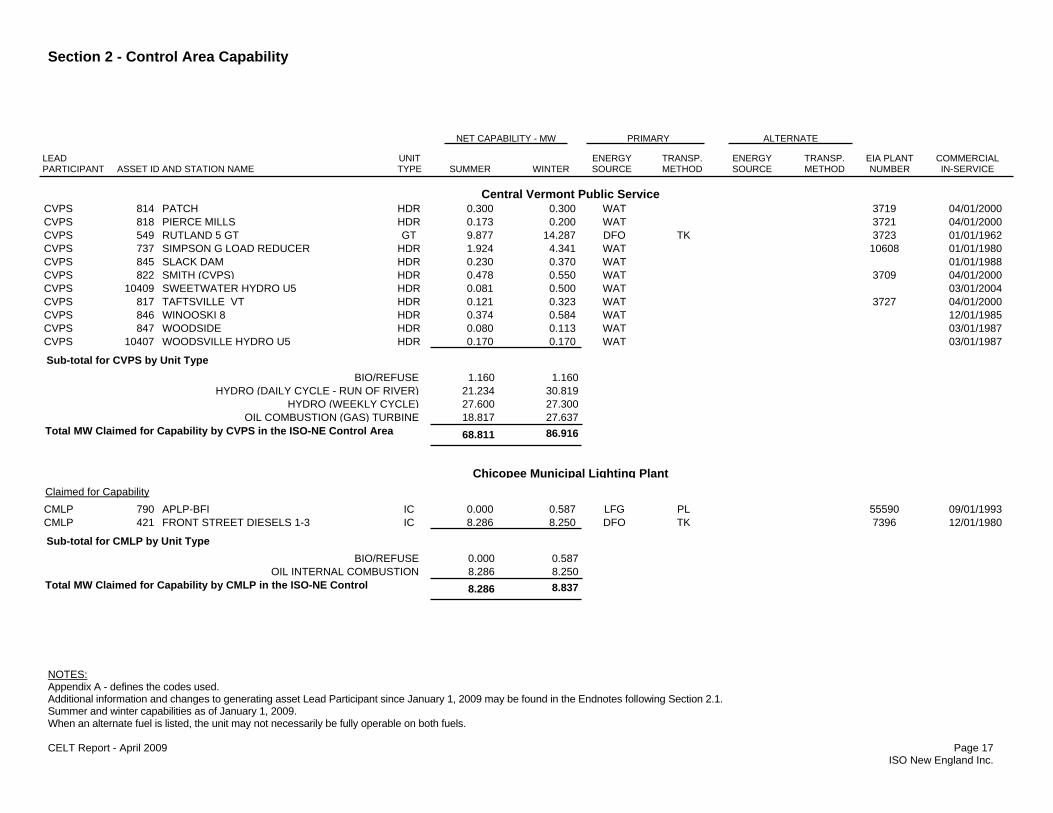
Claimed for Capability CVPS 819 ARNOLD FALLS HDR 0.211 0.300 WAT 3707 09/25/1998 CVPS 329 ASCUTNEY GT GT 8.940 13.350 DFO TK 3708 11/01/1961 CVPS 833 BARNET HDR 0.340 0.347 WAT 03/01/2001 CVPS 10615 BLUE SPRUCE FARM U5 IC 0.275 0.275 OBG TK 11/01/2004 CVPS 11154 BRATTLEBORO LANDFILL IC 0.500 0.500 LFG PL 11/04/2005 CVPS 815 CARVER FALLS HDR 0.622 1.900 WAT 6456 09/25/1998 CVPS 816 CAVENDISH HDR 0.444 0.756 WAT 3710 09/25/1998 CVPS 834 COMPTU FALLS HDR 0.323 0.460 WAT 01/01/1982 CVPS 835 DEWEY MILLS HDR 1.430 2.790 WAT 10137 03/01/2001 CVPS 823 EAST BARNET HDR 0.906 1.389 WAT 788 04/01/2000 CVPS 836 EMERSON FALLS HDR 0.042 0.123 WAT 10/01/1985 CVPS 1047 FAIRFAX HDR 3.250 3.250 WAT 3712 09/25/1998 CVPS 821 GAGE HDR 0.359 0.638 WAT 3713 04/01/2000 CVPS 12274 GREEN MOUNTAIN DAIRY IC 0.166 0.166 OBG TK 02/01/2007 CVPS 837 KILLINGTON HDR 0.029 0.048 WAT 11/01/1995 CVPS 839 LADD'S MILL HDR 0.065 0.089 WAT 10/01/1986 CVPS 774 LOWER LAMOILLE COMPOSITE HW 15.800 16.000 WAT 3711 01/01/1948 CVPS 10406 LOWER VALLEY HYDRO U5 HDR 0.278 0.530 WAT 03/01/2004 CVPS 10408 LOWER VILLAGE HYDRO U5 HDR 0.062 0.635 WAT 04/01/1995 CVPS 840 MARTINSVILLE HDR 0.103 0.200 WAT 12/01/1986 CVPS 775 MIDDLEBURY COMPOSITE HW 6.600 6.000 WAT 3716 01/01/1917 CVPS 1720 MIDDLEBURY LOWER U5 HDR 1.594 1.850 WAT 3716 05/01/2002 CVPS 14134 MONTAGNE FARM GT 0.219 0.219 LFG 09/17/2007 CVPS 841 MORETOWN 8 HDR 0.388 0.617 WAT 52033 02/01/1989 CVPS 776 N. RUTLAND COMPOSITE HW 5.200 5.300 WAT 3714 01/01/1980 CVPS 842 NANTANA MILL HDR 0.106 0.201 WAT 05/01/1986 CVPS 843 NEWBURY HDR 0.167 0.235 WAT 01/01/1988 CVPS 11126 NORTH HARTLAND HYDRO HDR 4.460 4.460 WAT 09/27/2006 CVPS 844 OTTAUQUECHEE HDR 1.547 1.850 WAT 50126 09/01/1987 CVPS 820 PASSUMPSIC HDR 0.577 0.700 WAT 3718 04/01/2000
Central Vermont Public Service
Section 2 - Control Area Capability
NOTES: Appendix A - defines the codes used. Additional information and changes to generating asset Lead Participant since January 1, 2009 may be found in the Endnotes following Section 2.1. Summer and winter capabilities as of January 1, 2009. When an alternate fuel is listed, the unit may not necessarily be fully operable on both fuels. CELT Report - April 2009 Page 17 ISO New England Inc.
LEAD PARTICIPANT ASSET ID AND STATION NAME
COMMERCIAL IN-SERVICE
ENERGY SOURCE
PRIMARYNET CAPABILITY - MW
EIA PLANT NUMBER
TRANSP. METHODWINTERSUMMER
UNITTYPE
ENERGY SOURCE
ALTERNATE
TRANSP. METHOD
CVPS 814 PATCH HDR 0.300 0.300 WAT 3719 04/01/2000 CVPS 818 PIERCE MILLS HDR 0.173 0.200 WAT 3721 04/01/2000 CVPS 549 RUTLAND 5 GT GT 9.877 14.287 DFO TK 3723 01/01/1962 CVPS 737 SIMPSON G LOAD REDUCER HDR 1.924 4.341 WAT 10608 01/01/1980 CVPS 845 SLACK DAM HDR 0.230 0.370 WAT 01/01/1988 CVPS 822 SMITH (CVPS) HDR 0.478 0.550 WAT 3709 04/01/2000 CVPS 10409 SWEETWATER HYDRO U5 HDR 0.081 0.500 WAT 03/01/2004 CVPS 817 TAFTSVILLE VT HDR 0.121 0.323 WAT 3727 04/01/2000 CVPS 846 WINOOSKI 8 HDR 0.374 0.584 WAT 12/01/1985 CVPS 847 WOODSIDE HDR 0.080 0.113 WAT 03/01/1987 CVPS 10407 WOODSVILLE HYDRO U5 HDR 0.170 0.170 WAT 03/01/1987 Sub-total for CVPS by Unit Type
BIO/REFUSE 1.160 1.160HYDRO (DAILY CYCLE - RUN OF RIVER) 21.234 30.819
HYDRO (WEEKLY CYCLE) 27.600 27.300OIL COMBUSTION (GAS) TURBINE 18.817 27.637
Total MW Claimed for Capability by CVPS in the ISO-NE Control Area 68.811 86.916
Central Vermont Public Service
Claimed for Capability CMLP 790 APLP-BFI IC 0.000 0.587 LFG PL 55590 09/01/1993 CMLP 421 FRONT STREET DIESELS 1-3 IC 8.286 8.250 DFO TK 7396 12/01/1980 Sub-total for CMLP by Unit Type
BIO/REFUSE 0.000 0.587OIL INTERNAL COMBUSTION 8.286 8.250
Total MW Claimed for Capability by CMLP in the ISO-NE Control 8.286 8.837
Chicopee Municipal Lighting Plant
Section 2 - Control Area Capability
NOTES: Appendix A - defines the codes used. Additional information and changes to generating asset Lead Participant since January 1, 2009 may be found in the Endnotes following Section 2.1. Summer and winter capabilities as of January 1, 2009. When an alternate fuel is listed, the unit may not necessarily be fully operable on both fuels. CELT Report - April 2009 Page 18 ISO New England Inc.
LEAD PARTICIPANT ASSET ID AND STATION NAME
COMMERCIAL IN-SERVICE
ENERGY SOURCE
PRIMARYNET CAPABILITY - MW
EIA PLANT NUMBER
TRANSP. METHODWINTERSUMMER
UNITTYPE
ENERGY SOURCE
ALTERNATE
TRANSP. METHOD
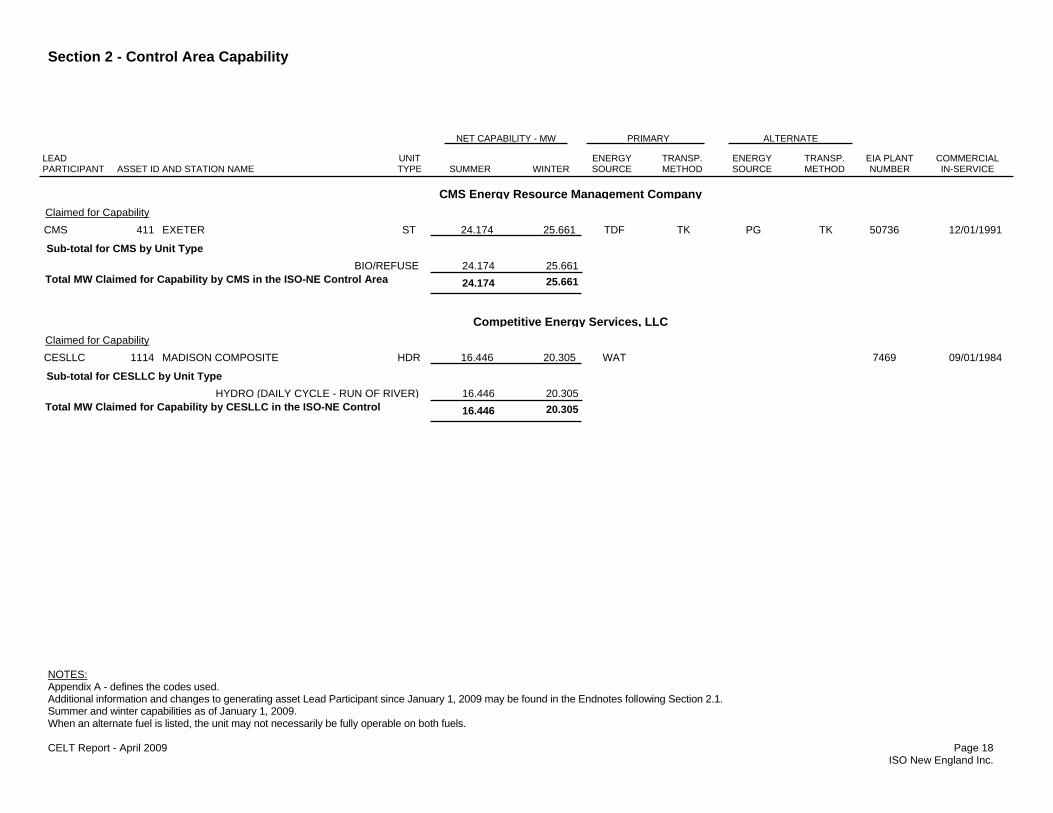
Claimed for Capability CMS 411 EXETER ST 24.174 25.661 TDF TK PG TK 50736 12/01/1991 Sub-total for CMS by Unit Type
BIO/REFUSE 24.174 25.661Total MW Claimed for Capability by CMS in the ISO-NE Control Area 24.174 25.661
CMS Energy Resource Management Company
Claimed for Capability CESLLC 1114 MADISON COMPOSITE HDR 16.446 20.305 WAT 7469 09/01/1984 Sub-total for CESLLC by Unit Type
HYDRO (DAILY CYCLE - RUN OF RIVER) 16.446 20.305Total MW Claimed for Capability by CESLLC in the ISO-NE Control 16.446 20.305
Competitive Energy Services, LLC

Section 2 - Control Area Capability
NOTES: Appendix A - defines the codes used. Additional information and changes to generating asset Lead Participant since January 1, 2009 may be found in the Endnotes following Section 2.1. Summer and winter capabilities as of January 1, 2009. When an alternate fuel is listed, the unit may not necessarily be fully operable on both fuels. CELT Report - April 2009 Page 19 ISO New England Inc.
LEAD PARTICIPANT ASSET ID AND STATION NAME
COMMERCIAL IN-SERVICE
ENERGY SOURCE
PRIMARYNET CAPABILITY - MW
EIA PLANT NUMBER
TRANSP. METHODWINTERSUMMER
UNITTYPE
ENERGY SOURCE
ALTERNATE
TRANSP. METHOD
Claimed for Capability CLP 594 AES THAMES ST 181.000 182.150 BIT TK 10675 12/01/1989 CLP 356 BRISTOL REFUSE ST 13.200 12.736 MSW TK RFO TK 50648 05/01/1988 CLP 807 CEC 004 DAYVILLE POND U5 HDR 0.000 0.100 WAT 03/01/1995 CLP 798 COLEBROOK HDR 1.550 1.550 WAT 54301 03/01/1988 CLP 1209 CRRA HARTFORD LANDFILL GT 2.215 2.215 LFG PL 55163 08/01/1998 CLP 389 DERBY DAM HDR 7.050 7.050 WAT 10063 03/01/1989 CLP 392 DEXTER CC 38.000 39.000 NG PL DFO TK 05/01/1990 CLP 805 GLEN FALLS HDR 0.000 0.000 WAT 3714 03/01/1998 CLP 796 GOODWIN DAM HDR 3.000 3.000 WAT 54302 02/01/1986 CLP 799 KINNEYTOWN A HDR 0.000 0.000 WAT 54385 03/01/1988 CLP 800 KINNEYTOWN B HDR 0.585 1.510 WAT 54385 11/01/1986 CLP 462 LISBON RESOURCE RECOVERY ST 12.961 13.036 MSW TK 54758 01/01/1996 CLP 978 NEW MILFORD GT 1.296 1.296 OBG PL DFO TK 50564 08/01/1991 CLP 809 PINCHBECK ST 0.000 0.011 WDS TK 07/01/1987 CLP 804 PUTNAM HDR 0.163 0.575 WAT 10/01/1987 CLP 810 QUINEBAUG HDR 0.305 1.298 WAT 543 09/01/1990 CLP 544 RAINBOW HDP 8.200 8.200 WAT 559 01/01/1980 CLP 808 SANDY HOOK HYDRO HDR 0.077 0.105 WAT 04/01/1989 CLP 562 SECREC-PRESTON ST 16.011 16.514 MSW TK RFO TK 1176 01/01/1992 CLP 580 SO. MEADOW 5 ST 25.596 29.210 MSW TK 563 11/01/1987 CLP 581 SO. MEADOW 6 ST 27.113 28.116 MSW TK 563 11/01/1987 CLP 803 TOUTANT HDR 0.400 0.400 WAT 02/01/1994 CLP 623 WALLINGFORD REFUSE ST 6.350 6.900 MSW TK RFO TK 50664 03/01/1989 CLP 801 WILLIMANTIC 1 HDR 0.225 0.770 WAT 06/01/1990 CLP 802 WILLIMANTIC 2 HDR 0.225 0.770 WAT 06/01/1990
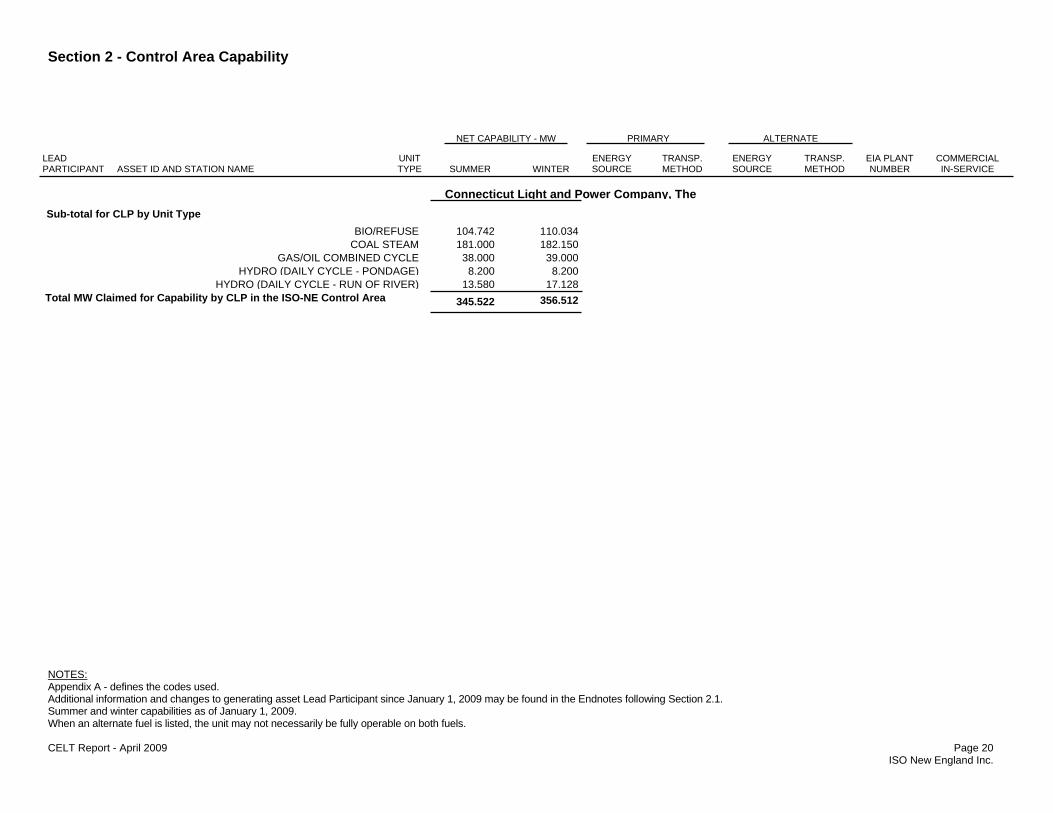
Connecticut Light and Power Company, The
Section 2 - Control Area Capability
NOTES: Appendix A - defines the codes used. Additional information and changes to generating asset Lead Participant since January 1, 2009 may be found in the Endnotes following Section 2.1. Summer and winter capabilities as of January 1, 2009. When an alternate fuel is listed, the unit may not necessarily be fully operable on both fuels. CELT Report - April 2009 Page 20 ISO New England Inc.
LEAD PARTICIPANT ASSET ID AND STATION NAME
COMMERCIAL IN-SERVICE
ENERGY SOURCE
PRIMARYNET CAPABILITY - MW
EIA PLANT NUMBER
TRANSP. METHODWINTERSUMMER
UNITTYPE
ENERGY SOURCE
ALTERNATE
TRANSP. METHOD
Sub-total for CLP by Unit Type BIO/REFUSE 104.742 110.034
COAL STEAM 181.000 182.150GAS/OIL COMBINED CYCLE 38.000 39.000
HYDRO (DAILY CYCLE - PONDAGE) 8.200 8.200HYDRO (DAILY CYCLE - RUN OF RIVER) 13.580 17.128
Total MW Claimed for Capability by CLP in the ISO-NE Control Area 345.522 356.512
Connecticut Light and Power Company, The

Section 2 - Control Area Capability
NOTES: Appendix A - defines the codes used. Additional information and changes to generating asset Lead Participant since January 1, 2009 may be found in the Endnotes following Section 2.1. Summer and winter capabilities as of January 1, 2009. When an alternate fuel is listed, the unit may not necessarily be fully operable on both fuels. CELT Report - April 2009 Page 21 ISO New England Inc.
LEAD PARTICIPANT ASSET ID AND STATION NAME
COMMERCIAL IN-SERVICE
ENERGY SOURCE
PRIMARYNET CAPABILITY - MW
EIA PLANT NUMBER
TRANSP. METHODWINTERSUMMER
UNITTYPE
ENERGY SOURCE
ALTERNATE
TRANSP. METHOD
Claimed for Capability CMEEC 14820 Cytec 1 IC 1.929 1.924 DFO 05/15/2008 CMEEC 14821 Cytec 2 IC 1.945 1.930 DFO 05/15/2008 CMEEC 14822 Cytec 3 IC 1.941 1.939 DFO 05/15/2008 CMEEC 13664 JOHN STREET #3 IC 2.000 2.000 DFO PL 56256 09/26/2007 CMEEC 13665 JOHN STREET #4 IC 2.000 2.000 DFO PL 46256 09/26/2007 CMEEC 14819 John Street 1 IC 2.000 2.000 DFO 05/15/2008 CMEEC 13666 JOHN STREET 5 IC 2.011 2.011 DFO PL 56256 11/01/2007 CMEEC 14816 Norden 1 IC 0.000 0.000 DFO 02/26/2009 CMEEC 14817 NORDEN 2 IC 0.000 0.000 DFO 02/26/2009 CMEEC 14818 NORDEN 3 IC 0.000 0.000 DFO 02/26/2009 CMEEC 515 NORWICH JET GT 15.255 18.800 DFO TK 581 09/01/1972 CMEEC 14823 NORWICH WWTP IC 2.000 2.000 DFO 05/29/2008 CMEEC 13515 PIERCE STATION GT 75.441 94.941 NG PL 6635 10/01/2007 Sub-total for CMEEC by Unit Type
GAS COMBUSTION (GAS) TURBINE 75.441 94.941OIL COMBUSTION (GAS) TURBINE 15.255 18.800
OIL INTERNAL COMBUSTION 15.826 15.804Total MW Claimed for Capability by CMEEC in the ISO-NE Control 106.522 129.545
Connecticut Municipal Electric Energy Cooperative

Section 2 - Control Area Capability
NOTES: Appendix A - defines the codes used. Additional information and changes to generating asset Lead Participant since January 1, 2009 may be found in the Endnotes following Section 2.1. Summer and winter capabilities as of January 1, 2009. When an alternate fuel is listed, the unit may not necessarily be fully operable on both fuels. CELT Report - April 2009 Page 22 ISO New England Inc.
LEAD PARTICIPANT ASSET ID AND STATION NAME
COMMERCIAL IN-SERVICE
ENERGY SOURCE
PRIMARYNET CAPABILITY - MW
EIA PLANT NUMBER
TRANSP. METHODWINTERSUMMER
UNITTYPE
ENERGY SOURCE
ALTERNATE
TRANSP. METHOD
Claimed for Capability CEEI 388 DARTMOUTH POWER CC 61.854 68.043 NG PL DFO TK 52026 05/01/1992 CEEI 395 DOREEN GT 15.959 20.809 KER TK 1631 01/01/1969 CEEI 864 DWIGHT HDR 0.229 1.746 WAT 6378 01/01/1920 CEEI 851 GARDNER FALLS HDR 1.804 3.580 WAT 1634 01/01/1924 CEEI 867 INDIAN ORCHARD HDR 0.191 3.142 WAT 6379 01/01/1928 CEEI 461 L'ENERGIA ENERGY CENTER CC 63.570 67.378 NG PL DFO TK 54586 03/11/1993 CEEI 1188 LOWELL COGENERATION PLANT CC 27.881 30.856 NG PL DFO TK 10802 10/21/1988 CEEI 873 PUTTS BRIDGE HDR 1.008 3.940 WAT 1637 01/01/1918 CEEI 874 RED BRIDGE HDR 0.333 4.532 WAT 1638 01/01/1926 CEEI 1255 RUMFORD POWER CC 244.940 269.750 NG PL 55100 10/16/2000 CEEI 1226 TIVERTON POWER CC 243.197 277.867 NG PL 55048 08/18/2000 CEEI 630 WEST SPRINGFIELD 10 GT 17.215 22.000 JF TK 1642 01/01/1968 CEEI 633 WEST SPRINGFIELD 3 ST 94.276 100.087 RFO RR NG PL 1642 01/01/1957 CEEI 1693 WEST SPRINGFIELD GT-1 GT 36.908 46.908 NG PL DFO TK 1642 06/07/2002 CEEI 1694 WEST SPRINGFIELD GT-2 GT 37.441 47.441 NG PL DFO TK 1642 06/07/2002 CEEI 628 WOODLAND ROAD GT 15.826 20.676 KER TK 1643 07/01/1969 Sub-total for CEEI by Unit Type
GAS COMBINED CYCLE 488.137 547.617GAS/OIL COMBINED CYCLE 153.305 166.277
GAS/OIL COMBUSTION (GAS) TURBINE 74.349 94.349GAS/OIL STEAM 94.276 100.087
HYDRO (DAILY CYCLE - RUN OF RIVER) 3.565 16.940OIL COMBUSTION (GAS) TURBINE 49.000 63.485
Total MW Claimed for Capability by CEEI in the ISO-NE Control Area 862.632 988.755
Consolidated Edison Energy, Inc

Section 2 - Control Area Capability
NOTES: Appendix A - defines the codes used. Additional information and changes to generating asset Lead Participant since January 1, 2009 may be found in the Endnotes following Section 2.1. Summer and winter capabilities as of January 1, 2009. When an alternate fuel is listed, the unit may not necessarily be fully operable on both fuels. CELT Report - April 2009 Page 23 ISO New England Inc.
LEAD PARTICIPANT ASSET ID AND STATION NAME
COMMERCIAL IN-SERVICE
ENERGY SOURCE
PRIMARYNET CAPABILITY - MW
EIA PLANT NUMBER
TRANSP. METHODWINTERSUMMER
UNITTYPE
ENERGY SOURCE
ALTERNATE
TRANSP. METHOD
Claimed for Capability CEC 10362 ACTON HYDRO INC. HDR 0.000 0.000 WAT 01/01/1994 CEC 14271 AMERESCO NORTHAMPTON GT 0.000 0.000 LFG PL 11/01/2007 CEC 332 BAR HARBOR DIESELS 1-4 IC 4.100 8.250 DFO TK 1466 01/01/1960 CEC 1113 BRASSUA HYDRO HDR 4.203 4.203 WAT 10555 08/01/1989 CEC 357 BRIDGEWATER ST 15.701 15.552 WDS TK 10290 09/01/1987 CEC 11925 BROCKTON BRIGHTFIELDS PV 0.425 0.425 SUN 09/18/2006 CEC 618 DG WHITEFIELD, LLC ST 14.873 15.026 WDS TK 10839 04/01/1988 CEC 407 EASTPORT DIESELS 1-3 IC 2.600 3.050 DFO TK 1468 01/01/1948 CEC 429 GREENVILLE ST 16.726 16.774 WDS TK RFO TK 54852 03/01/1987 CEC 11052 GRTR NEW BEDFORD LFG UTIL PROJ IC 3.300 3.300 LFG PL 08/15/2005 CEC 2286 HACKETT MILLS HYDRO HDR 0.000 0.244 WAT 2286 12/01/1985 CEC 2426 Hydro Kennebec HDR 14.142 17.150 WAT 54148 03/01/1989 CEC 1119 KENNEBAGO HYDRO HDR 0.686 0.725 WAT 54148 04/01/1988 CEC 15097 KIMB ROCKY RIVER PH2 CC 9.450 16.850 NG 07/15/2008 CEC 345 MEAD ST 0.000 0.000 BIT RR OBS 10491 02/01/1990 CEC 475 MEDWAY DIESELS 1-4 IC 7.700 8.300 DFO TK 1474 01/01/1960 CEC 487 MILLER HYDRO HDR 9.140 14.441 WAT 50278 04/01/1984 CEC 1062 MWRA COSGROVE HW 0.140 0.140 WAT 10825 10/01/1995 CEC 532 PEJEPSCOT HDR 8.896 13.550 WAT 50758 11/01/1987 CEC 2462 PLAINVILLE GEN QF U5 IC 3.670 5.000 OBG PL 03/24/2003 CEC 1107 SOMERSET ST 3.259 3.259 BLQ TK WDS RR 50406 01/01/1976
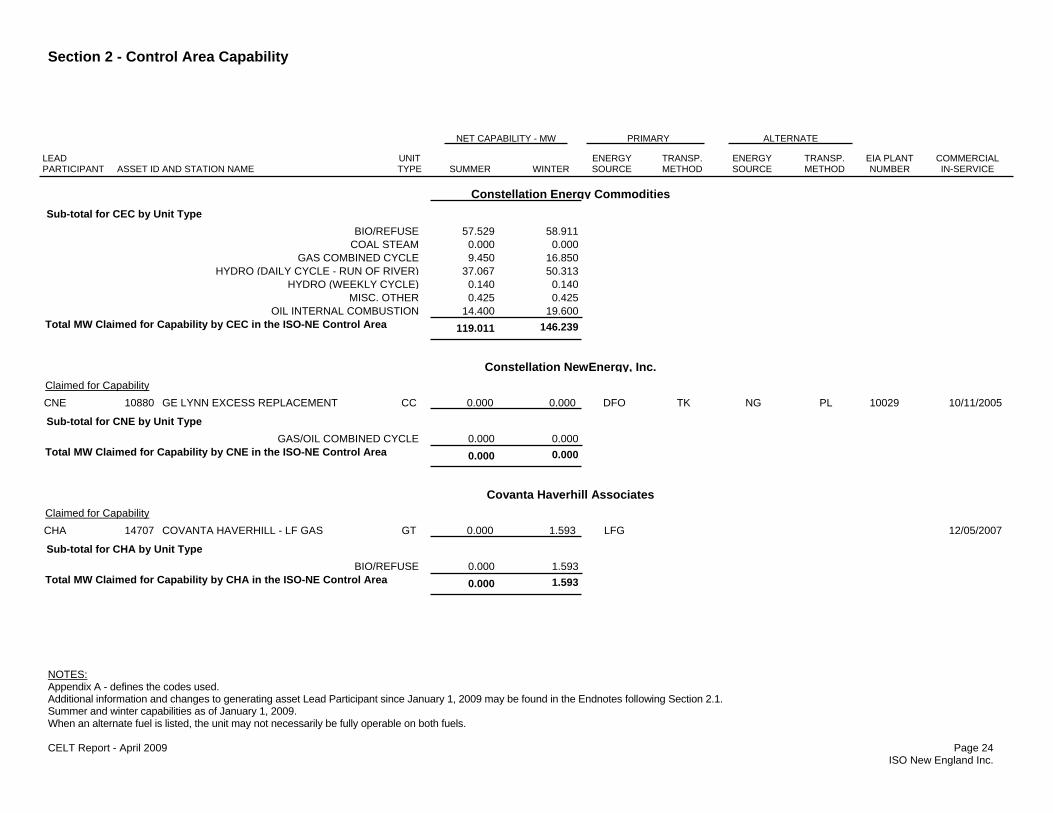
Constellation Energy Commodities
Section 2 - Control Area Capability
NOTES: Appendix A - defines the codes used. Additional information and changes to generating asset Lead Participant since January 1, 2009 may be found in the Endnotes following Section 2.1. Summer and winter capabilities as of January 1, 2009. When an alternate fuel is listed, the unit may not necessarily be fully operable on both fuels. CELT Report - April 2009 Page 24 ISO New England Inc.
LEAD PARTICIPANT ASSET ID AND STATION NAME
COMMERCIAL IN-SERVICE
ENERGY SOURCE
PRIMARYNET CAPABILITY - MW
EIA PLANT NUMBER
TRANSP. METHODWINTERSUMMER
UNITTYPE
ENERGY SOURCE
ALTERNATE
TRANSP. METHOD
Sub-total for CEC by Unit Type BIO/REFUSE 57.529 58.911
COAL STEAM 0.000 0.000GAS COMBINED CYCLE 9.450 16.850
HYDRO (DAILY CYCLE - RUN OF RIVER) 37.067 50.313HYDRO (WEEKLY CYCLE) 0.140 0.140
MISC. OTHER 0.425 0.425OIL INTERNAL COMBUSTION 14.400 19.600
Total MW Claimed for Capability by CEC in the ISO-NE Control Area 119.011 146.239
Constellation Energy Commodities
Claimed for Capability CNE 10880 GE LYNN EXCESS REPLACEMENT CC 0.000 0.000 DFO TK NG PL 10029 10/11/2005 Sub-total for CNE by Unit Type
GAS/OIL COMBINED CYCLE 0.000 0.000Total MW Claimed for Capability by CNE in the ISO-NE Control Area 0.000 0.000
Constellation NewEnergy, Inc.
Claimed for Capability CHA 14707 COVANTA HAVERHILL - LF GAS GT 0.000 1.593 LFG 12/05/2007 Sub-total for CHA by Unit Type
BIO/REFUSE 0.000 1.593Total MW Claimed for Capability by CHA in the ISO-NE Control Area 0.000 1.593
Covanta Haverhill Associates

Section 2 - Control Area Capability
NOTES: Appendix A - defines the codes used. Additional information and changes to generating asset Lead Participant since January 1, 2009 may be found in the Endnotes following Section 2.1. Summer and winter capabilities as of January 1, 2009. When an alternate fuel is listed, the unit may not necessarily be fully operable on both fuels. CELT Report - April 2009 Page 25 ISO New England Inc.
LEAD PARTICIPANT ASSET ID AND STATION NAME
COMMERCIAL IN-SERVICE
ENERGY SOURCE
PRIMARYNET CAPABILITY - MW
EIA PLANT NUMBER
TRANSP. METHODWINTERSUMMER
UNITTYPE
ENERGY SOURCE
ALTERNATE
TRANSP. METHOD
Claimed for Capability CM 446 COVANTA JONESBORO ST 23.117 24.630 WDS TK 10765 11/01/1987 CM 445 COVANTA WEST ENFIELD ST 23.206 24.172 WDS TK 10766 11/01/1987 Sub-total for CM by Unit Type
BIO/REFUSE 46.323 48.802Total MW Claimed for Capability by CM in the ISO-NE Control Area 46.323 48.802
Covanta Maine, LLC
Claimed for Capability DEB 14098 WASTE MANAGEMENT LANDFILL GT 2.801 3.027 LFG 08/16/2007 Sub-total for SELLC by Unit Type
BIO/REFUSE 2.801 3.027Total MW Claimed for Capability by SELLC in the ISO-NE Control 2.801 3.027
Direct Energy Business, LLC
Section 2 - Control Area Capability
NOTES: Appendix A - defines the codes used. Additional information and changes to generating asset Lead Participant since January 1, 2009 may be found in the Endnotes following Section 2.1. Summer and winter capabilities as of January 1, 2009. When an alternate fuel is listed, the unit may not necessarily be fully operable on both fuels. CELT Report - April 2009 Page 26 ISO New England Inc.
LEAD PARTICIPANT ASSET ID AND STATION NAME
COMMERCIAL IN-SERVICE
ENERGY SOURCE
PRIMARY FUELNET CAPABILITY - MW
EIA PLANT NUMBER
TRANSP. METHODWINTERSUMMER
UNITTYPE
ENERGY SOURCE
ALTERNATE FUEL
TRANSP. METHOD
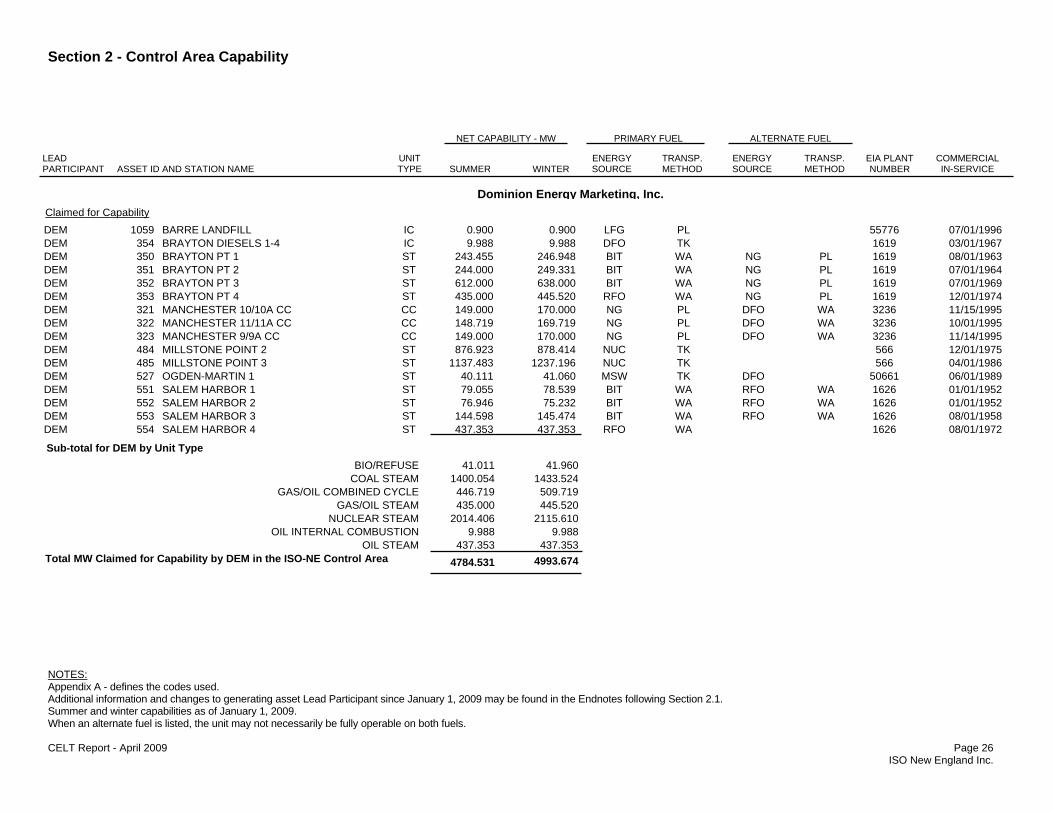
Claimed for Capability DEM 1059 BARRE LANDFILL IC 0.900 0.900 LFG PL 55776 07/01/1996 DEM 354 BRAYTON DIESELS 1-4 IC 9.988 9.988 DFO TK 1619 03/01/1967 DEM 350 BRAYTON PT 1 ST 243.455 246.948 BIT WA NG PL 1619 08/01/1963 DEM 351 BRAYTON PT 2 ST 244.000 249.331 BIT WA NG PL 1619 07/01/1964 DEM 352 BRAYTON PT 3 ST 612.000 638.000 BIT WA NG PL 1619 07/01/1969 DEM 353 BRAYTON PT 4 ST 435.000 445.520 RFO WA NG PL 1619 12/01/1974 DEM 321 MANCHESTER 10/10A CC CC 149.000 170.000 NG PL DFO WA 3236 11/15/1995 DEM 322 MANCHESTER 11/11A CC CC 148.719 169.719 NG PL DFO WA 3236 10/01/1995 DEM 323 MANCHESTER 9/9A CC CC 149.000 170.000 NG PL DFO WA 3236 11/14/1995 DEM 484 MILLSTONE POINT 2 ST 876.923 878.414 NUC TK 566 12/01/1975 DEM 485 MILLSTONE POINT 3 ST 1137.483 1237.196 NUC TK 566 04/01/1986 DEM 527 OGDEN-MARTIN 1 ST 40.111 41.060 MSW TK DFO 50661 06/01/1989 DEM 551 SALEM HARBOR 1 ST 79.055 78.539 BIT WA RFO WA 1626 01/01/1952 DEM 552 SALEM HARBOR 2 ST 76.946 75.232 BIT WA RFO WA 1626 01/01/1952 DEM 553 SALEM HARBOR 3 ST 144.598 145.474 BIT WA RFO WA 1626 08/01/1958 DEM 554 SALEM HARBOR 4 ST 437.353 437.353 RFO WA 1626 08/01/1972 Sub-total for DEM by Unit Type
BIO/REFUSE 41.011 41.960COAL STEAM 1400.054 1433.524
GAS/OIL COMBINED CYCLE 446.719 509.719GAS/OIL STEAM 435.000 445.520
NUCLEAR STEAM 2014.406 2115.610OIL INTERNAL COMBUSTION 9.988 9.988
OIL STEAM 437.353 437.353Total MW Claimed for Capability by DEM in the ISO-NE Control Area 4784.531 4993.674
Dominion Energy Marketing, Inc.

Section 2 - Control Area Capability
NOTES: Appendix A - defines the codes used. Additional information and changes to generating asset Lead Participant since January 1, 2009 may be found in the Endnotes following Section 2.1. Summer and winter capabilities as of January 1, 2009. When an alternate fuel is listed, the unit may not necessarily be fully operable on both fuels. CELT Report - April 2009 Page 27 ISO New England Inc.
LEAD PARTICIPANT ASSET ID AND STATION NAME
COMMERCIAL IN-SERVICE
ENERGY SOURCE
PRIMARY FUELNET CAPABILITY - MW
EIA PLANT NUMBER
TRANSP. METHODWINTERSUMMER
UNITTYPE
ENERGY SOURCE
ALTERNATE FUEL
TRANSP. METHOD
Claimed for Capability DPM 1032 BRIDGEPORT ENERGY 1 CC 445.144 524.388 NG PL 55042 08/01/1998 DPM 1216 MAINE INDEPENDENCE STATION CC 488.275 538.275 NG PL 55068 05/01/2000 Sub-total for DPM by Unit Type
GAS COMBINED CYCLE 933.419 1062.663Total MW Claimed for Capability by DPM in the ISO-NE Control Area 933.419 1062.663
Dynegy Power Marketing, Inc.
Claimed for Capability ENE 13703 VERSO COGEN 1 GT 47.358 58.512 NG PL KER TK 55031 12/28/2000 ENE 13704 VERSO COGEN 2 GT 45.254 56.408 NG PL KER TK 55031 12/28/2000 ENE 13705 VERSO COGEN 3 GT 44.136 55.290 NG PL KER TK 55031 12/28/2000 ENE 629 WORCESTER ENERGY ST 17.959 18.034 WDS TK 10165 11/01/1997 Sub-total for ENE by Unit Type
BIO/REFUSE 17.959 18.034GAS COMBUSTION (GAS) TURBINE 136.748 170.210
Total MW Claimed for Capability by ENE in the ISO-NE Control Area 154.707 188.244
Energy New England LLC
Section 2 - Control Area Capability
NOTES: Appendix A - defines the codes used. Additional information and changes to generating asset Lead Participant since January 1, 2009 may be found in the Endnotes following Section 2.1. Summer and winter capabilities as of January 1, 2009. When an alternate fuel is listed, the unit may not necessarily be fully operable on both fuels. CELT Report - April 2009 Page 28 ISO New England Inc.
LEAD PARTICIPANT ASSET ID AND STATION NAME
COMMERCIAL IN-SERVICE
ENERGY SOURCE
PRIMARYNET CAPABILITY - MW
EIA PLANT NUMBER
TRANSP. METHODWINTERSUMMER
UNITTYPE
ENERGY SOURCE
ALTERNATE
TRANSP. METHOD
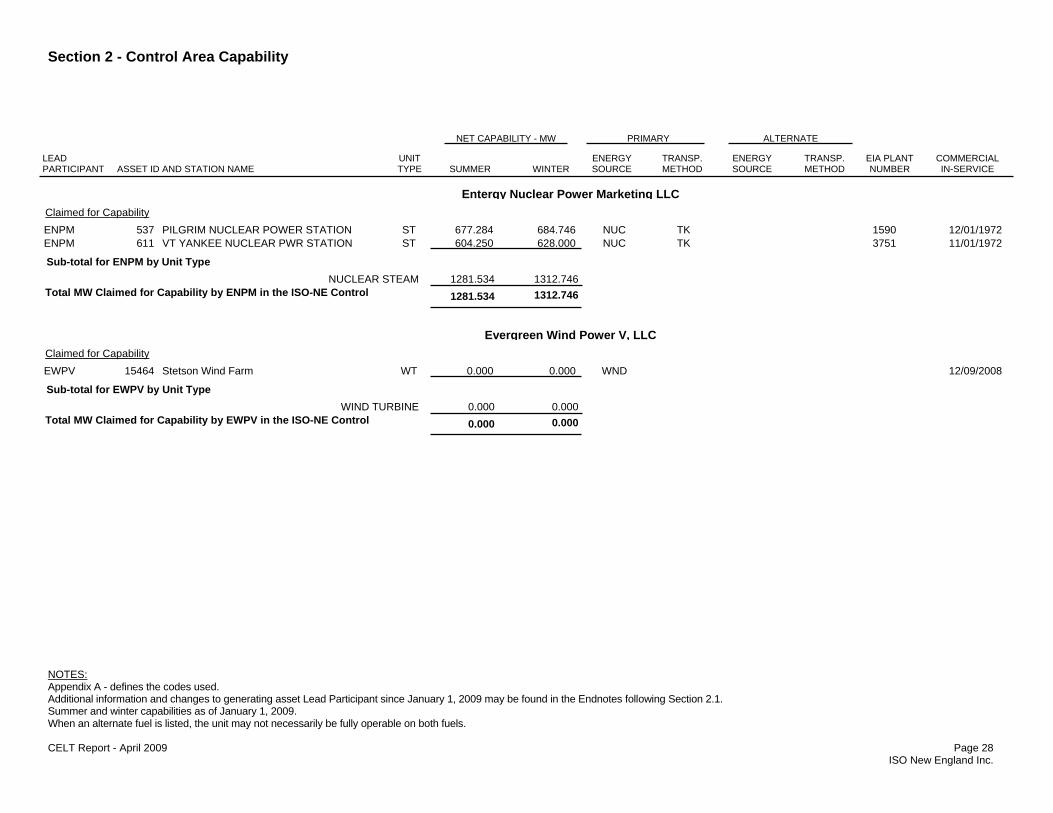
Claimed for Capability ENPM 537 PILGRIM NUCLEAR POWER STATION ST 677.284 684.746 NUC TK 1590 12/01/1972 ENPM 611 VT YANKEE NUCLEAR PWR STATION ST 604.250 628.000 NUC TK 3751 11/01/1972 Sub-total for ENPM by Unit Type
NUCLEAR STEAM 1281.534 1312.746Total MW Claimed for Capability by ENPM in the ISO-NE Control 1281.534 1312.746
Entergy Nuclear Power Marketing LLC
Claimed for Capability EWPV 15464 Stetson Wind Farm WT 0.000 0.000 WND 12/09/2008 Sub-total for EWPV by Unit Type
WIND TURBINE 0.000 0.000Total MW Claimed for Capability by EWPV in the ISO-NE Control 0.000 0.000
Evergreen Wind Power V, LLC
Section 2 - Control Area Capability
NOTES: Appendix A - defines the codes used. Additional information and changes to generating asset Lead Participant since January 1, 2009 may be found in the Endnotes following Section 2.1. Summer and winter capabilities as of January 1, 2009. When an alternate fuel is listed, the unit may not necessarily be fully operable on both fuels. CELT Report - April 2009 Page 29 ISO New England Inc.
LEAD PARTICIPANT ASSET ID AND STATION NAME
COMMERCIAL IN-SERVICE
ENERGY SOURCE
PRIMARYNET CAPABILITY - MW
EIA PLANT NUMBER
TRANSP. METHODWINTERSUMMER
UNITTYPE
ENERGY SOURCE
ALTERNATE
TRANSP. METHOD
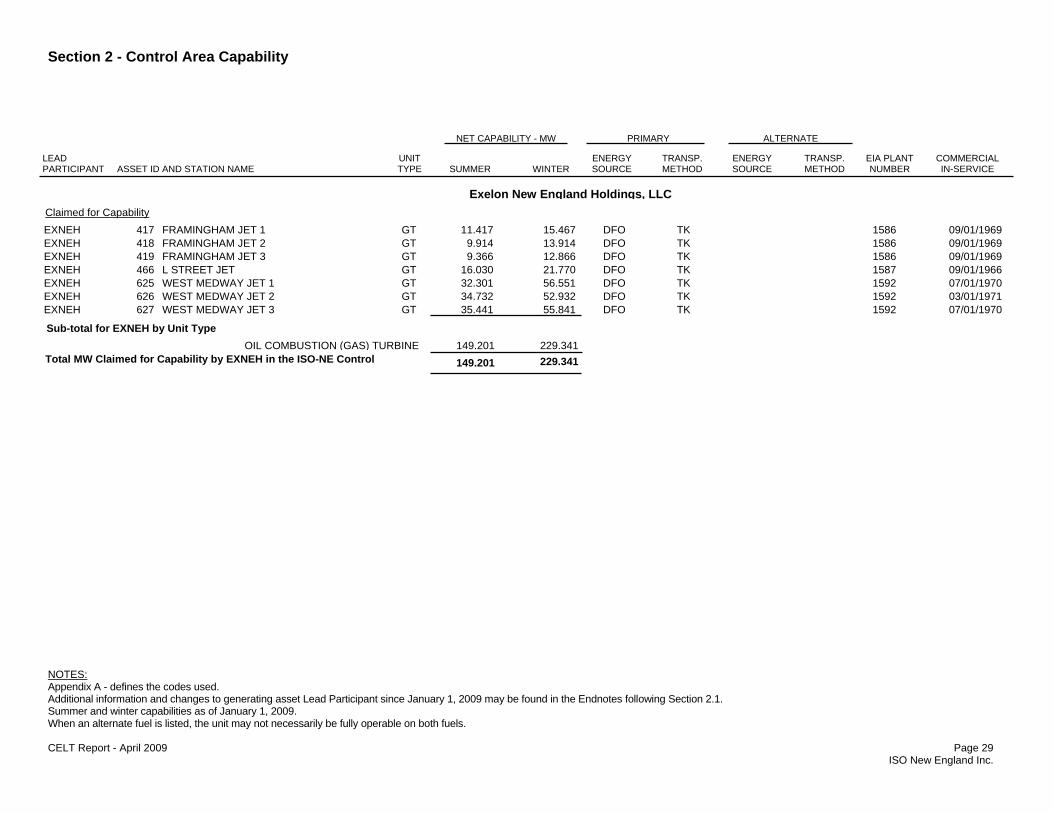
Claimed for Capability EXNEH 417 FRAMINGHAM JET 1 GT 11.417 15.467 DFO TK 1586 09/01/1969 EXNEH 418 FRAMINGHAM JET 2 GT 9.914 13.914 DFO TK 1586 09/01/1969 EXNEH 419 FRAMINGHAM JET 3 GT 9.366 12.866 DFO TK 1586 09/01/1969 EXNEH 466 L STREET JET GT 16.030 21.770 DFO TK 1587 09/01/1966 EXNEH 625 WEST MEDWAY JET 1 GT 32.301 56.551 DFO TK 1592 07/01/1970 EXNEH 626 WEST MEDWAY JET 2 GT 34.732 52.932 DFO TK 1592 03/01/1971 EXNEH 627 WEST MEDWAY JET 3 GT 35.441 55.841 DFO TK 1592 07/01/1970 Sub-total for EXNEH by Unit Type
OIL COMBUSTION (GAS) TURBINE 149.201 229.341Total MW Claimed for Capability by EXNEH in the ISO-NE Control 149.201 229.341
Exelon New England Holdings, LLC
Section 2 - Control Area Capability
NOTES: Appendix A - defines the codes used. Additional information and changes to generating asset Lead Participant since January 1, 2009 may be found in the Endnotes following Section 2.1. Summer and winter capabilities as of January 1, 2009. When an alternate fuel is listed, the unit may not necessarily be fully operable on both fuels. CELT Report - April 2009 Page 30 ISO New England Inc.
LEAD PARTICIPANT ASSET ID AND STATION NAME
COMMERCIAL IN-SERVICE
ENERGY SOURCE
PRIMARYNET CAPABILITY - MW
EIA PLANT NUMBER
TRANSP. METHODWINTERSUMMER
UNITTYPE
ENERGY SOURCE
ALTERNATE
TRANSP. METHOD
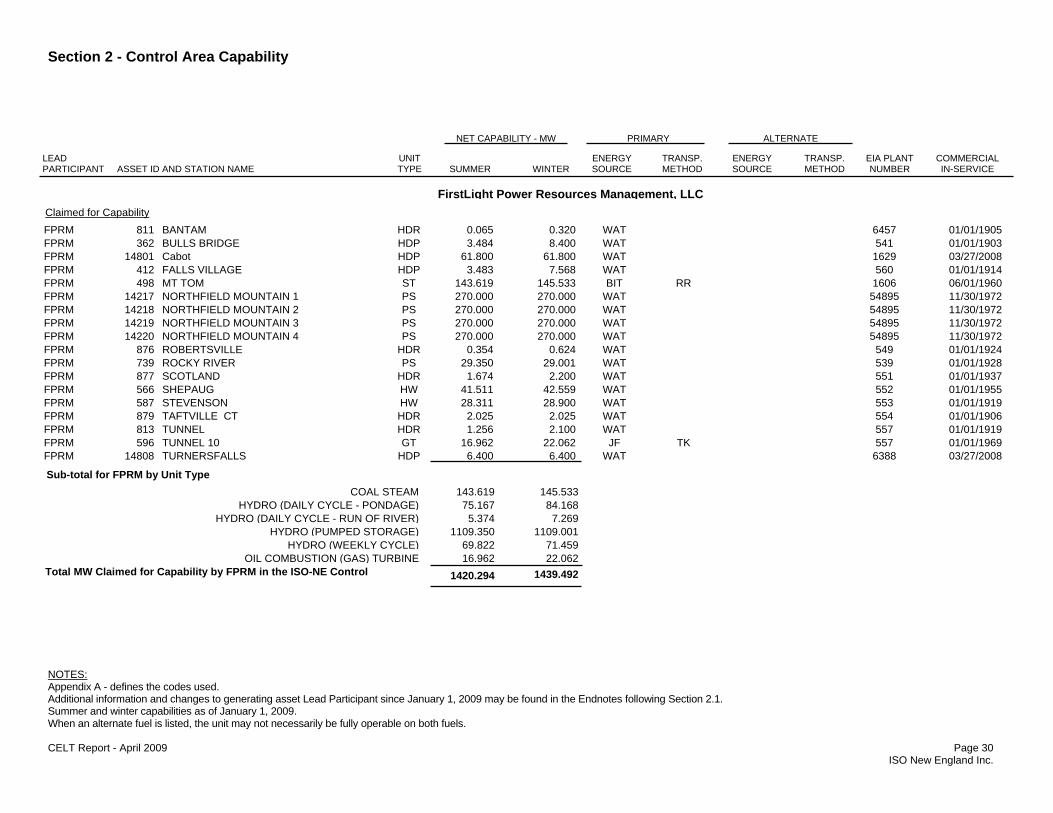
Claimed for Capability FPRM 811 BANTAM HDR 0.065 0.320 WAT 6457 01/01/1905 FPRM 362 BULLS BRIDGE HDP 3.484 8.400 WAT 541 01/01/1903 FPRM 14801 Cabot HDP 61.800 61.800 WAT 1629 03/27/2008 FPRM 412 FALLS VILLAGE HDP 3.483 7.568 WAT 560 01/01/1914 FPRM 498 MT TOM ST 143.619 145.533 BIT RR 1606 06/01/1960 FPRM 14217 NORTHFIELD MOUNTAIN 1 PS 270.000 270.000 WAT 54895 11/30/1972 FPRM 14218 NORTHFIELD MOUNTAIN 2 PS 270.000 270.000 WAT 54895 11/30/1972 FPRM 14219 NORTHFIELD MOUNTAIN 3 PS 270.000 270.000 WAT 54895 11/30/1972 FPRM 14220 NORTHFIELD MOUNTAIN 4 PS 270.000 270.000 WAT 54895 11/30/1972 FPRM 876 ROBERTSVILLE HDR 0.354 0.624 WAT 549 01/01/1924 FPRM 739 ROCKY RIVER PS 29.350 29.001 WAT 539 01/01/1928 FPRM 877 SCOTLAND HDR 1.674 2.200 WAT 551 01/01/1937 FPRM 566 SHEPAUG HW 41.511 42.559 WAT 552 01/01/1955 FPRM 587 STEVENSON HW 28.311 28.900 WAT 553 01/01/1919 FPRM 879 TAFTVILLE CT HDR 2.025 2.025 WAT 554 01/01/1906 FPRM 813 TUNNEL HDR 1.256 2.100 WAT 557 01/01/1919 FPRM 596 TUNNEL 10 GT 16.962 22.062 JF TK 557 01/01/1969 FPRM 14808 TURNERSFALLS HDP 6.400 6.400 WAT 6388 03/27/2008 Sub-total for FPRM by Unit Type
COAL STEAM 143.619 145.533HYDRO (DAILY CYCLE - PONDAGE) 75.167 84.168
HYDRO (DAILY CYCLE - RUN OF RIVER) 5.374 7.269HYDRO (PUMPED STORAGE) 1109.350 1109.001
HYDRO (WEEKLY CYCLE) 69.822 71.459OIL COMBUSTION (GAS) TURBINE 16.962 22.062
Total MW Claimed for Capability by FPRM in the ISO-NE Control 1420.294 1439.492
FirstLight Power Resources Management, LLC

Section 2 - Control Area Capability
NOTES: Appendix A - defines the codes used. Additional information and changes to generating asset Lead Participant since January 1, 2009 may be found in the Endnotes following Section 2.1. Summer and winter capabilities as of January 1, 2009. When an alternate fuel is listed, the unit may not necessarily be fully operable on both fuels. CELT Report - April 2009 Page 31 ISO New England Inc.
LEAD PARTICIPANT ASSET ID AND STATION NAME
COMMERCIAL IN-SERVICE
ENERGY SOURCE
PRIMARYNET CAPABILITY - MW
EIA PLANT NUMBER
TRANSP. METHODWINTERSUMMER
UNITTYPE
ENERGY SOURCE
ALTERNATE
TRANSP. METHOD
Claimed for Capability FGE 10998 MASSINNOVATION FITCHBURG PV 0.003 0.003 SUN 08/01/2005 FGE 538 PINETREE POWER ST 16.620 16.844 WDS TK 54620 11/01/1992 Sub-total for FGE by Unit Type
BIO/REFUSE 16.620 16.844MISC. OTHER 0.003 0.003
Total MW Claimed for Capability by FGE in the ISO-NE Control Area 16.623 16.847
Fitchburg Gas & Electric Light Company
Section 2 - Control Area Capability
NOTES: Appendix A - defines the codes used. Additional information and changes to generating asset Lead Participant since January 1, 2009 may be found in the Endnotes following Section 2.1. Summer and winter capabilities as of January 1, 2009. When an alternate fuel is listed, the unit may not necessarily be fully operable on both fuels. CELT Report - April 2009 Page 32 ISO New England Inc.
LEAD PARTICIPANT ASSET ID AND STATION NAME
COMMERCIAL IN-SERVICE
ENERGY SOURCE
PRIMARYNET CAPABILITY - MW
EIA PLANT NUMBER
TRANSP. METHODWINTERSUMMER
UNITTYPE
ENERGY SOURCE
ALTERNATE
TRANSP. METHOD
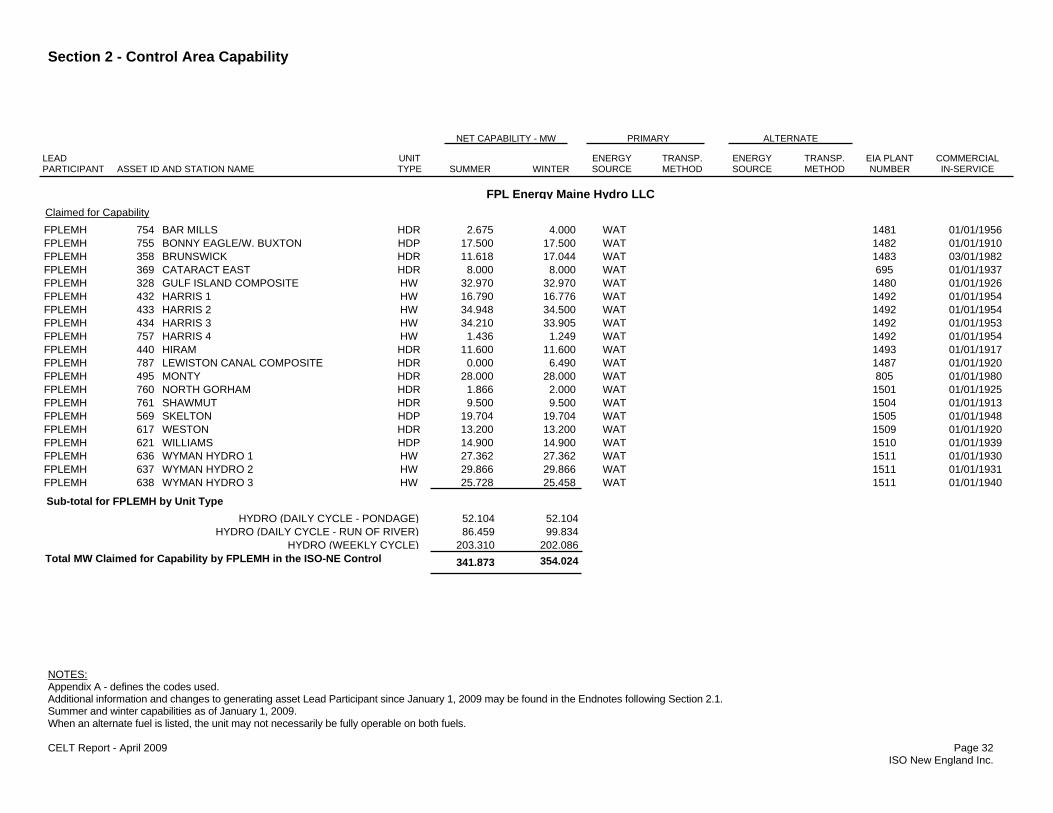
Claimed for Capability FPLEMH 754 BAR MILLS HDR 2.675 4.000 WAT 1481 01/01/1956 FPLEMH 755 BONNY EAGLE/W. BUXTON HDP 17.500 17.500 WAT 1482 01/01/1910 FPLEMH 358 BRUNSWICK HDR 11.618 17.044 WAT 1483 03/01/1982 FPLEMH 369 CATARACT EAST HDR 8.000 8.000 WAT 695 01/01/1937 FPLEMH 328 GULF ISLAND COMPOSITE HW 32.970 32.970 WAT 1480 01/01/1926 FPLEMH 432 HARRIS 1 HW 16.790 16.776 WAT 1492 01/01/1954 FPLEMH 433 HARRIS 2 HW 34.948 34.500 WAT 1492 01/01/1954 FPLEMH 434 HARRIS 3 HW 34.210 33.905 WAT 1492 01/01/1953 FPLEMH 757 HARRIS 4 HW 1.436 1.249 WAT 1492 01/01/1954 FPLEMH 440 HIRAM HDR 11.600 11.600 WAT 1493 01/01/1917 FPLEMH 787 LEWISTON CANAL COMPOSITE HDR 0.000 6.490 WAT 1487 01/01/1920 FPLEMH 495 MONTY HDR 28.000 28.000 WAT 805 01/01/1980 FPLEMH 760 NORTH GORHAM HDR 1.866 2.000 WAT 1501 01/01/1925 FPLEMH 761 SHAWMUT HDR 9.500 9.500 WAT 1504 01/01/1913 FPLEMH 569 SKELTON HDP 19.704 19.704 WAT 1505 01/01/1948 FPLEMH 617 WESTON HDR 13.200 13.200 WAT 1509 01/01/1920 FPLEMH 621 WILLIAMS HDP 14.900 14.900 WAT 1510 01/01/1939 FPLEMH 636 WYMAN HYDRO 1 HW 27.362 27.362 WAT 1511 01/01/1930 FPLEMH 637 WYMAN HYDRO 2 HW 29.866 29.866 WAT 1511 01/01/1931 FPLEMH 638 WYMAN HYDRO 3 HW 25.728 25.458 WAT 1511 01/01/1940 Sub-total for FPLEMH by Unit Type
HYDRO (DAILY CYCLE - PONDAGE) 52.104 52.104HYDRO (DAILY CYCLE - RUN OF RIVER) 86.459 99.834
HYDRO (WEEKLY CYCLE) 203.310 202.086Total MW Claimed for Capability by FPLEMH in the ISO-NE Control 341.873 354.024
FPL Energy Maine Hydro LLC

Section 2 - Control Area Capability
NOTES: Appendix A - defines the codes used. Additional information and changes to generating asset Lead Participant since January 1, 2009 may be found in the Endnotes following Section 2.1. Summer and winter capabilities as of January 1, 2009. When an alternate fuel is listed, the unit may not necessarily be fully operable on both fuels. CELT Report - April 2009 Page 33 ISO New England Inc.
LEAD PARTICIPANT ASSET ID AND STATION NAME
COMMERCIAL IN-SERVICE
ENERGY SOURCE
PRIMARYNET CAPABILITY - MW
EIA PLANT NUMBER
TRANSP. METHODWINTERSUMMER
UNITTYPE
ENERGY SOURCE
ALTERNATE
TRANSP. METHOD
Claimed for Capability FPL 331 AZISCOHOS HYDRO HDR 6.810 6.810 WAT 50999 07/01/1988 FPL 1258 BHE SMALL HYDRO COMPOSITE HDR 1.724 1.893 WAT 1469 12/01/1982 FPL 367 CAPE GT 4 GT 15.931 20.011 DFO TK 1484 01/01/1970 FPL 368 CAPE GT 5 GT 15.822 20.272 DFO TK 1484 01/01/1970 FPL 1259 J & L ELECTRIC - BIOMASS I ST 0.000 0.000 WDS TK 55034 11/01/1984 FPL 10566 J & L ELECTRIC - BIOMASS II ST 0.000 0.000 WDS TK 55034 08/01/2004 FPL 786 KEZAR LEDGEMERE COMPOSITE HDR 0.633 1.232 WAT 7668 02/01/1996 FPL 460 LOCKWOOD HDR 6.945 7.000 WAT 10066 12/01/1984 FPL 1266 MARSH POWER HDR 0.000 0.000 WAT 1469 02/01/1986 FPL 476 MERC ST 19.978 22.584 MSW TK NG 10338 05/01/1987 FPL 759 MESSALONSKEE COMPOSITE HDR 4.400 4.400 WAT 1497 01/01/1917 FPL 1109 MMWAC ST 2.628 2.628 MSW TK 50035 06/01/1992 FPL 507 NEA BELLINGHAM CC 276.682 339.302 NG PL DFO TK 10307 10/01/1991 FPL 14767 Pine Tree LFGTE GT 2.870 2.870 LFG 01/01/2008 FPL 2289 PIONEER DAM HYDRO HDR 0.198 0.198 WAT 2289 12/01/1985 FPL 1630 RISEP CC 528.808 588.388 NG PL 55107 11/05/2002 FPL 591 S.D. WARREN-WESTBROOK ST 42.590 49.103 WDS TK RFO TK 50447 11/01/1997 FPL 555 SEABROOK ST 1245.463 1245.425 NUC TK 6115 04/01/1990 FPL 14937 Union Gas Station HDR 1.500 1.500 WAT 03/19/2008 FPL 2291 WAVERLY AVENUE HYDRO HDR 0.295 0.243 WAT 2291 04/01/1984 FPL 616 WEST ENFIELD HDR 7.472 9.359 WAT 10255 05/01/1988 FPL 639 YARMOUTH 1 ST 51.760 52.495 RFO WA 1507 01/01/1957 FPL 640 YARMOUTH 2 ST 51.131 52.823 RFO WA 1507 01/01/1958 FPL 641 YARMOUTH 3 ST 115.508 117.805 RFO WA 1507 07/01/1965 FPL 642 YARMOUTH 4 ST 603.488 610.375 RFO WA 1507 12/01/1978
FPL Energy Power Marketing, LLC

Section 2 - Control Area Capability
NOTES: Appendix A - defines the codes used. Additional information and changes to generating asset Lead Participant since January 1, 2009 may be found in the Endnotes following Section 2.1. Summer and winter capabilities as of January 1, 2009. When an alternate fuel is listed, the unit may not necessarily be fully operable on both fuels. CELT Report - April 2009 Page 34 ISO New England Inc.
LEAD PARTICIPANT ASSET ID AND STATION NAME
COMMERCIAL IN-SERVICE
ENERGY SOURCE
PRIMARYNET CAPABILITY - MW
EIA PLANT NUMBER
TRANSP. METHODWINTERSUMMER
UNITTYPE
ENERGY SOURCE
ALTERNATE
TRANSP. METHOD
Sub-total for FPL by Unit Type BIO/REFUSE 68.066 77.185
GAS COMBINED CYCLE 528.808 588.388GAS/OIL COMBINED CYCLE 276.682 339.302
HYDRO (DAILY CYCLE - RUN OF RIVER) 29.977 32.635NUCLEAR STEAM 1245.463 1245.425
OIL COMBUSTION (GAS) TURBINE 31.753 40.283OIL STEAM 821.887 833.498
Total MW Claimed for Capability by FPL in the ISO-NE Control Area 3002.636 3156.716
FPL Energy Power Marketing, LLC
Claimed for Capability GBPM 772 NEWPORT HYDRO HW 3.400 3.450 WAT 3731 01/01/1980 GBPM 826 TROY HDR 0.000 0.000 WAT 3733 01/01/1925 GBPM 825 WEST CHARLESTON HDR 0.000 0.000 WAT 3729 01/01/1944 Sub-total for GBPM by Unit Type
HYDRO (DAILY CYCLE - RUN OF RIVER) 0.000 0.000HYDRO (WEEKLY CYCLE) 3.400 3.450
Total MW Claimed for Capability by GBPM in the ISO-NE Control 3.400 3.450
Great Bay Power Marketing, Inc
Section 2 - Control Area Capability
NOTES: Appendix A - defines the codes used. Additional information and changes to generating asset Lead Participant since January 1, 2009 may be found in the Endnotes following Section 2.1. Summer and winter capabilities as of January 1, 2009. When an alternate fuel is listed, the unit may not necessarily be fully operable on both fuels. CELT Report - April 2009 Page 35 ISO New England Inc.
LEAD PARTICIPANT ASSET ID AND STATION NAME
COMMERCIAL IN-SERVICE
ENERGY SOURCE
PRIMARYNET CAPABILITY - MW
EIA PLANT NUMBER
TRANSP. METHODWINTERSUMMER
UNITTYPE
ENERGY SOURCE
ALTERNATE
TRANSP. METHOD
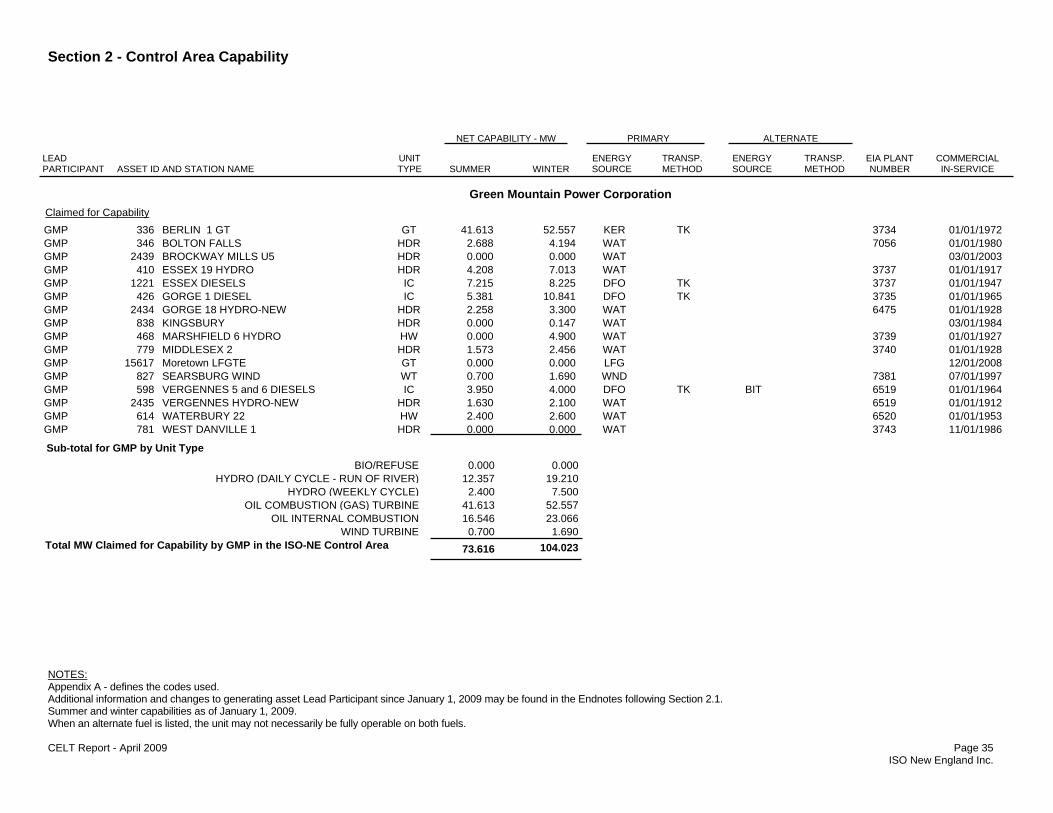
Claimed for Capability GMP 336 BERLIN 1 GT GT 41.613 52.557 KER TK 3734 01/01/1972 GMP 346 BOLTON FALLS HDR 2.688 4.194 WAT 7056 01/01/1980 GMP 2439 BROCKWAY MILLS U5 HDR 0.000 0.000 WAT 03/01/2003 GMP 410 ESSEX 19 HYDRO HDR 4.208 7.013 WAT 3737 01/01/1917 GMP 1221 ESSEX DIESELS IC 7.215 8.225 DFO TK 3737 01/01/1947 GMP 426 GORGE 1 DIESEL IC 5.381 10.841 DFO TK 3735 01/01/1965 GMP 2434 GORGE 18 HYDRO-NEW HDR 2.258 3.300 WAT 6475 01/01/1928 GMP 838 KINGSBURY HDR 0.000 0.147 WAT 03/01/1984 GMP 468 MARSHFIELD 6 HYDRO HW 0.000 4.900 WAT 3739 01/01/1927 GMP 779 MIDDLESEX 2 HDR 1.573 2.456 WAT 3740 01/01/1928 GMP 15617 Moretown LFGTE GT 0.000 0.000 LFG 12/01/2008 GMP 827 SEARSBURG WIND WT 0.700 1.690 WND 7381 07/01/1997 GMP 598 VERGENNES 5 and 6 DIESELS IC 3.950 4.000 DFO TK BIT 6519 01/01/1964 GMP 2435 VERGENNES HYDRO-NEW HDR 1.630 2.100 WAT 6519 01/01/1912 GMP 614 WATERBURY 22 HW 2.400 2.600 WAT 6520 01/01/1953 GMP 781 WEST DANVILLE 1 HDR 0.000 0.000 WAT 3743 11/01/1986 Sub-total for GMP by Unit Type
BIO/REFUSE 0.000 0.000HYDRO (DAILY CYCLE - RUN OF RIVER) 12.357 19.210
HYDRO (WEEKLY CYCLE) 2.400 7.500OIL COMBUSTION (GAS) TURBINE 41.613 52.557
OIL INTERNAL COMBUSTION 16.546 23.066WIND TURBINE 0.700 1.690
Total MW Claimed for Capability by GMP in the ISO-NE Control Area 73.616 104.023
Green Mountain Power Corporation
Section 2 - Control Area Capability
NOTES: Appendix A - defines the codes used. Additional information and changes to generating asset Lead Participant since January 1, 2009 may be found in the Endnotes following Section 2.1. Summer and winter capabilities as of January 1, 2009. When an alternate fuel is listed, the unit may not necessarily be fully operable on both fuels. CELT Report - April 2009 Page 36 ISO New England Inc.
LEAD PARTICIPANT ASSET ID AND STATION NAME
COMMERCIAL IN-SERVICE
ENERGY SOURCE
PRIMARYNET CAPABILITY - MW
EIA PLANT NUMBER
TRANSP. METHODWINTERSUMMER
UNITTYPE
ENERGY SOURCE
ALTERNATE
TRANSP. METHOD
Claimed for Capability GELD 849 CRESCENT DAM HDR 1.306 1.575 WAT 01/01/1993 GELD 850 GLENDALE HYDRO HDR 0.838 1.138 WAT 12/01/1989 Sub-total for GELD by Unit Type
HYDRO (DAILY CYCLE - RUN OF RIVER) 2.144 2.713Total MW Claimed for Capability by GELD in the ISO-NE Control 2.144 2.713
Groton Electric Light Department
Claimed for Capability HQE 1288 BUCKSPORT ENERGY 4 GT 156.805 183.105 NG PL DFO TK 50243 01/01/2001 Sub-total for HQE by Unit Type
GAS/OIL COMBUSTION (GAS) TURBINE 156.805 183.105Total MW Claimed for Capability by HQE in the ISO-NE Control Area 156.805 183.105
H.Q. Energy Services (US) Inc.
Claimed for Capability HDEL 10770 WEST SPRINGFIELD HYDRO U5 HDR 0.743 1.250 WAT 01/10/2005 Sub-total for HDEL by Unit Type
HYDRO (DAILY CYCLE - RUN OF RIVER) 0.743 1.250Total MW Claimed for Capability by HDEL in the ISO-NE Control 0.743 1.250
Harvard Dedicated Energy Limited
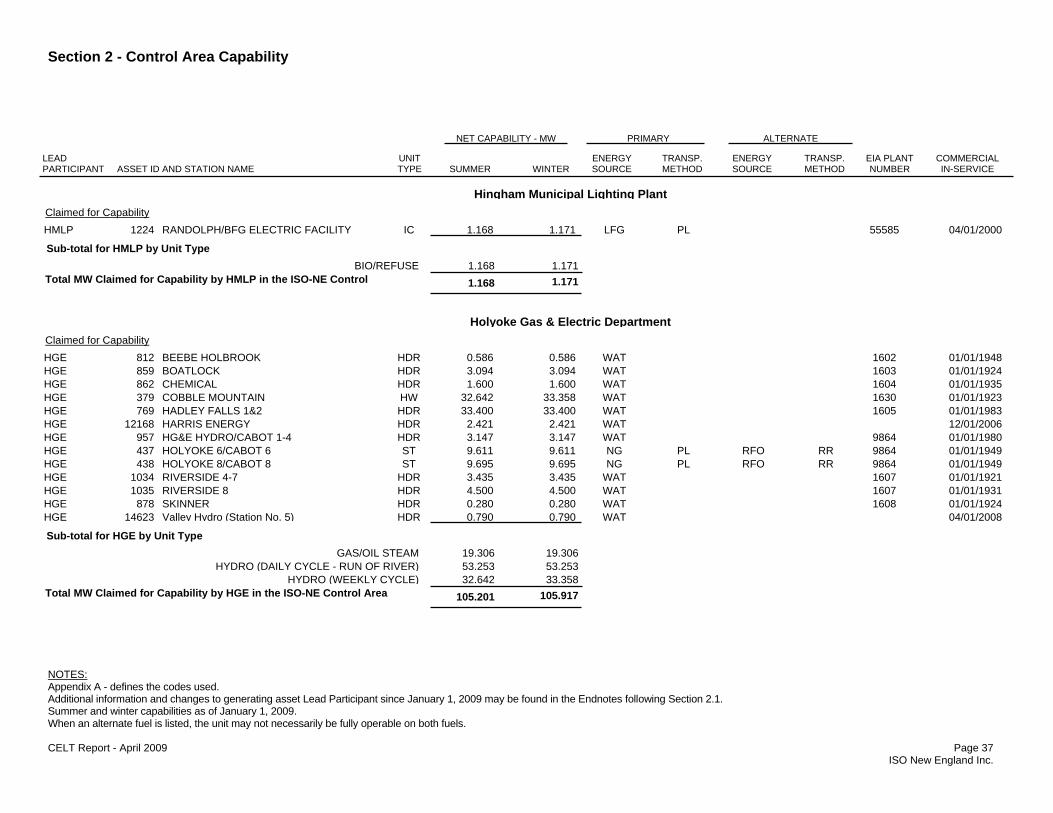
Section 2 - Control Area Capability
NOTES: Appendix A - defines the codes used. Additional information and changes to generating asset Lead Participant since January 1, 2009 may be found in the Endnotes following Section 2.1. Summer and winter capabilities as of January 1, 2009. When an alternate fuel is listed, the unit may not necessarily be fully operable on both fuels. CELT Report - April 2009 Page 37 ISO New England Inc.
LEAD PARTICIPANT ASSET ID AND STATION NAME
COMMERCIAL IN-SERVICE
ENERGY SOURCE
PRIMARYNET CAPABILITY - MW
EIA PLANT NUMBER
TRANSP. METHODWINTERSUMMER
UNITTYPE
ENERGY SOURCE
ALTERNATE
TRANSP. METHOD
Claimed for Capability HMLP 1224 RANDOLPH/BFG ELECTRIC FACILITY IC 1.168 1.171 LFG PL 55585 04/01/2000 Sub-total for HMLP by Unit Type
BIO/REFUSE 1.168 1.171Total MW Claimed for Capability by HMLP in the ISO-NE Control 1.168 1.171
Hingham Municipal Lighting Plant
Claimed for Capability HGE 812 BEEBE HOLBROOK HDR 0.586 0.586 WAT 1602 01/01/1948 HGE 859 BOATLOCK HDR 3.094 3.094 WAT 1603 01/01/1924 HGE 862 CHEMICAL HDR 1.600 1.600 WAT 1604 01/01/1935 HGE 379 COBBLE MOUNTAIN HW 32.642 33.358 WAT 1630 01/01/1923 HGE 769 HADLEY FALLS 1&2 HDR 33.400 33.400 WAT 1605 01/01/1983 HGE 12168 HARRIS ENERGY HDR 2.421 2.421 WAT 12/01/2006 HGE 957 HG&E HYDRO/CABOT 1-4 HDR 3.147 3.147 WAT 9864 01/01/1980 HGE 437 HOLYOKE 6/CABOT 6 ST 9.611 9.611 NG PL RFO RR 9864 01/01/1949 HGE 438 HOLYOKE 8/CABOT 8 ST 9.695 9.695 NG PL RFO RR 9864 01/01/1949 HGE 1034 RIVERSIDE 4-7 HDR 3.435 3.435 WAT 1607 01/01/1921 HGE 1035 RIVERSIDE 8 HDR 4.500 4.500 WAT 1607 01/01/1931 HGE 878 SKINNER HDR 0.280 0.280 WAT 1608 01/01/1924 HGE 14623 Valley Hydro (Station No. 5) HDR 0.790 0.790 WAT 04/01/2008 Sub-total for HGE by Unit Type
GAS/OIL STEAM 19.306 19.306HYDRO (DAILY CYCLE - RUN OF RIVER) 53.253 53.253
HYDRO (WEEKLY CYCLE) 32.642 33.358Total MW Claimed for Capability by HGE in the ISO-NE Control Area 105.201 105.917
Holyoke Gas & Electric Department

Section 2 - Control Area Capability
NOTES: Appendix A - defines the codes used. Additional information and changes to generating asset Lead Participant since January 1, 2009 may be found in the Endnotes following Section 2.1. Summer and winter capabilities as of January 1, 2009. When an alternate fuel is listed, the unit may not necessarily be fully operable on both fuels. CELT Report - April 2009 Page 38 ISO New England Inc.
LEAD PARTICIPANT ASSET ID AND STATION NAME
COMMERCIAL IN-SERVICE
ENERGY SOURCE
PRIMARYNET CAPABILITY - MW
EIA PLANT NUMBER
TRANSP. METHODWINTERSUMMER
UNITTYPE
ENERGY SOURCE
ALTERNATE
TRANSP. METHOD
Claimed for Capability HLPD 2468 CHERRY 10 IC 2.100 2.100 DFO TK 9038 01/01/1951 HLPD 2469 CHERRY 11 IC 2.100 2.100 DFO TK 9038 01/01/1951 HLPD 2470 CHERRY 12 IC 5.000 5.000 DFO TK 9038 01/01/1951 HLPD 2466 CHERRY 7 IC 3.200 3.200 DFO TK 9038 01/01/1951 HLPD 2467 CHERRY 8 IC 3.400 3.400 DFO TK 9038 01/01/1951 Sub-total for HLPD by Unit Type
OIL INTERNAL COMBUSTION 15.800 15.800Total MW Claimed for Capability by HLPD in the ISO-NE Control 15.800 15.800
Hudson Light & Power Department
Claimed for Capability HULL 11408 HULL WIND TURBINE II WT 1.800 1.800 WND 09/27/2005 HULL 1656 HULL WIND TURBINE U5 WT 0.165 0.165 WND 07/01/2001 Sub-total for HULL by Unit Type
WIND TURBINE 1.965 1.965Total MW Claimed for Capability by HULL in the ISO-NE Control Area 1.965 1.965
Hull Municipal Lighting Plant

Section 2 - Control Area Capability
NOTES: Appendix A - defines the codes used. Additional information and changes to generating asset Lead Participant since January 1, 2009 may be found in the Endnotes following Section 2.1. Summer and winter capabilities as of January 1, 2009. When an alternate fuel is listed, the unit may not necessarily be fully operable on both fuels. CELT Report - April 2009 Page 39 ISO New England Inc.
LEAD PARTICIPANT ASSET ID AND STATION NAME
COMMERCIAL IN-SERVICE
ENERGY SOURCE
PRIMARYNET CAPABILITY - MW
EIA PLANT NUMBER
TRANSP. METHODWINTERSUMMER
UNITTYPE
ENERGY SOURCE
ALTERNATE
TRANSP. METHOD
Claimed for Capability IEA 14211 INDECK ALEXANDRIA ST 0.000 0.000 WDS TK 11/06/2008 Sub-total for IEA by Unit Type
BIO/REFUSE 0.000 0.000Total MW Claimed for Capability by IEA in the ISO-NE Control Area 0.000 0.000
Indeck Energy-Alexandria, L.L.C.
Claimed for Capability IES 542 ECO MAINE ST 10.877 10.719 MSW TK NG PL 50225 08/01/1988 IES 536 PERC-ORRINGTON 1 ST 20.851 21.160 MSW TK DFO TK 50051 01/01/1988 Sub-total for IES by Unit Type
BIO/REFUSE 31.728 31.879Total MW Claimed for Capability by IES in the ISO-NE Control Area 31.728 31.879
Integrys Energy Services, Inc.
Claimed for Capability IMLD 448 IPSWICH DIESELS IC 10.240 9.495 DFO TK 1670 01/01/1951 Sub-total for IMLD by Unit Type
OIL INTERNAL COMBUSTION 10.240 9.495Total MW Claimed for Capability by IMLD in the ISO-NE Control Area 10.240 9.495
Ipswich Municipal Light Department
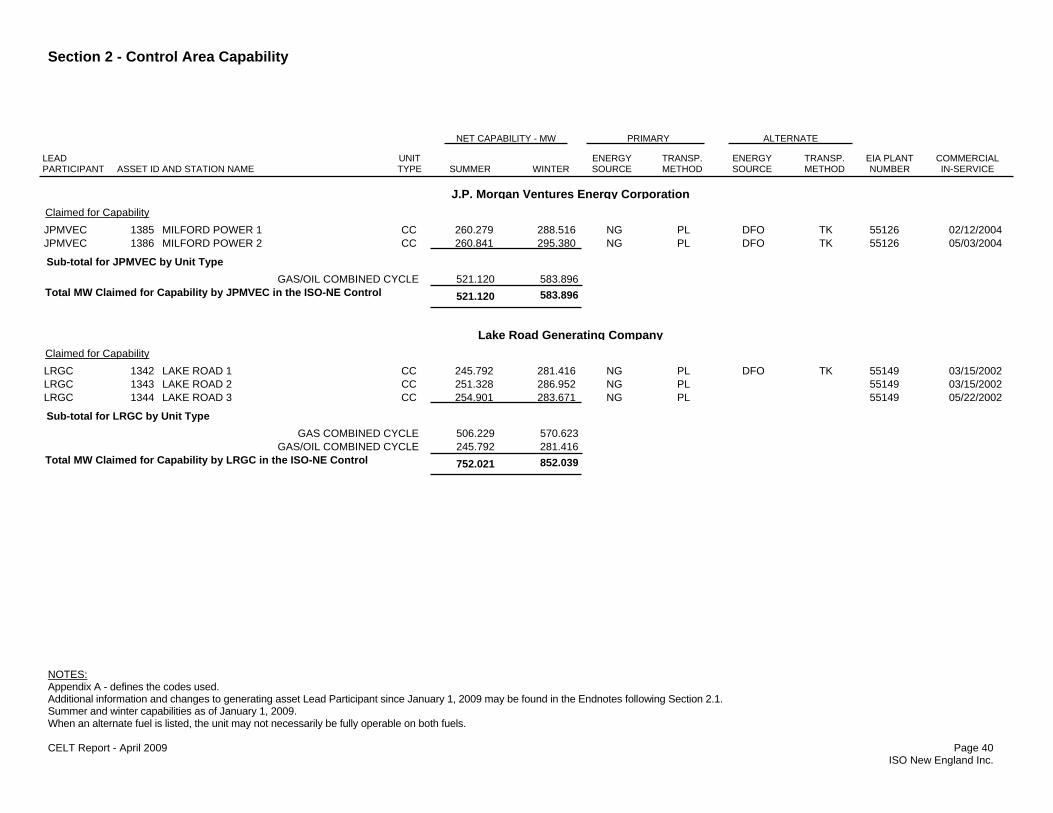
Section 2 - Control Area Capability
NOTES: Appendix A - defines the codes used. Additional information and changes to generating asset Lead Participant since January 1, 2009 may be found in the Endnotes following Section 2.1. Summer and winter capabilities as of January 1, 2009. When an alternate fuel is listed, the unit may not necessarily be fully operable on both fuels. CELT Report - April 2009 Page 40 ISO New England Inc.
LEAD PARTICIPANT ASSET ID AND STATION NAME
COMMERCIAL IN-SERVICE
ENERGY SOURCE
PRIMARYNET CAPABILITY - MW
EIA PLANT NUMBER
TRANSP. METHODWINTERSUMMER
UNITTYPE
ENERGY SOURCE
ALTERNATE
TRANSP. METHOD
Claimed for Capability JPMVEC 1385 MILFORD POWER 1 CC 260.279 288.516 NG PL DFO TK 55126 02/12/2004 JPMVEC 1386 MILFORD POWER 2 CC 260.841 295.380 NG PL DFO TK 55126 05/03/2004 Sub-total for JPMVEC by Unit Type
GAS/OIL COMBINED CYCLE 521.120 583.896Total MW Claimed for Capability by JPMVEC in the ISO-NE Control 521.120 583.896
J.P. Morgan Ventures Energy Corporation
Claimed for Capability LRGC 1342 LAKE ROAD 1 CC 245.792 281.416 NG PL DFO TK 55149 03/15/2002 LRGC 1343 LAKE ROAD 2 CC 251.328 286.952 NG PL 55149 03/15/2002 LRGC 1344 LAKE ROAD 3 CC 254.901 283.671 NG PL 55149 05/22/2002 Sub-total for LRGC by Unit Type
GAS COMBINED CYCLE 506.229 570.623GAS/OIL COMBINED CYCLE 245.792 281.416
Total MW Claimed for Capability by LRGC in the ISO-NE Control 752.021 852.039
Lake Road Generating Company

Section 2 - Control Area Capability
NOTES: Appendix A - defines the codes used. Additional information and changes to generating asset Lead Participant since January 1, 2009 may be found in the Endnotes following Section 2.1. Summer and winter capabilities as of January 1, 2009. When an alternate fuel is listed, the unit may not necessarily be fully operable on both fuels. CELT Report - April 2009 Page 41 ISO New England Inc.
LEAD PARTICIPANT ASSET ID AND STATION NAME
COMMERCIAL IN-SERVICE
ENERGY SOURCE
PRIMARYNET CAPABILITY - MW
EIA PLANT NUMBER
TRANSP. METHODWINTERSUMMER
UNITTYPE
ENERGY SOURCE
ALTERNATE
TRANSP. METHOD
Claimed for Capability LELWD 2280 BENTON FALLS HYDRO HDR 3.776 4.355 WAT 10523 12/01/1987 LELWD 792 CENTENNIAL HYDRO HDR 0.409 0.750 WAT 7112 05/01/1990 LELWD 794 MINIWAWA HDR 0.400 0.657 WAT 04/01/1992 Sub-total for LELWD by Unit Type
HYDRO (DAILY CYCLE - RUN OF RIVER) 4.585 5.762Total MW Claimed for Capability by LELWD in the ISO-NE Control 4.585 5.762
Littleton Electric Light & Water Department
Claimed for Capability MBTA 472 M STREET JET GT 0.000 0.000 JF TK 10176 01/01/1978 Sub-total for MBTA by Unit Type
OIL COMBUSTION (GAS) TURBINE 0.000 0.000Total MW Claimed for Capability by MBTA in the ISO-NE Control 0.000 0.000
MA Bay Transp Auth (MBTA)
Claimed for Capability MEW 15998 Crossroads Landfill GT 0.000 0.000 LFG 12/31/2008 Sub-total for MEW by Unit Type
BIO/REFUSE 0.000 0.000Total MW Claimed for Capability by MEW in the ISO-NE Control Area 0.000 0.000
Madison Electric Works
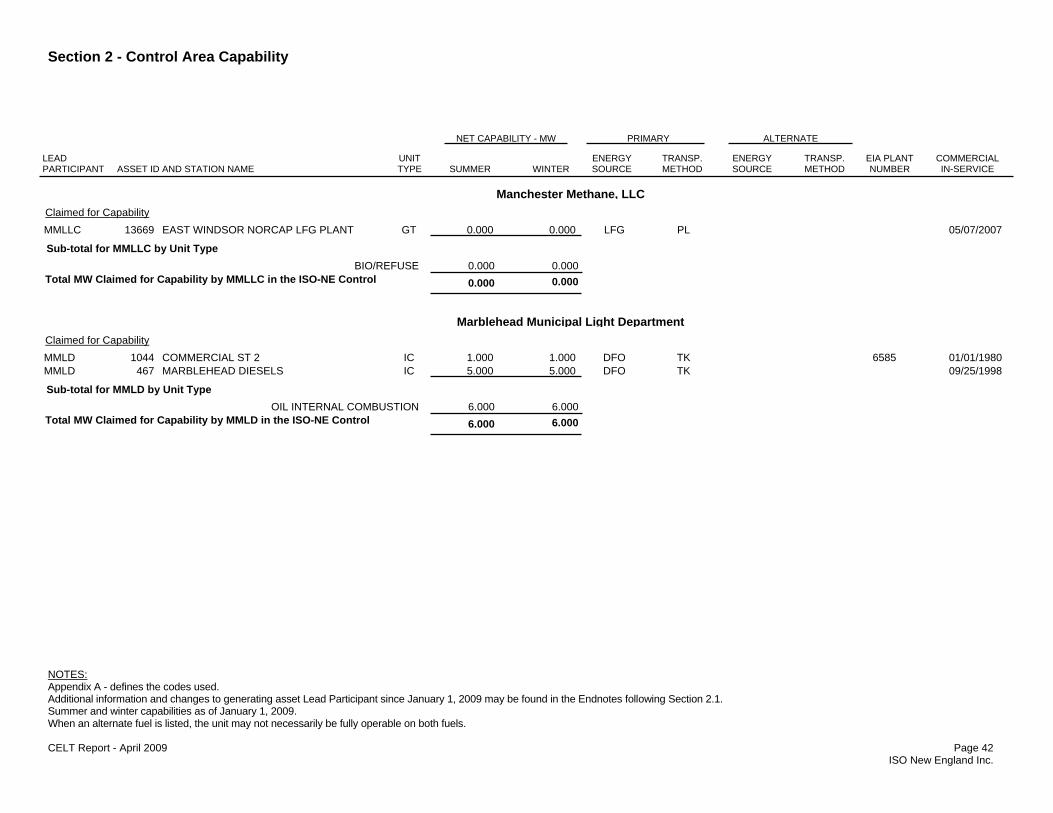
Section 2 - Control Area Capability
NOTES: Appendix A - defines the codes used. Additional information and changes to generating asset Lead Participant since January 1, 2009 may be found in the Endnotes following Section 2.1. Summer and winter capabilities as of January 1, 2009. When an alternate fuel is listed, the unit may not necessarily be fully operable on both fuels. CELT Report - April 2009 Page 42 ISO New England Inc.
LEAD PARTICIPANT ASSET ID AND STATION NAME
COMMERCIAL IN-SERVICE
ENERGY SOURCE
PRIMARYNET CAPABILITY - MW
EIA PLANT NUMBER
TRANSP. METHODWINTERSUMMER
UNITTYPE
ENERGY SOURCE
ALTERNATE
TRANSP. METHOD
Claimed for Capability MMLLC 13669 EAST WINDSOR NORCAP LFG PLANT GT 0.000 0.000 LFG PL 05/07/2007 Sub-total for MMLLC by Unit Type
BIO/REFUSE 0.000 0.000Total MW Claimed for Capability by MMLLC in the ISO-NE Control 0.000 0.000
Manchester Methane, LLC
Claimed for Capability MMLD 1044 COMMERCIAL ST 2 IC 1.000 1.000 DFO TK 6585 01/01/1980 MMLD 467 MARBLEHEAD DIESELS IC 5.000 5.000 DFO TK 09/25/1998 Sub-total for MMLD by Unit Type
OIL INTERNAL COMBUSTION 6.000 6.000Total MW Claimed for Capability by MMLD in the ISO-NE Control 6.000 6.000
Marblehead Municipal Light Department
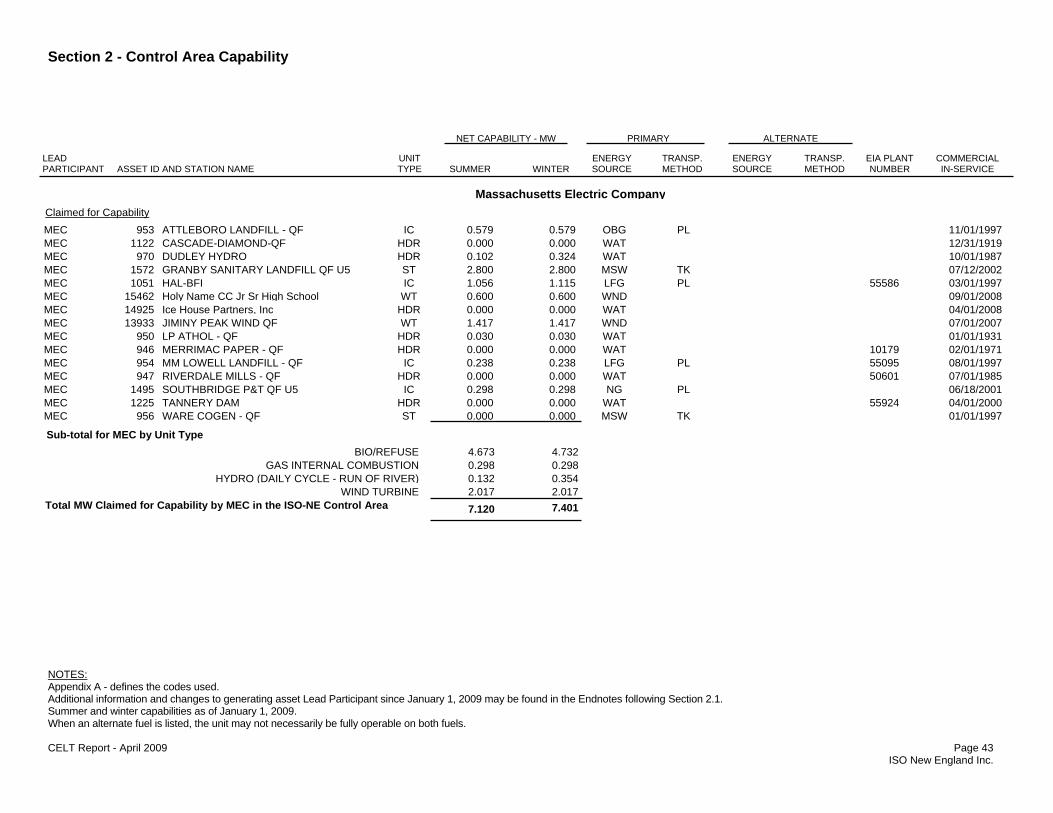
Section 2 - Control Area Capability
NOTES: Appendix A - defines the codes used. Additional information and changes to generating asset Lead Participant since January 1, 2009 may be found in the Endnotes following Section 2.1. Summer and winter capabilities as of January 1, 2009. When an alternate fuel is listed, the unit may not necessarily be fully operable on both fuels. CELT Report - April 2009 Page 43 ISO New England Inc.
LEAD PARTICIPANT ASSET ID AND STATION NAME
COMMERCIAL IN-SERVICE
ENERGY SOURCE
PRIMARYNET CAPABILITY - MW
EIA PLANT NUMBER
TRANSP. METHODWINTERSUMMER
UNITTYPE
ENERGY SOURCE
ALTERNATE
TRANSP. METHOD
Claimed for Capability MEC 953 ATTLEBORO LANDFILL - QF IC 0.579 0.579 OBG PL 11/01/1997 MEC 1122 CASCADE-DIAMOND-QF HDR 0.000 0.000 WAT 12/31/1919 MEC 970 DUDLEY HYDRO HDR 0.102 0.324 WAT 10/01/1987 MEC 1572 GRANBY SANITARY LANDFILL QF U5 ST 2.800 2.800 MSW TK 07/12/2002 MEC 1051 HAL-BFI IC 1.056 1.115 LFG PL 55586 03/01/1997 MEC 15462 Holy Name CC Jr Sr High School WT 0.600 0.600 WND 09/01/2008 MEC 14925 Ice House Partners, Inc HDR 0.000 0.000 WAT 04/01/2008 MEC 13933 JIMINY PEAK WIND QF WT 1.417 1.417 WND 07/01/2007 MEC 950 LP ATHOL - QF HDR 0.030 0.030 WAT 01/01/1931 MEC 946 MERRIMAC PAPER - QF HDR 0.000 0.000 WAT 10179 02/01/1971 MEC 954 MM LOWELL LANDFILL - QF IC 0.238 0.238 LFG PL 55095 08/01/1997 MEC 947 RIVERDALE MILLS - QF HDR 0.000 0.000 WAT 50601 07/01/1985 MEC 1495 SOUTHBRIDGE P&T QF U5 IC 0.298 0.298 NG PL 06/18/2001 MEC 1225 TANNERY DAM HDR 0.000 0.000 WAT 55924 04/01/2000 MEC 956 WARE COGEN - QF ST 0.000 0.000 MSW TK 01/01/1997 Sub-total for MEC by Unit Type
BIO/REFUSE 4.673 4.732GAS INTERNAL COMBUSTION 0.298 0.298
HYDRO (DAILY CYCLE - RUN OF RIVER) 0.132 0.354WIND TURBINE 2.017 2.017
Total MW Claimed for Capability by MEC in the ISO-NE Control Area 7.120 7.401
Massachusetts Electric Company
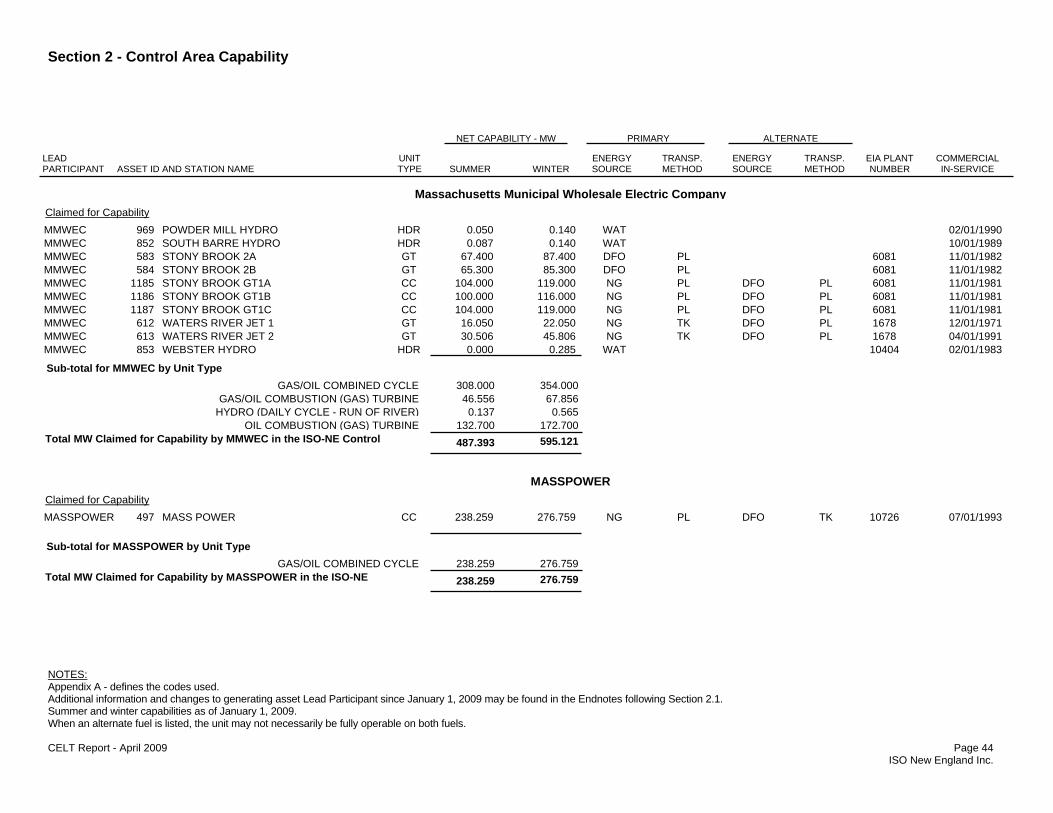
Section 2 - Control Area Capability
NOTES: Appendix A - defines the codes used. Additional information and changes to generating asset Lead Participant since January 1, 2009 may be found in the Endnotes following Section 2.1. Summer and winter capabilities as of January 1, 2009. When an alternate fuel is listed, the unit may not necessarily be fully operable on both fuels. CELT Report - April 2009 Page 44 ISO New England Inc.
LEAD PARTICIPANT ASSET ID AND STATION NAME
COMMERCIAL IN-SERVICE
ENERGY SOURCE
PRIMARYNET CAPABILITY - MW
EIA PLANT NUMBER
TRANSP. METHODWINTERSUMMER
UNITTYPE
ENERGY SOURCE
ALTERNATE
TRANSP. METHOD
Claimed for Capability MMWEC 969 POWDER MILL HYDRO HDR 0.050 0.140 WAT 02/01/1990 MMWEC 852 SOUTH BARRE HYDRO HDR 0.087 0.140 WAT 10/01/1989 MMWEC 583 STONY BROOK 2A GT 67.400 87.400 DFO PL 6081 11/01/1982 MMWEC 584 STONY BROOK 2B GT 65.300 85.300 DFO PL 6081 11/01/1982 MMWEC 1185 STONY BROOK GT1A CC 104.000 119.000 NG PL DFO PL 6081 11/01/1981 MMWEC 1186 STONY BROOK GT1B CC 100.000 116.000 NG PL DFO PL 6081 11/01/1981 MMWEC 1187 STONY BROOK GT1C CC 104.000 119.000 NG PL DFO PL 6081 11/01/1981 MMWEC 612 WATERS RIVER JET 1 GT 16.050 22.050 NG TK DFO PL 1678 12/01/1971 MMWEC 613 WATERS RIVER JET 2 GT 30.506 45.806 NG TK DFO PL 1678 04/01/1991 MMWEC 853 WEBSTER HYDRO HDR 0.000 0.285 WAT 10404 02/01/1983 Sub-total for MMWEC by Unit Type
GAS/OIL COMBINED CYCLE 308.000 354.000GAS/OIL COMBUSTION (GAS) TURBINE 46.556 67.856
HYDRO (DAILY CYCLE - RUN OF RIVER) 0.137 0.565OIL COMBUSTION (GAS) TURBINE 132.700 172.700
Total MW Claimed for Capability by MMWEC in the ISO-NE Control 487.393 595.121
Massachusetts Municipal Wholesale Electric Company
Claimed for Capability MASSPOWER 497 MASS POWER CC 238.259 276.759 NG PL DFO TK 10726 07/01/1993
Sub-total for MASSPOWER by Unit Type GAS/OIL COMBINED CYCLE 238.259 276.759
Total MW Claimed for Capability by MASSPOWER in the ISO-NE 238.259 276.759
MASSPOWER

Section 2 - Control Area Capability
NOTES: Appendix A - defines the codes used. Additional information and changes to generating asset Lead Participant since January 1, 2009 may be found in the Endnotes following Section 2.1. Summer and winter capabilities as of January 1, 2009. When an alternate fuel is listed, the unit may not necessarily be fully operable on both fuels. CELT Report - April 2009 Page 45 ISO New England Inc.
LEAD PARTICIPANT ASSET ID AND STATION NAME
COMMERCIAL IN-SERVICE
ENERGY SOURCE
PRIMARYNET CAPABILITY - MW
EIA PLANT NUMBER
TRANSP. METHODWINTERSUMMER
UNITTYPE
ENERGY SOURCE
ALTERNATE
TRANSP. METHOD
Claimed for Capability MATEP 14087 MAT3 IC 18.509 18.065 DFO PL 10883 12/11/2007 MATEP 13675 MATEP (COMBINED CYCLE) CC 44.521 47.521 NG PL DFO TK 10883 06/28/2007 MATEP 13673 MATEP (DIESEL) IC 19.260 19.491 DFO TK 10883 06/28/2007 Sub-total for MATEP by Unit Type
GAS/OIL COMBINED CYCLE 44.521 47.521OIL INTERNAL COMBUSTION 37.769 37.556
Total MW Claimed for Capability by MATEP in the ISO-NE Control 82.290 85.077
MATEP, LLC
Claimed for Capability MLC 1210 MILLENNIUM CC 325.786 374.786 NG PL 55079 04/06/2001 Sub-total for MLC by Unit Type
GAS COMBINED CYCLE 325.786 374.786Total MW Claimed for Capability by MLC in the ISO-NE Control Area 325.786 374.786
Merrill Lynch Commodities, Inc.
Claimed for Capability MMELD 795 RIVER MILL HYDRO HDR 0.000 0.200 WAT 3049 06/01/1989 Sub-total for MMELD by Unit Type
HYDRO (DAILY CYCLE - RUN OF RIVER) 0.000 0.200Total MW Claimed for Capability by MMELD in the ISO-NE Control 0.000 0.200
Middleton Municipal Light Department

Section 2 - Control Area Capability
NOTES: Appendix A - defines the codes used. Additional information and changes to generating asset Lead Participant since January 1, 2009 may be found in the Endnotes following Section 2.1. Summer and winter capabilities as of January 1, 2009. When an alternate fuel is listed, the unit may not necessarily be fully operable on both fuels. CELT Report - April 2009 Page 46 ISO New England Inc.
LEAD PARTICIPANT ASSET ID AND STATION NAME
COMMERCIAL IN-SERVICE
ENERGY SOURCE
PRIMARYNET CAPABILITY - MW
EIA PLANT NUMBER
TRANSP. METHODWINTERSUMMER
UNITTYPE
ENERGY SOURCE
ALTERNATE
TRANSP. METHOD
Claimed for Capability MET 365 CANAL 1 ST 573.000 573.000 RFO WA 1599 07/01/1968 MET 366 CANAL 2 ST 545.125 562.000 RFO WA NG PL 1599 02/01/1976 MET 1672 KENDALL CT CC 155.681 183.563 NG PL DFO TK 1595 12/18/2002 MET 452 KENDALL JET 1 GT 16.563 21.563 JF TK 1595 09/24/1970 MET 10347 KENDALL STEAM 1 ST 13.565 18.965 NG PL RFO TK 1595 01/01/1950 MET 10348 KENDALL STEAM 2 ST 20.738 20.690 NG PL 1595 01/01/1950 MET 10349 KENDALL STEAM 3 ST 19.116 24.521 NG PL RFO TK 1595 01/01/1950 MET 1030 OAK BLUFFS IC 8.120 8.120 DFO TK 1597 01/01/1970 MET 1031 WEST TISBURY IC 5.633 5.633 DFO TK 6049 01/01/1975 Sub-total for MET by Unit Type
GAS STEAM 20.738 20.690GAS/OIL COMBINED CYCLE 155.681 183.563
GAS/OIL STEAM 577.806 605.486OIL COMBUSTION (GAS) TURBINE 16.563 21.563
OIL INTERNAL COMBUSTION 13.753 13.753OIL STEAM 573.000 573.000
Total MW Claimed for Capability by MET in the ISO-NE Control Area 1357.541 1418.055
Mirant Energy Trading, LLC

Section 2 - Control Area Capability
NOTES: Appendix A - defines the codes used. Additional information and changes to generating asset Lead Participant since January 1, 2009 may be found in the Endnotes following Section 2.1. Summer and winter capabilities as of January 1, 2009. When an alternate fuel is listed, the unit may not necessarily be fully operable on both fuels. CELT Report - April 2009 Page 47 ISO New England Inc.
LEAD PARTICIPANT ASSET ID AND STATION NAME
COMMERCIAL IN-SERVICE
ENERGY SOURCE
PRIMARYNET CAPABILITY - MW
EIA PLANT NUMBER
TRANSP. METHODWINTERSUMMER
UNITTYPE
ENERGY SOURCE
ALTERNATE
TRANSP. METHOD
Claimed for Capability NEC 1054 BLACKSTONE HYDRO ASSOC HDR 0.000 0.000 WAT 3245 01/01/1989 NEC 789 CEC 002 PAWTUCKET U5 HDR 0.296 1.200 WAT 3233 03/01/1985 NEC 11889 IBEW LOCAL 99 SOLAR QF PV 0.029 0.029 SUN 09/01/2006 NEC 952 PONTIAC ENERGY - QF IC 0.170 0.170 OBG PL 10/01/1998 NEC 11827 PORTSMOUTH ABBEY WIND QF WT 0.445 0.445 WND 07/25/2006 NEC 14383 SBER ROYAL MILLS LLC HDR 0.000 0.000 WAT 12/01/2007 NEC 949 VALLEY HYDRO - QF HDR 0.000 0.000 WAT 01/01/1984 Sub-total for NEC by Unit Type
BIO/REFUSE 0.170 0.170HYDRO (DAILY CYCLE - RUN OF RIVER) 0.296 1.200
MISC. OTHER 0.029 0.029WIND TURBINE 0.445 0.445
Total MW Claimed for Capability by NEC in the ISO-NE Control Area 0.940 1.844
Narragansett Electric Company
Claimed for Capability NECCO 10308 NECCO COGENERATION FACILITY IC 5.000 5.000 DFO TK 10/01/2003 Sub-total for NECCO by Unit Type
OIL INTERNAL COMBUSTION 5.000 5.000Total MW Claimed for Capability by NECCO in the ISO-NE Control 5.000 5.000
New England Confectionery Company, Inc (AKA NECCO, Inc)

Section 2 - Control Area Capability
NOTES: Appendix A - defines the codes used. Additional information and changes to generating asset Lead Participant since January 1, 2009 may be found in the Endnotes following Section 2.1. Summer and winter capabilities as of January 1, 2009. When an alternate fuel is listed, the unit may not necessarily be fully operable on both fuels. CELT Report - April 2009 Page 48 ISO New England Inc.
LEAD PARTICIPANT ASSET ID AND STATION NAME
COMMERCIAL IN-SERVICE
ENERGY SOURCE
PRIMARYNET CAPABILITY - MW
EIA PLANT NUMBER
TRANSP. METHODWINTERSUMMER
UNITTYPE
ENERGY SOURCE
ALTERNATE
TRANSP. METHOD
Claimed for Capability NEP 1024 BUNKER RD #1 DIESEL IC 0.000 0.000 DFO TK 1615 04/01/2000 NEP 1028 BUNKER RD #12 GAS TURB GT 3.000 3.700 DFO TK 1615 04/01/2000 NEP 1029 BUNKER RD #13 GAS TURB GT 3.000 3.700 DFO TK 1615 04/01/2000 NEP 1025 BUNKER RD #2 DIESEL IC 0.000 0.000 DFO TK 1615 04/01/2000 NEP 1026 BUNKER RD #3 DIESEL IC 0.000 0.000 DFO TK 1615 04/01/2000 NEP 1027 BUNKER RD #4 DIESEL IC 0.000 0.000 DFO TK 1615 04/01/2000 NEP 451 JOHNSTON LANDFILL IC 11.962 12.000 LFG PL 50365 02/01/1990 NEP 457 LAWRENCE HYDRO HDR 7.775 14.100 WAT 50545 11/01/1981 NEP 546 RESCO SAUGUS ST 32.725 30.114 MSW TK 50880 11/01/1985 NEP 624 WMI MILLBURY 1 ST 39.811 39.891 MSW TK 50878 09/01/1987 Sub-total for NEP by Unit Type
BIO/REFUSE 84.498 82.005HYDRO (DAILY CYCLE - RUN OF RIVER) 7.775 14.100
OIL COMBUSTION (GAS) TURBINE 6.000 7.400OIL INTERNAL COMBUSTION 0.000 0.000
Total MW Claimed for Capability by NEP in the ISO-NE Control Area 98.273 103.505
New England Power Company
Claimed for Capability NHEC 15706 Beaver Ridge Wind WT 1.000 1.500 WND 10/15/2008 NHEC 715 ROCHESTER LANDFILL GT 4.595 4.980 OBG PL 2007 05/01/1998 Sub-total for NHEC by Unit Type
BIO/REFUSE 4.595 4.980WIND TURBINE 1.000 1.500
Total MW Claimed for Capability by NHEC in the ISO-NE Control 5.595 6.480
New Hampshire Electric Cooperative, Inc.

Section 2 - Control Area Capability
NOTES: Appendix A - defines the codes used. Additional information and changes to generating asset Lead Participant since January 1, 2009 may be found in the Endnotes following Section 2.1. Summer and winter capabilities as of January 1, 2009. When an alternate fuel is listed, the unit may not necessarily be fully operable on both fuels. CELT Report - April 2009 Page 49 ISO New England Inc.
LEAD PARTICIPANT ASSET ID AND STATION NAME
COMMERCIAL IN-SERVICE
ENERGY SOURCE
PRIMARYNET CAPABILITY - MW
EIA PLANT NUMBER
TRANSP. METHODWINTERSUMMER
UNITTYPE
ENERGY SOURCE
ALTERNATE
TRANSP. METHOD
Claimed for Capability NRGPM 355 BRANFORD 10 GT 15.840 20.950 JF TK 540 01/01/1969 NRGPM 370 COS COB 10 GT 19.497 24.397 JF TK 542 09/01/1969 NRGPM 371 COS COB 11 GT 16.941 21.841 JF TK 542 01/01/1969 NRGPM 372 COS COB 12 GT 18.461 23.361 JF TK 542 01/01/1969 NRGPM 14157 COS COB 13 GT 19.201 24.201 JF TK 05/29/2008 NRGPM 14158 COS COB 14 GT 19.603 23.478 JF TK 05/29/2008 NRGPM 396 DEVON 10 GT 14.407 19.186 JF WA DFO WA 544 04/01/1988 NRGPM 397 DEVON 11 GT 29.299 38.819 JF PL NG TK 544 10/01/1996 NRGPM 398 DEVON 12 GT 29.227 38.437 JF PL NG TK 544 10/01/1996 NRGPM 399 DEVON 13 GT 29.967 38.967 JF PL NG TK 544 10/01/1996 NRGPM 400 DEVON 14 GT 29.704 40.274 JF PL NG TK 544 10/01/1996 NRGPM 420 FRANKLIN DRIVE 10 GT 15.417 20.527 JF TK 561 11/01/1968 NRGPM 479 MIDDLETOWN 1 ST 0.000 0.000 RFO WA 562 10/01/1996 NRGPM 478 MIDDLETOWN 10 GT 17.123 22.023 JF TK 562 01/01/1966 NRGPM 480 MIDDLETOWN 2 ST 117.000 120.000 RFO WA NG PL 562 01/01/1958 NRGPM 481 MIDDLETOWN 3 ST 236.000 245.000 RFO WA NG PL 562 01/01/1964 NRGPM 482 MIDDLETOWN 4 ST 400.000 402.000 RFO WA 562 06/01/1973 NRGPM 492 MONTVILLE 10 and 11 IC 5.296 5.354 DFO TK 546 01/01/1967 NRGPM 493 MONTVILLE 5 ST 81.000 81.590 RFO WA NG PL 546 01/01/1954 NRGPM 494 MONTVILLE 6 ST 407.401 409.913 RFO WA 546 07/01/1971 NRGPM 519 NORWALK HARBOR 1 ST 162.000 163.995 RFO WA 548 01/01/1960 NRGPM 521 NORWALK HARBOR 10 (3) GT 11.925 17.125 JF TK 548 10/01/1996 NRGPM 520 NORWALK HARBOR 2 ST 168.000 172.000 RFO WA 548 01/01/1963 NRGPM 577 SOMERSET 6 ST 109.058 108.500 BIT WA 1613 07/01/1959 NRGPM 579 SOMERSET JET 2 GT 17.150 21.816 JF TK 1613 05/01/1971 NRGPM 595 TORRINGTON TERMINAL 10 GT 15.638 20.748 JF TK 565 08/01/1967
NRG Power Marketing LLC

Section 2 - Control Area Capability
NOTES: Appendix A - defines the codes used. Additional information and changes to generating asset Lead Participant since January 1, 2009 may be found in the Endnotes following Section 2.1. Summer and winter capabilities as of January 1, 2009. When an alternate fuel is listed, the unit may not necessarily be fully operable on both fuels. CELT Report - April 2009 Page 50 ISO New England Inc.
LEAD PARTICIPANT ASSET ID AND STATION NAME
COMMERCIAL IN-SERVICE
ENERGY SOURCE
PRIMARYNET CAPABILITY - MW
EIA PLANT NUMBER
TRANSP. METHODWINTERSUMMER
UNITTYPE
ENERGY SOURCE
ALTERNATE
TRANSP. METHOD
Sub-total for NRGPM by Unit Type COAL STEAM 109.058 108.500
GAS/OIL COMBUSTION (GAS) TURBINE 118.197 156.497GAS/OIL STEAM 434.000 446.590
OIL COMBUSTION (GAS) TURBINE 201.203 259.653OIL INTERNAL COMBUSTION 5.296 5.354
OIL STEAM 1137.401 1147.908Total MW Claimed for Capability by NRGPM in the ISO-NE Control 2005.155 2124.502
NRG Power Marketing LLC
Claimed for Capability NSTAR 348 BOOT MILLS HDR 20.000 20.000 WAT 10556 11/01/1985 NSTAR 1050 CHICOPEE HYDRO HDR 2.170 2.170 WAT 50832 05/01/1985 NSTAR 1049 COLLINS HYDRO HDR 1.250 1.250 WAT 52166 12/01/1984 NSTAR 563 SEMASS 1 ST 46.180 50.740 MSW TK DFO 50290 10/01/1988 NSTAR 564 SEMASS 2 ST 20.850 24.320 MSW TK DFO 50290 05/01/1993 NSTAR 1048 WARE HYDRO HDR 0.133 0.514 WAT 50419 03/01/1984 Sub-total for NSTAR by Unit Type
BIO/REFUSE 67.030 75.060HYDRO (DAILY CYCLE - RUN OF RIVER) 23.553 23.934
Total MW Claimed for Capability by NSTAR in the ISO-NE Control 90.583 98.994
NSTAR Electric Company
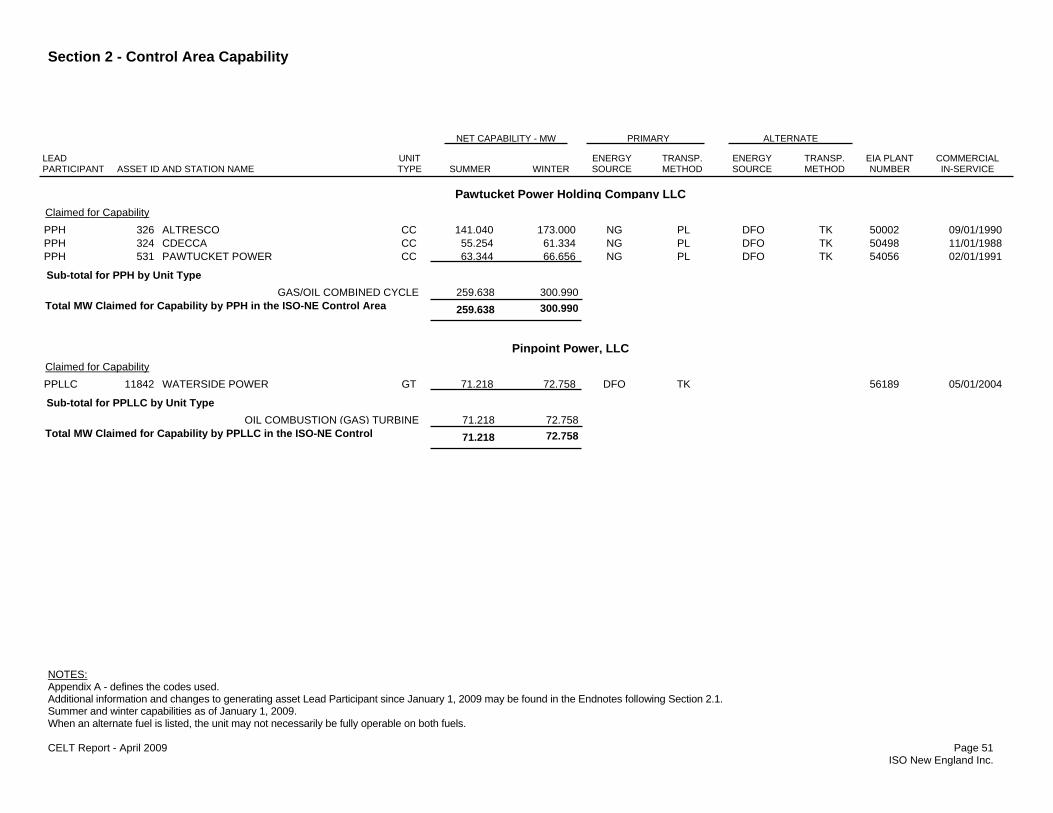
Section 2 - Control Area Capability
NOTES: Appendix A - defines the codes used. Additional information and changes to generating asset Lead Participant since January 1, 2009 may be found in the Endnotes following Section 2.1. Summer and winter capabilities as of January 1, 2009. When an alternate fuel is listed, the unit may not necessarily be fully operable on both fuels. CELT Report - April 2009 Page 51 ISO New England Inc.
LEAD PARTICIPANT ASSET ID AND STATION NAME
COMMERCIAL IN-SERVICE
ENERGY SOURCE
PRIMARYNET CAPABILITY - MW
EIA PLANT NUMBER
TRANSP. METHODWINTERSUMMER
UNITTYPE
ENERGY SOURCE
ALTERNATE
TRANSP. METHOD
Claimed for Capability PPH 326 ALTRESCO CC 141.040 173.000 NG PL DFO TK 50002 09/01/1990 PPH 324 CDECCA CC 55.254 61.334 NG PL DFO TK 50498 11/01/1988 PPH 531 PAWTUCKET POWER CC 63.344 66.656 NG PL DFO TK 54056 02/01/1991 Sub-total for PPH by Unit Type
GAS/OIL COMBINED CYCLE 259.638 300.990Total MW Claimed for Capability by PPH in the ISO-NE Control Area 259.638 300.990
Pawtucket Power Holding Company LLC
Claimed for Capability PPLLC 11842 WATERSIDE POWER GT 71.218 72.758 DFO TK 56189 05/01/2004 Sub-total for PPLLC by Unit Type
OIL COMBUSTION (GAS) TURBINE 71.218 72.758Total MW Claimed for Capability by PPLLC in the ISO-NE Control 71.218 72.758
Pinpoint Power, LLC

Section 2 - Control Area Capability
NOTES: Appendix A - defines the codes used. Additional information and changes to generating asset Lead Participant since January 1, 2009 may be found in the Endnotes following Section 2.1. Summer and winter capabilities as of January 1, 2009. When an alternate fuel is listed, the unit may not necessarily be fully operable on both fuels. CELT Report - April 2009 Page 52 ISO New England Inc.
LEAD PARTICIPANT ASSET ID AND STATION NAME
COMMERCIAL IN-SERVICE
ENERGY SOURCE
PRIMARYNET CAPABILITY - MW
EIA PLANT NUMBER
TRANSP. METHODWINTERSUMMER
UNITTYPE
ENERGY SOURCE
ALTERNATE
TRANSP. METHOD
Claimed for Capability PPLEP 405 ELLSWORTH HYDRO HW 9.097 8.821 WAT 1469 01/01/1919 PPLEP 436 HEMPHILL 1 ST 14.130 14.295 WDS TK 10838 12/01/1987 PPLEP 14695 Orono HDR 0.000 0.000 WAT 12/29/2008 PPLEP 534 PENOBSCOT RIVER HYDRO HDR 21.937 22.070 WAT 55031 01/01/1911 PPLEP 12163 PPL GREAT WORKS - RED SHIELD ST 3.683 1.633 MSW TK 01/24/2007 PPLEP 1376 PPL WALLINGFORD UNIT 1 GT 42.922 48.410 NG PL 55517 12/31/2001 PPLEP 1377 PPL WALLINGFORD UNIT 2 GT 40.129 51.129 NG PL 55517 02/07/2002 PPLEP 1378 PPL WALLINGFORD UNIT 3 GT 42.942 47.837 NG PL 55517 12/31/2001 PPLEP 1379 PPL WALLINGFORD UNIT 4 GT 42.497 47.782 NG PL 55517 01/23/2002 PPLEP 1380 PPL WALLINGFORD UNIT 5 GT 41.154 52.154 NG PL 55517 02/07/2002 Sub-total for PPLEP by Unit Type
BIO/REFUSE 17.813 15.928GAS COMBUSTION (GAS) TURBINE 209.644 247.312
HYDRO (DAILY CYCLE - RUN OF RIVER) 21.937 22.070HYDRO (WEEKLY CYCLE) 9.097 8.821
Total MW Claimed for Capability by PPLEP in the ISO-NE Control 258.491 294.131
PPL EnergyPlus, LLC

Section 2 - Control Area Capability
NOTES: Appendix A - defines the codes used. Additional information and changes to generating asset Lead Participant since January 1, 2009 may be found in the Endnotes following Section 2.1. Summer and winter capabilities as of January 1, 2009. When an alternate fuel is listed, the unit may not necessarily be fully operable on both fuels. CELT Report - April 2009 Page 53 ISO New England Inc.
LEAD PARTICIPANT ASSET ID AND STATION NAME
COMMERCIAL IN-SERVICE
ENERGY SOURCE
PRIMARYNET CAPABILITY - MW
EIA PLANT NUMBER
TRANSP. METHODWINTERSUMMER
UNITTYPE
ENERGY SOURCE
ALTERNATE
TRANSP. METHOD
Claimed for Capability PPLM 13975 CORRIVEAU HYDROELECTRIC LLC HDP 0.073 0.156 WAT 08/10/2007 PPLM 1273 KENNEBEC WATER U5 HDR 0.387 0.320 WAT 54148 03/01/1995 PPLM 1283 LEWISTON U5 HDR 0.640 0.640 WAT 1542 10/01/1990 PPLM 1368 ROCKY GORGE U5 HDR 0.182 0.362 WAT 01/01/1984 PPLM 1267 SPARHAWK HDR 0.000 0.158 WAT 06/01/1985 PPLM 1678 SYSKO GARDNER BROOK U5 HDR 0.014 0.034 WAT 02/01/2002 PPLM 1270 SYSKO STONY BROOK HDR 0.012 0.025 WAT 04/01/2000 PPLM 1271 SYSKO WIGHT BROOK HDR 0.025 0.025 WAT 01/01/1984 Sub-total for PPLM by Unit Type
HYDRO (DAILY CYCLE - PONDAGE) 0.073 0.156HYDRO (DAILY CYCLE - RUN OF RIVER) 1.260 1.564
Total MW Claimed for Capability by PPLM in the ISO-NE Control Area 1.333 1.720
PPL Maine, LLC

Section 2 - Control Area Capability
NOTES: Appendix A - defines the codes used. Additional information and changes to generating asset Lead Participant since January 1, 2009 may be found in the Endnotes following Section 2.1. Summer and winter capabilities as of January 1, 2009. When an alternate fuel is listed, the unit may not necessarily be fully operable on both fuels. CELT Report - April 2009 Page 54 ISO New England Inc.
LEAD PARTICIPANT ASSET ID AND STATION NAME
COMMERCIAL IN-SERVICE
ENERGY SOURCE
PRIMARYNET CAPABILITY - MW
EIA PLANT NUMBER
TRANSP. METHODWINTERSUMMER
UNITTYPE
ENERGY SOURCE
ALTERNATE
TRANSP. METHOD
Claimed for Capability PSEG 339 BRIDGEPORT HARBOR 2 ST 130.495 147.509 RFO WA 568 08/01/1961 PSEG 340 BRIDGEPORT HARBOR 3 ST 383.426 384.984 BIT WA RFO WA 568 08/01/1968 PSEG 341 BRIDGEPORT HARBOR 4 GT 15.414 20.214 JF TK 568 10/01/1967 PSEG 1625 GRANITE RIDGE ENERGY CC 659.862 797.862 NG PL 55170 04/01/2003 PSEG 513 NEW HAVEN HARBOR ST 447.894 454.644 RFO WA NG PL 6156 08/01/1975 Sub-total for PSEG by Unit Type
COAL STEAM 383.426 384.984GAS COMBINED CYCLE 659.862 797.862
GAS/OIL STEAM 447.894 454.644OIL COMBUSTION (GAS) TURBINE 15.414 20.214
OIL STEAM 130.495 147.509Total MW Claimed for Capability by PSEG in the ISO-NE Control Area 1637.091 1805.213
PSEG Energy Resources & Trade LLC
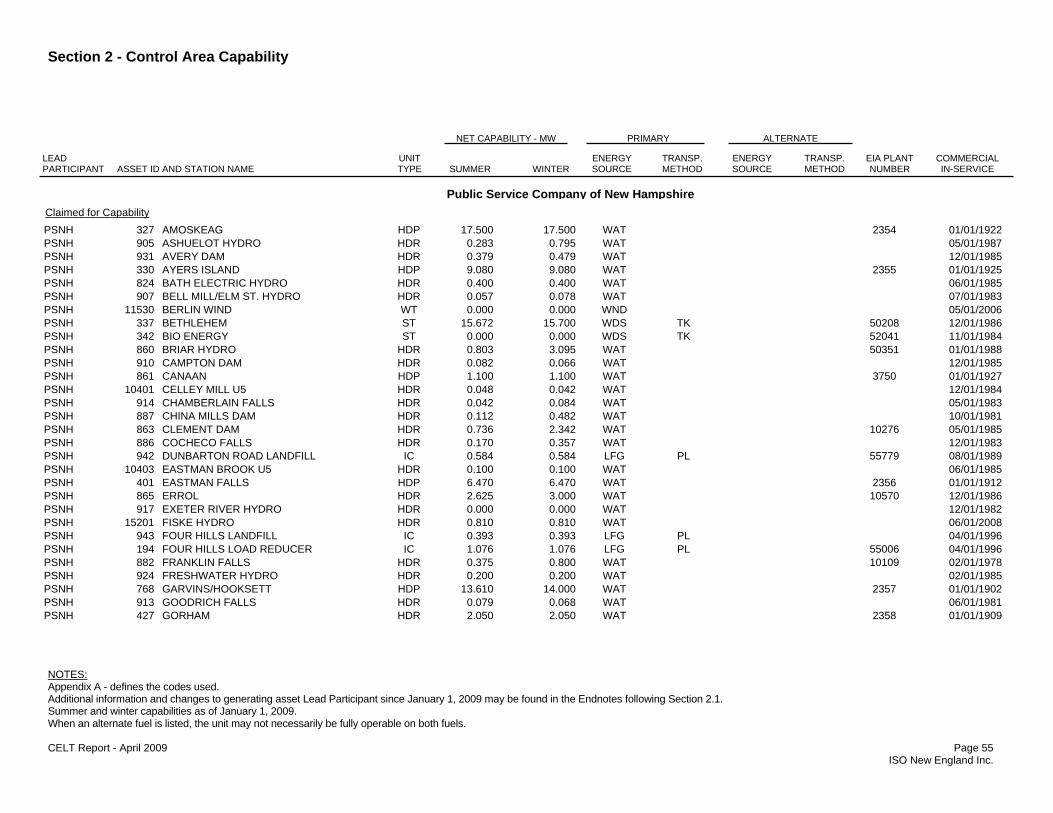
Section 2 - Control Area Capability
NOTES: Appendix A - defines the codes used. Additional information and changes to generating asset Lead Participant since January 1, 2009 may be found in the Endnotes following Section 2.1. Summer and winter capabilities as of January 1, 2009. When an alternate fuel is listed, the unit may not necessarily be fully operable on both fuels. CELT Report - April 2009 Page 55 ISO New England Inc.
LEAD PARTICIPANT ASSET ID AND STATION NAME
COMMERCIAL IN-SERVICE
ENERGY SOURCE
PRIMARYNET CAPABILITY - MW
EIA PLANT NUMBER
TRANSP. METHODWINTERSUMMER
UNITTYPE
ENERGY SOURCE
ALTERNATE
TRANSP. METHOD
Claimed for Capability PSNH 327 AMOSKEAG HDP 17.500 17.500 WAT 2354 01/01/1922 PSNH 905 ASHUELOT HYDRO HDR 0.283 0.795 WAT 05/01/1987 PSNH 931 AVERY DAM HDR 0.379 0.479 WAT 12/01/1985 PSNH 330 AYERS ISLAND HDP 9.080 9.080 WAT 2355 01/01/1925 PSNH 824 BATH ELECTRIC HYDRO HDR 0.400 0.400 WAT 06/01/1985 PSNH 907 BELL MILL/ELM ST. HYDRO HDR 0.057 0.078 WAT 07/01/1983 PSNH 11530 BERLIN WIND WT 0.000 0.000 WND 05/01/2006 PSNH 337 BETHLEHEM ST 15.672 15.700 WDS TK 50208 12/01/1986 PSNH 342 BIO ENERGY ST 0.000 0.000 WDS TK 52041 11/01/1984 PSNH 860 BRIAR HYDRO HDR 0.803 3.095 WAT 50351 01/01/1988 PSNH 910 CAMPTON DAM HDR 0.082 0.066 WAT 12/01/1985 PSNH 861 CANAAN HDP 1.100 1.100 WAT 3750 01/01/1927 PSNH 10401 CELLEY MILL U5 HDR 0.048 0.042 WAT 12/01/1984 PSNH 914 CHAMBERLAIN FALLS HDR 0.042 0.084 WAT 05/01/1983 PSNH 887 CHINA MILLS DAM HDR 0.112 0.482 WAT 10/01/1981 PSNH 863 CLEMENT DAM HDR 0.736 2.342 WAT 10276 05/01/1985 PSNH 886 COCHECO FALLS HDR 0.170 0.357 WAT 12/01/1983 PSNH 942 DUNBARTON ROAD LANDFILL IC 0.584 0.584 LFG PL 55779 08/01/1989 PSNH 10403 EASTMAN BROOK U5 HDR 0.100 0.100 WAT 06/01/1985 PSNH 401 EASTMAN FALLS HDP 6.470 6.470 WAT 2356 01/01/1912 PSNH 865 ERROL HDR 2.625 3.000 WAT 10570 12/01/1986 PSNH 917 EXETER RIVER HYDRO HDR 0.000 0.000 WAT 12/01/1982 PSNH 15201 FISKE HYDRO HDR 0.810 0.810 WAT 06/01/2008 PSNH 943 FOUR HILLS LANDFILL IC 0.393 0.393 LFG PL 04/01/1996 PSNH 194 FOUR HILLS LOAD REDUCER IC 1.076 1.076 LFG PL 55006 04/01/1996 PSNH 882 FRANKLIN FALLS HDR 0.375 0.800 WAT 10109 02/01/1978 PSNH 924 FRESHWATER HYDRO HDR 0.200 0.200 WAT 02/01/1985 PSNH 768 GARVINS/HOOKSETT HDP 13.610 14.000 WAT 2357 01/01/1902 PSNH 913 GOODRICH FALLS HDR 0.079 0.068 WAT 06/01/1981 PSNH 427 GORHAM HDR 2.050 2.050 WAT 2358 01/01/1909
Public Service Company of New Hampshire
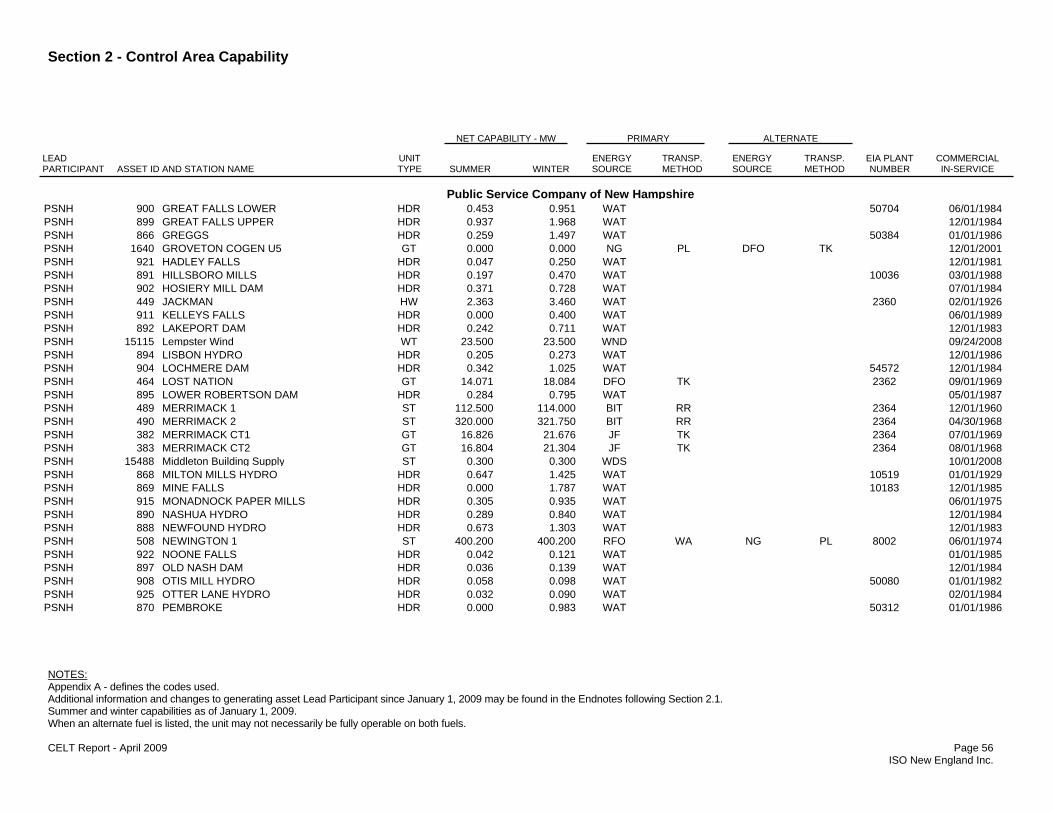
Section 2 - Control Area Capability
NOTES: Appendix A - defines the codes used. Additional information and changes to generating asset Lead Participant since January 1, 2009 may be found in the Endnotes following Section 2.1. Summer and winter capabilities as of January 1, 2009. When an alternate fuel is listed, the unit may not necessarily be fully operable on both fuels. CELT Report - April 2009 Page 56 ISO New England Inc.
LEAD PARTICIPANT ASSET ID AND STATION NAME
COMMERCIAL IN-SERVICE
ENERGY SOURCE
PRIMARYNET CAPABILITY - MW
EIA PLANT NUMBER
TRANSP. METHODWINTERSUMMER
UNITTYPE
ENERGY SOURCE
ALTERNATE
TRANSP. METHOD
PSNH 900 GREAT FALLS LOWER HDR 0.453 0.951 WAT 50704 06/01/1984 PSNH 899 GREAT FALLS UPPER HDR 0.937 1.968 WAT 12/01/1984 PSNH 866 GREGGS HDR 0.259 1.497 WAT 50384 01/01/1986 PSNH 1640 GROVETON COGEN U5 GT 0.000 0.000 NG PL DFO TK 12/01/2001 PSNH 921 HADLEY FALLS HDR 0.047 0.250 WAT 12/01/1981 PSNH 891 HILLSBORO MILLS HDR 0.197 0.470 WAT 10036 03/01/1988 PSNH 902 HOSIERY MILL DAM HDR 0.371 0.728 WAT 07/01/1984 PSNH 449 JACKMAN HW 2.363 3.460 WAT 2360 02/01/1926 PSNH 911 KELLEYS FALLS HDR 0.000 0.400 WAT 06/01/1989 PSNH 892 LAKEPORT DAM HDR 0.242 0.711 WAT 12/01/1983 PSNH 15115 Lempster Wind WT 23.500 23.500 WND 09/24/2008 PSNH 894 LISBON HYDRO HDR 0.205 0.273 WAT 12/01/1986 PSNH 904 LOCHMERE DAM HDR 0.342 1.025 WAT 54572 12/01/1984 PSNH 464 LOST NATION GT 14.071 18.084 DFO TK 2362 09/01/1969 PSNH 895 LOWER ROBERTSON DAM HDR 0.284 0.795 WAT 05/01/1987 PSNH 489 MERRIMACK 1 ST 112.500 114.000 BIT RR 2364 12/01/1960 PSNH 490 MERRIMACK 2 ST 320.000 321.750 BIT RR 2364 04/30/1968 PSNH 382 MERRIMACK CT1 GT 16.826 21.676 JF TK 2364 07/01/1969 PSNH 383 MERRIMACK CT2 GT 16.804 21.304 JF TK 2364 08/01/1968 PSNH 15488 Middleton Building Supply ST 0.300 0.300 WDS 10/01/2008 PSNH 868 MILTON MILLS HYDRO HDR 0.647 1.425 WAT 10519 01/01/1929 PSNH 869 MINE FALLS HDR 0.000 1.787 WAT 10183 12/01/1985 PSNH 915 MONADNOCK PAPER MILLS HDR 0.305 0.935 WAT 06/01/1975 PSNH 890 NASHUA HYDRO HDR 0.289 0.840 WAT 12/01/1984 PSNH 888 NEWFOUND HYDRO HDR 0.673 1.303 WAT 12/01/1983 PSNH 508 NEWINGTON 1 ST 400.200 400.200 RFO WA NG PL 8002 06/01/1974 PSNH 922 NOONE FALLS HDR 0.042 0.121 WAT 01/01/1985 PSNH 897 OLD NASH DAM HDR 0.036 0.139 WAT 12/01/1984 PSNH 908 OTIS MILL HYDRO HDR 0.058 0.098 WAT 50080 01/01/1982 PSNH 925 OTTER LANE HYDRO HDR 0.032 0.090 WAT 02/01/1984 PSNH 870 PEMBROKE HDR 0.000 0.983 WAT 50312 01/01/1986
Public Service Company of New Hampshire

Section 2 - Control Area Capability
NOTES: Appendix A - defines the codes used. Additional information and changes to generating asset Lead Participant since January 1, 2009 may be found in the Endnotes following Section 2.1. Summer and winter capabilities as of January 1, 2009. When an alternate fuel is listed, the unit may not necessarily be fully operable on both fuels. CELT Report - April 2009 Page 57 ISO New England Inc.
LEAD PARTICIPANT ASSET ID AND STATION NAME
COMMERCIAL IN-SERVICE
ENERGY SOURCE
PRIMARYNET CAPABILITY - MW
EIA PLANT NUMBER
TRANSP. METHODWINTERSUMMER
UNITTYPE
ENERGY SOURCE
ALTERNATE
TRANSP. METHOD
PSNH 871 PENNACOOK FALLS LOWER HDR 0.878 2.994 WAT 50351 11/01/1984 PSNH 872 PENNACOOK FALLS UPPER HDR 0.686 2.340 WAT 50414 12/01/1986 PSNH 926 PETERBOROUGH LOWER HYDRO HDR 0.284 0.284 WAT 02/01/1989 PSNH 941 PETERBOROUGH UPPER HYDRO HDR 0.400 0.400 WAT 12/01/1990 PSNH 10402 PETTYBORO HYDRO U5 HDR 0.000 0.000 WAT 05/09/1999 PSNH 875 RIVER BEND HDR 0.564 1.790 WAT 02/01/1986 PSNH 906 ROLLINSFORD HYDRO HDR 1.500 1.500 WAT 54418 11/01/1980 PSNH 928 SALMON BROOK STATION 3 HDR 0.093 0.250 WAT 12/01/1985 PSNH 883 SALMON FALLS HYDRO HDR 0.327 0.687 WAT 50702 11/01/1983 PSNH 556 SCHILLER 4 ST 47.500 48.000 BIT WA RFO WA 2367 04/01/1952 PSNH 557 SCHILLER 5 ST 43.082 45.816 WDS WA RFO WA 2367 05/01/1955 PSNH 558 SCHILLER 6 ST 47.938 48.580 BIT WA RFO WA 2367 07/01/1957 PSNH 559 SCHILLER CT 1 GT 17.621 19.500 JF TK NG PL 2367 11/01/1970
PSNH 767 SES CONCORD ST 12.513 12.761 MSW TK RFO TK 50873 05/01/1989 PSNH 570 SMITH HDR 13.066 16.078 WAT 2368 01/01/1948 PSNH 909 STEELS POND HYDRO HDR 0.187 0.663 WAT 12/01/1984 PSNH 885 STEVENS MILL HDR 0.225 0.225 WAT 55861 03/01/1980 PSNH 898 SUGAR RIVER HYDRO HDR 0.054 0.150 WAT 09/01/1986 PSNH 889 SUNAPEE HYDRO HDR 0.109 0.331 WAT 02/01/1985 PSNH 912 SUNNYBROOK HYDRO 1 HDR 0.015 0.015 WAT 05/01/1981 PSNH 935 SUNNYBROOK HYDRO 2 HDR 0.050 0.044 WAT 12/01/1982 PSNH 884 SWANS FALLS HDR 0.410 0.410 WAT 1518 10/01/1998 PSNH 592 TAMWORTH ST 21.000 21.000 WDS TK 50739 01/01/1988 PSNH 253 TURNKEY LANDFILL IC 3.143 3.143 LFG PL 54663 03/01/1992 PSNH 901 WATERLOOM FALLS HDR 0.039 0.066 WAT 10/01/1981 PSNH 932 WATSON DAM HDR 0.144 0.250 WAT 01/01/1985 PSNH 1641 WAUSAU COGEN U5 GT 0.412 0.412 NG PL 12/01/2001 PSNH 893 WEST HOPKINTON HYDRO HDR 0.549 1.078 WAT 54384 11/01/1982 PSNH 933 WESTON DAM HDR 0.268 0.347 WAT 1509 02/01/1987 PSNH 10404 WHEELABRATOR CLAREMONT U5 ST 4.888 4.888 MSW 50872 03/01/2004 PSNH 619 WHITE LAKE JET GT 17.447 22.397 JF TK 2369 08/01/1968
Public Service Company of New Hampshire

Section 2 - Control Area Capability
NOTES: Appendix A - defines the codes used. Additional information and changes to generating asset Lead Participant since January 1, 2009 may be found in the Endnotes following Section 2.1. Summer and winter capabilities as of January 1, 2009. When an alternate fuel is listed, the unit may not necessarily be fully operable on both fuels. CELT Report - April 2009 Page 58 ISO New England Inc.
LEAD PARTICIPANT ASSET ID AND STATION NAME
COMMERCIAL IN-SERVICE
ENERGY SOURCE
PRIMARYNET CAPABILITY - MW
EIA PLANT NUMBER
TRANSP. METHODWINTERSUMMER
UNITTYPE
ENERGY SOURCE
ALTERNATE
TRANSP. METHOD
PSNH 903 WYANDOTTE HYDRO HDR 0.084 0.150 WAT 05/01/1983 PSNH 14919 ZBE-001 GT 0.000 0.000 WDS TK DFO 03/01/2008 Sub-total for PSNH by Unit Type
BIO/REFUSE 102.651 105.661COAL STEAM 527.938 532.330
GAS COMBUSTION (GAS) TURBINE 0.412 0.412GAS/OIL COMBUSTION (GAS) TURBINE 17.621 19.500
GAS/OIL STEAM 400.200 400.200HYDRO (DAILY CYCLE - PONDAGE) 47.760 48.150
HYDRO (DAILY CYCLE - RUN OF RIVER) 34.702 62.089HYDRO (WEEKLY CYCLE) 2.363 3.460
OIL COMBUSTION (GAS) TURBINE 65.148 83.461WIND TURBINE 23.500 23.500
Total MW Claimed for Capability by PSNH in the ISO-NE Control 1222.295 1278.763
Public Service Company of New Hampshire

Section 2 - Control Area Capability
NOTES: Appendix A - defines the codes used. Additional information and changes to generating asset Lead Participant since January 1, 2009 may be found in the Endnotes following Section 2.1. Summer and winter capabilities as of January 1, 2009. When an alternate fuel is listed, the unit may not necessarily be fully operable on both fuels. CELT Report - April 2009 Page 59 ISO New England Inc.
LEAD PARTICIPANT ASSET ID AND STATION NAME
COMMERCIAL IN-SERVICE
ENERGY SOURCE
PRIMARYNET CAPABILITY - MW
EIA PLANT NUMBER
TRANSP. METHODWINTERSUMMER
UNITTYPE
ENERGY SOURCE
ALTERNATE
TRANSP. METHOD
Claimed for Capability RMHP 2278 BARKER LOWER HYDRO HDR 0.390 0.897 WAT 10728 04/01/1980 RMHP 2279 BARKER UPPER HYDRO HDR 0.219 0.554 WAT 52171 07/01/1987 RMHP 2281 BROWNS MILL HYDRO HDR 0.222 0.476 WAT 50688 07/01/1983 RMHP 2282 DAMARISCOTTA HYDRO HDR 0.005 0.428 WAT 2282 03/01/1984 RMHP 2283 EUSTIS HYDRO HDR 0.135 0.250 WAT 50688 03/01/1984 RMHP 2284 GARDINER HYDRO HDR 0.613 0.980 WAT 50688 07/01/1983 RMHP 1117 GREAT WORKS COMPOSITE HDR 0.000 0.371 WAT 03/01/1984 RMHP 2285 GREENVILLE HYDRO HDR 0.044 0.100 WAT 50688 03/01/1984 RMHP 2287 MECHANIC FALLS HYDRO HDR 0.000 0.455 WAT 2287 11/01/1984 RMHP 2288 NORWAY HYDRO HDR 0.000 0.000 WAT 50688 05/01/1985 RMHP 2290 PITTSFIELD HYDRO HDR 0.877 0.725 WAT 2290 03/01/1984 RMHP 2292 YORK HYDRO HDR 0.878 1.200 WAT 50688 03/01/1984 Sub-total for RMHP by Unit Type
HYDRO (DAILY CYCLE - RUN OF RIVER) 3.383 6.436Total MW Claimed for Capability by RMHP in the ISO-NE Control 3.383 6.436
Ridgewood Maine Hydro Partners, L.P.
Claimed for Capability RRIG 10366 RRIG EXPANSION PHASE 1 IC 2.400 2.400 LFG PL 50365 02/18/2004 RRIG 10959 RRIG EXPANSION PHASE 2 IC 5.204 6.018 LFG PL 50365 06/01/2005 Sub-total for RRIG by Unit Type
BIO/REFUSE 7.604 8.418Total MW Claimed for Capability by RRIG in the ISO-NE Control Area 7.604 8.418
Ridgewood RI Generation, LLC (Johnston Landfill Expansion)
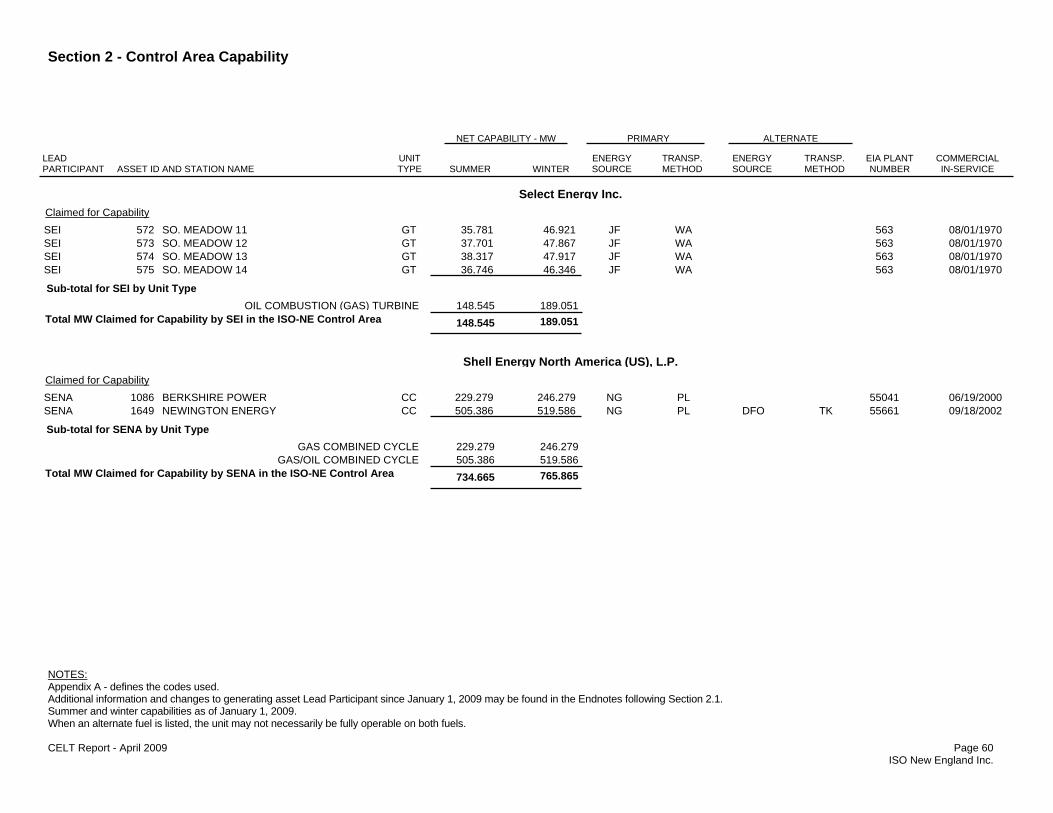
Section 2 - Control Area Capability
NOTES: Appendix A - defines the codes used. Additional information and changes to generating asset Lead Participant since January 1, 2009 may be found in the Endnotes following Section 2.1. Summer and winter capabilities as of January 1, 2009. When an alternate fuel is listed, the unit may not necessarily be fully operable on both fuels. CELT Report - April 2009 Page 60 ISO New England Inc.
LEAD PARTICIPANT ASSET ID AND STATION NAME
COMMERCIAL IN-SERVICE
ENERGY SOURCE
PRIMARYNET CAPABILITY - MW
EIA PLANT NUMBER
TRANSP. METHODWINTERSUMMER
UNITTYPE
ENERGY SOURCE
ALTERNATE
TRANSP. METHOD
Claimed for Capability SEI 572 SO. MEADOW 11 GT 35.781 46.921 JF WA 563 08/01/1970 SEI 573 SO. MEADOW 12 GT 37.701 47.867 JF WA 563 08/01/1970 SEI 574 SO. MEADOW 13 GT 38.317 47.917 JF WA 563 08/01/1970 SEI 575 SO. MEADOW 14 GT 36.746 46.346 JF WA 563 08/01/1970 Sub-total for SEI by Unit Type
OIL COMBUSTION (GAS) TURBINE 148.545 189.051Total MW Claimed for Capability by SEI in the ISO-NE Control Area 148.545 189.051
Select Energy Inc.
Claimed for Capability SENA 1086 BERKSHIRE POWER CC 229.279 246.279 NG PL 55041 06/19/2000 SENA 1649 NEWINGTON ENERGY CC 505.386 519.586 NG PL DFO TK 55661 09/18/2002 Sub-total for SENA by Unit Type
GAS COMBINED CYCLE 229.279 246.279GAS/OIL COMBINED CYCLE 505.386 519.586
Total MW Claimed for Capability by SENA in the ISO-NE Control Area 734.665 765.865
Shell Energy North America (US), L.P.

Section 2 - Control Area Capability
NOTES: Appendix A - defines the codes used. Additional information and changes to generating asset Lead Participant since January 1, 2009 may be found in the Endnotes following Section 2.1. Summer and winter capabilities as of January 1, 2009. When an alternate fuel is listed, the unit may not necessarily be fully operable on both fuels. CELT Report - April 2009 Page 61 ISO New England Inc.
LEAD PARTICIPANT ASSET ID AND STATION NAME
COMMERCIAL IN-SERVICE
ENERGY SOURCE
PRIMARYNET CAPABILITY - MW
EIA PLANT NUMBER
TRANSP. METHODWINTERSUMMER
UNITTYPE
ENERGY SOURCE
ALTERNATE
TRANSP. METHOD
Claimed for Capability SELP 1079 SHREWSBURY DIESEL # 4 IC 2.750 2.750 DFO TK 6125 12/01/1975 SELP 1076 SHREWSBURY DIESEL #1 IC 2.750 2.750 DFO TK 6125 11/01/1969 SELP 1077 SHREWSBURY DIESEL #2 IC 2.750 2.750 DFO TK 6125 11/01/1969 SELP 1078 SHREWSBURY DIESEL #3 IC 2.750 2.750 DFO TK 6125 12/01/1975 SELP 1080 SHREWSBURY DIESEL #5 IC 2.750 2.750 DFO TK 6125 05/01/1978 Sub-total for SELP by Unit Type
OIL INTERNAL COMBUSTION 13.750 13.750Total MW Claimed for Capability by SELP in the ISO-NE Control Area 13.750 13.750
Shrewsbury Electric Light Plant
Claimed for Capability SMED 951 BALTIC MILLS - QF HDR 0.066 0.075 WAT 02/01/1981 SMED 919 HOPKINTON HYDRO HDR 0.229 0.250 WAT 12/01/1984 SMED 806 MECHANICSVILLE HDR 0.054 0.267 WAT 09/01/1995 SMED 793 METHUEN HYDRO HDR 0.000 0.273 WAT 08/01/1988 SMED 858 STERLING DIESELS IC 0.330 0.330 DFO TK 10570 08/01/1987 Sub-total for SMED by Unit Type
HYDRO (DAILY CYCLE - RUN OF RIVER) 0.349 0.865OIL INTERNAL COMBUSTION 0.330 0.330
Total MW Claimed for Capability by SMED in the ISO-NE Control 0.679 1.195
Sterling Municipal Electric Light Department
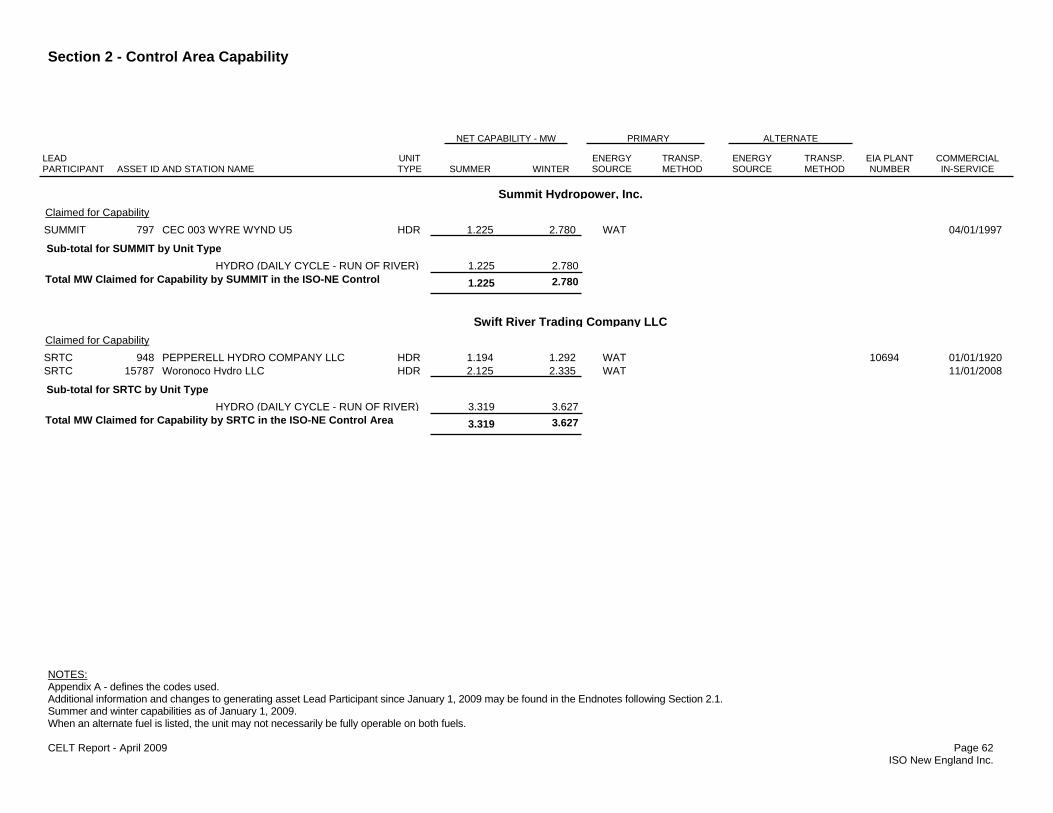
Section 2 - Control Area Capability
NOTES: Appendix A - defines the codes used. Additional information and changes to generating asset Lead Participant since January 1, 2009 may be found in the Endnotes following Section 2.1. Summer and winter capabilities as of January 1, 2009. When an alternate fuel is listed, the unit may not necessarily be fully operable on both fuels. CELT Report - April 2009 Page 62 ISO New England Inc.
LEAD PARTICIPANT ASSET ID AND STATION NAME
COMMERCIAL IN-SERVICE
ENERGY SOURCE
PRIMARYNET CAPABILITY - MW
EIA PLANT NUMBER
TRANSP. METHODWINTERSUMMER
UNITTYPE
ENERGY SOURCE
ALTERNATE
TRANSP. METHOD
Claimed for Capability SUMMIT 797 CEC 003 WYRE WYND U5 HDR 1.225 2.780 WAT 04/01/1997 Sub-total for SUMMIT by Unit Type
HYDRO (DAILY CYCLE - RUN OF RIVER) 1.225 2.780Total MW Claimed for Capability by SUMMIT in the ISO-NE Control 1.225 2.780
Summit Hydropower, Inc.
Claimed for Capability SRTC 948 PEPPERELL HYDRO COMPANY LLC HDR 1.194 1.292 WAT 10694 01/01/1920 SRTC 15787 Woronoco Hydro LLC HDR 2.125 2.335 WAT 11/01/2008 Sub-total for SRTC by Unit Type
HYDRO (DAILY CYCLE - RUN OF RIVER) 3.319 3.627Total MW Claimed for Capability by SRTC in the ISO-NE Control Area 3.319 3.627
Swift River Trading Company LLC
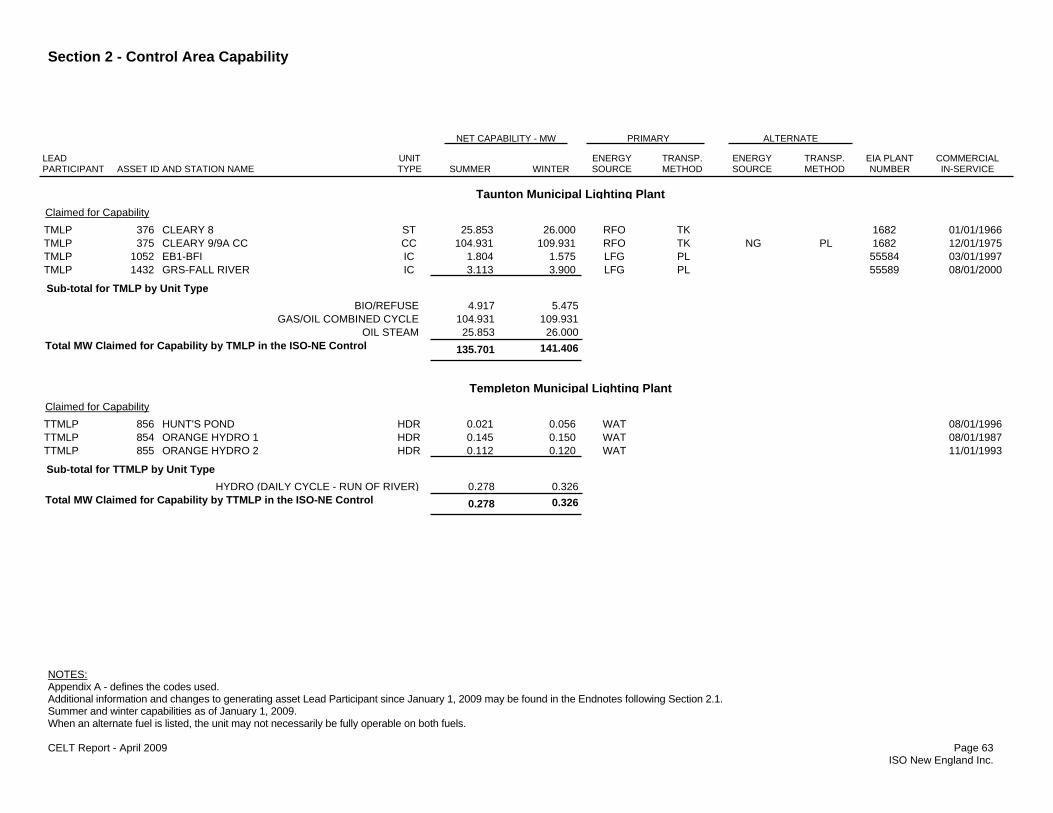
Section 2 - Control Area Capability
NOTES: Appendix A - defines the codes used. Additional information and changes to generating asset Lead Participant since January 1, 2009 may be found in the Endnotes following Section 2.1. Summer and winter capabilities as of January 1, 2009. When an alternate fuel is listed, the unit may not necessarily be fully operable on both fuels. CELT Report - April 2009 Page 63 ISO New England Inc.
LEAD PARTICIPANT ASSET ID AND STATION NAME
COMMERCIAL IN-SERVICE
ENERGY SOURCE
PRIMARYNET CAPABILITY - MW
EIA PLANT NUMBER
TRANSP. METHODWINTERSUMMER
UNITTYPE
ENERGY SOURCE
ALTERNATE
TRANSP. METHOD
Claimed for Capability TMLP 376 CLEARY 8 ST 25.853 26.000 RFO TK 1682 01/01/1966 TMLP 375 CLEARY 9/9A CC CC 104.931 109.931 RFO TK NG PL 1682 12/01/1975 TMLP 1052 EB1-BFI IC 1.804 1.575 LFG PL 55584 03/01/1997 TMLP 1432 GRS-FALL RIVER IC 3.113 3.900 LFG PL 55589 08/01/2000 Sub-total for TMLP by Unit Type
BIO/REFUSE 4.917 5.475GAS/OIL COMBINED CYCLE 104.931 109.931
OIL STEAM 25.853 26.000Total MW Claimed for Capability by TMLP in the ISO-NE Control 135.701 141.406
Taunton Municipal Lighting Plant
Claimed for Capability TTMLP 856 HUNT'S POND HDR 0.021 0.056 WAT 08/01/1996 TTMLP 854 ORANGE HYDRO 1 HDR 0.145 0.150 WAT 08/01/1987 TTMLP 855 ORANGE HYDRO 2 HDR 0.112 0.120 WAT 11/01/1993 Sub-total for TTMLP by Unit Type
HYDRO (DAILY CYCLE - RUN OF RIVER) 0.278 0.326Total MW Claimed for Capability by TTMLP in the ISO-NE Control 0.278 0.326
Templeton Municipal Lighting Plant

Section 2 - Control Area Capability
NOTES: Appendix A - defines the codes used. Additional information and changes to generating asset Lead Participant since January 1, 2009 may be found in the Endnotes following Section 2.1. Summer and winter capabilities as of January 1, 2009. When an alternate fuel is listed, the unit may not necessarily be fully operable on both fuels. CELT Report - April 2009 Page 64 ISO New England Inc.
LEAD PARTICIPANT ASSET ID AND STATION NAME
COMMERCIAL IN-SERVICE
ENERGY SOURCE
PRIMARYNET CAPABILITY - MW
EIA PLANT NUMBER
TRANSP. METHODWINTERSUMMER
UNITTYPE
ENERGY SOURCE
ALTERNATE
TRANSP. METHOD
Claimed for Capability TCPM 335 BELLOWS FALLS HDP 48.540 48.540 WAT 3745 01/01/1928 TCPM 380 COMERFORD HW 144.884 143.802 WAT 2349 01/01/1930 TCPM 465 DEERFIELD 2/LWR DRFIELD HDP 19.500 19.500 WAT 6047 01/01/1912 TCPM 393 DEERFIELD 5 HDP 13.990 13.990 WAT 1620 10/01/1974 TCPM 435 HARRIMAN HW 41.135 40.794 WAT 3746 01/01/1924 TCPM 1061 MASCOMA HYDRO HDR 0.259 0.754 WAT 54471 02/01/1989 TCPM 473 MCINDOES HDP 10.630 10.630 WAT 6483 01/01/1931 TCPM 496 MOORE HW 194.500 196.751 WAT 2351 01/01/1956 TCPM 528 OCEAN ST PWR GT1/GT2/ST1 CC 270.901 316.901 NG PL 51030 12/31/1990 TCPM 529 OCEAN ST PWR GT3/GT4/ST2 CC 270.180 318.180 NG PL 54324 10/01/1991 TCPM 561 SEARSBURG HDR 4.960 4.960 WAT 6529 03/01/1922 TCPM 567 SHERMAN HW 6.334 6.237 WAT 6012 12/01/1926 TCPM 1302 TCPMCMPAGF GEN1 U5 IC 0.000 0.000 OBG PL 50081 06/01/1983 TCPM 599 VERNON HDP 36.790 36.790 WAT 2352 01/01/1909 TCPM 620 WILDER HW 41.160 41.337 WAT 2353 01/01/1950 Sub-total for TCPM by Unit Type
BIO/REFUSE 0.000 0.000GAS COMBINED CYCLE 541.081 635.081
HYDRO (DAILY CYCLE - PONDAGE) 129.450 129.450HYDRO (DAILY CYCLE - RUN OF RIVER) 5.219 5.714
HYDRO (WEEKLY CYCLE) 428.013 428.921Total MW Claimed for Capability by TCPM in the ISO-NE Control 1103.763 1199.166
TransCanada Power Marketing, Ltd.

Section 2 - Control Area Capability
NOTES: Appendix A - defines the codes used. Additional information and changes to generating asset Lead Participant since January 1, 2009 may be found in the Endnotes following Section 2.1. Summer and winter capabilities as of January 1, 2009. When an alternate fuel is listed, the unit may not necessarily be fully operable on both fuels. CELT Report - April 2009 Page 65 ISO New England Inc.
LEAD PARTICIPANT ASSET ID AND STATION NAME
COMMERCIAL IN-SERVICE
ENERGY SOURCE
PRIMARYNET CAPABILITY - MW
EIA PLANT NUMBER
TRANSP. METHODWINTERSUMMER
UNITTYPE
ENERGY SOURCE
ALTERNATE
TRANSP. METHOD
Claimed for Capability UI 880 MCCALLUM ENTERPRISES HDR 0.000 0.000 WAT 10063 05/01/1988 UI 881 SHELTON LANDFILL ST 0.000 0.000 LFG PL 54336 06/01/1995 Sub-total for UI by Unit Type
BIO/REFUSE 0.000 0.000HYDRO (DAILY CYCLE - RUN OF RIVER) 0.000 0.000
Total MW Claimed for Capability by UI in the ISO-NE Control Area 0.000 0.000
United Illuminating Company, The
Claimed for Capability UNITIL-ES 973 CONCORD STEAM ST 0.000 0.354 WDS TK 50873 10/01/1986 Sub-total for UNITIL-ES by Unit Type
BIO/REFUSE 0.000 0.354Total MW Claimed for Capability by UNITIL-ES in the ISO-NE Control 0.000 0.354
Unitil Energy Systems, Inc.
Claimed for Capability VEC 12180 BERKSHIRE COW POWER IC 0.500 0.500 OBG TK 12/06/2006 VEC 14382 ETHAN ALLEN CO-GEN 1 GT 0.299 0.299 LFG 11/07/2007 VEC 15465 Neighborhood Energy, LLC IC 0.000 0.000 OBG PL 10/01/2008 Sub-total for VEC by Unit Type
BIO/REFUSE 0.799 0.799Total MW Claimed for Capability by VEC in the ISO-NE Control Area 0.799 0.799
Vermont Electric Cooperative

Section 2 - Control Area Capability
NOTES: Appendix A - defines the codes used. Additional information and changes to generating asset Lead Participant since January 1, 2009 may be found in the Endnotes following Section 2.1. Summer and winter capabilities as of January 1, 2009. When an alternate fuel is listed, the unit may not necessarily be fully operable on both fuels. CELT Report - April 2009 Page 66 ISO New England Inc.
LEAD PARTICIPANT ASSET ID AND STATION NAME
COMMERCIAL IN-SERVICE
ENERGY SOURCE
PRIMARYNET CAPABILITY - MW
EIA PLANT NUMBER
TRANSP. METHODWINTERSUMMER
UNITTYPE
ENERGY SOURCE
ALTERNATE
TRANSP. METHOD
Claimed for Capability VELCO 2431 DODGE FALLS-NEW HDR 5.000 5.000 WAT 10526 11/01/1990 VELCO 2433 RYEGATE 1-NEW ST 20.500 20.600 WDS TK 51026 11/01/1992 VELCO 565 SHELDON SPRINGS HDR 14.832 26.380 WAT 10494 05/01/1988 VELCO 622 WINOOSKI 1 HDR 7.300 7.300 WAT 54355 04/01/1993 Sub-total for VELCO by Unit Type
BIO/REFUSE 20.500 20.600HYDRO (DAILY CYCLE - RUN OF RIVER) 27.132 38.680
Total MW Claimed for Capability by VELCO in the ISO-NE Control 47.632 59.280
Vermont Electric Power Company, Inc.
Claimed for Capability VMC 2430 BELDENS-NEW HDR 3.077 5.700 WAT 6451 01/01/1980 VMC 832 CENTER RUTLAND HDR 0.330 0.330 WAT 6453 08/01/1901 VMC 415 FLORENCE 1 CG GT 3.024 4.044 DFO TK WA 7337 09/01/1992 VMC 416 FLORENCE 2 CG GT 2.924 3.944 DFO TK WA 7337 09/01/1992 VMC 2432 HUNTINGTON FALLS-NEW HDR 4.184 5.700 WAT 50713 11/01/1988 VMC 541 PROCTOR HDR 6.650 6.650 WAT 6450 01/01/1980 Sub-total for VMC by Unit Type
HYDRO (DAILY CYCLE - RUN OF RIVER) 14.241 18.380OIL COMBUSTION (GAS) TURBINE 5.948 7.988
Total MW Claimed for Capability by VMC in the ISO-NE Control Area 20.189 26.368
Vermont Marble Company
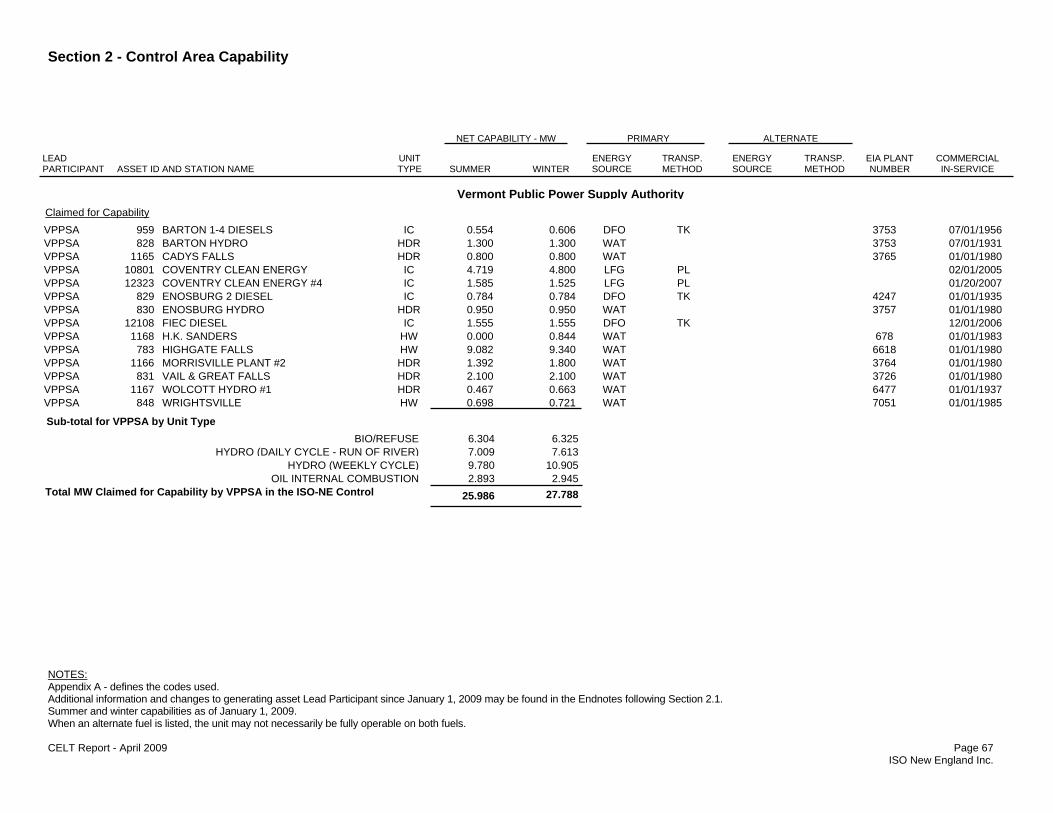
Section 2 - Control Area Capability
NOTES: Appendix A - defines the codes used. Additional information and changes to generating asset Lead Participant since January 1, 2009 may be found in the Endnotes following Section 2.1. Summer and winter capabilities as of January 1, 2009. When an alternate fuel is listed, the unit may not necessarily be fully operable on both fuels. CELT Report - April 2009 Page 67 ISO New England Inc.
LEAD PARTICIPANT ASSET ID AND STATION NAME
COMMERCIAL IN-SERVICE
ENERGY SOURCE
PRIMARYNET CAPABILITY - MW
EIA PLANT NUMBER
TRANSP. METHODWINTERSUMMER
UNITTYPE
ENERGY SOURCE
ALTERNATE
TRANSP. METHOD
Claimed for Capability VPPSA 959 BARTON 1-4 DIESELS IC 0.554 0.606 DFO TK 3753 07/01/1956 VPPSA 828 BARTON HYDRO HDR 1.300 1.300 WAT 3753 07/01/1931 VPPSA 1165 CADYS FALLS HDR 0.800 0.800 WAT 3765 01/01/1980 VPPSA 10801 COVENTRY CLEAN ENERGY IC 4.719 4.800 LFG PL 02/01/2005 VPPSA 12323 COVENTRY CLEAN ENERGY #4 IC 1.585 1.525 LFG PL 01/20/2007 VPPSA 829 ENOSBURG 2 DIESEL IC 0.784 0.784 DFO TK 4247 01/01/1935 VPPSA 830 ENOSBURG HYDRO HDR 0.950 0.950 WAT 3757 01/01/1980 VPPSA 12108 FIEC DIESEL IC 1.555 1.555 DFO TK 12/01/2006 VPPSA 1168 H.K. SANDERS HW 0.000 0.844 WAT 678 01/01/1983 VPPSA 783 HIGHGATE FALLS HW 9.082 9.340 WAT 6618 01/01/1980 VPPSA 1166 MORRISVILLE PLANT #2 HDR 1.392 1.800 WAT 3764 01/01/1980 VPPSA 831 VAIL & GREAT FALLS HDR 2.100 2.100 WAT 3726 01/01/1980 VPPSA 1167 WOLCOTT HYDRO #1 HDR 0.467 0.663 WAT 6477 01/01/1937 VPPSA 848 WRIGHTSVILLE HW 0.698 0.721 WAT 7051 01/01/1985 Sub-total for VPPSA by Unit Type
BIO/REFUSE 6.304 6.325HYDRO (DAILY CYCLE - RUN OF RIVER) 7.009 7.613
HYDRO (WEEKLY CYCLE) 9.780 10.905OIL INTERNAL COMBUSTION 2.893 2.945
Total MW Claimed for Capability by VPPSA in the ISO-NE Control 25.986 27.788
Vermont Public Power Supply Authority

Section 2 - Control Area Capability
NOTES: Appendix A - defines the codes used. Additional information and changes to generating asset Lead Participant since January 1, 2009 may be found in the Endnotes following Section 2.1. Summer and winter capabilities as of January 1, 2009. When an alternate fuel is listed, the unit may not necessarily be fully operable on both fuels. CELT Report - April 2009 Page 68 ISO New England Inc.
LEAD PARTICIPANT ASSET ID AND STATION NAME
COMMERCIAL IN-SERVICE
ENERGY SOURCE
PRIMARYNET CAPABILITY - MW
EIA PLANT NUMBER
TRANSP. METHODWINTERSUMMER
UNITTYPE
ENERGY SOURCE
ALTERNATE
TRANSP. METHOD
Claimed for Capability WBMLP 857 OAKDALE HYDRO HDR 3.200 3.200 WAT 10824 07/01/1994 Sub-total for WBMLP by Unit Type
HYDRO (DAILY CYCLE - RUN OF RIVER) 3.200 3.200Total MW Claimed for Capability by WBMLP in the ISO-NE Control 3.200 3.200
West Boylston Municipal Light
Claimed for Capability WMECO 2425 SPRINGFIELD REFUSE-NEW ST 6.000 6.000 MSW TK RFO TK 8100 09/01/1988 Sub-total for WMECO by Unit Type
BIO/REFUSE 6.000 6.000Total MW Claimed for Capability by WMECO in the ISO-NE Control 6.000 6.000
Western Massachusetts Electric Company
Claimed for Capability WGED 10451 WESTFIELD #1 U5 IC 0.121 0.244 OBG PL 03/01/2004 Sub-total for WGED by Unit Type
BIO/REFUSE 0.121 0.244Total MW Claimed for Capability by WGED in the ISO-NE Control 0.121 0.244
Westfield Gas and Electric Light Department
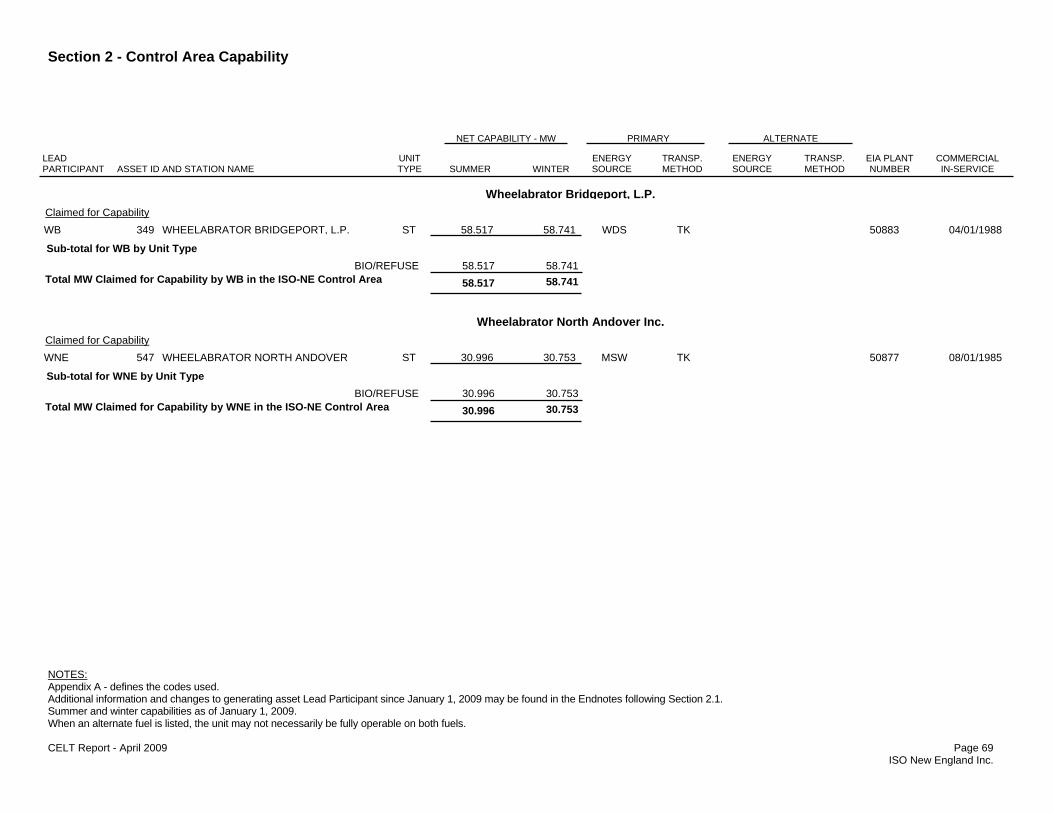
Section 2 - Control Area Capability
NOTES: Appendix A - defines the codes used. Additional information and changes to generating asset Lead Participant since January 1, 2009 may be found in the Endnotes following Section 2.1. Summer and winter capabilities as of January 1, 2009. When an alternate fuel is listed, the unit may not necessarily be fully operable on both fuels. CELT Report - April 2009 Page 69 ISO New England Inc.
LEAD PARTICIPANT ASSET ID AND STATION NAME
COMMERCIAL IN-SERVICE
ENERGY SOURCE
PRIMARYNET CAPABILITY - MW
EIA PLANT NUMBER
TRANSP. METHODWINTERSUMMER
UNITTYPE
ENERGY SOURCE
ALTERNATE
TRANSP. METHOD
Claimed for Capability WB 349 WHEELABRATOR BRIDGEPORT, L.P. ST 58.517 58.741 WDS TK 50883 04/01/1988 Sub-total for WB by Unit Type
BIO/REFUSE 58.517 58.741Total MW Claimed for Capability by WB in the ISO-NE Control Area 58.517 58.741
Wheelabrator Bridgeport, L.P.
Claimed for Capability WNE 547 WHEELABRATOR NORTH ANDOVER ST 30.996 30.753 MSW TK 50877 08/01/1985 Sub-total for WNE by Unit Type
BIO/REFUSE 30.996 30.753Total MW Claimed for Capability by WNE in the ISO-NE Control Area 30.996 30.753
Wheelabrator North Andover Inc.
NOTES: Appendix A - defines the codes used. Additional information and changes to generating asset Lead Participant since January 1, 2009 may be found in the Endnotes following Section 2.1. Summer and winter capabilities as of January 1, 2009. When an alternate fuel is listed, the unit may not necessarily fully operable on both fuels. CELT Report - April 2009 Page 70 ISO New England Inc.
2.1 Endnotes All capabilities in Section 2.1, both summer and winter, are as of January 1, 2009.
Effective March 1, 2009, Constellation Energy Commodities (CEC) is no longer the Lead Market Participant for PEJEPSCOT (Asset #532). The new Lead Market Participant for this generating asset is FPL Energy Power Marketing, LLC (FPL).
Effective March 1, 2009, Constellation Energy Commodities (CEC) is no longer the Lead Market Participant for BRASSUA HYDRO (Asset #1113). The new Lead Market Participant for this generating asset is FPL Energy Power Marketing, LLC (FPL).
Effective March 1, 2009, Constellation Energy Commodities (CEC) is no longer the Lead Market Participant for KENNEBAGO HYDRO (Asset #1119). The new Lead Market Participant for this generating asset is FPL Energy Power Marketing, LLC (FPL).
Effective March 1, 2009, Constellation Energy Commodities (CEC) is no longer the Lead Market Participant for HACKETT MILLS HYDRO (Asset #2286). The new Lead Market Participant for this generating asset is FPL Energy Power Marketing, LLC (FPL).
Effective March 1, 2009, Constellation Energy Commodities (CEC) is no longer the Lead Market Participant for Hydro Kennebec (previously UNITED AMERICAN HYDRO-NEW Asset #2426). The new Lead Market Participant for this generating asset is Competitive Energy Services, LLC (CESLLC).

Section 2 - Control Area Capability
FOOTNOTES: (1) Values based on actual for December 8, 2008 and the forecast for August 1, 2009. (2) A positive value indicates net purchases are greater than sales and a negative value indicates net sales are greater than net purchases. CELT Report - April 2009 Page 71 ISO New England Inc.
2.2 Net of Purchases and Sales (1)
CAPABILITY - MW WINTER SUMMER CAPACITY PURCHASE/SALE FROM 12/08/08 08/01/09Hydro Quebec 1126.00 310.00New Brunswick 318.00 0.00New York -916.00 -252.00 NET OF PURCHASES AND SALES (2) 528.00 58.00

Section 2 - Control Area Capability
CELT Report - April 2009 Page 72 ISO New England Inc.
LEAD PARTICIPANT ASSET ID AND STATION NAME TYPE FUEL DEATIVATION DATE
1004 SNEW#7 IC DFO 10/01/2002Connecticut Municipal Electric Energy Cooperative 1108 CHAMPION ST WDS 08/28/2008FPL Energy Power Marketing, LLC 1290 SNEW #1 IC DFO 10/01/2002Connecticut Municipal Electric Energy Cooperative
1291 SNEW #2 & 4 IC DFO 10/01/2002Connecticut Municipal Electric Energy Cooperative
1292 SNEW #3 & 5 IC DFO 10/01/2002Connecticut Municipal Electric Energy Cooperative
1293 SNEW #6 IC DFO 10/01/2002Connecticut Municipal Electric Energy Cooperative
2.3 Deactivated Units Removed from ISO-NE Control Area Capability

NOTES: Gas/oil units are not necessarily be fully operable on both fuels. CELT Report - April 2009 Page 73 ISO New England Inc.
BIO/REFUSE 463 AEI LIVERMORE 34.430 14271 AMERESCO NORTHAMPTON 0.000 790 APLP-BFI 0.587953 ATTLEBORO LANDFILL - QF 0.579 1059 BARRE LANDFILL 0.900 12180 BERKSHIRE COW POWER 0.500337 BETHLEHEM 15.700 342 BIO ENERGY 0.000 10615 BLUE SPRUCE FARM U5 0.275590 BORALEX STRATTON ENERGY 44.363 11154 BRATTLEBORO LANDFILL 0.500 357 BRIDGEWATER 15.552356 BRISTOL REFUSE 12.736 973 CONCORD STEAM 0.354 14707 COVANTA HAVERHILL - LF GAS 1.593446 COVANTA JONESBORO 24.630 445 COVANTA WEST ENFIELD 24.172 10801 COVENTRY CLEAN ENERGY 4.800
12323 COVENTRY CLEAN ENERGY #4 1.525 1209 CRRA HARTFORD LANDFILL 2.215 618 DG WHITEFIELD, LLC 15.026942 DUNBARTON ROAD LANDFILL 0.584 13669 EAST WINDSOR NORCAP LFG 0.000 1052 EB1-BFI 1.575542 ECO MAINE 10.719 14382 ETHAN ALLEN CO-GEN 1 0.299 411 EXETER 25.661943 FOUR HILLS LANDFILL 0.393 194 FOUR HILLS LOAD REDUCER 1.076 1572 GRANBY SANITARY LANDFILL QF U5 2.800
12274 GREEN MOUNTAIN DAIRY 0.166 429 GREENVILLE 16.774 1432 GRS-FALL RIVER 3.90011052 GRTR NEW BEDFORD LFG UTIL 3.300 1051 HAL-BFI 1.115 436 HEMPHILL 1 14.29514211 INDECK ALEXANDRIA 0.000 1259 J & L ELECTRIC - BIOMASS I 0.000 10566 J & L ELECTRIC - BIOMASS II 0.000
474 J C MCNEIL 54.000 451 JOHNSTON LANDFILL 12.000 462 LISBON RESOURCE RECOVERY 13.036476 MERC 22.584 954 MM LOWELL LANDFILL - QF 0.238 1109 MMWAC 2.628
14134 MONTAGNE FARM 0.219 15488 Middleton Building Supply 0.300 15617 Moretown LFGTE 0.000978 NEW MILFORD 1.296 15465 Neighborhood Energy, LLC 0.000 527 OGDEN-MARTIN 1 41.060536 PERC-ORRINGTON 1 21.160 809 PINCHBECK 0.011 538 PINETREE POWER 16.844
2462 PLAINVILLE GEN QF U5 5.000 952 PONTIAC ENERGY - QF 0.170 12163 PPL GREAT WORKS - RED SHIELD 1.63314767 Pine Tree LFGTE 2.870 1224 RANDOLPH/BFG ELECTRIC FACILITY 1.171 546 RESCO SAUGUS 30.114
715 ROCHESTER LANDFILL 4.980 10366 RRIG EXPANSION PHASE 1 2.400 10959 RRIG EXPANSION PHASE 2 6.0182433 RYEGATE 1-NEW 20.600 591 S.D. WARREN-WESTBROOK 49.103 557 SCHILLER 5 45.816
562 SECREC-PRESTON 16.514 563 SEMASS 1 50.740 564 SEMASS 2 24.320767 SES CONCORD 12.761 881 SHELTON LANDFILL 0.000 580 SO. MEADOW 5 29.210581 SO. MEADOW 6 28.116 1107 SOMERSET 3.259 2425 SPRINGFIELD REFUSE-NEW 6.000592 TAMWORTH 21.000 1302 TCPMCMPAGF GEN1 U5 0.000 253 TURNKEY LANDFILL 3.143623 WALLINGFORD REFUSE 6.900 956 WARE COGEN - QF 0.000 14098 WASTE MANAGEMENT LANDFILL 3.027
10451 WESTFIELD #1 U5 0.244 349 WHEELABRATOR BRIDGEPORT, L.P. 58.741 10404 WHEELABRATOR CLAREMONT U5 4.888547 WHEELABRATOR NORTH ANDOVER 30.753 624 WMI MILLBURY 1 39.891 629 WORCESTER ENERGY 18.034
14919 ZBE-001 0.000995.886 Total Winter Capacity =
Section 3 Capability by Fuel/Unit Type 3.1 Existing Winter Capability by Fuel/Unit Type

Section 3 - Capability by Fuel/Unit Type
NOTES: Gas/oil units are not necessarily be fully operable on both fuels. CELT Report - April 2009 Page 74 ISO New England Inc.
COAL STEAM 594 AES THAMES 182.150 350 BRAYTON PT 1 246.948 351 BRAYTON PT 2 249.331352 BRAYTON PT 3 638.000 340 BRIDGEPORT HARBOR 3 384.984 345 MEAD 0.000489 MERRIMACK 1 114.000 490 MERRIMACK 2 321.750 498 MT TOM 145.533551 SALEM HARBOR 1 78.539 552 SALEM HARBOR 2 75.232 553 SALEM HARBOR 3 145.474556 SCHILLER 4 48.000 558 SCHILLER 6 48.580 577 SOMERSET 6 108.500
2787.021 Total Winter Capacity =
GAS COMBINED CYCLE 1412 ANP-BELLINGHAM 1 266.625 1415 ANP-BELLINGHAM 2 268.787 1287 ANP-BLACKSTONE ENERGY 2 248.2541286 ANP-BLACKSTONE ENERGY CO. #1 246.139 1086 BERKSHIRE POWER 246.279 1005 BG DIGHTON POWER LLC 177.3881032 BRIDGEPORT ENERGY 1 524.388 1625 GRANITE RIDGE ENERGY 797.862 15097 KIMB ROCKY RIVER PH2 16.8501343 LAKE ROAD 2 286.952 1344 LAKE ROAD 3 283.671 1216 MAINE INDEPENDENCE STATION 538.275
486 MILFORD POWER 170.730 1210 MILLENNIUM 374.786 1478 MYSTIC 8 830.8091616 MYSTIC 9 839.675 528 OCEAN ST PWR GT1/GT2/ST1 316.901 529 OCEAN ST PWR GT3/GT4/ST2 318.1801630 RISEP 588.388 1255 RUMFORD POWER 269.750 1226 TIVERTON POWER 277.867
14177 WESTBROOK ENERGY CENTER G1 271.188 14178 WESTBROOK ENERGY CENTER G2 271.1908430.934 Total Winter Capacity =
GAS COMBUSTION (GAS) TURBINE 13515 PIERCE STATION 94.941 1376 PPL WALLINGFORD UNIT 1 48.410 1377 PPL WALLINGFORD UNIT 2 51.129
1378 PPL WALLINGFORD UNIT 3 47.837 1379 PPL WALLINGFORD UNIT 4 47.782 1380 PPL WALLINGFORD UNIT 5 52.15413703 VERSO COGEN 1 58.512 13704 VERSO COGEN 2 55.006 13705 VERSO COGEN 3 55.290
1641 WAUSAU COGEN U5 0.412511.473 Total Winter Capacity =
GAS INTERNAL COMBUSTION 1495 SOUTHBRIDGE P&T QF U5 0.298
0.298 Total Winter Capacity =
GAS STEAM 10348 KENDALL STEAM 2 20.690
20.690 Total Winter Capacity =
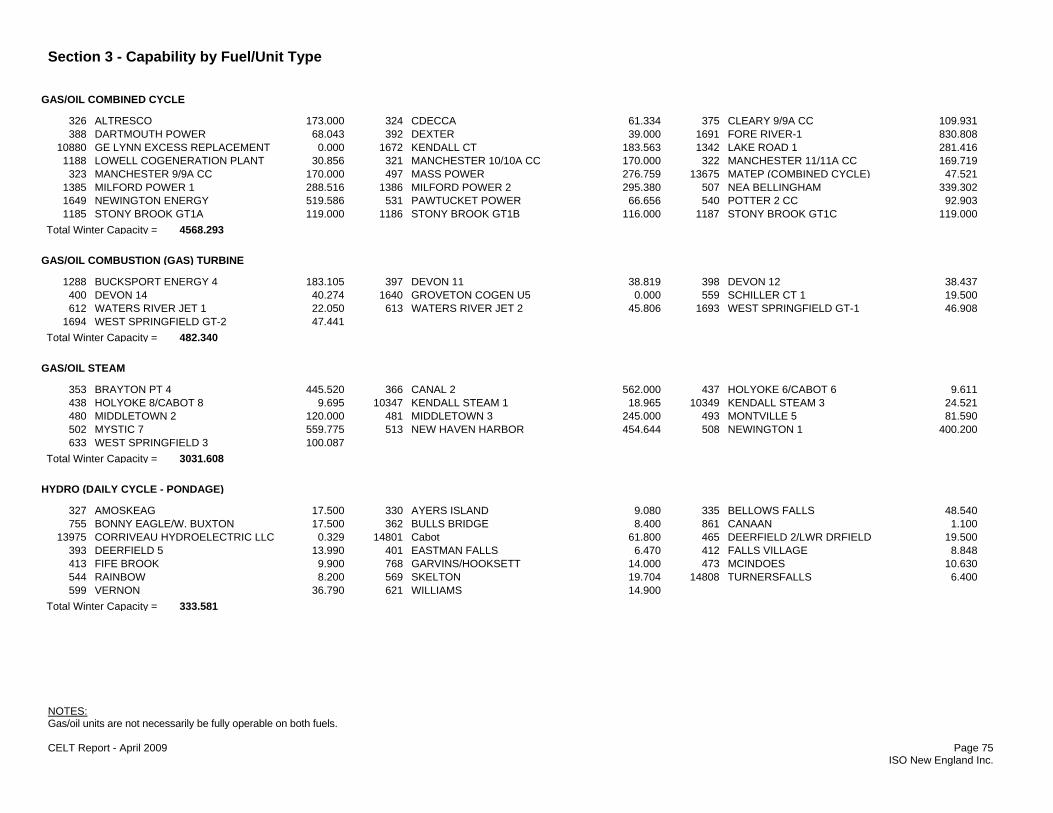
Section 3 - Capability by Fuel/Unit Type
NOTES: Gas/oil units are not necessarily be fully operable on both fuels. CELT Report - April 2009 Page 75 ISO New England Inc.
GAS/OIL COMBINED CYCLE 326 ALTRESCO 173.000 324 CDECCA 61.334 375 CLEARY 9/9A CC 109.931388 DARTMOUTH POWER 68.043 392 DEXTER 39.000 1691 FORE RIVER-1 830.808
10880 GE LYNN EXCESS REPLACEMENT 0.000 1672 KENDALL CT 183.563 1342 LAKE ROAD 1 281.4161188 LOWELL COGENERATION PLANT 30.856 321 MANCHESTER 10/10A CC 170.000 322 MANCHESTER 11/11A CC 169.719
323 MANCHESTER 9/9A CC 170.000 497 MASS POWER 276.759 13675 MATEP (COMBINED CYCLE) 47.5211385 MILFORD POWER 1 288.516 1386 MILFORD POWER 2 295.380 507 NEA BELLINGHAM 339.3021649 NEWINGTON ENERGY 519.586 531 PAWTUCKET POWER 66.656 540 POTTER 2 CC 92.9031185 STONY BROOK GT1A 119.000 1186 STONY BROOK GT1B 116.000 1187 STONY BROOK GT1C 119.000
4568.293 Total Winter Capacity =
GAS/OIL COMBUSTION (GAS) TURBINE 1288 BUCKSPORT ENERGY 4 183.105 397 DEVON 11 38.819 398 DEVON 12 38.437
400 DEVON 14 40.274 1640 GROVETON COGEN U5 0.000 559 SCHILLER CT 1 19.500612 WATERS RIVER JET 1 22.050 613 WATERS RIVER JET 2 45.806 1693 WEST SPRINGFIELD GT-1 46.908
1694 WEST SPRINGFIELD GT-2 47.441482.340 Total Winter Capacity =
GAS/OIL STEAM 353 BRAYTON PT 4 445.520 366 CANAL 2 562.000 437 HOLYOKE 6/CABOT 6 9.611438 HOLYOKE 8/CABOT 8 9.695 10347 KENDALL STEAM 1 18.965 10349 KENDALL STEAM 3 24.521480 MIDDLETOWN 2 120.000 481 MIDDLETOWN 3 245.000 493 MONTVILLE 5 81.590502 MYSTIC 7 559.775 513 NEW HAVEN HARBOR 454.644 508 NEWINGTON 1 400.200633 WEST SPRINGFIELD 3 100.087
3031.608 Total Winter Capacity =
HYDRO (DAILY CYCLE - PONDAGE) 327 AMOSKEAG 17.500 330 AYERS ISLAND 9.080 335 BELLOWS FALLS 48.540755 BONNY EAGLE/W. BUXTON 17.500 362 BULLS BRIDGE 8.400 861 CANAAN 1.100
13975 CORRIVEAU HYDROELECTRIC LLC 0.329 14801 Cabot 61.800 465 DEERFIELD 2/LWR DRFIELD 19.500393 DEERFIELD 5 13.990 401 EASTMAN FALLS 6.470 412 FALLS VILLAGE 8.848413 FIFE BROOK 9.900 768 GARVINS/HOOKSETT 14.000 473 MCINDOES 10.630544 RAINBOW 8.200 569 SKELTON 19.704 14808 TURNERSFALLS 6.400599 VERNON 36.790 621 WILLIAMS 14.900
333.581 Total Winter Capacity =

Section 3 - Capability by Fuel/Unit Type
NOTES: Gas/oil units are not necessarily be fully operable on both fuels. CELT Report - April 2009 Page 76 ISO New England Inc.
HYDRO (DAILY CYCLE - RUN OF RIVER) 10362 ACTON HYDRO INC. 0.000 819 ARNOLD FALLS 0.300 905 ASHUELOT HYDRO 0.930
931 AVERY DAM 0.479 331 AZISCOHOS HYDRO 6.810 951 BALTIC MILLS - QF 0.075811 BANTAM 0.320 754 BAR MILLS 4.000 2278 BARKER LOWER HYDRO 1.250
2279 BARKER UPPER HYDRO 0.985 833 BARNET 0.484 828 BARTON HYDRO 1.300824 BATH ELECTRIC HYDRO 0.400 812 BEEBE HOLBROOK 0.586 2430 BELDENS-NEW 5.700907 BELL MILL/ELM ST. HYDRO 0.078 2280 BENTON FALLS HYDRO 4.355 1258 BHE SMALL HYDRO COMPOSITE 2.087
1054 BLACKSTONE HYDRO ASSOC 0.000 1057 BLACKSTONE HYDRO LOAD 1.800 859 BOATLOCK 3.094346 BOLTON FALLS 5.243 348 BOOT MILLS 20.000 1113 BRASSUA HYDRO 4.203860 BRIAR HYDRO 5.000 2439 BROCKWAY MILLS U5 0.000 2281 BROWNS MILL HYDRO 0.650358 BRUNSWICK 20.200 1165 CADYS FALLS 0.800 910 CAMPTON DAM 0.138815 CARVER FALLS 1.900 1122 CASCADE-DIAMOND-QF 0.000 369 CATARACT EAST 8.000816 CAVENDISH 1.100 789 CEC 002 PAWTUCKET U5 1.200 797 CEC 003 WYRE WYND U5 2.780807 CEC 004 DAYVILLE POND U5 0.100 10401 CELLEY MILL U5 0.062 792 CENTENNIAL HYDRO 0.750832 CENTER RUTLAND 0.330 914 CHAMBERLAIN FALLS 0.101 862 CHEMICAL 1.600
1050 CHICOPEE HYDRO 2.170 887 CHINA MILLS DAM 0.722 863 CLEMENT DAM 2.216886 COCHECO FALLS 0.433 798 COLEBROOK 1.550 1049 COLLINS HYDRO 1.250834 COMPTU FALLS 0.460 849 CRESCENT DAM 1.575 2282 DAMARISCOTTA HYDRO 0.500389 DERBY DAM 7.050 835 DEWEY MILLS 2.790 2431 DODGE FALLS-NEW 5.000970 DUDLEY HYDRO 0.324 864 DWIGHT 1.746 823 EAST BARNET 1.585
10403 EASTMAN BROOK U5 0.100 836 EMERSON FALLS 0.152 830 ENOSBURG HYDRO 0.950865 ERROL 3.000 410 ESSEX 19 HYDRO 8.209 2283 EUSTIS HYDRO 0.250917 EXETER RIVER HYDRO 0.000 1047 FAIRFAX 3.250 15201 FISKE HYDRO 0.810882 FRANKLIN FALLS 0.800 924 FRESHWATER HYDRO 0.200 821 GAGE 0.750
2284 GARDINER HYDRO 1.050 851 GARDNER FALLS 3.580 805 GLEN FALLS 0.000850 GLENDALE HYDRO 1.138 913 GOODRICH FALLS 0.101 796 GOODWIN DAM 3.000
2434 GORGE 18 HYDRO-NEW 3.300 427 GORHAM 2.050 900 GREAT FALLS LOWER 1.100899 GREAT FALLS UPPER 2.075 10424 GREAT LAKES - BERLIN 16.167 1117 GREAT WORKS COMPOSITE 0.500
2285 GREENVILLE HYDRO 0.255 866 GREGGS 2.263 2286 HACKETT MILLS HYDRO 0.476921 HADLEY FALLS 0.250 769 HADLEY FALLS 1&2 33.400 12168 HARRIS ENERGY 2.421957 HG&E HYDRO/CABOT 1-4 3.147 891 HILLSBORO MILLS 0.568 440 HIRAM 11.600919 HOPKINTON HYDRO 0.250 902 HOSIERY MILL DAM 1.062 856 HUNT'S POND 0.075
2432 HUNTINGTON FALLS-NEW 5.700 2426 Hydro Kennebec 14.990 867 INDIAN ORCHARD 3.02014925 Ice House Partners, Inc 0.000 911 KELLEYS FALLS 0.400 1119 KENNEBAGO HYDRO 0.7251273 KENNEBEC WATER U5 0.410 786 KEZAR LEDGEMERE COMPOSITE 1.352 837 KILLINGTON 0.075
838 KINGSBURY 0.192 799 KINNEYTOWN A 0.169 800 KINNEYTOWN B 1.510839 LADD'S MILL 0.114 892 LAKEPORT DAM 0.640 457 LAWRENCE HYDRO 14.100787 LEWISTON CANAL COMPOSITE 6.490 1283 LEWISTON U5 0.640 894 LISBON HYDRO 0.383904 LOCHMERE DAM 1.025 460 LOCKWOOD 7.000 895 LOWER ROBERTSON DAM 0.900
10406 LOWER VALLEY HYDRO U5 0.534 10408 LOWER VILLAGE HYDRO U5 0.881 950 LP ATHOL - QF 0.0301114 MADISON COMPOSITE 18.504 1266 MARSH POWER 0.000 840 MARTINSVILLE 0.2501061 MASCOMA HYDRO 0.834 880 MCCALLUM ENTERPRISES 0.000 2287 MECHANIC FALLS HYDRO 0.838
806 MECHANICSVILLE 0.237 946 MERRIMAC PAPER - QF 0.000 759 MESSALONSKEE COMPOSITE 4.400793 METHUEN HYDRO 0.300 1720 MIDDLEBURY LOWER U5 1.850 779 MIDDLESEX 2 3.070

Section 3 - Capability by Fuel/Unit Type
NOTES: Gas/oil units are not necessarily be fully operable on both fuels. CELT Report - April 2009 Page 77 ISO New England Inc.
HYDRO (DAILY CYCLE - RUN OF RIVER) 487 MILLER HYDRO 17.119 868 MILTON MILLS HYDRO 1.510 869 MINE FALLS 2.064794 MINIWAWA 0.761 915 MONADNOCK PAPER MILLS 1.475 495 MONTY 28.000841 MORETOWN 8 0.772 1166 MORRISVILLE PLANT #2 1.800 842 NANTANA MILL 0.220890 NASHUA HYDRO 0.840 843 NEWBURY 0.270 888 NEWFOUND HYDRO 1.313922 NOONE FALLS 0.150 760 NORTH GORHAM 2.000 11126 NORTH HARTLAND HYDRO 4.460
2288 NORWAY HYDRO 0.147 857 OAKDALE HYDRO 3.200 897 OLD NASH DAM 0.175854 ORANGE HYDRO 1 0.150 855 ORANGE HYDRO 2 0.120 908 OTIS MILL HYDRO 0.123844 OTTAUQUECHEE 1.850 925 OTTER LANE HYDRO 0.090 820 PASSUMPSIC 0.700814 PATCH 0.300 532 PEJEPSCOT 13.550 870 PEMBROKE 1.492871 PENNACOOK FALLS LOWER 4.615 872 PENNACOOK FALLS UPPER 3.600 534 PENOBSCOT RIVER HYDRO 22.070948 PEPPERELL HYDRO COMPANY LLC 1.474 926 PETERBOROUGH LOWER HYDRO 0.284 941 PETERBOROUGH UPPER HYDRO 0.400
10402 PETTYBORO HYDRO U5 0.000 818 PIERCE MILLS 0.200 2289 PIONEER DAM HYDRO 0.1982290 PITTSFIELD HYDRO 1.000 539 PONTOOK HYDRO 9.699 969 POWDER MILL HYDRO 0.140
541 PROCTOR 6.650 804 PUTNAM 0.575 873 PUTTS BRIDGE 3.798810 QUINEBAUG 1.146 874 RED BRIDGE 4.359 875 RIVER BEND 1.790795 RIVER MILL HYDRO 0.200 947 RIVERDALE MILLS - QF 0.000 1034 RIVERSIDE 4-7 3.435
1035 RIVERSIDE 8 4.500 876 ROBERTSVILLE 0.624 1368 ROCKY GORGE U5 0.362906 ROLLINSFORD HYDRO 1.500 11424 RUMFORD FALLS 39.034 928 SALMON BROOK STATION 3 0.250883 SALMON FALLS HYDRO 0.833 808 SANDY HOOK HYDRO 0.105 14383 SBER ROYAL MILLS LLC 0.000877 SCOTLAND 2.200 561 SEARSBURG 4.960 761 SHAWMUT 9.500565 SHELDON SPRINGS 26.380 737 SIMPSON G LOAD REDUCER 4.850 878 SKINNER 0.280845 SLACK DAM 0.410 570 SMITH 16.196 822 SMITH (CVPS) 0.847852 SOUTH BARRE HYDRO 0.140 1267 SPARHAWK 0.175 909 STEELS POND HYDRO 0.975885 STEVENS MILL 0.225 898 SUGAR RIVER HYDRO 0.150 889 SUNAPEE HYDRO 0.402912 SUNNYBROOK HYDRO 1 0.015 935 SUNNYBROOK HYDRO 2 0.050 884 SWANS FALLS 0.410
10409 SWEETWATER HYDRO U5 0.500 1678 SYSKO GARDNER BROOK U5 0.034 1270 SYSKO STONY BROOK 0.0251271 SYSKO WIGHT BROOK 0.025 817 TAFTSVILLE VT 0.400 879 TAFTVILLE CT 2.0251225 TANNERY DAM 0.000 803 TOUTANT 0.400 826 TROY 0.000
813 TUNNEL 2.100 14937 Union Gas Station 1.500 831 VAIL & GREAT FALLS 2.100949 VALLEY HYDRO - QF 0.000 2435 VERGENNES HYDRO-NEW 2.100 14623 Valley Hydro (Station No. 5) 0.790
1048 WARE HYDRO 0.479 901 WATERLOOM FALLS 0.083 932 WATSON DAM 0.2502291 WAVERLY AVENUE HYDRO 0.400 853 WEBSTER HYDRO 0.273 825 WEST CHARLESTON 0.000
781 WEST DANVILLE 1 0.000 616 WEST ENFIELD 16.305 893 WEST HOPKINTON HYDRO 1.25010770 WEST SPRINGFIELD HYDRO U5 1.250 617 WESTON 13.200 933 WESTON DAM 0.452
801 WILLIMANTIC 1 0.770 802 WILLIMANTIC 2 0.770 622 WINOOSKI 1 7.300846 WINOOSKI 8 0.731 1167 WOLCOTT HYDRO #1 0.800 847 WOODSIDE 0.120
10407 WOODSVILLE HYDRO U5 0.170 903 WYANDOTTE HYDRO 0.150 15787 Woronoco Hydro LLC 2.3352292 YORK HYDRO 1.200
664.367 Total Winter Capacity =
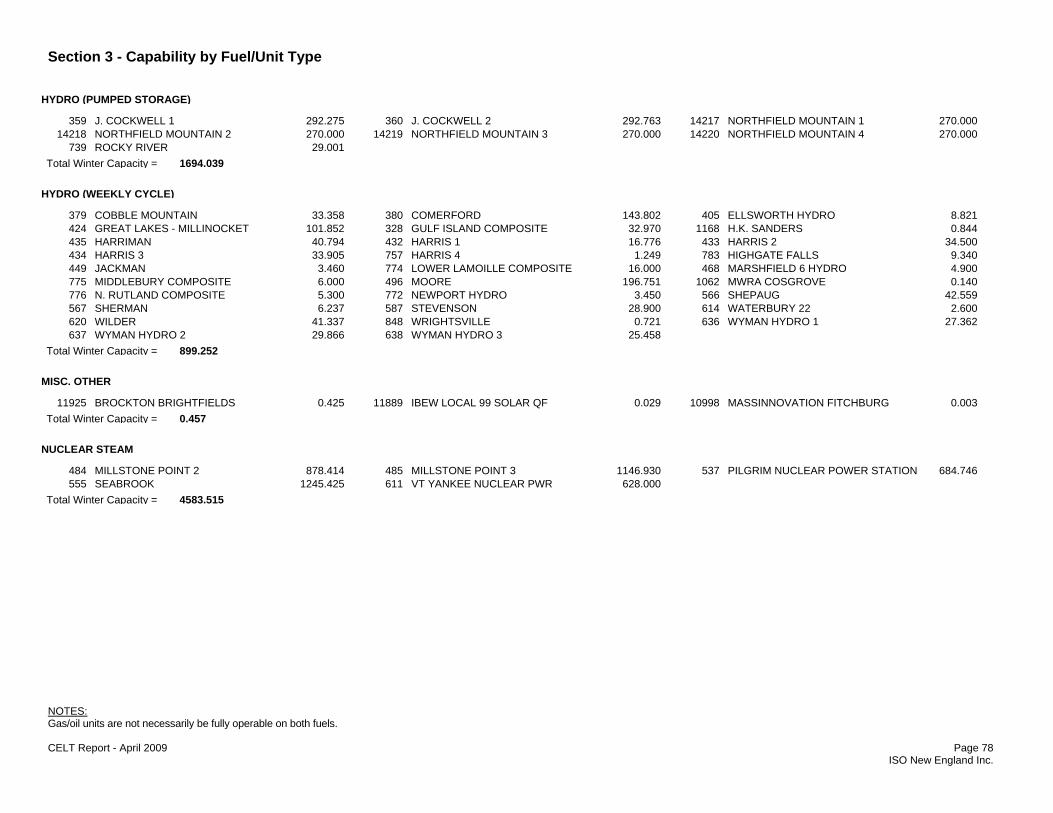
Section 3 - Capability by Fuel/Unit Type
NOTES: Gas/oil units are not necessarily be fully operable on both fuels. CELT Report - April 2009 Page 78 ISO New England Inc.
HYDRO (PUMPED STORAGE) 359 J. COCKWELL 1 292.275 360 J. COCKWELL 2 292.763 14217 NORTHFIELD MOUNTAIN 1 270.000
14218 NORTHFIELD MOUNTAIN 2 270.000 14219 NORTHFIELD MOUNTAIN 3 270.000 14220 NORTHFIELD MOUNTAIN 4 270.000739 ROCKY RIVER 29.001
1694.039 Total Winter Capacity =
HYDRO (WEEKLY CYCLE) 379 COBBLE MOUNTAIN 33.358 380 COMERFORD 143.802 405 ELLSWORTH HYDRO 8.821424 GREAT LAKES - MILLINOCKET 101.852 328 GULF ISLAND COMPOSITE 32.970 1168 H.K. SANDERS 0.844435 HARRIMAN 40.794 432 HARRIS 1 16.776 433 HARRIS 2 34.500434 HARRIS 3 33.905 757 HARRIS 4 1.249 783 HIGHGATE FALLS 9.340449 JACKMAN 3.460 774 LOWER LAMOILLE COMPOSITE 16.000 468 MARSHFIELD 6 HYDRO 4.900775 MIDDLEBURY COMPOSITE 6.000 496 MOORE 196.751 1062 MWRA COSGROVE 0.140776 N. RUTLAND COMPOSITE 5.300 772 NEWPORT HYDRO 3.450 566 SHEPAUG 42.559567 SHERMAN 6.237 587 STEVENSON 28.900 614 WATERBURY 22 2.600620 WILDER 41.337 848 WRIGHTSVILLE 0.721 636 WYMAN HYDRO 1 27.362637 WYMAN HYDRO 2 29.866 638 WYMAN HYDRO 3 25.458
899.252 Total Winter Capacity =
MISC. OTHER 11925 BROCKTON BRIGHTFIELDS 0.425 11889 IBEW LOCAL 99 SOLAR QF 0.029 10998 MASSINNOVATION FITCHBURG 0.003
0.457 Total Winter Capacity =
NUCLEAR STEAM 484 MILLSTONE POINT 2 878.414 485 MILLSTONE POINT 3 1146.930 537 PILGRIM NUCLEAR POWER STATION 684.746555 SEABROOK 1245.425 611 VT YANKEE NUCLEAR PWR 628.000
4583.515 Total Winter Capacity =
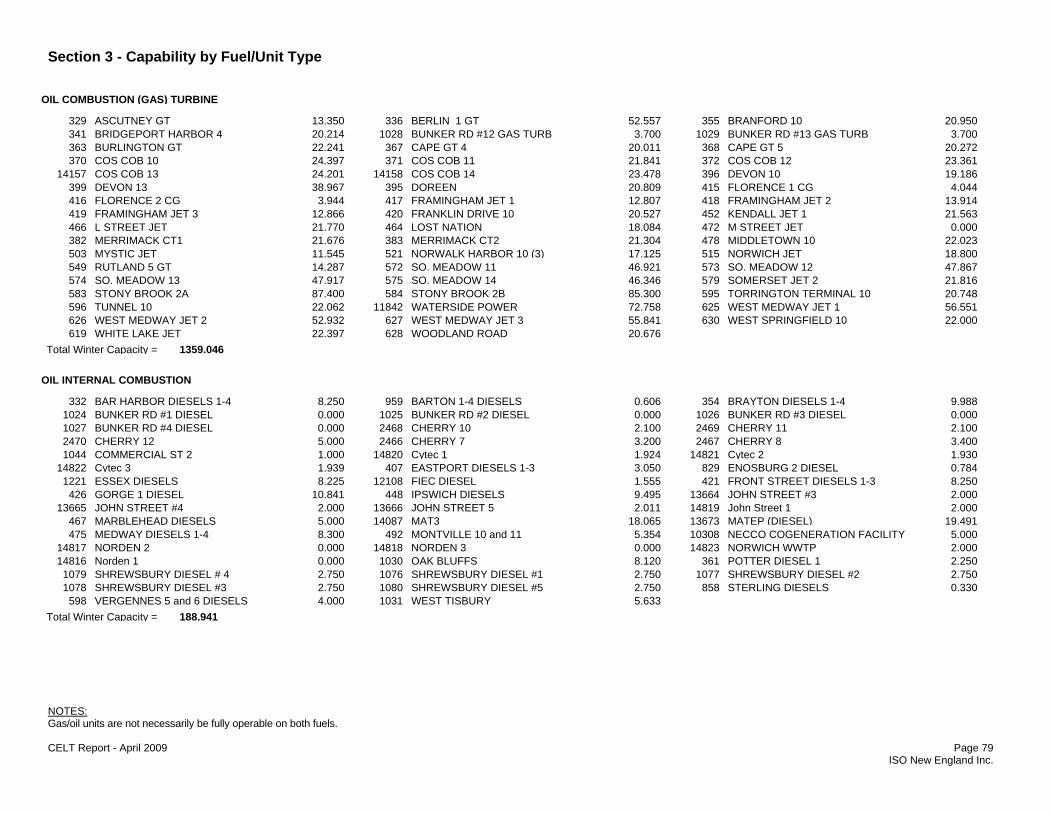
Section 3 - Capability by Fuel/Unit Type
NOTES: Gas/oil units are not necessarily be fully operable on both fuels. CELT Report - April 2009 Page 79 ISO New England Inc.
OIL COMBUSTION (GAS) TURBINE 329 ASCUTNEY GT 13.350 336 BERLIN 1 GT 52.557 355 BRANFORD 10 20.950341 BRIDGEPORT HARBOR 4 20.214 1028 BUNKER RD #12 GAS TURB 3.700 1029 BUNKER RD #13 GAS TURB 3.700363 BURLINGTON GT 22.241 367 CAPE GT 4 20.011 368 CAPE GT 5 20.272370 COS COB 10 24.397 371 COS COB 11 21.841 372 COS COB 12 23.361
14157 COS COB 13 24.201 14158 COS COB 14 23.478 396 DEVON 10 19.186399 DEVON 13 38.967 395 DOREEN 20.809 415 FLORENCE 1 CG 4.044416 FLORENCE 2 CG 3.944 417 FRAMINGHAM JET 1 12.807 418 FRAMINGHAM JET 2 13.914419 FRAMINGHAM JET 3 12.866 420 FRANKLIN DRIVE 10 20.527 452 KENDALL JET 1 21.563466 L STREET JET 21.770 464 LOST NATION 18.084 472 M STREET JET 0.000382 MERRIMACK CT1 21.676 383 MERRIMACK CT2 21.304 478 MIDDLETOWN 10 22.023503 MYSTIC JET 11.545 521 NORWALK HARBOR 10 (3) 17.125 515 NORWICH JET 18.800549 RUTLAND 5 GT 14.287 572 SO. MEADOW 11 46.921 573 SO. MEADOW 12 47.867574 SO. MEADOW 13 47.917 575 SO. MEADOW 14 46.346 579 SOMERSET JET 2 21.816583 STONY BROOK 2A 87.400 584 STONY BROOK 2B 85.300 595 TORRINGTON TERMINAL 10 20.748596 TUNNEL 10 22.062 11842 WATERSIDE POWER 72.758 625 WEST MEDWAY JET 1 56.551626 WEST MEDWAY JET 2 52.932 627 WEST MEDWAY JET 3 55.841 630 WEST SPRINGFIELD 10 22.000619 WHITE LAKE JET 22.397 628 WOODLAND ROAD 20.676
1359.046 Total Winter Capacity =
OIL INTERNAL COMBUSTION 332 BAR HARBOR DIESELS 1-4 8.250 959 BARTON 1-4 DIESELS 0.606 354 BRAYTON DIESELS 1-4 9.988
1024 BUNKER RD #1 DIESEL 0.000 1025 BUNKER RD #2 DIESEL 0.000 1026 BUNKER RD #3 DIESEL 0.0001027 BUNKER RD #4 DIESEL 0.000 2468 CHERRY 10 2.100 2469 CHERRY 11 2.1002470 CHERRY 12 5.000 2466 CHERRY 7 3.200 2467 CHERRY 8 3.4001044 COMMERCIAL ST 2 1.000 14820 Cytec 1 1.924 14821 Cytec 2 1.930
14822 Cytec 3 1.939 407 EASTPORT DIESELS 1-3 3.050 829 ENOSBURG 2 DIESEL 0.7841221 ESSEX DIESELS 8.225 12108 FIEC DIESEL 1.555 421 FRONT STREET DIESELS 1-3 8.250
426 GORGE 1 DIESEL 10.841 448 IPSWICH DIESELS 9.495 13664 JOHN STREET #3 2.00013665 JOHN STREET #4 2.000 13666 JOHN STREET 5 2.011 14819 John Street 1 2.000
467 MARBLEHEAD DIESELS 5.000 14087 MAT3 18.065 13673 MATEP (DIESEL) 19.491475 MEDWAY DIESELS 1-4 8.300 492 MONTVILLE 10 and 11 5.354 10308 NECCO COGENERATION FACILITY 5.000
14817 NORDEN 2 0.000 14818 NORDEN 3 0.000 14823 NORWICH WWTP 2.00014816 Norden 1 0.000 1030 OAK BLUFFS 8.120 361 POTTER DIESEL 1 2.2501079 SHREWSBURY DIESEL # 4 2.750 1076 SHREWSBURY DIESEL #1 2.750 1077 SHREWSBURY DIESEL #2 2.7501078 SHREWSBURY DIESEL #3 2.750 1080 SHREWSBURY DIESEL #5 2.750 858 STERLING DIESELS 0.330
598 VERGENNES 5 and 6 DIESELS 4.000 1031 WEST TISBURY 5.633188.941 Total Winter Capacity =

Section 3 - Capability by Fuel/Unit Type
NOTES: Gas/oil units are not necessarily be fully operable on both fuels. CELT Report - April 2009 Page 80 ISO New England Inc.
OIL STEAM 339 BRIDGEPORT HARBOR 2 147.509 365 CANAL 1 573.000 376 CLEARY 8 26.000479 MIDDLETOWN 1 0.000 482 MIDDLETOWN 4 402.000 494 MONTVILLE 6 409.913519 NORWALK HARBOR 1 163.995 520 NORWALK HARBOR 2 172.000 554 SALEM HARBOR 4 437.353639 YARMOUTH 1 52.495 640 YARMOUTH 2 52.823 641 YARMOUTH 3 117.805642 YARMOUTH 4 610.375
3165.268 Total Winter Capacity =
WIND TURBINE 11530 BERLIN WIND 0.000 15706 Beaver Ridge Wind 1.500 11408 HULL WIND TURBINE II 1.800
1656 HULL WIND TURBINE U5 0.165 15462 Holy Name CC Jr Sr High School 0.600 13933 JIMINY PEAK WIND QF 1.41715115 Lempster Wind 23.500 11827 PORTSMOUTH ABBEY WIND QF 0.445 827 SEARSBURG WIND 1.500
30.927 Total Winter Capacity =
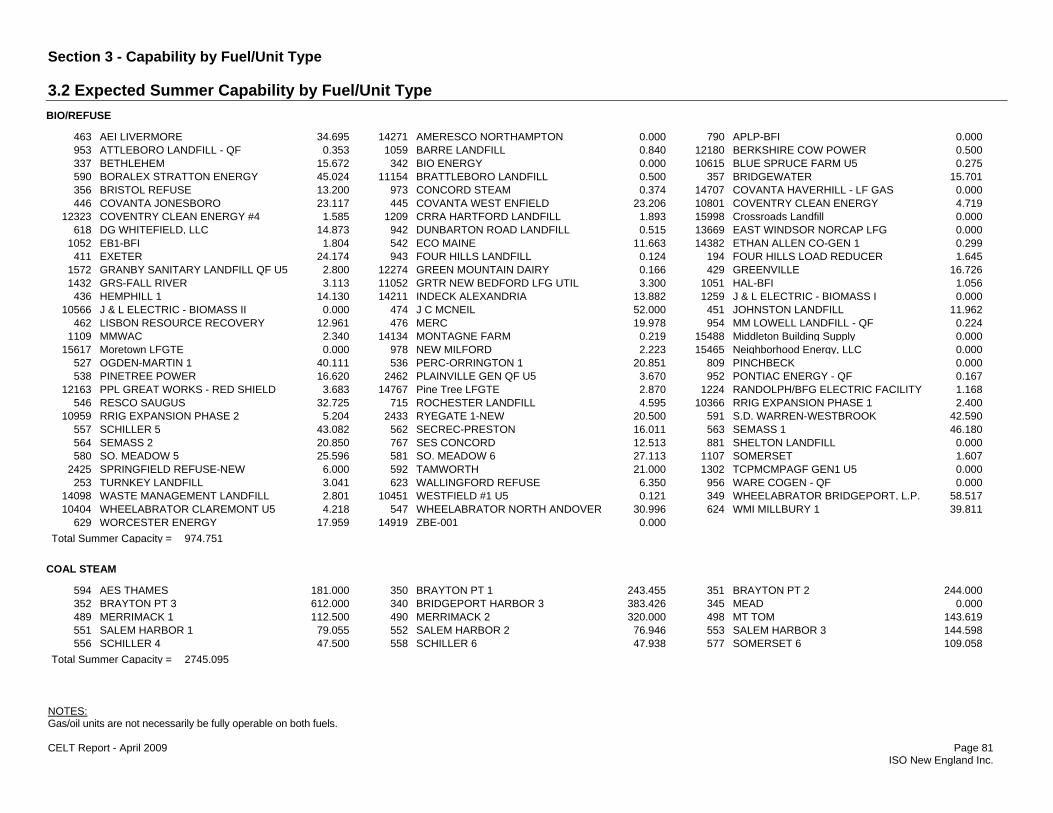
Section 3 - Capability by Fuel/Unit Type
NOTES: Gas/oil units are not necessarily be fully operable on both fuels. CELT Report - April 2009 Page 81 ISO New England Inc.
BIO/REFUSE 463 AEI LIVERMORE 34.695 14271 AMERESCO NORTHAMPTON 0.000 790 APLP-BFI 0.000953 ATTLEBORO LANDFILL - QF 0.353 1059 BARRE LANDFILL 0.840 12180 BERKSHIRE COW POWER 0.500337 BETHLEHEM 15.672 342 BIO ENERGY 0.000 10615 BLUE SPRUCE FARM U5 0.275590 BORALEX STRATTON ENERGY 45.024 11154 BRATTLEBORO LANDFILL 0.500 357 BRIDGEWATER 15.701356 BRISTOL REFUSE 13.200 973 CONCORD STEAM 0.374 14707 COVANTA HAVERHILL - LF GAS 0.000446 COVANTA JONESBORO 23.117 445 COVANTA WEST ENFIELD 23.206 10801 COVENTRY CLEAN ENERGY 4.719
12323 COVENTRY CLEAN ENERGY #4 1.585 1209 CRRA HARTFORD LANDFILL 1.893 15998 Crossroads Landfill 0.000618 DG WHITEFIELD, LLC 14.873 942 DUNBARTON ROAD LANDFILL 0.515 13669 EAST WINDSOR NORCAP LFG 0.000
1052 EB1-BFI 1.804 542 ECO MAINE 11.663 14382 ETHAN ALLEN CO-GEN 1 0.299411 EXETER 24.174 943 FOUR HILLS LANDFILL 0.124 194 FOUR HILLS LOAD REDUCER 1.645
1572 GRANBY SANITARY LANDFILL QF U5 2.800 12274 GREEN MOUNTAIN DAIRY 0.166 429 GREENVILLE 16.7261432 GRS-FALL RIVER 3.113 11052 GRTR NEW BEDFORD LFG UTIL 3.300 1051 HAL-BFI 1.056
436 HEMPHILL 1 14.130 14211 INDECK ALEXANDRIA 13.882 1259 J & L ELECTRIC - BIOMASS I 0.00010566 J & L ELECTRIC - BIOMASS II 0.000 474 J C MCNEIL 52.000 451 JOHNSTON LANDFILL 11.962
462 LISBON RESOURCE RECOVERY 12.961 476 MERC 19.978 954 MM LOWELL LANDFILL - QF 0.2241109 MMWAC 2.340 14134 MONTAGNE FARM 0.219 15488 Middleton Building Supply 0.000
15617 Moretown LFGTE 0.000 978 NEW MILFORD 2.223 15465 Neighborhood Energy, LLC 0.000527 OGDEN-MARTIN 1 40.111 536 PERC-ORRINGTON 1 20.851 809 PINCHBECK 0.000538 PINETREE POWER 16.620 2462 PLAINVILLE GEN QF U5 3.670 952 PONTIAC ENERGY - QF 0.167
12163 PPL GREAT WORKS - RED SHIELD 3.683 14767 Pine Tree LFGTE 2.870 1224 RANDOLPH/BFG ELECTRIC FACILITY 1.168546 RESCO SAUGUS 32.725 715 ROCHESTER LANDFILL 4.595 10366 RRIG EXPANSION PHASE 1 2.400
10959 RRIG EXPANSION PHASE 2 5.204 2433 RYEGATE 1-NEW 20.500 591 S.D. WARREN-WESTBROOK 42.590557 SCHILLER 5 43.082 562 SECREC-PRESTON 16.011 563 SEMASS 1 46.180564 SEMASS 2 20.850 767 SES CONCORD 12.513 881 SHELTON LANDFILL 0.000580 SO. MEADOW 5 25.596 581 SO. MEADOW 6 27.113 1107 SOMERSET 1.607
2425 SPRINGFIELD REFUSE-NEW 6.000 592 TAMWORTH 21.000 1302 TCPMCMPAGF GEN1 U5 0.000253 TURNKEY LANDFILL 3.041 623 WALLINGFORD REFUSE 6.350 956 WARE COGEN - QF 0.000
14098 WASTE MANAGEMENT LANDFILL 2.801 10451 WESTFIELD #1 U5 0.121 349 WHEELABRATOR BRIDGEPORT, L.P. 58.51710404 WHEELABRATOR CLAREMONT U5 4.218 547 WHEELABRATOR NORTH ANDOVER 30.996 624 WMI MILLBURY 1 39.811
629 WORCESTER ENERGY 17.959 14919 ZBE-001 0.000Total Summer Capacity = 974.751
COAL STEAM 594 AES THAMES 181.000 350 BRAYTON PT 1 243.455 351 BRAYTON PT 2 244.000352 BRAYTON PT 3 612.000 340 BRIDGEPORT HARBOR 3 383.426 345 MEAD 0.000489 MERRIMACK 1 112.500 490 MERRIMACK 2 320.000 498 MT TOM 143.619551 SALEM HARBOR 1 79.055 552 SALEM HARBOR 2 76.946 553 SALEM HARBOR 3 144.598556 SCHILLER 4 47.500 558 SCHILLER 6 47.938 577 SOMERSET 6 109.058
Total Summer Capacity = 2745.095
3.2 Expected Summer Capability by Fuel/Unit Type
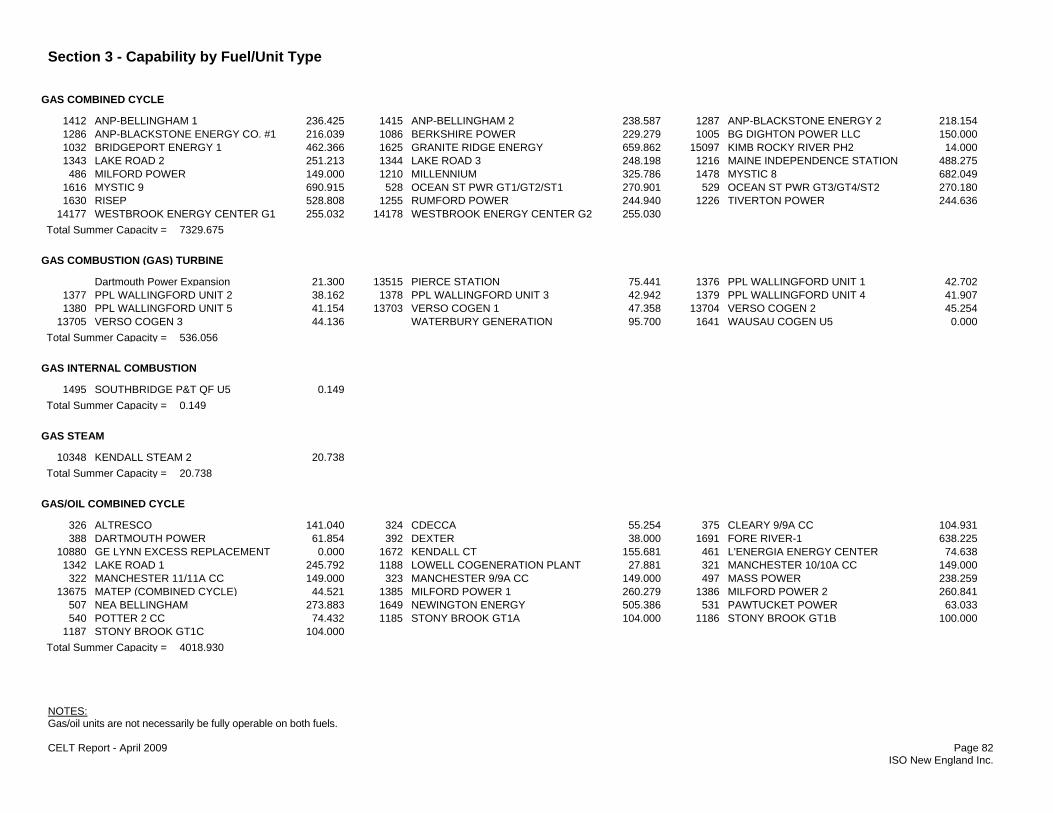
Section 3 - Capability by Fuel/Unit Type
NOTES: Gas/oil units are not necessarily be fully operable on both fuels. CELT Report - April 2009 Page 82 ISO New England Inc.
GAS COMBINED CYCLE 1412 ANP-BELLINGHAM 1 236.425 1415 ANP-BELLINGHAM 2 238.587 1287 ANP-BLACKSTONE ENERGY 2 218.1541286 ANP-BLACKSTONE ENERGY CO. #1 216.039 1086 BERKSHIRE POWER 229.279 1005 BG DIGHTON POWER LLC 150.0001032 BRIDGEPORT ENERGY 1 462.366 1625 GRANITE RIDGE ENERGY 659.862 15097 KIMB ROCKY RIVER PH2 14.0001343 LAKE ROAD 2 251.213 1344 LAKE ROAD 3 248.198 1216 MAINE INDEPENDENCE STATION 488.275
486 MILFORD POWER 149.000 1210 MILLENNIUM 325.786 1478 MYSTIC 8 682.0491616 MYSTIC 9 690.915 528 OCEAN ST PWR GT1/GT2/ST1 270.901 529 OCEAN ST PWR GT3/GT4/ST2 270.1801630 RISEP 528.808 1255 RUMFORD POWER 244.940 1226 TIVERTON POWER 244.636
14177 WESTBROOK ENERGY CENTER G1 255.032 14178 WESTBROOK ENERGY CENTER G2 255.030Total Summer Capacity = 7329.675
GAS COMBUSTION (GAS) TURBINE Dartmouth Power Expansion 21.300 13515 PIERCE STATION 75.441 1376 PPL WALLINGFORD UNIT 1 42.702
1377 PPL WALLINGFORD UNIT 2 38.162 1378 PPL WALLINGFORD UNIT 3 42.942 1379 PPL WALLINGFORD UNIT 4 41.9071380 PPL WALLINGFORD UNIT 5 41.154 13703 VERSO COGEN 1 47.358 13704 VERSO COGEN 2 45.254
13705 VERSO COGEN 3 44.136 WATERBURY GENERATION 95.700 1641 WAUSAU COGEN U5 0.000Total Summer Capacity = 536.056
GAS INTERNAL COMBUSTION 1495 SOUTHBRIDGE P&T QF U5 0.149
Total Summer Capacity = 0.149
GAS STEAM 10348 KENDALL STEAM 2 20.738
Total Summer Capacity = 20.738
GAS/OIL COMBINED CYCLE 326 ALTRESCO 141.040 324 CDECCA 55.254 375 CLEARY 9/9A CC 104.931388 DARTMOUTH POWER 61.854 392 DEXTER 38.000 1691 FORE RIVER-1 638.225
10880 GE LYNN EXCESS REPLACEMENT 0.000 1672 KENDALL CT 155.681 461 L'ENERGIA ENERGY CENTER 74.6381342 LAKE ROAD 1 245.792 1188 LOWELL COGENERATION PLANT 27.881 321 MANCHESTER 10/10A CC 149.000
322 MANCHESTER 11/11A CC 149.000 323 MANCHESTER 9/9A CC 149.000 497 MASS POWER 238.25913675 MATEP (COMBINED CYCLE) 44.521 1385 MILFORD POWER 1 260.279 1386 MILFORD POWER 2 260.841
507 NEA BELLINGHAM 273.883 1649 NEWINGTON ENERGY 505.386 531 PAWTUCKET POWER 63.033540 POTTER 2 CC 74.432 1185 STONY BROOK GT1A 104.000 1186 STONY BROOK GT1B 100.000
1187 STONY BROOK GT1C 104.000Total Summer Capacity = 4018.930
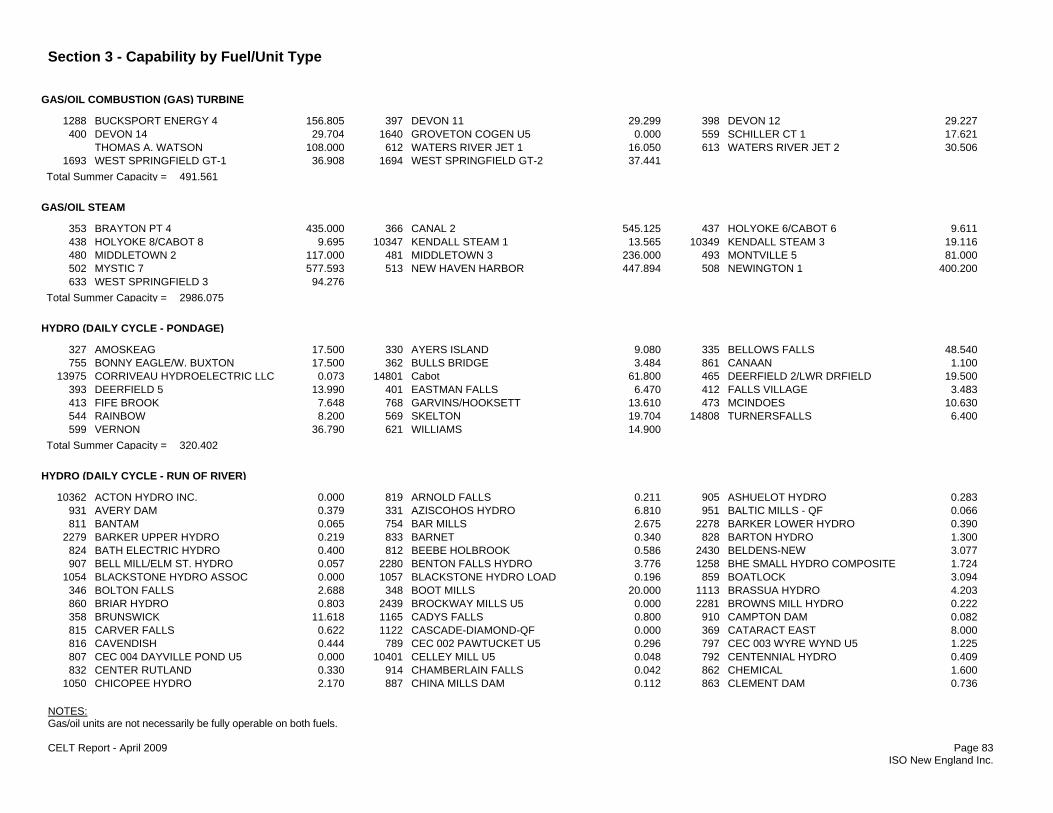
Section 3 - Capability by Fuel/Unit Type
NOTES: Gas/oil units are not necessarily be fully operable on both fuels. CELT Report - April 2009 Page 83 ISO New England Inc.
GAS/OIL COMBUSTION (GAS) TURBINE 1288 BUCKSPORT ENERGY 4 156.805 397 DEVON 11 29.299 398 DEVON 12 29.227
400 DEVON 14 29.704 1640 GROVETON COGEN U5 0.000 559 SCHILLER CT 1 17.621 THOMAS A. WATSON 108.000 612 WATERS RIVER JET 1 16.050 613 WATERS RIVER JET 2 30.506
1693 WEST SPRINGFIELD GT-1 36.908 1694 WEST SPRINGFIELD GT-2 37.441Total Summer Capacity = 491.561
GAS/OIL STEAM 353 BRAYTON PT 4 435.000 366 CANAL 2 545.125 437 HOLYOKE 6/CABOT 6 9.611438 HOLYOKE 8/CABOT 8 9.695 10347 KENDALL STEAM 1 13.565 10349 KENDALL STEAM 3 19.116480 MIDDLETOWN 2 117.000 481 MIDDLETOWN 3 236.000 493 MONTVILLE 5 81.000502 MYSTIC 7 577.593 513 NEW HAVEN HARBOR 447.894 508 NEWINGTON 1 400.200633 WEST SPRINGFIELD 3 94.276
Total Summer Capacity = 2986.075
HYDRO (DAILY CYCLE - PONDAGE) 327 AMOSKEAG 17.500 330 AYERS ISLAND 9.080 335 BELLOWS FALLS 48.540755 BONNY EAGLE/W. BUXTON 17.500 362 BULLS BRIDGE 3.484 861 CANAAN 1.100
13975 CORRIVEAU HYDROELECTRIC LLC 0.073 14801 Cabot 61.800 465 DEERFIELD 2/LWR DRFIELD 19.500393 DEERFIELD 5 13.990 401 EASTMAN FALLS 6.470 412 FALLS VILLAGE 3.483413 FIFE BROOK 7.648 768 GARVINS/HOOKSETT 13.610 473 MCINDOES 10.630544 RAINBOW 8.200 569 SKELTON 19.704 14808 TURNERSFALLS 6.400599 VERNON 36.790 621 WILLIAMS 14.900
Total Summer Capacity = 320.402
HYDRO (DAILY CYCLE - RUN OF RIVER) 10362 ACTON HYDRO INC. 0.000 819 ARNOLD FALLS 0.211 905 ASHUELOT HYDRO 0.283
931 AVERY DAM 0.379 331 AZISCOHOS HYDRO 6.810 951 BALTIC MILLS - QF 0.066811 BANTAM 0.065 754 BAR MILLS 2.675 2278 BARKER LOWER HYDRO 0.390
2279 BARKER UPPER HYDRO 0.219 833 BARNET 0.340 828 BARTON HYDRO 1.300824 BATH ELECTRIC HYDRO 0.400 812 BEEBE HOLBROOK 0.586 2430 BELDENS-NEW 3.077907 BELL MILL/ELM ST. HYDRO 0.057 2280 BENTON FALLS HYDRO 3.776 1258 BHE SMALL HYDRO COMPOSITE 1.724
1054 BLACKSTONE HYDRO ASSOC 0.000 1057 BLACKSTONE HYDRO LOAD 0.196 859 BOATLOCK 3.094346 BOLTON FALLS 2.688 348 BOOT MILLS 20.000 1113 BRASSUA HYDRO 4.203860 BRIAR HYDRO 0.803 2439 BROCKWAY MILLS U5 0.000 2281 BROWNS MILL HYDRO 0.222358 BRUNSWICK 11.618 1165 CADYS FALLS 0.800 910 CAMPTON DAM 0.082815 CARVER FALLS 0.622 1122 CASCADE-DIAMOND-QF 0.000 369 CATARACT EAST 8.000816 CAVENDISH 0.444 789 CEC 002 PAWTUCKET U5 0.296 797 CEC 003 WYRE WYND U5 1.225807 CEC 004 DAYVILLE POND U5 0.000 10401 CELLEY MILL U5 0.048 792 CENTENNIAL HYDRO 0.409832 CENTER RUTLAND 0.330 914 CHAMBERLAIN FALLS 0.042 862 CHEMICAL 1.600
1050 CHICOPEE HYDRO 2.170 887 CHINA MILLS DAM 0.112 863 CLEMENT DAM 0.736
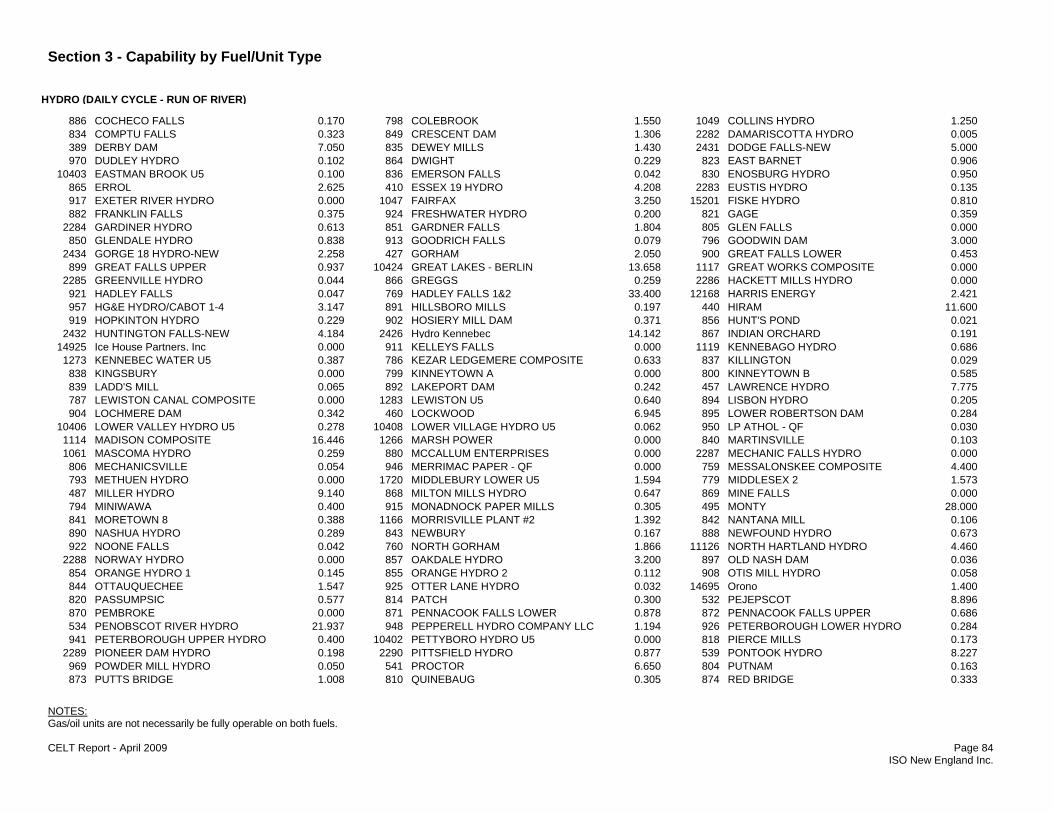
Section 3 - Capability by Fuel/Unit Type
NOTES: Gas/oil units are not necessarily be fully operable on both fuels. CELT Report - April 2009 Page 84 ISO New England Inc.
HYDRO (DAILY CYCLE - RUN OF RIVER) 886 COCHECO FALLS 0.170 798 COLEBROOK 1.550 1049 COLLINS HYDRO 1.250834 COMPTU FALLS 0.323 849 CRESCENT DAM 1.306 2282 DAMARISCOTTA HYDRO 0.005389 DERBY DAM 7.050 835 DEWEY MILLS 1.430 2431 DODGE FALLS-NEW 5.000970 DUDLEY HYDRO 0.102 864 DWIGHT 0.229 823 EAST BARNET 0.906
10403 EASTMAN BROOK U5 0.100 836 EMERSON FALLS 0.042 830 ENOSBURG HYDRO 0.950865 ERROL 2.625 410 ESSEX 19 HYDRO 4.208 2283 EUSTIS HYDRO 0.135917 EXETER RIVER HYDRO 0.000 1047 FAIRFAX 3.250 15201 FISKE HYDRO 0.810882 FRANKLIN FALLS 0.375 924 FRESHWATER HYDRO 0.200 821 GAGE 0.359
2284 GARDINER HYDRO 0.613 851 GARDNER FALLS 1.804 805 GLEN FALLS 0.000850 GLENDALE HYDRO 0.838 913 GOODRICH FALLS 0.079 796 GOODWIN DAM 3.000
2434 GORGE 18 HYDRO-NEW 2.258 427 GORHAM 2.050 900 GREAT FALLS LOWER 0.453899 GREAT FALLS UPPER 0.937 10424 GREAT LAKES - BERLIN 13.658 1117 GREAT WORKS COMPOSITE 0.000
2285 GREENVILLE HYDRO 0.044 866 GREGGS 0.259 2286 HACKETT MILLS HYDRO 0.000921 HADLEY FALLS 0.047 769 HADLEY FALLS 1&2 33.400 12168 HARRIS ENERGY 2.421957 HG&E HYDRO/CABOT 1-4 3.147 891 HILLSBORO MILLS 0.197 440 HIRAM 11.600919 HOPKINTON HYDRO 0.229 902 HOSIERY MILL DAM 0.371 856 HUNT'S POND 0.021
2432 HUNTINGTON FALLS-NEW 4.184 2426 Hydro Kennebec 14.142 867 INDIAN ORCHARD 0.19114925 Ice House Partners, Inc 0.000 911 KELLEYS FALLS 0.000 1119 KENNEBAGO HYDRO 0.6861273 KENNEBEC WATER U5 0.387 786 KEZAR LEDGEMERE COMPOSITE 0.633 837 KILLINGTON 0.029
838 KINGSBURY 0.000 799 KINNEYTOWN A 0.000 800 KINNEYTOWN B 0.585839 LADD'S MILL 0.065 892 LAKEPORT DAM 0.242 457 LAWRENCE HYDRO 7.775787 LEWISTON CANAL COMPOSITE 0.000 1283 LEWISTON U5 0.640 894 LISBON HYDRO 0.205904 LOCHMERE DAM 0.342 460 LOCKWOOD 6.945 895 LOWER ROBERTSON DAM 0.284
10406 LOWER VALLEY HYDRO U5 0.278 10408 LOWER VILLAGE HYDRO U5 0.062 950 LP ATHOL - QF 0.0301114 MADISON COMPOSITE 16.446 1266 MARSH POWER 0.000 840 MARTINSVILLE 0.1031061 MASCOMA HYDRO 0.259 880 MCCALLUM ENTERPRISES 0.000 2287 MECHANIC FALLS HYDRO 0.000
806 MECHANICSVILLE 0.054 946 MERRIMAC PAPER - QF 0.000 759 MESSALONSKEE COMPOSITE 4.400793 METHUEN HYDRO 0.000 1720 MIDDLEBURY LOWER U5 1.594 779 MIDDLESEX 2 1.573487 MILLER HYDRO 9.140 868 MILTON MILLS HYDRO 0.647 869 MINE FALLS 0.000794 MINIWAWA 0.400 915 MONADNOCK PAPER MILLS 0.305 495 MONTY 28.000841 MORETOWN 8 0.388 1166 MORRISVILLE PLANT #2 1.392 842 NANTANA MILL 0.106890 NASHUA HYDRO 0.289 843 NEWBURY 0.167 888 NEWFOUND HYDRO 0.673922 NOONE FALLS 0.042 760 NORTH GORHAM 1.866 11126 NORTH HARTLAND HYDRO 4.460
2288 NORWAY HYDRO 0.000 857 OAKDALE HYDRO 3.200 897 OLD NASH DAM 0.036854 ORANGE HYDRO 1 0.145 855 ORANGE HYDRO 2 0.112 908 OTIS MILL HYDRO 0.058844 OTTAUQUECHEE 1.547 925 OTTER LANE HYDRO 0.032 14695 Orono 1.400820 PASSUMPSIC 0.577 814 PATCH 0.300 532 PEJEPSCOT 8.896870 PEMBROKE 0.000 871 PENNACOOK FALLS LOWER 0.878 872 PENNACOOK FALLS UPPER 0.686534 PENOBSCOT RIVER HYDRO 21.937 948 PEPPERELL HYDRO COMPANY LLC 1.194 926 PETERBOROUGH LOWER HYDRO 0.284941 PETERBOROUGH UPPER HYDRO 0.400 10402 PETTYBORO HYDRO U5 0.000 818 PIERCE MILLS 0.173
2289 PIONEER DAM HYDRO 0.198 2290 PITTSFIELD HYDRO 0.877 539 PONTOOK HYDRO 8.227969 POWDER MILL HYDRO 0.050 541 PROCTOR 6.650 804 PUTNAM 0.163873 PUTTS BRIDGE 1.008 810 QUINEBAUG 0.305 874 RED BRIDGE 0.333

Section 3 - Capability by Fuel/Unit Type
NOTES: Gas/oil units are not necessarily be fully operable on both fuels. CELT Report - April 2009 Page 85 ISO New England Inc.
HYDRO (DAILY CYCLE - RUN OF RIVER) 875 RIVER BEND 0.564 795 RIVER MILL HYDRO 0.000 947 RIVERDALE MILLS - QF 0.000
1034 RIVERSIDE 4-7 3.435 1035 RIVERSIDE 8 4.500 876 ROBERTSVILLE 0.3541368 ROCKY GORGE U5 0.182 906 ROLLINSFORD HYDRO 1.500 11424 RUMFORD FALLS 31.686
928 SALMON BROOK STATION 3 0.093 883 SALMON FALLS HYDRO 0.327 808 SANDY HOOK HYDRO 0.07714383 SBER ROYAL MILLS LLC 0.000 877 SCOTLAND 1.674 561 SEARSBURG 4.960
761 SHAWMUT 9.500 565 SHELDON SPRINGS 14.832 737 SIMPSON G LOAD REDUCER 1.924878 SKINNER 0.280 845 SLACK DAM 0.230 570 SMITH 13.066822 SMITH (CVPS) 0.478 852 SOUTH BARRE HYDRO 0.087 1267 SPARHAWK 0.000909 STEELS POND HYDRO 0.187 885 STEVENS MILL 0.225 898 SUGAR RIVER HYDRO 0.054889 SUNAPEE HYDRO 0.109 912 SUNNYBROOK HYDRO 1 0.015 935 SUNNYBROOK HYDRO 2 0.050884 SWANS FALLS 0.410 10409 SWEETWATER HYDRO U5 0.081 1678 SYSKO GARDNER BROOK U5 0.014
1270 SYSKO STONY BROOK 0.012 1271 SYSKO WIGHT BROOK 0.025 817 TAFTSVILLE VT 0.121879 TAFTVILLE CT 2.025 1225 TANNERY DAM 0.000 803 TOUTANT 0.400826 TROY 0.000 813 TUNNEL 1.256 16089 Turners Falls Hydro 0.000
14937 Union Gas Station 1.500 831 VAIL & GREAT FALLS 2.100 949 VALLEY HYDRO - QF 0.0002435 VERGENNES HYDRO-NEW 1.630 14623 Valley Hydro (Station No. 5) 0.790 1048 WARE HYDRO 0.133
901 WATERLOOM FALLS 0.039 932 WATSON DAM 0.144 2291 WAVERLY AVENUE HYDRO 0.295853 WEBSTER HYDRO 0.000 825 WEST CHARLESTON 0.000 781 WEST DANVILLE 1 0.000616 WEST ENFIELD 7.472 893 WEST HOPKINTON HYDRO 0.549 10770 WEST SPRINGFIELD HYDRO U5 0.743617 WESTON 13.200 933 WESTON DAM 0.268 801 WILLIMANTIC 1 0.225802 WILLIMANTIC 2 0.225 622 WINOOSKI 1 7.300 846 WINOOSKI 8 0.374
1167 WOLCOTT HYDRO #1 0.467 847 WOODSIDE 0.080 10407 WOODSVILLE HYDRO U5 0.170903 WYANDOTTE HYDRO 0.084 15787 Woronoco Hydro LLC 2.125 2292 YORK HYDRO 0.878
Total Summer Capacity = 497.098
HYDRO (PUMPED STORAGE) 359 J. COCKWELL 1 288.475 360 J. COCKWELL 2 291.250 14217 NORTHFIELD MOUNTAIN 1 270.000
14218 NORTHFIELD MOUNTAIN 2 270.000 14219 NORTHFIELD MOUNTAIN 3 270.000 14220 NORTHFIELD MOUNTAIN 4 270.000739 ROCKY RIVER 29.350
Total Summer Capacity = 1689.075
HYDRO (WEEKLY CYCLE) 379 COBBLE MOUNTAIN 32.642 380 COMERFORD 144.884 405 ELLSWORTH HYDRO 9.097424 GREAT LAKES - MILLINOCKET 89.817 328 GULF ISLAND COMPOSITE 32.970 1168 H.K. SANDERS 0.000435 HARRIMAN 41.135 432 HARRIS 1 16.790 433 HARRIS 2 34.948434 HARRIS 3 34.210 757 HARRIS 4 1.436 783 HIGHGATE FALLS 9.082449 JACKMAN 2.363 774 LOWER LAMOILLE COMPOSITE 15.800 468 MARSHFIELD 6 HYDRO 0.000775 MIDDLEBURY COMPOSITE 6.600 496 MOORE 194.500 1062 MWRA COSGROVE 0.140776 N. RUTLAND COMPOSITE 5.200 772 NEWPORT HYDRO 3.400 566 SHEPAUG 41.511567 SHERMAN 6.334 587 STEVENSON 28.311 614 WATERBURY 22 2.400620 WILDER 41.160 848 WRIGHTSVILLE 0.698 636 WYMAN HYDRO 1 27.362

Section 3 - Capability by Fuel/Unit Type
NOTES: Gas/oil units are not necessarily be fully operable on both fuels. CELT Report - April 2009 Page 86 ISO New England Inc.
HYDRO (WEEKLY CYCLE) 637 WYMAN HYDRO 2 29.866 638 WYMAN HYDRO 3 25.728
Total Summer Capacity = 878.384
MISC. OTHER 11925 BROCKTON BRIGHTFIELDS 0.425 16234 Constellation-Majilite PV QF 0.375 11889 IBEW LOCAL 99 SOLAR QF 0.02910998 MASSINNOVATION FITCHBURG 0.004 16188 Wilson Holdings LLC - PV QF 0.135
Total Summer Capacity = 0.968
NUCLEAR STEAM 484 MILLSTONE POINT 2 876.923 485 MILLSTONE POINT 3 1137.483 537 PILGRIM NUCLEAR POWER STATION 677.284555 SEABROOK 1245.463 611 VT YANKEE NUCLEAR PWR 604.250
Total Summer Capacity = 4541.403
OIL COMBUSTION (GAS) TURBINE 329 ASCUTNEY GT 8.940 336 BERLIN 1 GT 40.651 355 BRANFORD 10 15.840341 BRIDGEPORT HARBOR 4 15.414 1028 BUNKER RD #12 GAS TURB 3.000 1029 BUNKER RD #13 GAS TURB 3.000363 BURLINGTON GT 17.970 367 CAPE GT 4 15.931 368 CAPE GT 5 15.822370 COS COB 10 19.497 371 COS COB 11 16.941 372 COS COB 12 18.461
14157 COS COB 13 19.201 14158 COS COB 14 11.716 396 DEVON 10 14.407399 DEVON 13 29.967 395 DOREEN 15.959 415 FLORENCE 1 CG 3.024416 FLORENCE 2 CG 2.924 417 FRAMINGHAM JET 1 10.310 418 FRAMINGHAM JET 2 9.914419 FRAMINGHAM JET 3 9.366 420 FRANKLIN DRIVE 10 15.417 452 KENDALL JET 1 16.563466 L STREET JET 16.030 464 LOST NATION 14.071 472 M STREET JET 38.884382 MERRIMACK CT1 16.826 383 MERRIMACK CT2 16.804 478 MIDDLETOWN 10 17.123503 MYSTIC JET 7.395 521 NORWALK HARBOR 10 (3) 11.925 515 NORWICH JET 15.255549 RUTLAND 5 GT 9.877 572 SO. MEADOW 11 35.781 573 SO. MEADOW 12 37.701574 SO. MEADOW 13 38.317 575 SO. MEADOW 14 36.746 579 SOMERSET JET 2 17.150583 STONY BROOK 2A 67.400 584 STONY BROOK 2B 65.300 595 TORRINGTON TERMINAL 10 15.638596 TUNNEL 10 16.962 11842 WATERSIDE POWER 71.218 625 WEST MEDWAY JET 1 32.301626 WEST MEDWAY JET 2 34.732 627 WEST MEDWAY JET 3 35.441 630 WEST SPRINGFIELD 10 17.215619 WHITE LAKE JET 17.447 628 WOODLAND ROAD 15.808
Total Summer Capacity = 1069.582
OIL INTERNAL COMBUSTION 332 BAR HARBOR DIESELS 1-4 4.100 959 BARTON 1-4 DIESELS 0.554 354 BRAYTON DIESELS 1-4 9.988
1024 BUNKER RD #1 DIESEL 0.000 1025 BUNKER RD #2 DIESEL 0.000 1026 BUNKER RD #3 DIESEL 0.0001027 BUNKER RD #4 DIESEL 0.000 2468 CHERRY 10 2.100 2469 CHERRY 11 2.1002470 CHERRY 12 5.000 2466 CHERRY 7 3.200 2467 CHERRY 8 3.4001044 COMMERCIAL ST 2 1.000 14820 Cytec 1 1.929 14821 Cytec 2 1.945
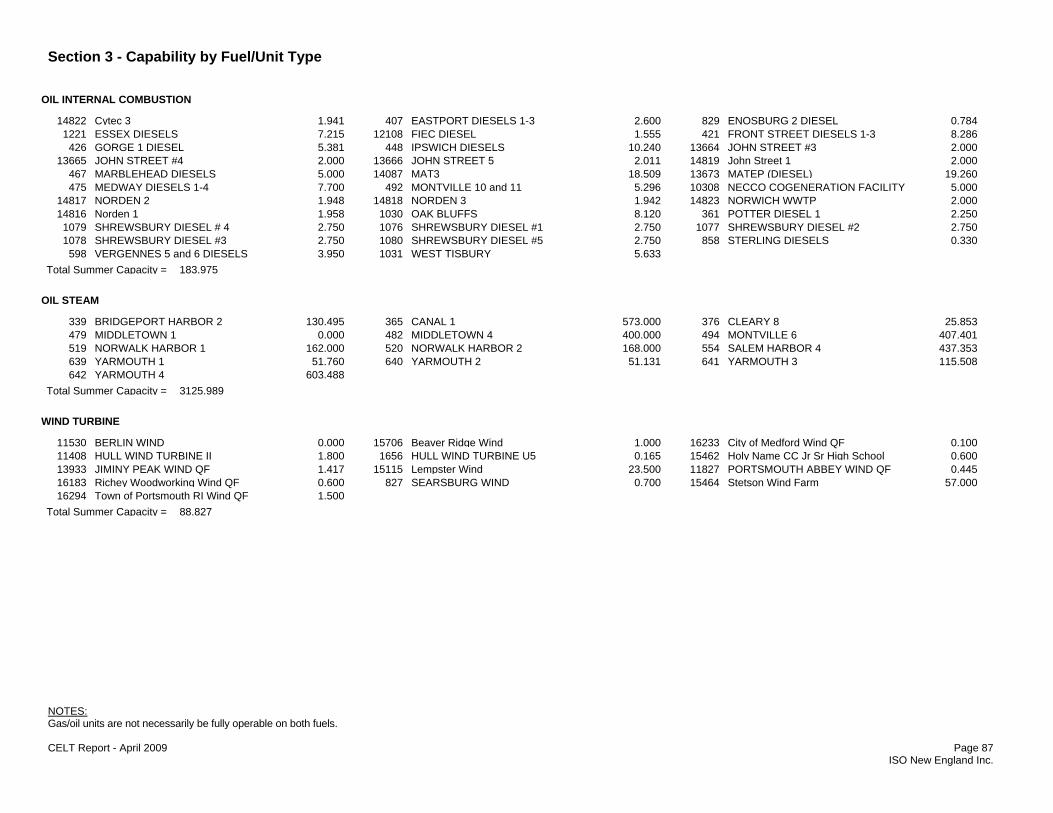
Section 3 - Capability by Fuel/Unit Type
NOTES: Gas/oil units are not necessarily be fully operable on both fuels. CELT Report - April 2009 Page 87 ISO New England Inc.
OIL INTERNAL COMBUSTION 14822 Cytec 3 1.941 407 EASTPORT DIESELS 1-3 2.600 829 ENOSBURG 2 DIESEL 0.784
1221 ESSEX DIESELS 7.215 12108 FIEC DIESEL 1.555 421 FRONT STREET DIESELS 1-3 8.286426 GORGE 1 DIESEL 5.381 448 IPSWICH DIESELS 10.240 13664 JOHN STREET #3 2.000
13665 JOHN STREET #4 2.000 13666 JOHN STREET 5 2.011 14819 John Street 1 2.000467 MARBLEHEAD DIESELS 5.000 14087 MAT3 18.509 13673 MATEP (DIESEL) 19.260475 MEDWAY DIESELS 1-4 7.700 492 MONTVILLE 10 and 11 5.296 10308 NECCO COGENERATION FACILITY 5.000
14817 NORDEN 2 1.948 14818 NORDEN 3 1.942 14823 NORWICH WWTP 2.00014816 Norden 1 1.958 1030 OAK BLUFFS 8.120 361 POTTER DIESEL 1 2.2501079 SHREWSBURY DIESEL # 4 2.750 1076 SHREWSBURY DIESEL #1 2.750 1077 SHREWSBURY DIESEL #2 2.7501078 SHREWSBURY DIESEL #3 2.750 1080 SHREWSBURY DIESEL #5 2.750 858 STERLING DIESELS 0.330
598 VERGENNES 5 and 6 DIESELS 3.950 1031 WEST TISBURY 5.633Total Summer Capacity = 183.975
OIL STEAM 339 BRIDGEPORT HARBOR 2 130.495 365 CANAL 1 573.000 376 CLEARY 8 25.853479 MIDDLETOWN 1 0.000 482 MIDDLETOWN 4 400.000 494 MONTVILLE 6 407.401519 NORWALK HARBOR 1 162.000 520 NORWALK HARBOR 2 168.000 554 SALEM HARBOR 4 437.353639 YARMOUTH 1 51.760 640 YARMOUTH 2 51.131 641 YARMOUTH 3 115.508642 YARMOUTH 4 603.488
Total Summer Capacity = 3125.989
WIND TURBINE 11530 BERLIN WIND 0.000 15706 Beaver Ridge Wind 1.000 16233 City of Medford Wind QF 0.10011408 HULL WIND TURBINE II 1.800 1656 HULL WIND TURBINE U5 0.165 15462 Holy Name CC Jr Sr High School 0.60013933 JIMINY PEAK WIND QF 1.417 15115 Lempster Wind 23.500 11827 PORTSMOUTH ABBEY WIND QF 0.44516183 Richey Woodworking Wind QF 0.600 827 SEARSBURG WIND 0.700 15464 Stetson Wind Farm 57.00016294 Town of Portsmouth RI Wind QF 1.500
Total Summer Capacity = 88.827
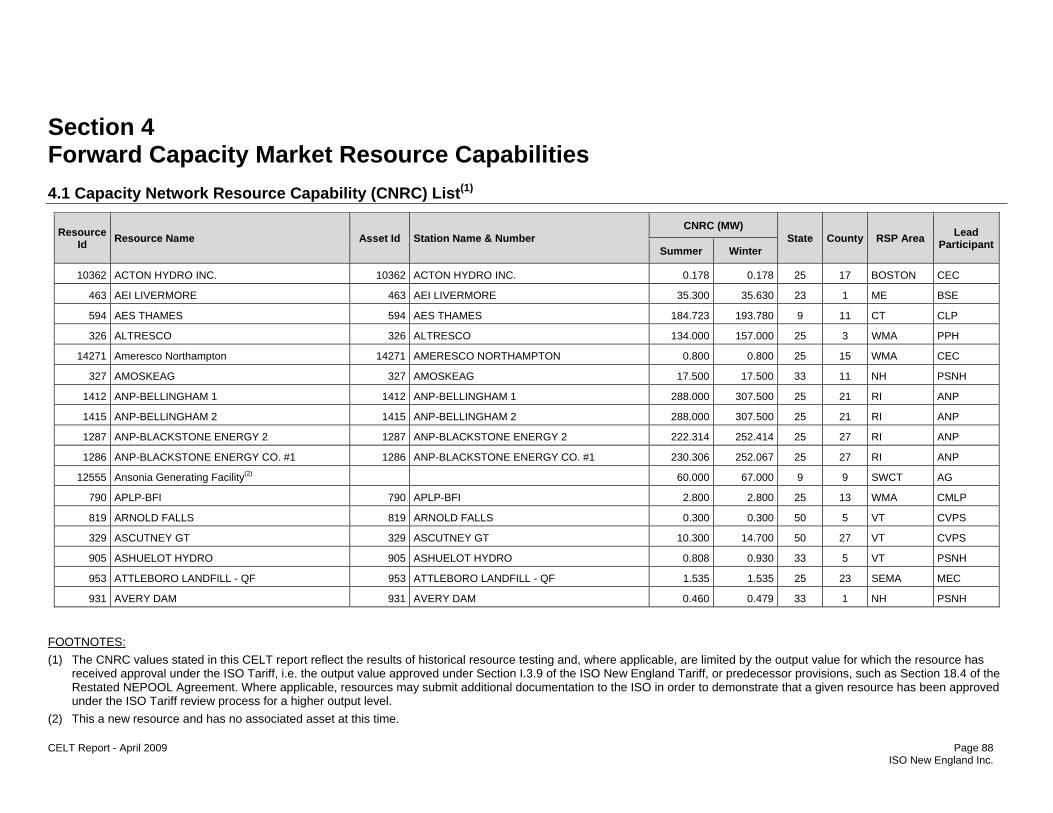
FOOTNOTES: (1) The CNRC values stated in this CELT report reflect the results of historical resource testing and, where applicable, are limited by the output value for which the resource has
received approval under the ISO Tariff, i.e. the output value approved under Section I.3.9 of the ISO New England Tariff, or predecessor provisions, such as Section 18.4 of the Restated NEPOOL Agreement. Where applicable, resources may submit additional documentation to the ISO in order to demonstrate that a given resource has been approved under the ISO Tariff review process for a higher output level.
(2) This a new resource and has no associated asset at this time. CELT Report - April 2009 Page 88 ISO New England Inc.
Section 4 Forward Capacity Market Resource Capabilities 4.1 Capacity Network Resource Capability (CNRC) List(1)
Resource Id Resource Name Asset Id Station Name & Number
CNRC (MW) State County RSP Area Lead
Participant Summer Winter
10362 ACTON HYDRO INC. 10362 ACTON HYDRO INC. 0.178 0.178 25 17 BOSTON CEC
463 AEI LIVERMORE 463 AEI LIVERMORE 35.300 35.630 23 1 ME BSE
594 AES THAMES 594 AES THAMES 184.723 193.780 9 11 CT CLP
326 ALTRESCO 326 ALTRESCO 134.000 157.000 25 3 WMA PPH
14271 Ameresco Northampton 14271 AMERESCO NORTHAMPTON 0.800 0.800 25 15 WMA CEC
327 AMOSKEAG 327 AMOSKEAG 17.500 17.500 33 11 NH PSNH
1412 ANP-BELLINGHAM 1 1412 ANP-BELLINGHAM 1 288.000 307.500 25 21 RI ANP
1415 ANP-BELLINGHAM 2 1415 ANP-BELLINGHAM 2 288.000 307.500 25 21 RI ANP
1287 ANP-BLACKSTONE ENERGY 2 1287 ANP-BLACKSTONE ENERGY 2 222.314 252.414 25 27 RI ANP
1286 ANP-BLACKSTONE ENERGY CO. #1 1286 ANP-BLACKSTONE ENERGY CO. #1 230.306 252.067 25 27 RI ANP
12555 Ansonia Generating Facility(2) 60.000 67.000 9 9 SWCT AG
790 APLP-BFI 790 APLP-BFI 2.800 2.800 25 13 WMA CMLP
819 ARNOLD FALLS 819 ARNOLD FALLS 0.300 0.300 50 5 VT CVPS
329 ASCUTNEY GT 329 ASCUTNEY GT 10.300 14.700 50 27 VT CVPS
905 ASHUELOT HYDRO 905 ASHUELOT HYDRO 0.808 0.930 33 5 VT PSNH
953 ATTLEBORO LANDFILL - QF 953 ATTLEBORO LANDFILL - QF 1.535 1.535 25 23 SEMA MEC
931 AVERY DAM 931 AVERY DAM 0.460 0.479 33 1 NH PSNH

Section 4 - Forward Capacity Market Resource Capabilities(1)
FOOTNOTES: (1) The CNRC values stated in this CELT report reflect the results of historical resource testing and, where applicable, are limited by the output value for which the resource has
received approval under the ISO Tariff, i.e. the output value approved under Section I.3.9 of the ISO New England Tariff, or predecessor provisions, such as Section 18.4 of the Restated NEPOOL Agreement. Where applicable, resources may submit additional documentation to the ISO in order to demonstrate that a given resource has been approved under the ISO Tariff review process for a higher output level.
(2) This a new resource and has no associated asset at this time. CELT Report - April 2009 Page 89 ISO New England Inc.
Resource Id Resource Name Asset Id Station Name & Number
CNRC (MW) State County RSP Area Lead
Participant Summer Winter
330 AYERS ISLAND 330 AYERS ISLAND 9.080 9.080 33 1 NH PSNH
331 AZISCOHOS HYDRO 331 AZISCOHOS HYDRO 6.810 6.810 23 19 ME FPL
951 BALTIC MILLS - QF 951 BALTIC MILLS - QF 0.104 0.104 33 9 NH SMED
811 BANTAM 811 BANTAM 0.320 0.320 9 5 CT FPRM
332 BAR HARBOR DIESELS 1-4 332 BAR HARBOR DIESELS 1-4 8.100 8.650 23 9 BHE CCG
754 BAR MILLS 754 BAR MILLS 4.000 4.000 23 31 SME FPLEMH
2278 BARKER LOWER HYDRO 2278 BARKER LOWER HYDRO 0.652 1.250 23 1 ME RMHP
2279 BARKER UPPER HYDRO 2279 BARKER UPPER HYDRO 0.377 1.262 23 1 ME RMHP
833 BARNET 833 BARNET 0.350 0.490 50 5 NH CVPS
1059 BARRE LANDFILL 1059 BARRE LANDFILL 0.964 0.964 25 27 WMA DEM
959 BARTON 1-4 DIESELS 959 BARTON 1-4 DIESELS 4.400 4.400 50 19 NH VPPSA
828 BARTON HYDRO 828 BARTON HYDRO 1.300 1.300 50 19 NH VPPSA
824 BATH ELECTRIC HYDRO 824 BATH ELECTRIC HYDRO 0.400 0.800 33 9 NH PSNH
812 BEEBE HOLBROOK 812 BEEBE HOLBROOK 0.586 0.586 25 13 WMA HGE
2430 BELDENS-NEW 2430 BELDENS-NEW 4.580 5.700 50 1 VT VMC
907 BELL MILL/ELM ST. HYDRO 907 BELL MILL/ELM ST. HYDRO 0.111 0.078 33 11 NH PSNH
335 BELLOWS FALLS 335 BELLOWS FALLS 48.840 48.540 50 25 VT TCPM
2280 BENTON FALLS HYDRO 2280 BENTON FALLS HYDRO 3.776 4.355 23 11 ME LELWD
12180 BERKSHIRE COW POWER 12180 BERKSHIRE COW POWER 0.500 0.500 50 11 VT VEC
1086 BERKSHIRE POWER 1086 BERKSHIRE POWER 267.000 284.000 25 13 WMA SENA
14661 Berkshire Wind Power Project(2) 2.576 6.988 25 3 WMA MMWEC
336 BERLIN 1 GT 336 BERLIN 1 GT 41.200 58.000 50 23 VT GMP
11530 BERLIN WIND 11530 BERLIN WIND 0.571 0.571 33 7 NH PSNH
337 BETHLEHEM 337 BETHLEHEM 15.750 15.700 33 7 NH PSNH
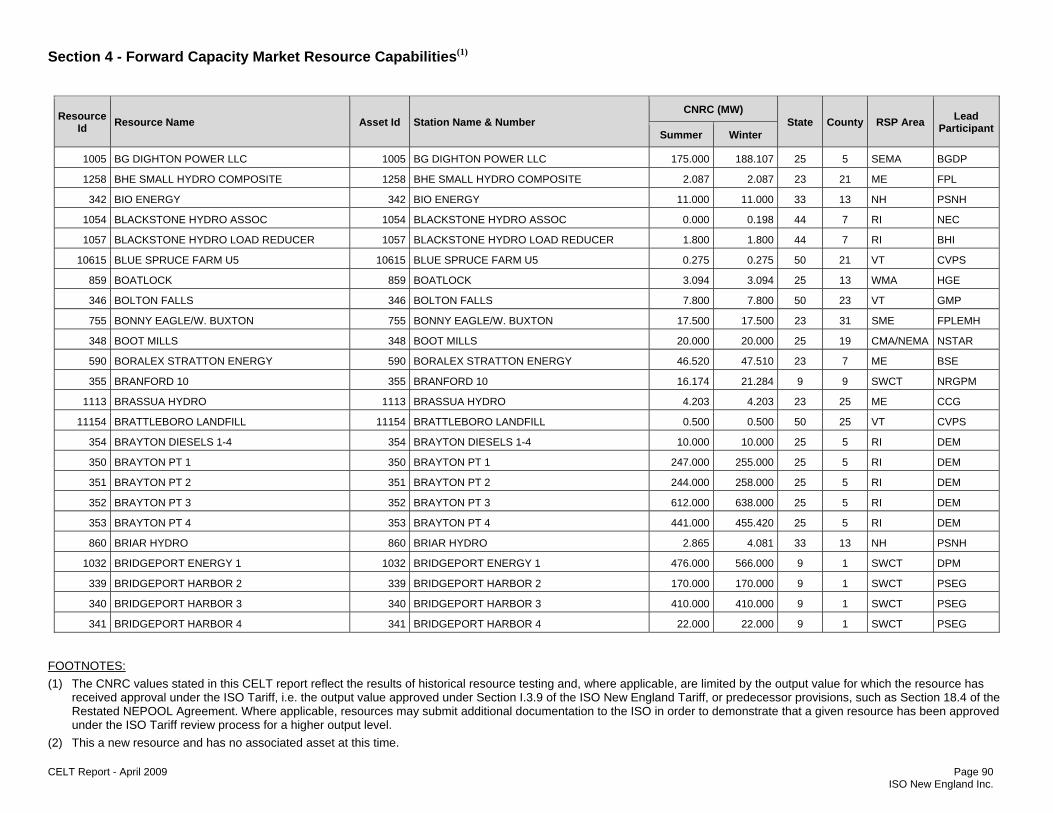
Section 4 - Forward Capacity Market Resource Capabilities(1)
FOOTNOTES: (1) The CNRC values stated in this CELT report reflect the results of historical resource testing and, where applicable, are limited by the output value for which the resource has
received approval under the ISO Tariff, i.e. the output value approved under Section I.3.9 of the ISO New England Tariff, or predecessor provisions, such as Section 18.4 of the Restated NEPOOL Agreement. Where applicable, resources may submit additional documentation to the ISO in order to demonstrate that a given resource has been approved under the ISO Tariff review process for a higher output level.
(2) This a new resource and has no associated asset at this time. CELT Report - April 2009 Page 90 ISO New England Inc.
Resource Id Resource Name Asset Id Station Name & Number
CNRC (MW) State County RSP Area Lead
Participant Summer Winter
1005 BG DIGHTON POWER LLC 1005 BG DIGHTON POWER LLC 175.000 188.107 25 5 SEMA BGDP
1258 BHE SMALL HYDRO COMPOSITE 1258 BHE SMALL HYDRO COMPOSITE 2.087 2.087 23 21 ME FPL
342 BIO ENERGY 342 BIO ENERGY 11.000 11.000 33 13 NH PSNH
1054 BLACKSTONE HYDRO ASSOC 1054 BLACKSTONE HYDRO ASSOC 0.000 0.198 44 7 RI NEC
1057 BLACKSTONE HYDRO LOAD REDUCER 1057 BLACKSTONE HYDRO LOAD REDUCER 1.800 1.800 44 7 RI BHI
10615 BLUE SPRUCE FARM U5 10615 BLUE SPRUCE FARM U5 0.275 0.275 50 21 VT CVPS
859 BOATLOCK 859 BOATLOCK 3.094 3.094 25 13 WMA HGE
346 BOLTON FALLS 346 BOLTON FALLS 7.800 7.800 50 23 VT GMP
755 BONNY EAGLE/W. BUXTON 755 BONNY EAGLE/W. BUXTON 17.500 17.500 23 31 SME FPLEMH
348 BOOT MILLS 348 BOOT MILLS 20.000 20.000 25 19 CMA/NEMA NSTAR
590 BORALEX STRATTON ENERGY 590 BORALEX STRATTON ENERGY 46.520 47.510 23 7 ME BSE
355 BRANFORD 10 355 BRANFORD 10 16.174 21.284 9 9 SWCT NRGPM
1113 BRASSUA HYDRO 1113 BRASSUA HYDRO 4.203 4.203 23 25 ME CCG
11154 BRATTLEBORO LANDFILL 11154 BRATTLEBORO LANDFILL 0.500 0.500 50 25 VT CVPS
354 BRAYTON DIESELS 1-4 354 BRAYTON DIESELS 1-4 10.000 10.000 25 5 RI DEM
350 BRAYTON PT 1 350 BRAYTON PT 1 247.000 255.000 25 5 RI DEM
351 BRAYTON PT 2 351 BRAYTON PT 2 244.000 258.000 25 5 RI DEM
352 BRAYTON PT 3 352 BRAYTON PT 3 612.000 638.000 25 5 RI DEM
353 BRAYTON PT 4 353 BRAYTON PT 4 441.000 455.420 25 5 RI DEM
860 BRIAR HYDRO 860 BRIAR HYDRO 2.865 4.081 33 13 NH PSNH
1032 BRIDGEPORT ENERGY 1 1032 BRIDGEPORT ENERGY 1 476.000 566.000 9 1 SWCT DPM
339 BRIDGEPORT HARBOR 2 339 BRIDGEPORT HARBOR 2 170.000 170.000 9 1 SWCT PSEG
340 BRIDGEPORT HARBOR 3 340 BRIDGEPORT HARBOR 3 410.000 410.000 9 1 SWCT PSEG
341 BRIDGEPORT HARBOR 4 341 BRIDGEPORT HARBOR 4 22.000 22.000 9 1 SWCT PSEG

Section 4 - Forward Capacity Market Resource Capabilities(1)
FOOTNOTES: (1) The CNRC values stated in this CELT report reflect the results of historical resource testing and, where applicable, are limited by the output value for which the resource has
received approval under the ISO Tariff, i.e. the output value approved under Section I.3.9 of the ISO New England Tariff, or predecessor provisions, such as Section 18.4 of the Restated NEPOOL Agreement. Where applicable, resources may submit additional documentation to the ISO in order to demonstrate that a given resource has been approved under the ISO Tariff review process for a higher output level.
(2) This a new resource and has no associated asset at this time. CELT Report - April 2009 Page 91 ISO New England Inc.
Resource Id Resource Name Asset Id Station Name & Number
CNRC (MW) State County RSP Area Lead
Participant Summer Winter
357 BRIDGEWATER 357 BRIDGEWATER 15.750 15.701 33 9 NH CCG
356 BRISTOL REFUSE 356 BRISTOL REFUSE 13.517 13.578 9 3 CT CLP
11925 BROCKTON BRIGHTFIELDS 11925 BROCKTON BRIGHTFIELDS 0.425 0.425 25 23 SEMA CCG
2439 BROCKWAY MILLS U5 2439 BROCKWAY MILLS U5 0.500 0.500 50 25 VT GMP
2281 BROWNS MILL HYDRO 2281 BROWNS MILL HYDRO 0.318 0.650 23 21 ME RMHP
358 BRUNSWICK 358 BRUNSWICK 20.200 20.200 23 5 ME FPLEMH
1288 BUCKSPORT ENERGY 4 1288 BUCKSPORT ENERGY 4 168.500 185.700 23 9 BHE HQE
362 BULLS BRIDGE 362 BULLS BRIDGE 8.400 8.400 9 5 SWCT FPRM
1024 BUNKER RD #1 DIESEL 1024 BUNKER RD #1 DIESEL 0.000 0.000 25 19 SEMA NEP
1028 BUNKER RD #12 GAS TURB 1028 BUNKER RD #12 GAS TURB 3.000 3.700 25 19 SEMA NEP
1029 BUNKER RD #13 GAS TURB 1029 BUNKER RD #13 GAS TURB 3.000 3.700 25 19 SEMA NEP
1025 BUNKER RD #2 DIESEL 1025 BUNKER RD #2 DIESEL 0.000 0.000 25 19 SEMA NEP
1026 BUNKER RD #3 DIESEL 1026 BUNKER RD #3 DIESEL 0.000 0.000 25 19 SEMA NEP
1027 BUNKER RD #4 DIESEL 1027 BUNKER RD #4 DIESEL 0.000 0.000 25 19 SEMA NEP
363 BURLINGTON GT 363 BURLINGTON GT 20.378 25.000 50 7 VT BED
766 CABOT/TURNERS FALLS 1480114808
Cabot TURNERSFALLS 68.200 68.200 25 11 WMA FPRM
1165 CADYS FALLS 1165 CADYS FALLS 1.100 1.100 50 17 VT VPPSA
910 CAMPTON DAM 910 CAMPTON DAM 0.416 0.233 33 9 NH PSNH
861 CANAAN 861 CANAAN 1.100 1.100 50 9 NH PSNH
365 CANAL 1 365 CANAL 1 573.000 573.000 25 1 SEMA MET
366 CANAL 2 366 CANAL 2 576.370 586.000 25 1 SEMA MET
367 CAPE GT 4 367 CAPE GT 4 16.500 20.716 23 5 SME FPL
368 CAPE GT 5 368 CAPE GT 5 16.350 20.760 23 5 SME FPL
815 CARVER FALLS 815 CARVER FALLS 1.480 1.900 50 21 VT CVPS

Section 4 - Forward Capacity Market Resource Capabilities(1)
FOOTNOTES: (1) The CNRC values stated in this CELT report reflect the results of historical resource testing and, where applicable, are limited by the output value for which the resource has
received approval under the ISO Tariff, i.e. the output value approved under Section I.3.9 of the ISO New England Tariff, or predecessor provisions, such as Section 18.4 of the Restated NEPOOL Agreement. Where applicable, resources may submit additional documentation to the ISO in order to demonstrate that a given resource has been approved under the ISO Tariff review process for a higher output level.
(2) This a new resource and has no associated asset at this time. CELT Report - April 2009 Page 92 ISO New England Inc.
Resource Id Resource Name Asset Id Station Name & Number
CNRC (MW) State County RSP Area Lead
Participant Summer Winter
1122 CASCADE-DIAMOND-QF 1122 CASCADE-DIAMOND-QF 0.440 0.440 25 13 WMA MEC
369 CATARACT EAST 369 CATARACT EAST 8.900 8.900 23 31 SME FPLEMH
816 CAVENDISH 816 CAVENDISH 1.180 1.428 50 27 VT CVPS
324 CDECCA 324 CDECCA 55.254 61.334 9 3 CT PPH
789 CEC 002 PAWTUCKET U5 789 CEC 002 PAWTUCKET U5 1.200 1.240 44 7 RI NEC
797 CEC 003 WYRE WYND U5 797 CEC 003 WYRE WYND U5 1.800 2.780 9 11 CT SUMMIT
807 CEC 004 DAYVILLE POND U5 807 CEC 004 DAYVILLE POND U5 0.061 0.100 9 15 CT CLP
10401 CELLEY MILL U5 10401 CELLEY MILL U5 0.084 0.092 33 9 NH PSNH
792 CENTENNIAL HYDRO 792 CENTENNIAL HYDRO 0.64 0.790 25 19 BOSTON LELWD
832 CENTER RUTLAND 832 CENTER RUTLAND 0.350 0.350 50 21 VT VMC
914 CHAMBERLAIN FALLS 914 CHAMBERLAIN FALLS 0.123 0.094 33 11 NH PSNH
1108 CHAMPION 1108 CHAMPION 0.000 0.000 23 9 BHE FPL
862 CHEMICAL 862 CHEMICAL 1.600 1.600 25 13 WMA HGE
2468 CHERRY 10 2468 CHERRY 10 2.200 2.200 25 17 CMA/NEMA HLPD
2469 CHERRY 11 2469 CHERRY 11 2.200 2.200 25 17 CMA/NEMA HLPD
2470 CHERRY 12 2470 CHERRY 12 5.600 5.600 25 17 CMA/NEMA HLPD
2466 CHERRY 7 2466 CHERRY 7 19.600 19.600 25 17 CMA/NEMA HLPD
2467 CHERRY 8 2467 CHERRY 8 3.600 3.600 25 17 CMA/NEMA HLPD
1050 CHICOPEE HYDRO 1050 CHICOPEE HYDRO 2.170 2.600 25 13 WMA NSTAR
887 CHINA MILLS DAM 887 CHINA MILLS DAM 0.711 0.711 33 13 NH PSNH
376 CLEARY 8 376 CLEARY 8 26.000 26.000 25 5 SEMA TMLP
375 CLEARY 9/9A CC 375 CLEARY 9/9A CC 105.000 110.000 25 5 SEMA TMLP
863 CLEMENT DAM 863 CLEMENT DAM 1.115 2.400 33 1 NH PSNH
379 COBBLE MOUNTAIN 379 COBBLE MOUNTAIN 33.990 33.960 25 13 WMA HGE
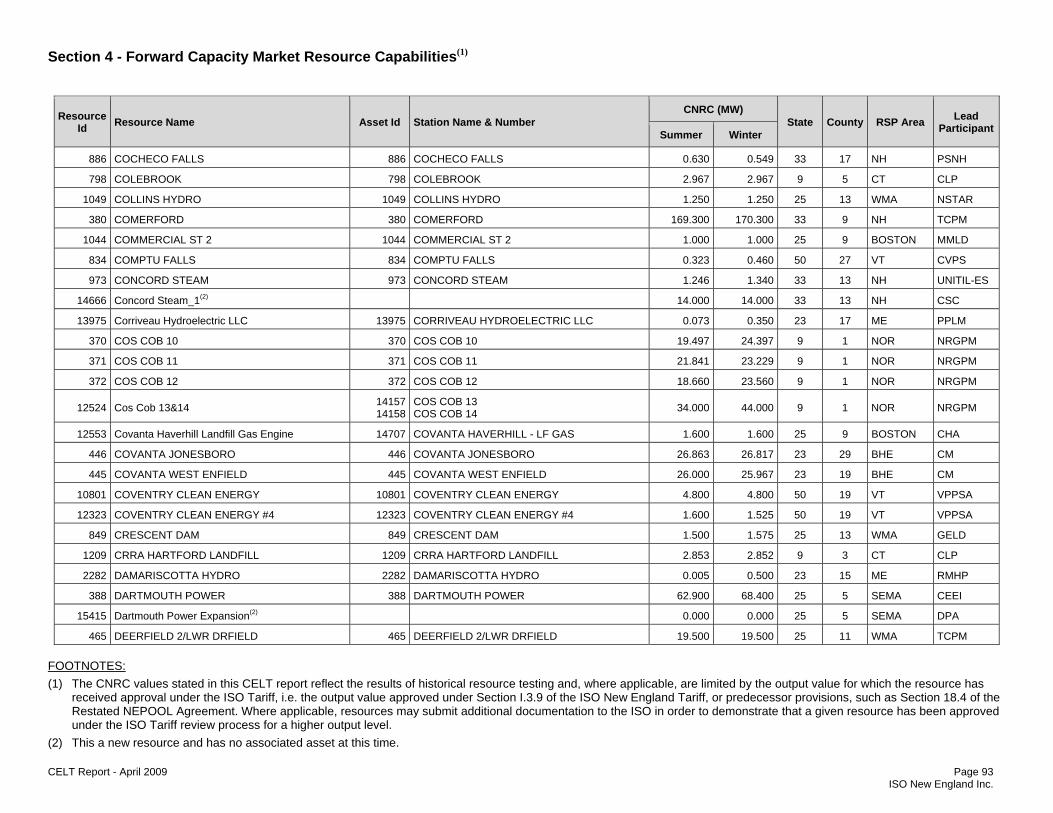
Section 4 - Forward Capacity Market Resource Capabilities(1)
FOOTNOTES: (1) The CNRC values stated in this CELT report reflect the results of historical resource testing and, where applicable, are limited by the output value for which the resource has
received approval under the ISO Tariff, i.e. the output value approved under Section I.3.9 of the ISO New England Tariff, or predecessor provisions, such as Section 18.4 of the Restated NEPOOL Agreement. Where applicable, resources may submit additional documentation to the ISO in order to demonstrate that a given resource has been approved under the ISO Tariff review process for a higher output level.
(2) This a new resource and has no associated asset at this time. CELT Report - April 2009 Page 93 ISO New England Inc.
Resource Id Resource Name Asset Id Station Name & Number
CNRC (MW) State County RSP Area Lead
Participant Summer Winter
886 COCHECO FALLS 886 COCHECO FALLS 0.630 0.549 33 17 NH PSNH
798 COLEBROOK 798 COLEBROOK 2.967 2.967 9 5 CT CLP
1049 COLLINS HYDRO 1049 COLLINS HYDRO 1.250 1.250 25 13 WMA NSTAR
380 COMERFORD 380 COMERFORD 169.300 170.300 33 9 NH TCPM
1044 COMMERCIAL ST 2 1044 COMMERCIAL ST 2 1.000 1.000 25 9 BOSTON MMLD
834 COMPTU FALLS 834 COMPTU FALLS 0.323 0.460 50 27 VT CVPS
973 CONCORD STEAM 973 CONCORD STEAM 1.246 1.340 33 13 NH UNITIL-ES
14666 Concord Steam_1(2) 14.000 14.000 33 13 NH CSC
13975 Corriveau Hydroelectric LLC 13975 CORRIVEAU HYDROELECTRIC LLC 0.073 0.350 23 17 ME PPLM
370 COS COB 10 370 COS COB 10 19.497 24.397 9 1 NOR NRGPM
371 COS COB 11 371 COS COB 11 21.841 23.229 9 1 NOR NRGPM
372 COS COB 12 372 COS COB 12 18.660 23.560 9 1 NOR NRGPM
12524 Cos Cob 13&14 1415714158
COS COB 13 COS COB 14 34.000 44.000 9 1 NOR NRGPM
12553 Covanta Haverhill Landfill Gas Engine 14707 COVANTA HAVERHILL - LF GAS 1.600 1.600 25 9 BOSTON CHA
446 COVANTA JONESBORO 446 COVANTA JONESBORO 26.863 26.817 23 29 BHE CM
445 COVANTA WEST ENFIELD 445 COVANTA WEST ENFIELD 26.000 25.967 23 19 BHE CM
10801 COVENTRY CLEAN ENERGY 10801 COVENTRY CLEAN ENERGY 4.800 4.800 50 19 VT VPPSA
12323 COVENTRY CLEAN ENERGY #4 12323 COVENTRY CLEAN ENERGY #4 1.600 1.525 50 19 VT VPPSA
849 CRESCENT DAM 849 CRESCENT DAM 1.500 1.575 25 13 WMA GELD
1209 CRRA HARTFORD LANDFILL 1209 CRRA HARTFORD LANDFILL 2.853 2.852 9 3 CT CLP
2282 DAMARISCOTTA HYDRO 2282 DAMARISCOTTA HYDRO 0.005 0.500 23 15 ME RMHP
388 DARTMOUTH POWER 388 DARTMOUTH POWER 62.900 68.400 25 5 SEMA CEEI
15415 Dartmouth Power Expansion(2) 0.000 0.000 25 5 SEMA DPA
465 DEERFIELD 2/LWR DRFIELD 465 DEERFIELD 2/LWR DRFIELD 19.500 19.500 25 11 WMA TCPM
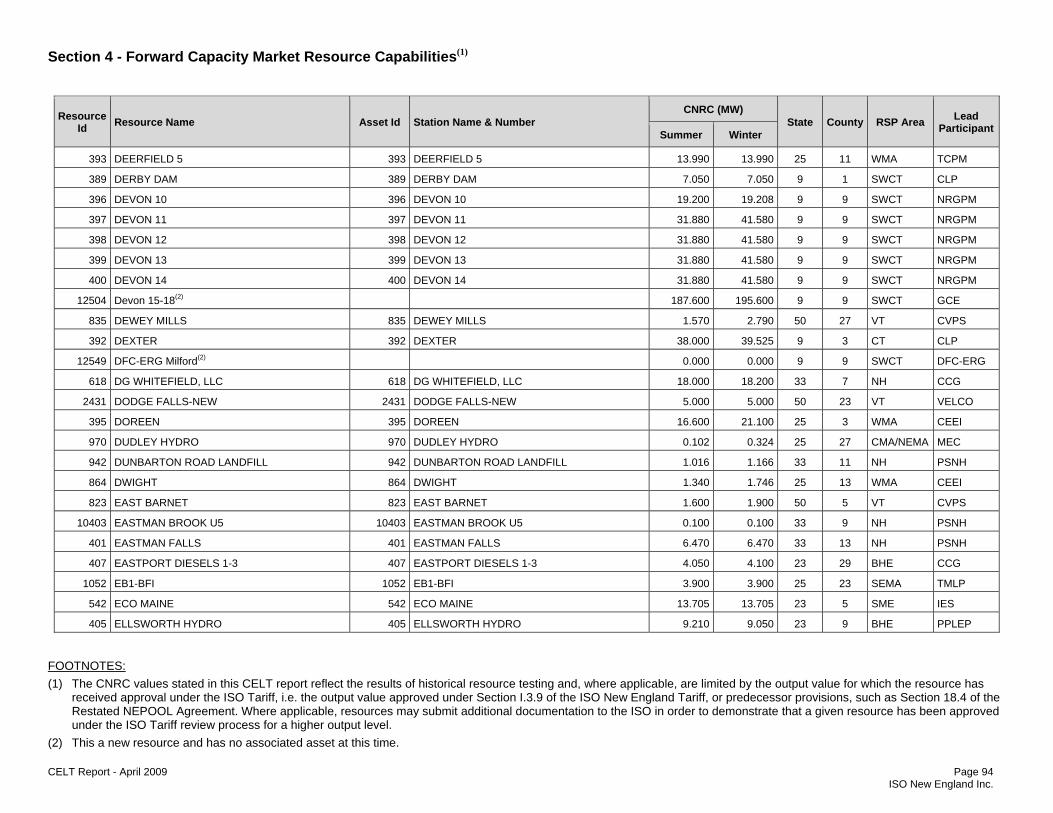
Section 4 - Forward Capacity Market Resource Capabilities(1)
FOOTNOTES: (1) The CNRC values stated in this CELT report reflect the results of historical resource testing and, where applicable, are limited by the output value for which the resource has
received approval under the ISO Tariff, i.e. the output value approved under Section I.3.9 of the ISO New England Tariff, or predecessor provisions, such as Section 18.4 of the Restated NEPOOL Agreement. Where applicable, resources may submit additional documentation to the ISO in order to demonstrate that a given resource has been approved under the ISO Tariff review process for a higher output level.
(2) This a new resource and has no associated asset at this time. CELT Report - April 2009 Page 94 ISO New England Inc.
Resource Id Resource Name Asset Id Station Name & Number
CNRC (MW) State County RSP Area Lead
Participant Summer Winter
393 DEERFIELD 5 393 DEERFIELD 5 13.990 13.990 25 11 WMA TCPM
389 DERBY DAM 389 DERBY DAM 7.050 7.050 9 1 SWCT CLP
396 DEVON 10 396 DEVON 10 19.200 19.208 9 9 SWCT NRGPM
397 DEVON 11 397 DEVON 11 31.880 41.580 9 9 SWCT NRGPM
398 DEVON 12 398 DEVON 12 31.880 41.580 9 9 SWCT NRGPM
399 DEVON 13 399 DEVON 13 31.880 41.580 9 9 SWCT NRGPM
400 DEVON 14 400 DEVON 14 31.880 41.580 9 9 SWCT NRGPM
12504 Devon 15-18(2) 187.600 195.600 9 9 SWCT GCE
835 DEWEY MILLS 835 DEWEY MILLS 1.570 2.790 50 27 VT CVPS
392 DEXTER 392 DEXTER 38.000 39.525 9 3 CT CLP
12549 DFC-ERG Milford(2) 0.000 0.000 9 9 SWCT DFC-ERG
618 DG WHITEFIELD, LLC 618 DG WHITEFIELD, LLC 18.000 18.200 33 7 NH CCG
2431 DODGE FALLS-NEW 2431 DODGE FALLS-NEW 5.000 5.000 50 23 VT VELCO
395 DOREEN 395 DOREEN 16.600 21.100 25 3 WMA CEEI
970 DUDLEY HYDRO 970 DUDLEY HYDRO 0.102 0.324 25 27 CMA/NEMA MEC
942 DUNBARTON ROAD LANDFILL 942 DUNBARTON ROAD LANDFILL 1.016 1.166 33 11 NH PSNH
864 DWIGHT 864 DWIGHT 1.340 1.746 25 13 WMA CEEI
823 EAST BARNET 823 EAST BARNET 1.600 1.900 50 5 VT CVPS
10403 EASTMAN BROOK U5 10403 EASTMAN BROOK U5 0.100 0.100 33 9 NH PSNH
401 EASTMAN FALLS 401 EASTMAN FALLS 6.470 6.470 33 13 NH PSNH
407 EASTPORT DIESELS 1-3 407 EASTPORT DIESELS 1-3 4.050 4.100 23 29 BHE CCG
1052 EB1-BFI 1052 EB1-BFI 3.900 3.900 25 23 SEMA TMLP
542 ECO MAINE 542 ECO MAINE 13.705 13.705 23 5 SME IES
405 ELLSWORTH HYDRO 405 ELLSWORTH HYDRO 9.210 9.050 23 9 BHE PPLEP
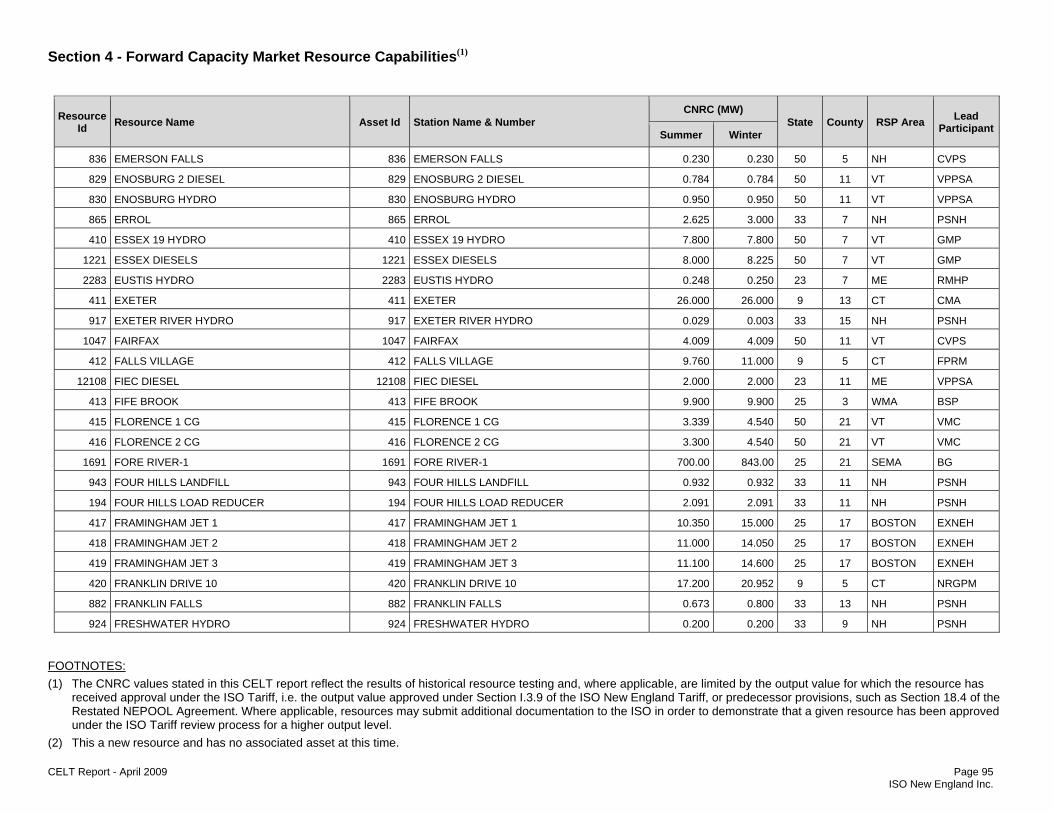
Section 4 - Forward Capacity Market Resource Capabilities(1)
FOOTNOTES: (1) The CNRC values stated in this CELT report reflect the results of historical resource testing and, where applicable, are limited by the output value for which the resource has
received approval under the ISO Tariff, i.e. the output value approved under Section I.3.9 of the ISO New England Tariff, or predecessor provisions, such as Section 18.4 of the Restated NEPOOL Agreement. Where applicable, resources may submit additional documentation to the ISO in order to demonstrate that a given resource has been approved under the ISO Tariff review process for a higher output level.
(2) This a new resource and has no associated asset at this time. CELT Report - April 2009 Page 95 ISO New England Inc.
Resource Id Resource Name Asset Id Station Name & Number
CNRC (MW) State County RSP Area Lead
Participant Summer Winter
836 EMERSON FALLS 836 EMERSON FALLS 0.230 0.230 50 5 NH CVPS
829 ENOSBURG 2 DIESEL 829 ENOSBURG 2 DIESEL 0.784 0.784 50 11 VT VPPSA
830 ENOSBURG HYDRO 830 ENOSBURG HYDRO 0.950 0.950 50 11 VT VPPSA
865 ERROL 865 ERROL 2.625 3.000 33 7 NH PSNH
410 ESSEX 19 HYDRO 410 ESSEX 19 HYDRO 7.800 7.800 50 7 VT GMP
1221 ESSEX DIESELS 1221 ESSEX DIESELS 8.000 8.225 50 7 VT GMP
2283 EUSTIS HYDRO 2283 EUSTIS HYDRO 0.248 0.250 23 7 ME RMHP
411 EXETER 411 EXETER 26.000 26.000 9 13 CT CMA
917 EXETER RIVER HYDRO 917 EXETER RIVER HYDRO 0.029 0.003 33 15 NH PSNH
1047 FAIRFAX 1047 FAIRFAX 4.009 4.009 50 11 VT CVPS
412 FALLS VILLAGE 412 FALLS VILLAGE 9.760 11.000 9 5 CT FPRM
12108 FIEC DIESEL 12108 FIEC DIESEL 2.000 2.000 23 11 ME VPPSA
413 FIFE BROOK 413 FIFE BROOK 9.900 9.900 25 3 WMA BSP
415 FLORENCE 1 CG 415 FLORENCE 1 CG 3.339 4.540 50 21 VT VMC
416 FLORENCE 2 CG 416 FLORENCE 2 CG 3.300 4.540 50 21 VT VMC
1691 FORE RIVER-1 1691 FORE RIVER-1 700.00 843.00 25 21 SEMA BG
943 FOUR HILLS LANDFILL 943 FOUR HILLS LANDFILL 0.932 0.932 33 11 NH PSNH
194 FOUR HILLS LOAD REDUCER 194 FOUR HILLS LOAD REDUCER 2.091 2.091 33 11 NH PSNH
417 FRAMINGHAM JET 1 417 FRAMINGHAM JET 1 10.350 15.000 25 17 BOSTON EXNEH
418 FRAMINGHAM JET 2 418 FRAMINGHAM JET 2 11.000 14.050 25 17 BOSTON EXNEH
419 FRAMINGHAM JET 3 419 FRAMINGHAM JET 3 11.100 14.600 25 17 BOSTON EXNEH
420 FRANKLIN DRIVE 10 420 FRANKLIN DRIVE 10 17.200 20.952 9 5 CT NRGPM
882 FRANKLIN FALLS 882 FRANKLIN FALLS 0.673 0.800 33 13 NH PSNH
924 FRESHWATER HYDRO 924 FRESHWATER HYDRO 0.200 0.200 33 9 NH PSNH
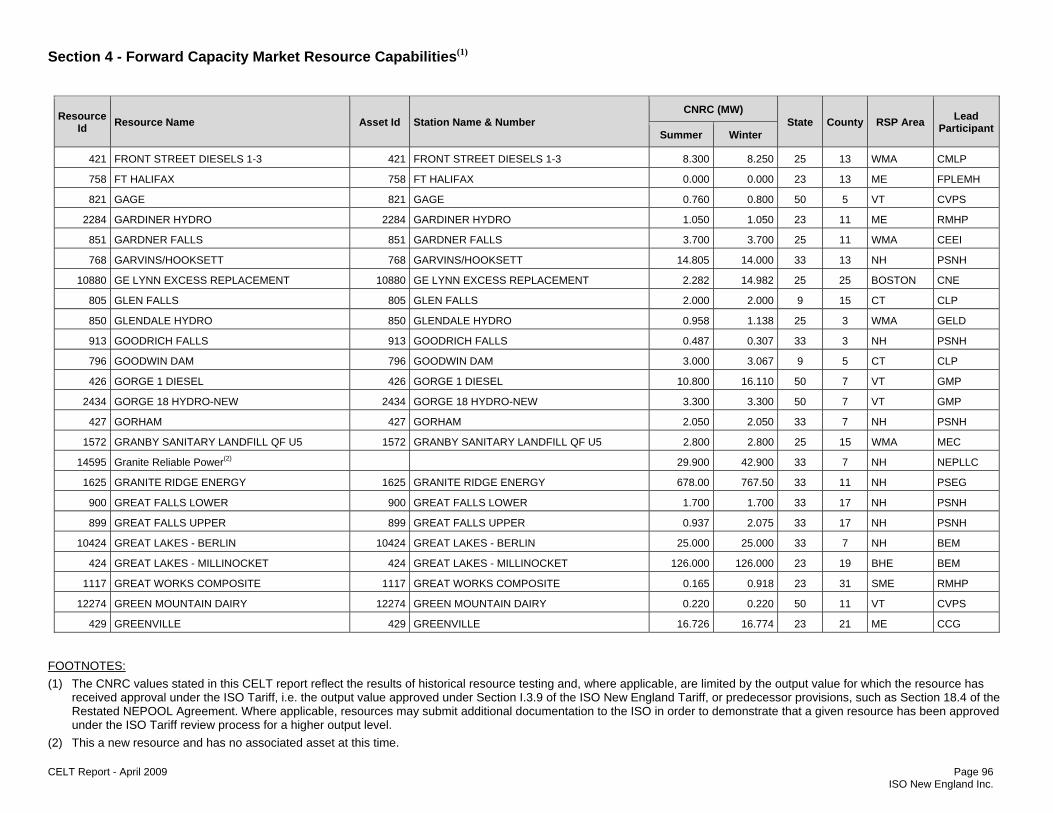
Section 4 - Forward Capacity Market Resource Capabilities(1)
FOOTNOTES: (1) The CNRC values stated in this CELT report reflect the results of historical resource testing and, where applicable, are limited by the output value for which the resource has
received approval under the ISO Tariff, i.e. the output value approved under Section I.3.9 of the ISO New England Tariff, or predecessor provisions, such as Section 18.4 of the Restated NEPOOL Agreement. Where applicable, resources may submit additional documentation to the ISO in order to demonstrate that a given resource has been approved under the ISO Tariff review process for a higher output level.
(2) This a new resource and has no associated asset at this time. CELT Report - April 2009 Page 96 ISO New England Inc.
Resource Id Resource Name Asset Id Station Name & Number
CNRC (MW) State County RSP Area Lead
Participant Summer Winter
421 FRONT STREET DIESELS 1-3 421 FRONT STREET DIESELS 1-3 8.300 8.250 25 13 WMA CMLP
758 FT HALIFAX 758 FT HALIFAX 0.000 0.000 23 13 ME FPLEMH
821 GAGE 821 GAGE 0.760 0.800 50 5 VT CVPS
2284 GARDINER HYDRO 2284 GARDINER HYDRO 1.050 1.050 23 11 ME RMHP
851 GARDNER FALLS 851 GARDNER FALLS 3.700 3.700 25 11 WMA CEEI
768 GARVINS/HOOKSETT 768 GARVINS/HOOKSETT 14.805 14.000 33 13 NH PSNH
10880 GE LYNN EXCESS REPLACEMENT 10880 GE LYNN EXCESS REPLACEMENT 2.282 14.982 25 25 BOSTON CNE
805 GLEN FALLS 805 GLEN FALLS 2.000 2.000 9 15 CT CLP
850 GLENDALE HYDRO 850 GLENDALE HYDRO 0.958 1.138 25 3 WMA GELD
913 GOODRICH FALLS 913 GOODRICH FALLS 0.487 0.307 33 3 NH PSNH
796 GOODWIN DAM 796 GOODWIN DAM 3.000 3.067 9 5 CT CLP
426 GORGE 1 DIESEL 426 GORGE 1 DIESEL 10.800 16.110 50 7 VT GMP
2434 GORGE 18 HYDRO-NEW 2434 GORGE 18 HYDRO-NEW 3.300 3.300 50 7 VT GMP
427 GORHAM 427 GORHAM 2.050 2.050 33 7 NH PSNH
1572 GRANBY SANITARY LANDFILL QF U5 1572 GRANBY SANITARY LANDFILL QF U5 2.800 2.800 25 15 WMA MEC
14595 Granite Reliable Power(2) 29.900 42.900 33 7 NH NEPLLC
1625 GRANITE RIDGE ENERGY 1625 GRANITE RIDGE ENERGY 678.00 767.50 33 11 NH PSEG
900 GREAT FALLS LOWER 900 GREAT FALLS LOWER 1.700 1.700 33 17 NH PSNH
899 GREAT FALLS UPPER 899 GREAT FALLS UPPER 0.937 2.075 33 17 NH PSNH
10424 GREAT LAKES - BERLIN 10424 GREAT LAKES - BERLIN 25.000 25.000 33 7 NH BEM
424 GREAT LAKES - MILLINOCKET 424 GREAT LAKES - MILLINOCKET 126.000 126.000 23 19 BHE BEM
1117 GREAT WORKS COMPOSITE 1117 GREAT WORKS COMPOSITE 0.165 0.918 23 31 SME RMHP
12274 GREEN MOUNTAIN DAIRY 12274 GREEN MOUNTAIN DAIRY 0.220 0.220 50 11 VT CVPS
429 GREENVILLE 429 GREENVILLE 16.726 16.774 23 21 ME CCG

Section 4 - Forward Capacity Market Resource Capabilities(1)
FOOTNOTES: (1) The CNRC values stated in this CELT report reflect the results of historical resource testing and, where applicable, are limited by the output value for which the resource has
received approval under the ISO Tariff, i.e. the output value approved under Section I.3.9 of the ISO New England Tariff, or predecessor provisions, such as Section 18.4 of the Restated NEPOOL Agreement. Where applicable, resources may submit additional documentation to the ISO in order to demonstrate that a given resource has been approved under the ISO Tariff review process for a higher output level.
(2) This a new resource and has no associated asset at this time. CELT Report - April 2009 Page 97 ISO New England Inc.
Resource Id Resource Name Asset Id Station Name & Number
CNRC (MW) State County RSP Area Lead
Participant Summer Winter
2285 GREENVILLE HYDRO 2285 GREENVILLE HYDRO 0.520 0.520 23 21 ME RMHP
866 GREGGS 866 GREGGS 2.070 2.070 33 11 NH PSNH
1640 GROVETON COGEN U5 1640 GROVETON COGEN U5 0.892 0.892 33 7 NH PSNH
1432 GRS-FALL RIVER 1432 GRS-FALL RIVER 5.200 5.900 25 5 SEMA TMLP
11052 GRTR NEW BEDFORD LFG UTIL PROJ 11052 GRTR NEW BEDFORD LFG UTIL PROJ 3.300 3.300 25 5 SEMA CCG
328 GULF ISLAND COMPOSITE 328 GULF ISLAND COMPOSITE 32.970 32.970 23 1 ME FPLEMH
1168 H.K. SANDERS 1168 H.K. SANDERS 1.800 1.800 50 15 VT VPPSA
2286 HACKETT MILLS HYDRO 2286 HACKETT MILLS HYDRO 0.159 0.500 23 1 ME CCG
921 HADLEY FALLS 921 HADLEY FALLS 0.200 0.250 33 11 NH PSNH
769 HADLEY FALLS 1&2 769 HADLEY FALLS 1&2 33.400 33.400 25 13 WMA HGE
1051 HAL-BFI 1051 HAL-BFI 2.890 2.890 25 23 SEMA MEC
435 HARRIMAN 435 HARRIMAN 41.135 39.000 50 25 WMA TCPM
432 HARRIS 1 432 HARRIS 1 28.600 28.980 23 25 ME FPLEMH
433 HARRIS 2 433 HARRIS 2 35.000 35.480 23 25 ME FPLEMH
434 HARRIS 3 434 HARRIS 3 34.210 34.470 23 25 ME FPLEMH
757 HARRIS 4 757 HARRIS 4 1.500 1.500 23 25 ME FPLEMH
12168 HARRIS ENERGY 12168 HARRIS ENERGY 2.421 2.421 25 13 WMA HGE
436 HEMPHILL 1 436 HEMPHILL 1 14.137 14.450 33 19 NH PPLEP
957 HG&E HYDRO/CABOT 1-4 957 HG&E HYDRO/CABOT 1-4 3.147 3.147 25 13 WMA HGE
783 HIGHGATE FALLS 783 HIGHGATE FALLS 9.570 9.520 50 11 VT VPPSA
891 HILLSBORO MILLS 891 HILLSBORO MILLS 0.405 0.568 33 11 NH PSNH
440 HIRAM 440 HIRAM 11.600 11.600 23 5 SME FPLEMH
437 HOLYOKE 6/CABOT 6 437 HOLYOKE 6/CABOT 6 9.611 9.611 25 13 WMA HGE
438 HOLYOKE 8/CABOT 8 438 HOLYOKE 8/CABOT 8 9.695 9.695 25 13 WMA HGE

Section 4 - Forward Capacity Market Resource Capabilities(1)
FOOTNOTES: (1) The CNRC values stated in this CELT report reflect the results of historical resource testing and, where applicable, are limited by the output value for which the resource has
received approval under the ISO Tariff, i.e. the output value approved under Section I.3.9 of the ISO New England Tariff, or predecessor provisions, such as Section 18.4 of the Restated NEPOOL Agreement. Where applicable, resources may submit additional documentation to the ISO in order to demonstrate that a given resource has been approved under the ISO Tariff review process for a higher output level.
(2) This a new resource and has no associated asset at this time. CELT Report - April 2009 Page 98 ISO New England Inc.
Resource Id Resource Name Asset Id Station Name & Number
CNRC (MW) State County RSP Area Lead
Participant Summer Winter
919 HOPKINTON HYDRO 919 HOPKINTON HYDRO 0.229 0.250 33 13 NH SMED
902 HOSIERY MILL DAM 902 HOSIERY MILL DAM 0.435 0.993 33 11 NH PSNH
11408 HULL WIND TURBINE II 11408 HULL WIND TURBINE II 1.800 1.800 25 9 BOSTON HULL
1656 HULL WIND TURBINE U5 1656 HULL WIND TURBINE U5 0.165 0.165 25 9 BOSTON HULL
2432 HUNTINGTON FALLS-NEW 2432 HUNTINGTON FALLS-NEW 4.990 5.760 50 1 VT VMC
856 HUNT'S POND 856 HUNT'S POND 0.023 0.064 25 27 CMA/NEMA TTMLP
11889 IBEW LOCAL 99 SOLAR QF 11889 IBEW LOCAL 99 SOLAR QF 0.029 0.050 44 7 RI NEC
1631 Indeck-Energy Alexandria, LLC 14211 INDECK ALEXANDRIA 15.200 15.200 33 9 NH IEA
867 INDIAN ORCHARD 867 INDIAN ORCHARD 3.700 3.700 25 13 WMA CEEI
448 IPSWICH DIESELS 448 IPSWICH DIESELS 16.000 13.277 25 9 BOSTON IMLD
474 J C MCNEIL 474 J C MCNEIL 52.000 54.000 50 7 VT BED
359 J. COCKWELL 1 359 J. COCKWELL 1 288.475 294.500 25 11 WMA BSP
360 J. COCKWELL 2 360 J. COCKWELL 2 291.463 294.500 25 11 WMA BSP
449 JACKMAN 449 JACKMAN 3.600 19.750 33 11 NH PSNH
13664 JOHN STREET #3 13664 JOHN STREET #3 2.000 2.000 9 9 SWCT CMEEC
13665 JOHN STREET #4 13665 JOHN STREET #4 2.000 2.000 9 9 SWCT CMEEC
12528 John Street #5 13666 JOHN STREET 5 2.011 2.011 9 9 SWCT CMEEC
451 JOHNSTON LANDFILL 451 JOHNSTON LANDFILL 12.000 12.000 44 7 RI NEP
911 KELLEYS FALLS 911 KELLEYS FALLS 0.429 0.400 33 11 NH PSNH
1672 KENDALL CT 1672 KENDALL CT 175.000 190.000 25 17 BOSTON MET
452 KENDALL JET 1 452 KENDALL JET 1 18.000 23.000 25 17 BOSTON MET
10347 KENDALL STEAM 1 10347 KENDALL STEAM 1 21.000 22.330 25 17 BOSTON MET
10348 KENDALL STEAM 2 10348 KENDALL STEAM 2 21.000 22.330 25 17 BOSTON MET
10349 KENDALL STEAM 3 10349 KENDALL STEAM 3 24.000 24.521 25 17 BOSTON MET

Section 4 - Forward Capacity Market Resource Capabilities(1)
FOOTNOTES: (1) The CNRC values stated in this CELT report reflect the results of historical resource testing and, where applicable, are limited by the output value for which the resource has
received approval under the ISO Tariff, i.e. the output value approved under Section I.3.9 of the ISO New England Tariff, or predecessor provisions, such as Section 18.4 of the Restated NEPOOL Agreement. Where applicable, resources may submit additional documentation to the ISO in order to demonstrate that a given resource has been approved under the ISO Tariff review process for a higher output level.
(2) This a new resource and has no associated asset at this time. CELT Report - April 2009 Page 99 ISO New England Inc.
Resource Id Resource Name Asset Id Station Name & Number
CNRC (MW) State County RSP Area Lead
Participant Summer Winter
1119 KENNEBAGO HYDRO 1119 KENNEBAGO HYDRO 0.686 0.725 23 29 BHE CCG
1273 KENNEBEC WATER U5 1273 KENNEBEC WATER U5 0.410 0.410 23 25 ME PPLM
786 KEZAR LEDGEMERE COMPOSITE 786 KEZAR LEDGEMERE COMPOSITE 0.560 1.282 23 31 SME FPL
12551 Kibby Wind Farm(2) 20.400 47.300 23 7 ME TCPM
837 KILLINGTON 837 KILLINGTON 0.070 0.100 50 21 VT CVPS
14706 Kimberly-Clark Corp Energy Independence Project 15097 KIMB ROCKY RIVER PH2 14.000 19.700 9 5 SWCT CCG
838 KINGSBURY 838 KINGSBURY 0.200 0.200 50 23 VT GMP
799 KINNEYTOWN A 799 KINNEYTOWN A 2.460 0.246 9 9 SWCT CLP
800 KINNEYTOWN B 800 KINNEYTOWN B 0.654 1.510 9 9 SWCT CLP
14614 Kleen Energy(2) 620.000 620.000 9 7 CT KES
466 L STREET JET 466 L STREET JET 16.600 22.250 25 25 BOSTON EXNEH
839 LADD'S MILL 839 LADD'S MILL 0.170 0.170 50 23 VT CVPS
1342 LAKE ROAD 1 1342 LAKE ROAD 1 255.000 293.000 9 15 RI LRGC
1343 LAKE ROAD 2 1343 LAKE ROAD 2 255.000 293.000 9 15 RI LRGC
1344 LAKE ROAD 3 1344 LAKE ROAD 3 255.000 293.000 9 15 RI LRGC
892 LAKEPORT DAM 892 LAKEPORT DAM 0.537 0.711 33 1 NH PSNH
457 LAWRENCE HYDRO 457 LAWRENCE HYDRO 9.400 14.100 25 9 BOSTON NEP
14660 Lempster Wind 15115 Lempster Wind 0.000 0.000 33 11 NH PSNH
787 LEWISTON CANAL COMPOSITE 787 LEWISTON CANAL COMPOSITE 1.855 6.940 23 1 ME FPLEMH
1283 LEWISTON U5 1283 LEWISTON U5 0.640 0.640 23 1 ME PPLM
894 LISBON HYDRO 894 LISBON HYDRO 0.332 0.515 33 9 NH PSNH
462 LISBON RESOURCE RECOVERY 462 LISBON RESOURCE RECOVERY 14.100 14.100 9 11 CT CLP
904 LOCHMERE DAM 904 LOCHMERE DAM 0.892 1.025 33 1 NH PSNH
460 LOCKWOOD 460 LOCKWOOD 7.500 7.500 23 11 ME FPL
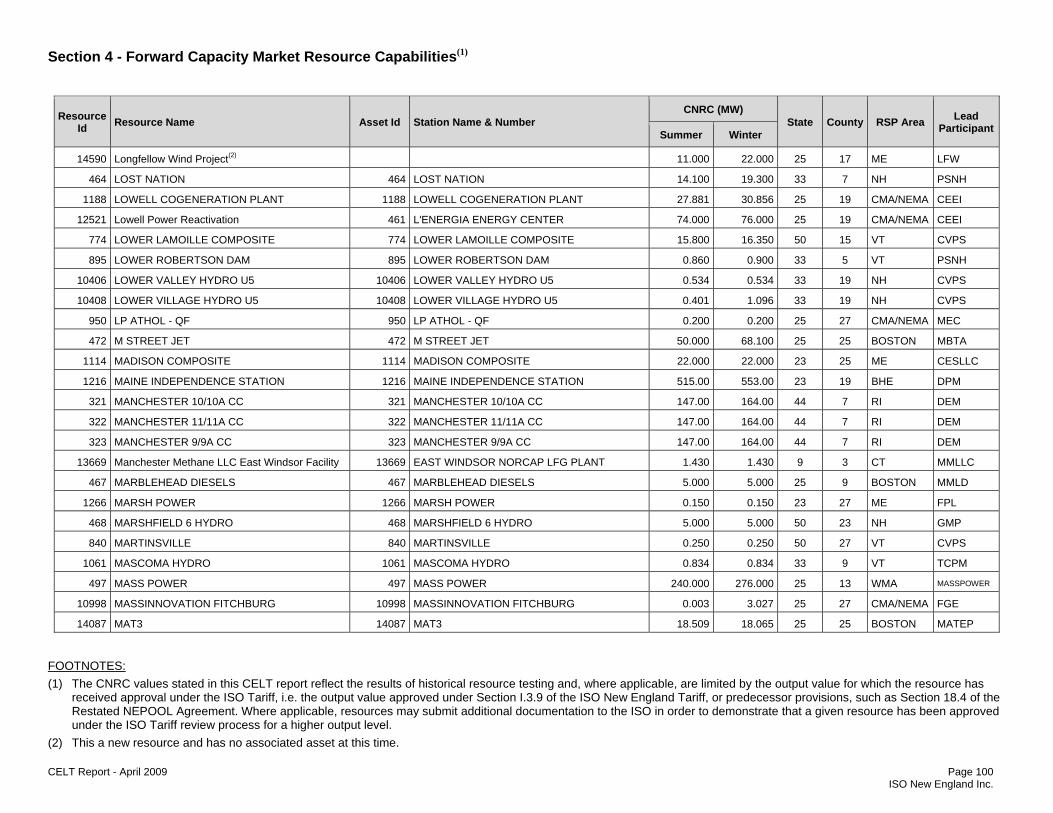
Section 4 - Forward Capacity Market Resource Capabilities(1)
FOOTNOTES: (1) The CNRC values stated in this CELT report reflect the results of historical resource testing and, where applicable, are limited by the output value for which the resource has
received approval under the ISO Tariff, i.e. the output value approved under Section I.3.9 of the ISO New England Tariff, or predecessor provisions, such as Section 18.4 of the Restated NEPOOL Agreement. Where applicable, resources may submit additional documentation to the ISO in order to demonstrate that a given resource has been approved under the ISO Tariff review process for a higher output level.
(2) This a new resource and has no associated asset at this time. CELT Report - April 2009 Page 100 ISO New England Inc.
Resource Id Resource Name Asset Id Station Name & Number
CNRC (MW) State County RSP Area Lead
Participant Summer Winter
14590 Longfellow Wind Project(2) 11.000 22.000 25 17 ME LFW
464 LOST NATION 464 LOST NATION 14.100 19.300 33 7 NH PSNH
1188 LOWELL COGENERATION PLANT 1188 LOWELL COGENERATION PLANT 27.881 30.856 25 19 CMA/NEMA CEEI
12521 Lowell Power Reactivation 461 L'ENERGIA ENERGY CENTER 74.000 76.000 25 19 CMA/NEMA CEEI
774 LOWER LAMOILLE COMPOSITE 774 LOWER LAMOILLE COMPOSITE 15.800 16.350 50 15 VT CVPS
895 LOWER ROBERTSON DAM 895 LOWER ROBERTSON DAM 0.860 0.900 33 5 VT PSNH
10406 LOWER VALLEY HYDRO U5 10406 LOWER VALLEY HYDRO U5 0.534 0.534 33 19 NH CVPS
10408 LOWER VILLAGE HYDRO U5 10408 LOWER VILLAGE HYDRO U5 0.401 1.096 33 19 NH CVPS
950 LP ATHOL - QF 950 LP ATHOL - QF 0.200 0.200 25 27 CMA/NEMA MEC
472 M STREET JET 472 M STREET JET 50.000 68.100 25 25 BOSTON MBTA
1114 MADISON COMPOSITE 1114 MADISON COMPOSITE 22.000 22.000 23 25 ME CESLLC
1216 MAINE INDEPENDENCE STATION 1216 MAINE INDEPENDENCE STATION 515.00 553.00 23 19 BHE DPM
321 MANCHESTER 10/10A CC 321 MANCHESTER 10/10A CC 147.00 164.00 44 7 RI DEM
322 MANCHESTER 11/11A CC 322 MANCHESTER 11/11A CC 147.00 164.00 44 7 RI DEM
323 MANCHESTER 9/9A CC 323 MANCHESTER 9/9A CC 147.00 164.00 44 7 RI DEM
13669 Manchester Methane LLC East Windsor Facility 13669 EAST WINDSOR NORCAP LFG PLANT 1.430 1.430 9 3 CT MMLLC
467 MARBLEHEAD DIESELS 467 MARBLEHEAD DIESELS 5.000 5.000 25 9 BOSTON MMLD
1266 MARSH POWER 1266 MARSH POWER 0.150 0.150 23 27 ME FPL
468 MARSHFIELD 6 HYDRO 468 MARSHFIELD 6 HYDRO 5.000 5.000 50 23 NH GMP
840 MARTINSVILLE 840 MARTINSVILLE 0.250 0.250 50 27 VT CVPS
1061 MASCOMA HYDRO 1061 MASCOMA HYDRO 0.834 0.834 33 9 VT TCPM
497 MASS POWER 497 MASS POWER 240.000 276.000 25 13 WMA MASSPOWER
10998 MASSINNOVATION FITCHBURG 10998 MASSINNOVATION FITCHBURG 0.003 3.027 25 27 CMA/NEMA FGE
14087 MAT3 14087 MAT3 18.509 18.065 25 25 BOSTON MATEP

Section 4 - Forward Capacity Market Resource Capabilities(1)
FOOTNOTES: (1) The CNRC values stated in this CELT report reflect the results of historical resource testing and, where applicable, are limited by the output value for which the resource has
received approval under the ISO Tariff, i.e. the output value approved under Section I.3.9 of the ISO New England Tariff, or predecessor provisions, such as Section 18.4 of the Restated NEPOOL Agreement. Where applicable, resources may submit additional documentation to the ISO in order to demonstrate that a given resource has been approved under the ISO Tariff review process for a higher output level.
(2) This a new resource and has no associated asset at this time. CELT Report - April 2009 Page 101 ISO New England Inc.
Resource Id Resource Name Asset Id Station Name & Number
CNRC (MW) State County RSP Area Lead
Participant Summer Winter
13675 MATEP (COMBINED CYCLE) 13675 MATEP (COMBINED CYCLE) 46.802 49.802 25 25 BOSTON MATEP
13673 MATEP (DIESEL) 13673 MATEP (DIESEL) 19.491 19.491 25 25 BOSTON MATEP
880 MCCALLUM ENTERPRISES 880 MCCALLUM ENTERPRISES 0.278 0.278 9 9 SWCT UI
473 MCINDOES 473 MCINDOES 13.000 13.000 33 9 NH TCPM
345 MEAD 345 MEAD 75.000 75.000 23 17 ME CCG
2287 MECHANIC FALLS HYDRO 2287 MECHANIC FALLS HYDRO 0.231 1.050 23 1 ME RMHP
806 MECHANICSVILLE 806 MECHANICSVILLE 0.101 0.267 9 15 CT SMED
475 MEDWAY DIESELS 1-4 475 MEDWAY DIESELS 1-4 7.950 8.650 23 19 BHE CCG
476 MERC 476 MERC 22.665 22.665 23 31 SME FPL
946 MERRIMAC PAPER - QF 946 MERRIMAC PAPER - QF 0.016 0.003 25 9 BOSTON MEC
489 MERRIMACK 1 489 MERRIMACK 1 112.500 122.730 33 13 NH PSNH
490 MERRIMACK 2 490 MERRIMACK 2 320.000 353.500 33 13 NH PSNH
382 MERRIMACK CT1 382 MERRIMACK CT1 17.800 22.500 33 13 NH PSNH
383 MERRIMACK CT2 383 MERRIMACK CT2 17.600 23.500 33 13 NH PSNH
759 MESSALONSKEE COMPOSITE 75914937
MESSALONSKEE COMPOSITE Union Gas Station 5.920 5.950 23 11 ME FPL
793 METHUEN HYDRO 793 METHUEN HYDRO 0.120 0.273 25 9 BOSTON SMED
775 MIDDLEBURY COMPOSITE 775 MIDDLEBURY COMPOSITE 6.750 6.000 50 1 VT CVPS
1720 MIDDLEBURY LOWER U5 1720 MIDDLEBURY LOWER U5 1.810 1.850 50 1 VT CVPS
779 MIDDLESEX 2 779 MIDDLESEX 2 3.300 3.300 50 23 VT GMP
479 MIDDLETOWN 1 479 MIDDLETOWN 1 66.370 70.000 9 7 CT NRGPM
478 MIDDLETOWN 10 478 MIDDLETOWN 10 17.200 22.100 9 7 CT NRGPM
12505 Middletown 12-15(2) 186.000 192.000 9 7 CT GCE
480 MIDDLETOWN 2 480 MIDDLETOWN 2 117.000 120.000 9 7 CT NRGPM
481 MIDDLETOWN 3 481 MIDDLETOWN 3 236.000 245.000 9 7 CT NRGPM

Section 4 - Forward Capacity Market Resource Capabilities(1)
FOOTNOTES: (1) The CNRC values stated in this CELT report reflect the results of historical resource testing and, where applicable, are limited by the output value for which the resource has
received approval under the ISO Tariff, i.e. the output value approved under Section I.3.9 of the ISO New England Tariff, or predecessor provisions, such as Section 18.4 of the Restated NEPOOL Agreement. Where applicable, resources may submit additional documentation to the ISO in order to demonstrate that a given resource has been approved under the ISO Tariff review process for a higher output level.
(2) This a new resource and has no associated asset at this time. CELT Report - April 2009 Page 102 ISO New England Inc.
Resource Id Resource Name Asset Id Station Name & Number
CNRC (MW) State County RSP Area Lead
Participant Summer Winter
482 MIDDLETOWN 4 482 MIDDLETOWN 4 402.000 402.000 9 7 CT NRGPM
486 MILFORD POWER 486 MILFORD POWER 149.000 170.730 25 27 RI ANP
1385 MILFORD POWER 1 1385 MILFORD POWER 1 267.700 288.516 9 9 SWCT JPMVEC
1386 MILFORD POWER 2 1386 MILFORD POWER 2 267.700 295.380 9 9 SWCT JPMVEC
1210 MILLENNIUM 1210 MILLENNIUM 331.000 389.000 25 27 WMA MLC
487 MILLER HYDRO 487 MILLER HYDRO 18.600 18.600 23 1 ME CCG
484 MILLSTONE POINT 2 484 MILLSTONE POINT 2 897.500 905.700 9 11 CT DEM
485 MILLSTONE POINT 3 485 MILLSTONE POINT 3 1235.001 1235.001 9 11 CT DEM
868 MILTON MILLS HYDRO 868 MILTON MILLS HYDRO 1.150 1.510 33 17 NH PSNH
869 MINE FALLS 869 MINE FALLS 0.827 1.787 33 11 NH PSNH
794 MINIWAWA 794 MINIWAWA 0.437 0.959 33 5 VT LELWD
954 MM LOWELL LANDFILL - QF 954 MM LOWELL LANDFILL - QF 1.104 1.093 25 19 BOSTON MEC
1109 MMWAC 1109 MMWAC 3.034 3.034 23 1 ME FPL
915 MONADNOCK PAPER MILLS 915 MONADNOCK PAPER MILLS 0.305 1.114 33 11 NH PSNH
14134 MONTAGNE FARM 14134 MONTAGNE FARM 0.300 0.300 50 11 VT CVPS
492 MONTVILLE 10 and 11 492 MONTVILLE 10 and 11 5.500 5.500 9 11 CT NRGPM
493 MONTVILLE 5 493 MONTVILLE 5 81.000 82.000 9 11 CT NRGPM
494 MONTVILLE 6 494 MONTVILLE 6 410.000 410.000 9 11 CT NRGPM
495 MONTY 495 MONTY 28.000 28.000 23 25 ME FPLEMH
496 MOORE 496 MOORE 194.500 191.960 33 9 NH TCPM
841 MORETOWN 8 841 MORETOWN 8 1.096 1.0960 50 23 VT CVPS
15617 Moretown LFG 15617 Moretown LFGTE 0.000 0.000 50 9 VT GMP
1166 MORRISVILLE PLANT #2 1166 MORRISVILLE PLANT #2 1.430 1.800 50 15 VT VPPSA
498 MT TOM 498 MT TOM 146.000 147.000 25 13 WMA FPRM

Section 4 - Forward Capacity Market Resource Capabilities(1)
FOOTNOTES: (1) The CNRC values stated in this CELT report reflect the results of historical resource testing and, where applicable, are limited by the output value for which the resource has
received approval under the ISO Tariff, i.e. the output value approved under Section I.3.9 of the ISO New England Tariff, or predecessor provisions, such as Section 18.4 of the Restated NEPOOL Agreement. Where applicable, resources may submit additional documentation to the ISO in order to demonstrate that a given resource has been approved under the ISO Tariff review process for a higher output level.
(2) This a new resource and has no associated asset at this time. CELT Report - April 2009 Page 103 ISO New England Inc.
Resource Id Resource Name Asset Id Station Name & Number
CNRC (MW) State County RSP Area Lead
Participant Summer Winter
1062 MWRA COSGROVE 1062 MWRA COSGROVE 1.901 1.901 25 27 CMA/NEMA CCG
502 MYSTIC 7 502 MYSTIC 7 592.000 592.000 25 17 BOSTON BG
1478 MYSTIC 8 1478 MYSTIC 8 703.324 841.564 25 17 BOSTON BG
1616 MYSTIC 9 1616 MYSTIC 9 709.676 858.436 25 17 BOSTON BG
503 MYSTIC JET 503 MYSTIC JET 9.750 13.800 25 17 BOSTON BG
776 N. RUTLAND COMPOSITE 776 N. RUTLAND COMPOSITE 5.200 5.450 50 21 VT CVPS
1649 NAEA Newington Energy, LLC 1649 NEWINGTON ENERGY 524.186 561.500 33 15 NH SENA
842 NANTANA MILL 842 NANTANA MILL 0.106 0.220 50 23 VT CVPS
890 NASHUA HYDRO 890 NASHUA HYDRO 1.031 0.840 33 11 NH PSNH
507 NEA BELLINGHAM 507 NEA BELLINGHAM 277.621 340.241 25 21 RI FPL
10308 NECCO COGENERATION FACILITY 10308 NECCO COGENERATION FACILITY 5.000 5.000 25 25 BOSTON NECCO
15491 Neighborhood Energy, LLC 15465 Neighborhood Energy, LLC 0.225 0.225 50 2 VT VEC
513 NEW HAVEN HARBOR 513 NEW HAVEN HARBOR 466.000 466.000 9 9 CT PSEG
978 NEW MILFORD 978 NEW MILFORD 3.014 3.014 9 5 CT CLP
843 NEWBURY 843 NEWBURY 0.220 0.270 50 17 VT CVPS
888 NEWFOUND HYDRO 888 NEWFOUND HYDRO 1.966 1.303 33 9 NH PSNH
508 NEWINGTON 1 508 NEWINGTON 1 407.500 420.830 33 15 NH PSNH
772 NEWPORT HYDRO 772 NEWPORT HYDRO 3.880 4.030 50 15 NH GBPM
922 NOONE FALLS 922 NOONE FALLS 0.130 0.146 33 11 NH PSNH
760 NORTH GORHAM 760 NORTH GORHAM 1.971 2.000 23 5 SME FPLEMH
11126 NORTH HARTLAND HYDRO 11126 NORTH HARTLAND HYDRO 4.460 4.460 50 27 VT CVPS
14217 NORTHFIELD MOUNTAIN 1 14217 NORTHFIELD MOUNTAIN 1 280.000 280.000 25 11 WMA FPRM
14218 NORTHFIELD MOUNTAIN 2 14218 NORTHFIELD MOUNTAIN 2 280.000 280.000 25 11 WMA FPRM
14219 NORTHFIELD MOUNTAIN 3 14219 NORTHFIELD MOUNTAIN 3 280.000 280.000 25 11 WMA FPRM

Section 4 - Forward Capacity Market Resource Capabilities(1)
FOOTNOTES: (1) The CNRC values stated in this CELT report reflect the results of historical resource testing and, where applicable, are limited by the output value for which the resource has
received approval under the ISO Tariff, i.e. the output value approved under Section I.3.9 of the ISO New England Tariff, or predecessor provisions, such as Section 18.4 of the Restated NEPOOL Agreement. Where applicable, resources may submit additional documentation to the ISO in order to demonstrate that a given resource has been approved under the ISO Tariff review process for a higher output level.
(2) This a new resource and has no associated asset at this time. CELT Report - April 2009 Page 104 ISO New England Inc.
Resource Id Resource Name Asset Id Station Name & Number
CNRC (MW) State County RSP Area Lead
Participant Summer Winter
14220 NORTHFIELD MOUNTAIN 4 14220 NORTHFIELD MOUNTAIN 4 280.000 280.000 25 11 WMA FPRM
519 NORWALK HARBOR 1 519 NORWALK HARBOR 1 162.000 164.000 9 1 NOR NRGPM
521 NORWALK HARBOR 10 (3) 521 NORWALK HARBOR 10 (3) 12.300 17.125 9 1 NOR NRGPM
520 NORWALK HARBOR 2 520 NORWALK HARBOR 2 168.000 172.000 9 1 NOR NRGPM
2288 NORWAY HYDRO 2288 NORWAY HYDRO 0.000 0.201 23 17 ME RMHP
515 NORWICH JET 515 NORWICH JET 15.255 18.800 9 11 CT CMEEC
1030 OAK BLUFFS 1030 OAK BLUFFS 8.250 8.250 25 7 SEMA MET
857 OAKDALE HYDRO 857 OAKDALE HYDRO 3.200 3.200 25 27 CMA/NEMA WBMLP
528 OCEAN ST PWR GT1/GT2/ST1 528 OCEAN ST PWR GT1/GT2/ST1 272.342 318.342 44 7 RI TCPM
529 OCEAN ST PWR GT3/GT4/ST2 529 OCEAN ST PWR GT3/GT4/ST2 274.815 322.815 44 7 RI TCPM
527 OGDEN-MARTIN 1 527 OGDEN-MARTIN 1 41.680 42.870 25 9 BOSTON DEM
897 OLD NASH DAM 897 OLD NASH DAM 0.135 0.175 33 5 VT PSNH
854 ORANGE HYDRO 1 854 ORANGE HYDRO 1 0.150 0.150 25 11 WMA TTMLP
855 ORANGE HYDRO 2 855 ORANGE HYDRO 2 0.120 0.172 25 11 WMA TTMLP
14695 Orono Hydro Station 14695 Orono 0.000 0.000 23 19 BHE PPLEP
908 OTIS MILL HYDRO 908 OTIS MILL HYDRO 0.122 0.127 33 11 NH PSNH
844 OTTAUQUECHEE 844 OTTAUQUECHEE 1.547 2.180 50 27 VT CVPS
925 OTTER LANE HYDRO 925 OTTER LANE HYDRO 0.084 0.090 33 13 NH PSNH
820 PASSUMPSIC 820 PASSUMPSIC 0.700 0.700 50 5 NH CVPS
814 PATCH 814 PATCH 0.300 0.300 50 21 VT CVPS
531 PAWTUCKET POWER 531 PAWTUCKET POWER 52.000 61.000 44 7 RI PPH
532 PEJEPSCOT 532 PEJEPSCOT 10.210 13.550 23 23 ME CCG
870 PEMBROKE 870 PEMBROKE 0.520 1.663 33 13 NH PSNH
871 PENNACOOK FALLS LOWER 871 PENNACOOK FALLS LOWER 2.869 3.991 33 13 NH PSNH

Section 4 - Forward Capacity Market Resource Capabilities(1)
FOOTNOTES: (1) The CNRC values stated in this CELT report reflect the results of historical resource testing and, where applicable, are limited by the output value for which the resource has
received approval under the ISO Tariff, i.e. the output value approved under Section I.3.9 of the ISO New England Tariff, or predecessor provisions, such as Section 18.4 of the Restated NEPOOL Agreement. Where applicable, resources may submit additional documentation to the ISO in order to demonstrate that a given resource has been approved under the ISO Tariff review process for a higher output level.
(2) This a new resource and has no associated asset at this time. CELT Report - April 2009 Page 105 ISO New England Inc.
Resource Id Resource Name Asset Id Station Name & Number
CNRC (MW) State County RSP Area Lead
Participant Summer Winter
872 PENNACOOK FALLS UPPER 872 PENNACOOK FALLS UPPER 2.243 3.120 33 13 NH PSNH
534 PENOBSCOT RIVER HYDRO 534 PENOBSCOT RIVER HYDRO 22.070 22.070 23 19 BHE PPLEP
948 PEPPERELL HYDRO COMPANY LLC 948 PEPPERELL HYDRO COMPANY LLC 0.863 0.863 25 17 BOSTON SRTC
536 PERC-ORRINGTON 1 536 PERC-ORRINGTON 1 21.760 21.930 23 19 BHE IES
926 PETERBOROUGH LOWER HYDRO 926 PETERBOROUGH LOWER HYDRO 0.284 0.284 33 11 NH PSNH
941 PETERBOROUGH UPPER HYDRO 941 PETERBOROUGH UPPER HYDRO 0.400 0.400 33 11 NH PSNH
10402 PETTYBORO HYDRO U5 10402 PETTYBORO HYDRO U5 0.004 0.010 33 9 NH PSNH
12526 Pierce 13515 PIERCE STATION 75.000 87.000 9 9 SWCT CMEEC
818 PIERCE MILLS 818 PIERCE MILLS 0.245 0.245 50 5 NH CVPS
537 PILGRIM NUCLEAR POWER STATION 537 PILGRIM NUCLEAR POWER STATION 701.000 734.000 25 23 SEMA ENPM
809 PINCHBECK 809 PINCHBECK 0.011 0.010 9 13 CT CLP
15541 Pine Tree LFGTE 14767 Pine Tree LFGTE 0.000 0.000 23 19 BHE FPL
538 PINETREE POWER 538 PINETREE POWER 17.550 17.490 25 27 NH FGE
2289 PIONEER DAM HYDRO 2289 PIONEER DAM HYDRO 0.198 0.198 23 25 ME FPL
2290 PITTSFIELD HYDRO 2290 PITTSFIELD HYDRO 0.877 1.000 23 25 ME RMHP
2462 PLAINVILLE GEN QF U5 2462 PLAINVILLE GEN QF U5 5.000 5.000 25 21 SEMA CCG
952 PONTIAC ENERGY - QF 952 PONTIAC ENERGY - QF 0.440 0.440 44 7 RI NEC
539 PONTOOK HYDRO 539 PONTOOK HYDRO 8.227 10.160 33 7 NH BEM
11827 PORTSMOUTH ABBEY WIND QF 11827 PORTSMOUTH ABBEY WIND QF 0.445 0.660 44 5 RI NEC
540 POTTER 2 CC 540 POTTER 2 CC 79.500 97.500 25 21 SEMA BELD
361 POTTER DIESEL 1 361 POTTER DIESEL 1 2.250 2.250 25 21 SEMA BELD
969 POWDER MILL HYDRO 969 POWDER MILL HYDRO 0.140 0.140 25 27 CMA/NEMA MMWEC
12163 PPL GREAT WORKS - RED SHIELD 12163 PPL GREAT WORKS - RED SHIELD 21.000 21.000 23 19 BHE PPLEP
1376 PPL WALLINGFORD UNIT 1 1376 PPL WALLINGFORD UNIT 1 42.300 49.000 9 9 SWCT PPLEP
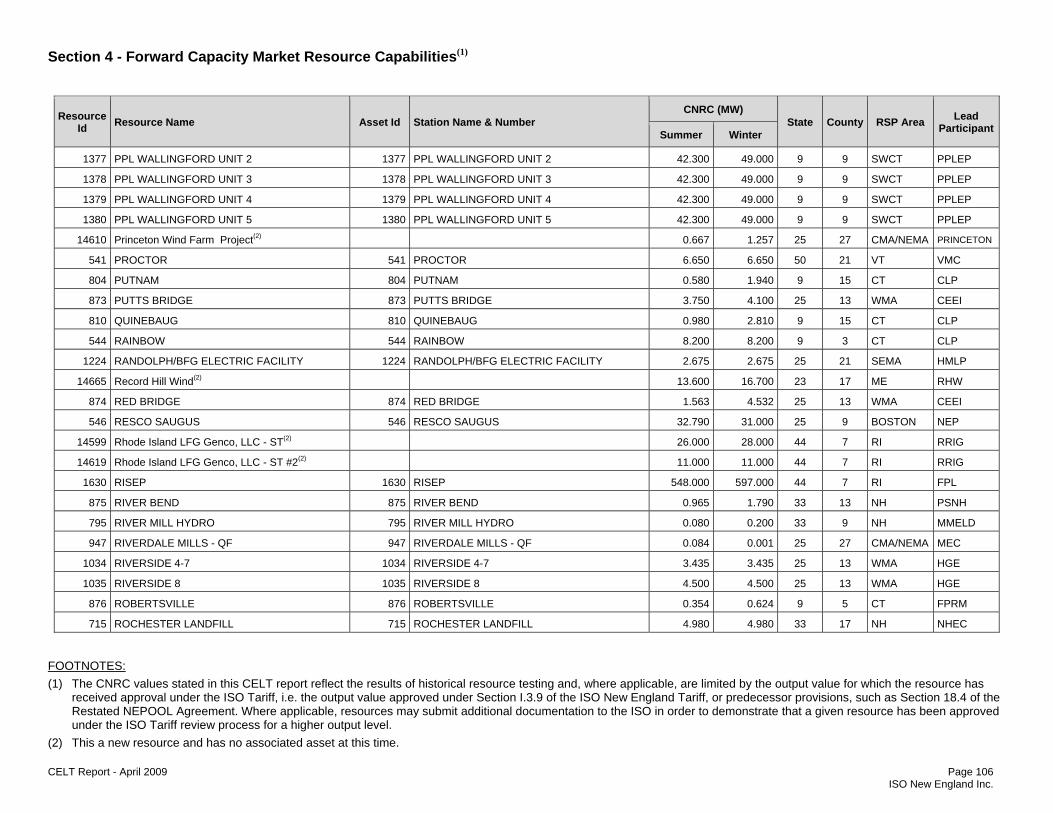
Section 4 - Forward Capacity Market Resource Capabilities(1)
FOOTNOTES: (1) The CNRC values stated in this CELT report reflect the results of historical resource testing and, where applicable, are limited by the output value for which the resource has
received approval under the ISO Tariff, i.e. the output value approved under Section I.3.9 of the ISO New England Tariff, or predecessor provisions, such as Section 18.4 of the Restated NEPOOL Agreement. Where applicable, resources may submit additional documentation to the ISO in order to demonstrate that a given resource has been approved under the ISO Tariff review process for a higher output level.
(2) This a new resource and has no associated asset at this time. CELT Report - April 2009 Page 106 ISO New England Inc.
Resource Id Resource Name Asset Id Station Name & Number
CNRC (MW) State County RSP Area Lead
Participant Summer Winter
1377 PPL WALLINGFORD UNIT 2 1377 PPL WALLINGFORD UNIT 2 42.300 49.000 9 9 SWCT PPLEP
1378 PPL WALLINGFORD UNIT 3 1378 PPL WALLINGFORD UNIT 3 42.300 49.000 9 9 SWCT PPLEP
1379 PPL WALLINGFORD UNIT 4 1379 PPL WALLINGFORD UNIT 4 42.300 49.000 9 9 SWCT PPLEP
1380 PPL WALLINGFORD UNIT 5 1380 PPL WALLINGFORD UNIT 5 42.300 49.000 9 9 SWCT PPLEP
14610 Princeton Wind Farm Project(2) 0.667 1.257 25 27 CMA/NEMA PRINCETON
541 PROCTOR 541 PROCTOR 6.650 6.650 50 21 VT VMC
804 PUTNAM 804 PUTNAM 0.580 1.940 9 15 CT CLP
873 PUTTS BRIDGE 873 PUTTS BRIDGE 3.750 4.100 25 13 WMA CEEI
810 QUINEBAUG 810 QUINEBAUG 0.980 2.810 9 15 CT CLP
544 RAINBOW 544 RAINBOW 8.200 8.200 9 3 CT CLP
1224 RANDOLPH/BFG ELECTRIC FACILITY 1224 RANDOLPH/BFG ELECTRIC FACILITY 2.675 2.675 25 21 SEMA HMLP
14665 Record Hill Wind(2) 13.600 16.700 23 17 ME RHW
874 RED BRIDGE 874 RED BRIDGE 1.563 4.532 25 13 WMA CEEI
546 RESCO SAUGUS 546 RESCO SAUGUS 32.790 31.000 25 9 BOSTON NEP
14599 Rhode Island LFG Genco, LLC - ST(2) 26.000 28.000 44 7 RI RRIG
14619 Rhode Island LFG Genco, LLC - ST #2(2) 11.000 11.000 44 7 RI RRIG
1630 RISEP 1630 RISEP 548.000 597.000 44 7 RI FPL
875 RIVER BEND 875 RIVER BEND 0.965 1.790 33 13 NH PSNH
795 RIVER MILL HYDRO 795 RIVER MILL HYDRO 0.080 0.200 33 9 NH MMELD
947 RIVERDALE MILLS - QF 947 RIVERDALE MILLS - QF 0.084 0.001 25 27 CMA/NEMA MEC
1034 RIVERSIDE 4-7 1034 RIVERSIDE 4-7 3.435 3.435 25 13 WMA HGE
1035 RIVERSIDE 8 1035 RIVERSIDE 8 4.500 4.500 25 13 WMA HGE
876 ROBERTSVILLE 876 ROBERTSVILLE 0.354 0.624 9 5 CT FPRM
715 ROCHESTER LANDFILL 715 ROCHESTER LANDFILL 4.980 4.980 33 17 NH NHEC

Section 4 - Forward Capacity Market Resource Capabilities(1)
FOOTNOTES: (1) The CNRC values stated in this CELT report reflect the results of historical resource testing and, where applicable, are limited by the output value for which the resource has
received approval under the ISO Tariff, i.e. the output value approved under Section I.3.9 of the ISO New England Tariff, or predecessor provisions, such as Section 18.4 of the Restated NEPOOL Agreement. Where applicable, resources may submit additional documentation to the ISO in order to demonstrate that a given resource has been approved under the ISO Tariff review process for a higher output level.
(2) This a new resource and has no associated asset at this time. CELT Report - April 2009 Page 107 ISO New England Inc.
Resource Id Resource Name Asset Id Station Name & Number
CNRC (MW) State County RSP Area Lead
Participant Summer Winter
1368 ROCKY GORGE U5 1368 ROCKY GORGE U5 0.362 0.362 23 31 SME PPLM
739 ROCKY RIVER 739 ROCKY RIVER 29.350 30.400 9 9 SWCT FPRM
906 ROLLINSFORD HYDRO 906 ROLLINSFORD HYDRO 1.500 1.500 33 17 NH PSNH
10366 RRIG EXPANSION PHASE 1 10366 RRIG EXPANSION PHASE 1 2.400 2.400 44 7 RI RRIG
10959 RRIG EXPANSION PHASE 2 10959 RRIG EXPANSION PHASE 2 6.000 6.024 44 7 RI RRIG
11424 RUMFORD FALLS 11424 RUMFORD FALLS 41.265 43.000 23 17 ME BEM
1255 RUMFORD POWER 1255 RUMFORD POWER 244.940 275.059 23 17 ME CEEI
549 RUTLAND 5 GT 549 RUTLAND 5 GT 10.400 14.800 50 21 VT CVPS
2433 RYEGATE 1-NEW 2433 RYEGATE 1-NEW 20.740 20.740 50 5 NH VELCO
591 S.D. WARREN-WESTBROOK 591 S.D. WARREN-WESTBROOK 43.070 49.103 23 5 SME FPL
551 SALEM HARBOR 1 551 SALEM HARBOR 1 82.000 84.000 25 9 BOSTON DEM
552 SALEM HARBOR 2 552 SALEM HARBOR 2 80.000 80.488 25 9 BOSTON DEM
553 SALEM HARBOR 3 553 SALEM HARBOR 3 150.000 150.000 25 9 BOSTON DEM
554 SALEM HARBOR 4 554 SALEM HARBOR 4 438.579 437.353 25 9 BOSTON DEM
928 SALMON BROOK STATION 3 928 SALMON BROOK STATION 3 0.326 0.250 33 13 NH PSNH
883 SALMON FALLS HYDRO 883 SALMON FALLS HYDRO 0.953 0.824 33 17 NH PSNH
808 SANDY HOOK HYDRO 808 SANDY HOOK HYDRO 0.077 0.105 9 15 CT CLP
556 SCHILLER 4 556 SCHILLER 4 47.500 48.000 33 15 NH PSNH
557 SCHILLER 5 557 SCHILLER 5 49.600 49.600 33 15 NH PSNH
558 SCHILLER 6 558 SCHILLER 6 48.000 49.000 33 15 NH PSNH
559 SCHILLER CT 1 559 SCHILLER CT 1 17.621 22.000 33 15 NH PSNH
877 SCOTLAND 877 SCOTLAND 1.690 2.200 9 15 CT FPRM
555 SEABROOK 555 SEABROOK 1265.400 1265.400 33 15 NH FPL
561 SEARSBURG 561 SEARSBURG 4.960 4.960 50 3 WMA TCPM

Section 4 - Forward Capacity Market Resource Capabilities(1)
FOOTNOTES: (1) The CNRC values stated in this CELT report reflect the results of historical resource testing and, where applicable, are limited by the output value for which the resource has
received approval under the ISO Tariff, i.e. the output value approved under Section I.3.9 of the ISO New England Tariff, or predecessor provisions, such as Section 18.4 of the Restated NEPOOL Agreement. Where applicable, resources may submit additional documentation to the ISO in order to demonstrate that a given resource has been approved under the ISO Tariff review process for a higher output level.
(2) This a new resource and has no associated asset at this time. CELT Report - April 2009 Page 108 ISO New England Inc.
Resource Id Resource Name Asset Id Station Name & Number
CNRC (MW) State County RSP Area Lead
Participant Summer Winter
827 SEARSBURG WIND 827 SEARSBURG WIND 0.700 1.690 50 3 WMA GMP
562 SECREC-PRESTON 562 SECREC-PRESTON 16.449 17.070 9 11 CT CLP
563 SEMASS 1 563 SEMASS 1 46.955 52.690 25 23 SEMA NSTAR
564 SEMASS 2 564 SEMASS 2 22.650 25.510 25 23 SEMA NSTAR
767 SES CONCORD 767 SES CONCORD 12.693 13.140 33 13 NH PSNH
761 SHAWMUT 761 SHAWMUT 9.500 9.500 23 25 ME FPLEMH
12530 Sheffield Wind Farm(2) 10.000 17.000 50 5 VT VW
565 SHELDON SPRINGS 565 SHELDON SPRINGS 14.832 26.380 50 11 VT VELCO
881 SHELTON LANDFILL 881 SHELTON LANDFILL 0.427 0.618 9 9 SWCT UI
566 SHEPAUG 566 SHEPAUG 42.950 43.400 9 9 SWCT FPRM
567 SHERMAN 567 SHERMAN 6.500 7.000 25 11 WMA TCPM
1079 SHREWSBURY DIESEL # 4 1079 SHREWSBURY DIESEL # 4 2.750 2.750 25 27 CMA/NEMA SELP
1076 SHREWSBURY DIESEL #1 1076 SHREWSBURY DIESEL #1 2.750 2.750 25 27 CMA/NEMA SELP
1077 SHREWSBURY DIESEL #2 1077 SHREWSBURY DIESEL #2 2.750 2.750 25 27 CMA/NEMA SELP
1078 SHREWSBURY DIESEL #3 1078 SHREWSBURY DIESEL #3 2.750 2.750 25 27 CMA/NEMA SELP
1080 SHREWSBURY DIESEL #5 1080 SHREWSBURY DIESEL #5 2.750 2.750 25 27 CMA/NEMA SELP
737 SIMPSON G LOAD REDUCER 737 SIMPSON G LOAD REDUCER 3.840 4.850 50 9 NH CVPS
569 SKELTON 569 SKELTON 20.000 20.000 23 31 SME FPLEMH
878 SKINNER 878 SKINNER 0.280 0.280 25 13 WMA HGE
845 SLACK DAM 845 SLACK DAM 0.230 0.410 50 27 VT CVPS
570 SMITH 570 SMITH 17.600 16.669 33 7 NH PSNH
822 SMITH (CVPS) 822 SMITH (CVPS) 0.930 1.310 50 17 VT CVPS
572 SO. MEADOW 11 572 SO. MEADOW 11 38.800 49.000 9 3 CT SEI
573 SO. MEADOW 12 573 SO. MEADOW 12 39.000 49.000 9 3 CT SEI

Section 4 - Forward Capacity Market Resource Capabilities(1)
FOOTNOTES: (1) The CNRC values stated in this CELT report reflect the results of historical resource testing and, where applicable, are limited by the output value for which the resource has
received approval under the ISO Tariff, i.e. the output value approved under Section I.3.9 of the ISO New England Tariff, or predecessor provisions, such as Section 18.4 of the Restated NEPOOL Agreement. Where applicable, resources may submit additional documentation to the ISO in order to demonstrate that a given resource has been approved under the ISO Tariff review process for a higher output level.
(2) This a new resource and has no associated asset at this time. CELT Report - April 2009 Page 109 ISO New England Inc.
Resource Id Resource Name Asset Id Station Name & Number
CNRC (MW) State County RSP Area Lead
Participant Summer Winter
574 SO. MEADOW 13 574 SO. MEADOW 13 39.000 48.600 9 3 CT SEI
575 SO. MEADOW 14 575 SO. MEADOW 14 39.000 49.000 9 3 CT SEI
580 SO. MEADOW 5 580 SO. MEADOW 5 29.700 31.240 9 3 CT CLP
581 SO. MEADOW 6 581 SO. MEADOW 6 29.700 31.250 9 3 CT CLP
1107 SOMERSET 1107 SOMERSET 10.604 10.604 23 11 ME CCG
577 SOMERSET 6 577 SOMERSET 6 113.000 113.100 25 5 SEMA NRGPM
579 SOMERSET JET 2 579 SOMERSET JET 2 23.000 25.800 25 5 SEMA NRGPM
852 SOUTH BARRE HYDRO 852 SOUTH BARRE HYDRO 0.650 0.140 25 27 CMA/NEMA MMWEC
1495 SOUTHBRIDGE P&T QF U5 1495 SOUTHBRIDGE P&T QF U5 0.298 0.252 25 27 CMA/NEMA MEC
1267 SPARHAWK 1267 SPARHAWK 0.175 0.175 23 5 SME PPLM
2425 SPRINGFIELD REFUSE-NEW 2425 SPRINGFIELD REFUSE-NEW 6.000 6.000 25 13 WMA WMECO
585 ST ALBANS 1 and 2 585 ST ALBANS 1 and 2 2.220 2.400 50 11 VT CVPS
909 STEELS POND HYDRO 909 STEELS POND HYDRO 0.429 0.975 33 11 NH PSNH
858 STERLING DIESELS 858 STERLING DIESELS 0.330 0.330 25 27 CMA/NEMA SMED
14609 Stetson Wind Farm #2 15464 Stetson Wind Farm 0.000 0.000 23 29 BHE EWPV
885 STEVENS MILL 885 STEVENS MILL 0.225 0.225 33 13 NH PSNH
587 STEVENSON 587 STEVENSON 28.940 28.900 9 1 SWCT FPRM
583 STONY BROOK 2A 583 STONY BROOK 2A 70.000 90.000 25 13 WMA MMWEC
584 STONY BROOK 2B 584 STONY BROOK 2B 70.000 90.000 25 13 WMA MMWEC
1185 STONY BROOK GT1A 1185 STONY BROOK GT1A 104.000 119.000 25 13 WMA MMWEC
1186 STONY BROOK GT1B 1186 STONY BROOK GT1B 100.000 117.000 25 13 WMA MMWEC
1187 STONY BROOK GT1C 1187 STONY BROOK GT1C 104.000 119.000 25 13 WMA MMWEC
898 SUGAR RIVER HYDRO 898 SUGAR RIVER HYDRO 0.158 0.150 33 19 NH PSNH
889 SUNAPEE HYDRO 889 SUNAPEE HYDRO 0.593 0.433 33 19 NH PSNH
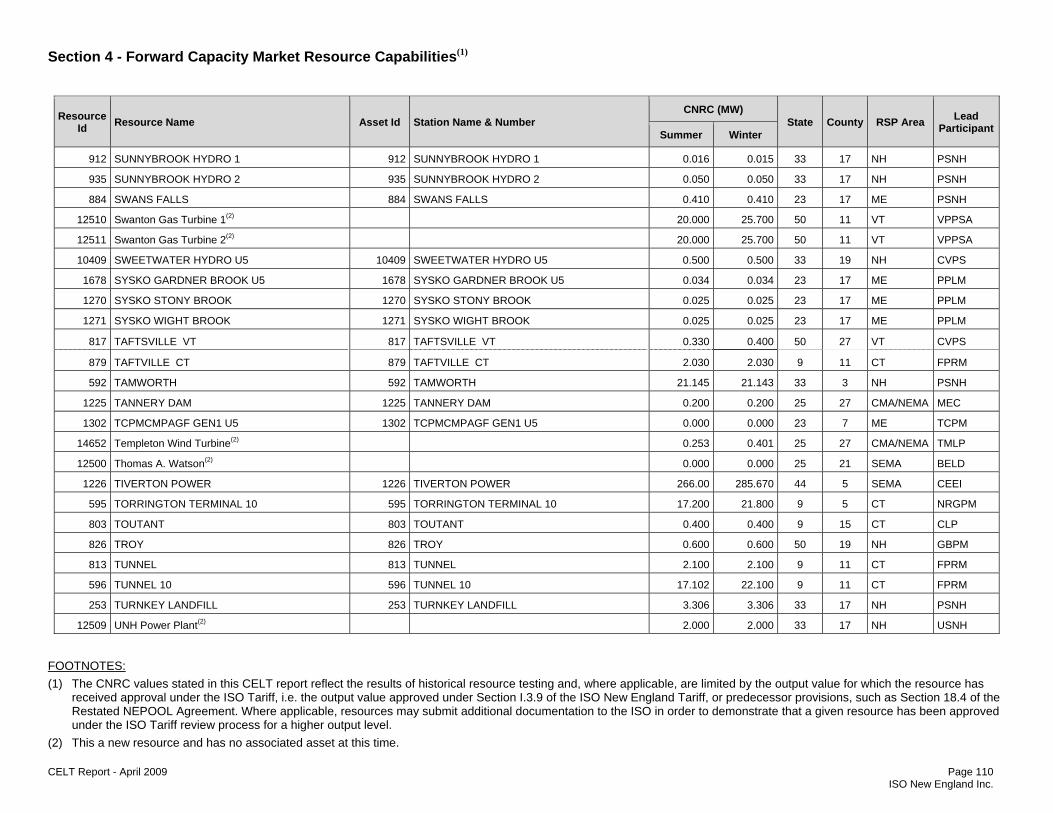
Section 4 - Forward Capacity Market Resource Capabilities(1)
FOOTNOTES: (1) The CNRC values stated in this CELT report reflect the results of historical resource testing and, where applicable, are limited by the output value for which the resource has
received approval under the ISO Tariff, i.e. the output value approved under Section I.3.9 of the ISO New England Tariff, or predecessor provisions, such as Section 18.4 of the Restated NEPOOL Agreement. Where applicable, resources may submit additional documentation to the ISO in order to demonstrate that a given resource has been approved under the ISO Tariff review process for a higher output level.
(2) This a new resource and has no associated asset at this time. CELT Report - April 2009 Page 110 ISO New England Inc.
Resource Id Resource Name Asset Id Station Name & Number
CNRC (MW) State County RSP Area Lead
Participant Summer Winter
912 SUNNYBROOK HYDRO 1 912 SUNNYBROOK HYDRO 1 0.016 0.015 33 17 NH PSNH
935 SUNNYBROOK HYDRO 2 935 SUNNYBROOK HYDRO 2 0.050 0.050 33 17 NH PSNH
884 SWANS FALLS 884 SWANS FALLS 0.410 0.410 23 17 ME PSNH
12510 Swanton Gas Turbine 1(2) 20.000 25.700 50 11 VT VPPSA
12511 Swanton Gas Turbine 2(2) 20.000 25.700 50 11 VT VPPSA
10409 SWEETWATER HYDRO U5 10409 SWEETWATER HYDRO U5 0.500 0.500 33 19 NH CVPS
1678 SYSKO GARDNER BROOK U5 1678 SYSKO GARDNER BROOK U5 0.034 0.034 23 17 ME PPLM
1270 SYSKO STONY BROOK 1270 SYSKO STONY BROOK 0.025 0.025 23 17 ME PPLM
1271 SYSKO WIGHT BROOK 1271 SYSKO WIGHT BROOK 0.025 0.025 23 17 ME PPLM
817 TAFTSVILLE VT 817 TAFTSVILLE VT 0.330 0.400 50 27 VT CVPS
879 TAFTVILLE CT 879 TAFTVILLE CT 2.030 2.030 9 11 CT FPRM
592 TAMWORTH 592 TAMWORTH 21.145 21.143 33 3 NH PSNH
1225 TANNERY DAM 1225 TANNERY DAM 0.200 0.200 25 27 CMA/NEMA MEC
1302 TCPMCMPAGF GEN1 U5 1302 TCPMCMPAGF GEN1 U5 0.000 0.000 23 7 ME TCPM
14652 Templeton Wind Turbine(2) 0.253 0.401 25 27 CMA/NEMA TMLP
12500 Thomas A. Watson(2) 0.000 0.000 25 21 SEMA BELD
1226 TIVERTON POWER 1226 TIVERTON POWER 266.00 285.670 44 5 SEMA CEEI
595 TORRINGTON TERMINAL 10 595 TORRINGTON TERMINAL 10 17.200 21.800 9 5 CT NRGPM
803 TOUTANT 803 TOUTANT 0.400 0.400 9 15 CT CLP
826 TROY 826 TROY 0.600 0.600 50 19 NH GBPM
813 TUNNEL 813 TUNNEL 2.100 2.100 9 11 CT FPRM
596 TUNNEL 10 596 TUNNEL 10 17.102 22.100 9 11 CT FPRM
253 TURNKEY LANDFILL 253 TURNKEY LANDFILL 3.306 3.306 33 17 NH PSNH
12509 UNH Power Plant(2) 2.000 2.000 33 17 NH USNH
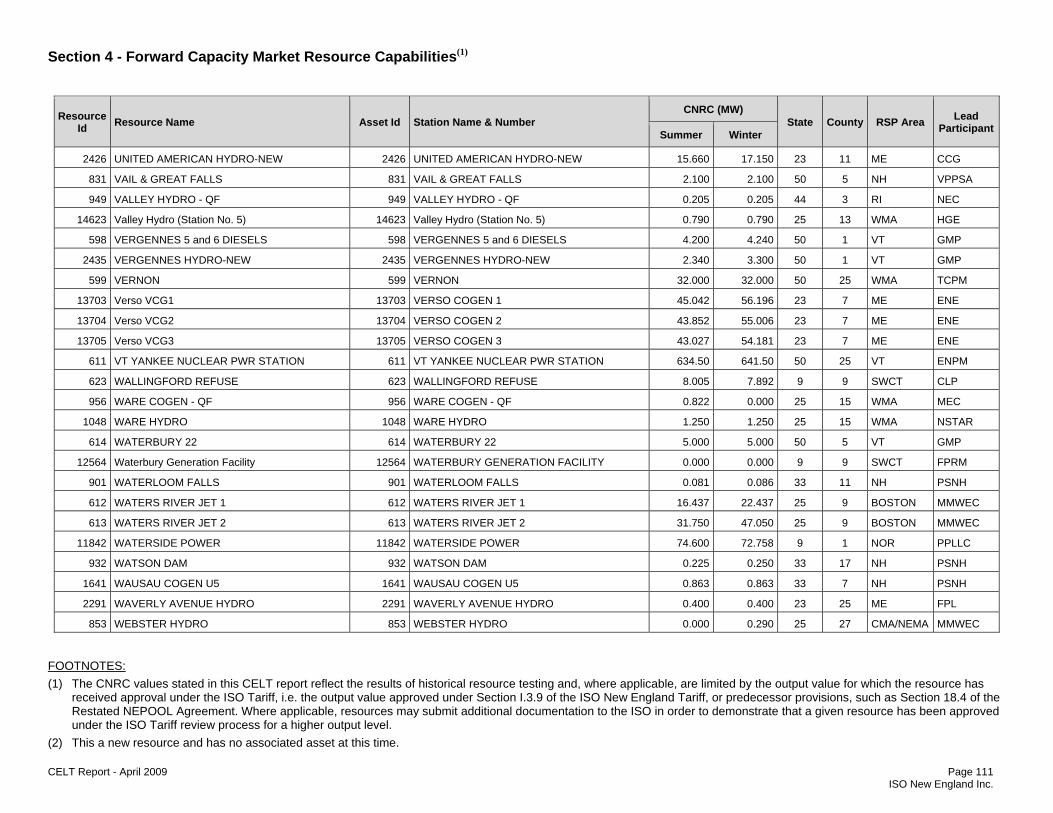
Section 4 - Forward Capacity Market Resource Capabilities(1)
FOOTNOTES: (1) The CNRC values stated in this CELT report reflect the results of historical resource testing and, where applicable, are limited by the output value for which the resource has
received approval under the ISO Tariff, i.e. the output value approved under Section I.3.9 of the ISO New England Tariff, or predecessor provisions, such as Section 18.4 of the Restated NEPOOL Agreement. Where applicable, resources may submit additional documentation to the ISO in order to demonstrate that a given resource has been approved under the ISO Tariff review process for a higher output level.
(2) This a new resource and has no associated asset at this time. CELT Report - April 2009 Page 111 ISO New England Inc.
Resource Id Resource Name Asset Id Station Name & Number
CNRC (MW) State County RSP Area Lead
Participant Summer Winter
2426 UNITED AMERICAN HYDRO-NEW 2426 UNITED AMERICAN HYDRO-NEW 15.660 17.150 23 11 ME CCG
831 VAIL & GREAT FALLS 831 VAIL & GREAT FALLS 2.100 2.100 50 5 NH VPPSA
949 VALLEY HYDRO - QF 949 VALLEY HYDRO - QF 0.205 0.205 44 3 RI NEC
14623 Valley Hydro (Station No. 5) 14623 Valley Hydro (Station No. 5) 0.790 0.790 25 13 WMA HGE
598 VERGENNES 5 and 6 DIESELS 598 VERGENNES 5 and 6 DIESELS 4.200 4.240 50 1 VT GMP
2435 VERGENNES HYDRO-NEW 2435 VERGENNES HYDRO-NEW 2.340 3.300 50 1 VT GMP
599 VERNON 599 VERNON 32.000 32.000 50 25 WMA TCPM
13703 Verso VCG1 13703 VERSO COGEN 1 45.042 56.196 23 7 ME ENE
13704 Verso VCG2 13704 VERSO COGEN 2 43.852 55.006 23 7 ME ENE
13705 Verso VCG3 13705 VERSO COGEN 3 43.027 54.181 23 7 ME ENE
611 VT YANKEE NUCLEAR PWR STATION 611 VT YANKEE NUCLEAR PWR STATION 634.50 641.50 50 25 VT ENPM
623 WALLINGFORD REFUSE 623 WALLINGFORD REFUSE 8.005 7.892 9 9 SWCT CLP
956 WARE COGEN - QF 956 WARE COGEN - QF 0.822 0.000 25 15 WMA MEC
1048 WARE HYDRO 1048 WARE HYDRO 1.250 1.250 25 15 WMA NSTAR
614 WATERBURY 22 614 WATERBURY 22 5.000 5.000 50 5 VT GMP
12564 Waterbury Generation Facility 12564 WATERBURY GENERATION FACILITY 0.000 0.000 9 9 SWCT FPRM
901 WATERLOOM FALLS 901 WATERLOOM FALLS 0.081 0.086 33 11 NH PSNH
612 WATERS RIVER JET 1 612 WATERS RIVER JET 1 16.437 22.437 25 9 BOSTON MMWEC
613 WATERS RIVER JET 2 613 WATERS RIVER JET 2 31.750 47.050 25 9 BOSTON MMWEC
11842 WATERSIDE POWER 11842 WATERSIDE POWER 74.600 72.758 9 1 NOR PPLLC
932 WATSON DAM 932 WATSON DAM 0.225 0.250 33 17 NH PSNH
1641 WAUSAU COGEN U5 1641 WAUSAU COGEN U5 0.863 0.863 33 7 NH PSNH
2291 WAVERLY AVENUE HYDRO 2291 WAVERLY AVENUE HYDRO 0.400 0.400 23 25 ME FPL
853 WEBSTER HYDRO 853 WEBSTER HYDRO 0.000 0.290 25 27 CMA/NEMA MMWEC

Section 4 - Forward Capacity Market Resource Capabilities(1)
FOOTNOTES: (1) The CNRC values stated in this CELT report reflect the results of historical resource testing and, where applicable, are limited by the output value for which the resource has
received approval under the ISO Tariff, i.e. the output value approved under Section I.3.9 of the ISO New England Tariff, or predecessor provisions, such as Section 18.4 of the Restated NEPOOL Agreement. Where applicable, resources may submit additional documentation to the ISO in order to demonstrate that a given resource has been approved under the ISO Tariff review process for a higher output level.
(2) This a new resource and has no associated asset at this time. CELT Report - April 2009 Page 112 ISO New England Inc.
Resource Id Resource Name Asset Id Station Name & Number
CNRC (MW) State County RSP Area Lead
Participant Summer Winter
825 WEST CHARLESTON 825 WEST CHARLESTON 0.800 0.800 50 19 NH GBPM
781 WEST DANVILLE 1 781 WEST DANVILLE 1 1.100 1.100 50 5 NH GMP
616 WEST ENFIELD 616 WEST ENFIELD 11.470 19.100 23 19 BHE FPL
893 WEST HOPKINTON HYDRO 893 WEST HOPKINTON HYDRO 0.735 1.250 33 13 NH PSNH
625 WEST MEDWAY JET 1 625 WEST MEDWAY JET 1 49.000 63.671 25 21 BOSTON EXNEH
626 WEST MEDWAY JET 2 626 WEST MEDWAY JET 2 49.000 60.750 25 21 BOSTON EXNEH
627 WEST MEDWAY JET 3 627 WEST MEDWAY JET 3 43.500 62.600 25 21 RI EXNEH
630 WEST SPRINGFIELD 10 630 WEST SPRINGFIELD 10 17.588 22.000 25 13 WMA CEEI
633 WEST SPRINGFIELD 3 633 WEST SPRINGFIELD 3 107.000 107.000 25 13 WMA CEEI
1693 WEST SPRINGFIELD GT-1 1693 WEST SPRINGFIELD GT-1 49.000 49.750 25 13 WMA CEEI
1694 WEST SPRINGFIELD GT-2 1694 WEST SPRINGFIELD GT-2 49.000 49.750 25 13 WMA CEEI
10770 WEST SPRINGFIELD HYDRO U5 10770 WEST SPRINGFIELD HYDRO U5 1.200 1.250 25 3 WMA HDEL
1031 WEST TISBURY 1031 WEST TISBURY 5.633 5.633 25 7 SEMA MET
1345 WESTBROOK 1417714178
WESTBROOK ENERGY CENTER G1 WESTBROOK ENERGY CENTER G2 517.280 562.304 23 5 SME CES
10451 WESTFIELD #1 U5 10451 WESTFIELD #1 U5 0.400 0.400 25 3 WMA WGED
617 WESTON 617 WESTON 13.200 13.200 23 25 ME FPLEMH
933 WESTON DAM 933 WESTON DAM 0.456 0.524 33 7 NH PSNH
349 WHEELABRATOR BRIDGEPORT, L.P. 349 WHEELABRATOR BRIDGEPORT, L.P. 59.650 60.500 9 1 SWCT WB
10404 WHEELABRATOR CLAREMONT U5 10404 WHEELABRATOR CLAREMONT U5 5.290 5.290 33 19 NH PSNH
547 WHEELABRATOR NORTH ANDOVER 547 WHEELABRATOR NORTH ANDOVER 31.790 31.980 25 9 BOSTON WNE
619 WHITE LAKE JET 619 WHITE LAKE JET 18.100 23.165 33 3 NH PSNH
620 WILDER 620 WILDER 42.920 43.880 50 27 VT TCPM
621 WILLIAMS 621 WILLIAMS 14.900 14.900 23 25 ME FPLEMH
801 WILLIMANTIC 1 801 WILLIMANTIC 1 0.423 0.770 9 15 CT CLP
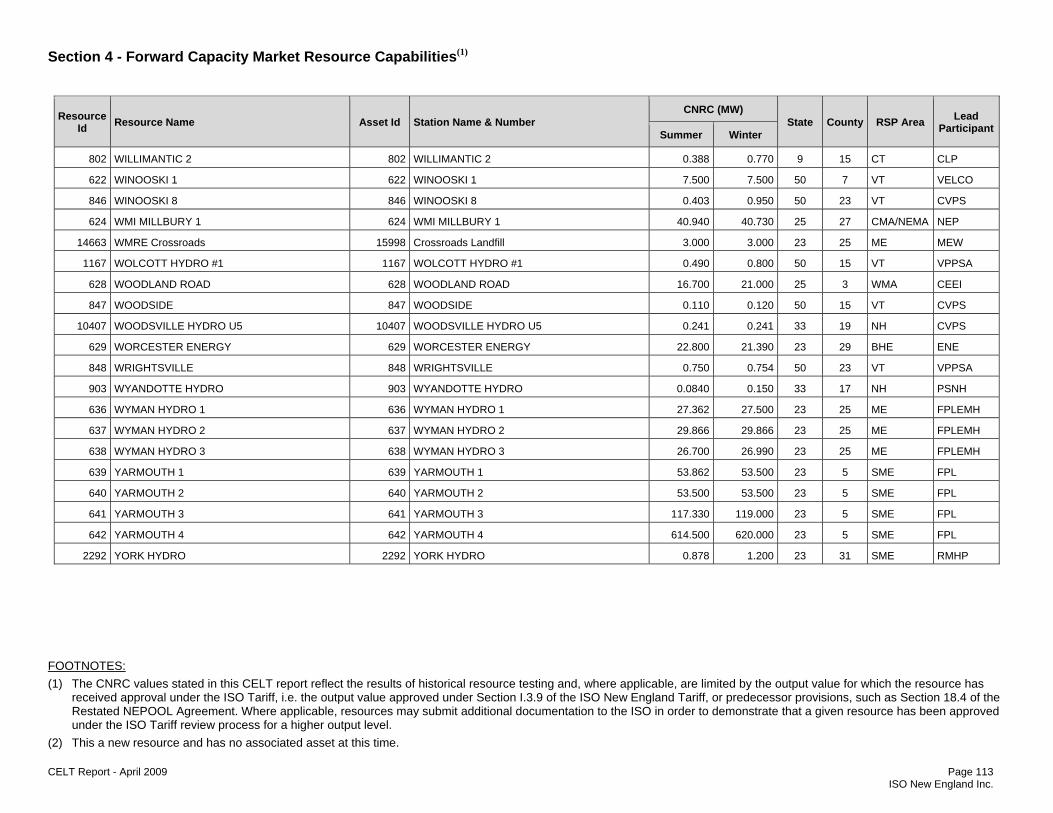
Section 4 - Forward Capacity Market Resource Capabilities(1)
FOOTNOTES: (1) The CNRC values stated in this CELT report reflect the results of historical resource testing and, where applicable, are limited by the output value for which the resource has
received approval under the ISO Tariff, i.e. the output value approved under Section I.3.9 of the ISO New England Tariff, or predecessor provisions, such as Section 18.4 of the Restated NEPOOL Agreement. Where applicable, resources may submit additional documentation to the ISO in order to demonstrate that a given resource has been approved under the ISO Tariff review process for a higher output level.
(2) This a new resource and has no associated asset at this time. CELT Report - April 2009 Page 113 ISO New England Inc.
Resource Id Resource Name Asset Id Station Name & Number
CNRC (MW) State County RSP Area Lead
Participant Summer Winter
802 WILLIMANTIC 2 802 WILLIMANTIC 2 0.388 0.770 9 15 CT CLP
622 WINOOSKI 1 622 WINOOSKI 1 7.500 7.500 50 7 VT VELCO
846 WINOOSKI 8 846 WINOOSKI 8 0.403 0.950 50 23 VT CVPS
624 WMI MILLBURY 1 624 WMI MILLBURY 1 40.940 40.730 25 27 CMA/NEMA NEP
14663 WMRE Crossroads 15998 Crossroads Landfill 3.000 3.000 23 25 ME MEW
1167 WOLCOTT HYDRO #1 1167 WOLCOTT HYDRO #1 0.490 0.800 50 15 VT VPPSA
628 WOODLAND ROAD 628 WOODLAND ROAD 16.700 21.000 25 3 WMA CEEI
847 WOODSIDE 847 WOODSIDE 0.110 0.120 50 15 VT CVPS
10407 WOODSVILLE HYDRO U5 10407 WOODSVILLE HYDRO U5 0.241 0.241 33 19 NH CVPS
629 WORCESTER ENERGY 629 WORCESTER ENERGY 22.800 21.390 23 29 BHE ENE
848 WRIGHTSVILLE 848 WRIGHTSVILLE 0.750 0.754 50 23 VT VPPSA
903 WYANDOTTE HYDRO 903 WYANDOTTE HYDRO 0.0840 0.150 33 17 NH PSNH
636 WYMAN HYDRO 1 636 WYMAN HYDRO 1 27.362 27.500 23 25 ME FPLEMH
637 WYMAN HYDRO 2 637 WYMAN HYDRO 2 29.866 29.866 23 25 ME FPLEMH
638 WYMAN HYDRO 3 638 WYMAN HYDRO 3 26.700 26.990 23 25 ME FPLEMH
639 YARMOUTH 1 639 YARMOUTH 1 53.862 53.500 23 5 SME FPL
640 YARMOUTH 2 640 YARMOUTH 2 53.500 53.500 23 5 SME FPL
641 YARMOUTH 3 641 YARMOUTH 3 117.330 119.000 23 5 SME FPL
642 YARMOUTH 4 642 YARMOUTH 4 614.500 620.000 23 5 SME FPL
2292 YORK HYDRO 2292 YORK HYDRO 0.878 1.200 23 31 SME RMHP
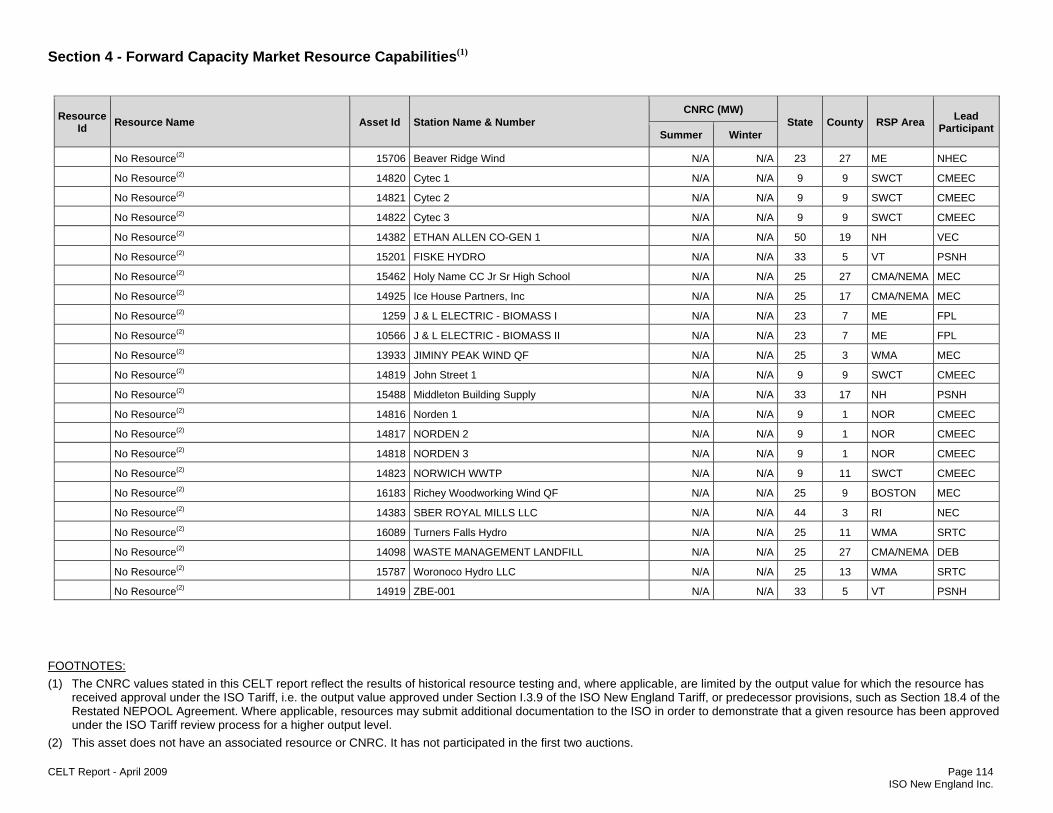
Section 4 - Forward Capacity Market Resource Capabilities(1)
FOOTNOTES: (1) The CNRC values stated in this CELT report reflect the results of historical resource testing and, where applicable, are limited by the output value for which the resource has
received approval under the ISO Tariff, i.e. the output value approved under Section I.3.9 of the ISO New England Tariff, or predecessor provisions, such as Section 18.4 of the Restated NEPOOL Agreement. Where applicable, resources may submit additional documentation to the ISO in order to demonstrate that a given resource has been approved under the ISO Tariff review process for a higher output level.
(2) This asset does not have an associated resource or CNRC. It has not participated in the first two auctions. CELT Report - April 2009 Page 114 ISO New England Inc.
Resource Id Resource Name Asset Id Station Name & Number
CNRC (MW) State County RSP Area Lead
Participant Summer Winter
No Resource(2) 15706 Beaver Ridge Wind N/A N/A 23 27 ME NHEC
No Resource(2) 14820 Cytec 1 N/A N/A 9 9 SWCT CMEEC
No Resource(2) 14821 Cytec 2 N/A N/A 9 9 SWCT CMEEC
No Resource(2) 14822 Cytec 3 N/A N/A 9 9 SWCT CMEEC
No Resource(2) 14382 ETHAN ALLEN CO-GEN 1 N/A N/A 50 19 NH VEC
No Resource(2) 15201 FISKE HYDRO N/A N/A 33 5 VT PSNH
No Resource(2) 15462 Holy Name CC Jr Sr High School N/A N/A 25 27 CMA/NEMA MEC
No Resource(2) 14925 Ice House Partners, Inc N/A N/A 25 17 CMA/NEMA MEC
No Resource(2) 1259 J & L ELECTRIC - BIOMASS I N/A N/A 23 7 ME FPL
No Resource(2) 10566 J & L ELECTRIC - BIOMASS II N/A N/A 23 7 ME FPL
No Resource(2) 13933 JIMINY PEAK WIND QF N/A N/A 25 3 WMA MEC
No Resource(2) 14819 John Street 1 N/A N/A 9 9 SWCT CMEEC
No Resource(2) 15488 Middleton Building Supply N/A N/A 33 17 NH PSNH
No Resource(2) 14816 Norden 1 N/A N/A 9 1 NOR CMEEC
No Resource(2) 14817 NORDEN 2 N/A N/A 9 1 NOR CMEEC
No Resource(2) 14818 NORDEN 3 N/A N/A 9 1 NOR CMEEC
No Resource(2) 14823 NORWICH WWTP N/A N/A 9 11 SWCT CMEEC
No Resource(2) 16183 Richey Woodworking Wind QF N/A N/A 25 9 BOSTON MEC
No Resource(2) 14383 SBER ROYAL MILLS LLC N/A N/A 44 3 RI NEC
No Resource(2) 16089 Turners Falls Hydro N/A N/A 25 11 WMA SRTC
No Resource(2) 14098 WASTE MANAGEMENT LANDFILL N/A N/A 25 27 CMA/NEMA DEB
No Resource(2) 15787 Woronoco Hydro LLC N/A N/A 25 13 WMA SRTC
No Resource(2) 14919 ZBE-001 N/A N/A 33 5 VT PSNH

Section 4 - Forward Capacity Market Resource Capabilities
FOOTNOTES: (1) The CNRC values stated in this CELT report reflect the results of historical resource testing and, where applicable, are limited by the output value for which the resource has
received approval under the ISO Tariff, i.e. the output value approved under Section I.3.9 of the ISO New England Tariff, or predecessor provisions, such as Section 18.4 of the Restated NEPOOL Agreement. Where applicable, resources may submit additional documentation to the ISO in order to demonstrate that a given resource has been approved under the ISO Tariff review process for a higher output level.
(2) This asset does not have an associated resource or CNRC. It has not participated in the first two auctions. CELT Report - April 2009 Page 115 ISO New England Inc.
4.2 Multi-Year Obligation Resources
Resource Id Resource Name Pricing Election Years
Resource Type
Commitment Period
Capacity Supply
Obligation
12586 Efficiency Maine Residential Efficient Products 5 Demand 2010 23.726
12693 PSNH CORE Energy Efficiency Programs 5 Demand 2010 20.226
12694 Acushnet Company - Ball Plant II - Combined Heat and Power Project 5 Demand 2010 2.469
12705 Cape Light Compact Energy Efficiency Portfolio 5 Demand 2010 11.8
12763 ECS-Critical Peak#1-NEMASS(A) 3 Demand 2010 2.469
12764 ECS-Critical Peak#10-Connecticut(E) 3 Demand 2010 2.469
12768 ECS-Critical Peak#2-NEMASS(B) 3 Demand 2010 2.469
12769 ECS-Critical Peak#3-NEMASS-C 3 Demand 2010 2.469
12770 ECS-Critical Peak#4-NEMASS(D) 3 Demand 2010 2.469
12771 ECS-Critical Peak#5-NEMASS(E) 3 Demand 2010 2.469
12772 ECS-Critical Peak#6-Connecticut(A) 3 Demand 2010 2.469
12773 ECS-Critical Peak#7-Connecticut(B) 3 Demand 2010 2.469
12774 ECS-Critical Peak#8-Connecticut( C ) 3 Demand 2010 2.469
12775 ECS-Critical Peak#9-Connecticut(D) 3 Demand 2010 2.469
12776 Multiple projects 3 Demand 2010 2.468
12786 CSG Aggregation of DG and 24 hr lighting EE - NEMA1 5 Demand 2010 1.861
12790 CSG Aggregation of DG and 24 hr lighting EE -RI 5 Demand 2010 0.705
12791 CSG Aggregation of DG and 24 hr lighting EE - SEMA1 5 Demand 2010 1.734
12798 CSG Aggregation of DG and 24 hr lighting EE - VT 5 Demand 2010 0.864
12799 CSG Aggregation of DG and 24 hr lighting EE - WCMA1 5 Demand 2010 2.469
12802 University of Massachusetts Central Heating Plant 5 Demand 2010 11.727
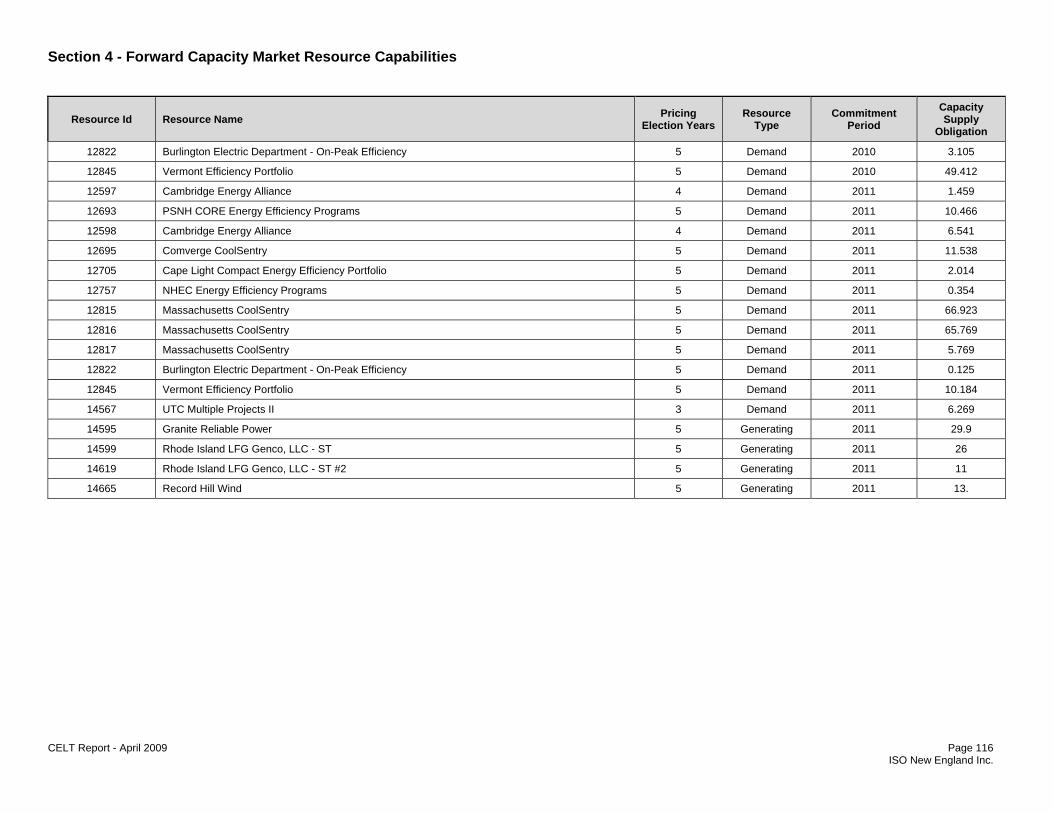
Section 4 - Forward Capacity Market Resource Capabilities
CELT Report - April 2009 Page 116 ISO New England Inc.
Resource Id Resource Name Pricing Election Years
Resource Type
Commitment Period
Capacity Supply
Obligation
12822 Burlington Electric Department - On-Peak Efficiency 5 Demand 2010 3.105
12845 Vermont Efficiency Portfolio 5 Demand 2010 49.412
12597 Cambridge Energy Alliance 4 Demand 2011 1.459
12693 PSNH CORE Energy Efficiency Programs 5 Demand 2011 10.466
12598 Cambridge Energy Alliance 4 Demand 2011 6.541
12695 Comverge CoolSentry 5 Demand 2011 11.538
12705 Cape Light Compact Energy Efficiency Portfolio 5 Demand 2011 2.014
12757 NHEC Energy Efficiency Programs 5 Demand 2011 0.354
12815 Massachusetts CoolSentry 5 Demand 2011 66.923
12816 Massachusetts CoolSentry 5 Demand 2011 65.769
12817 Massachusetts CoolSentry 5 Demand 2011 5.769
12822 Burlington Electric Department - On-Peak Efficiency 5 Demand 2011 0.125
12845 Vermont Efficiency Portfolio 5 Demand 2011 10.184
14567 UTC Multiple Projects II 3 Demand 2011 6.269
14595 Granite Reliable Power 5 Generating 2011 29.9
14599 Rhode Island LFG Genco, LLC - ST 5 Generating 2011 26
14619 Rhode Island LFG Genco, LLC - ST #2 5 Generating 2011 11
14665 Record Hill Wind 5 Generating 2011 13.

CELT Report - April 2009 Page 117 ISO New England Inc.
Section 5 Transmission Information 5.1 Links Information on the ISO New England Regional Transmission Project List is published periodically and can be found at: http://www.iso-ne.com/trans/rsp/index.html. It is currently published every April, July, and October and is referred to as the April, July, and October Regional System Plan (RSP) Update, respectively. The 'RSP Transmission Project Listing - April 2009 Update' contains the prospective ISO New England Transmission System that shall be considered part of the 2009 CELT Report. http://www.iso-ne.com/trans/rsp/index.html. The new interconnection agreement list may be found at http://www.iso-ne.com/genrtion_resrcs/nwgen_inter/index.html and http://www.iso-ne.com/genrtion_resrcs/nwgen_inter/status/index.html.

CELT Report - April 2009 Page 118 ISO New England Inc.
Appendix A
A.1 Definitions
Section 1 - Summaries The summary pages of this report contain terms used to describe how the ISO-NE Control Area forecast is adjusted. The definitions for those terms are as follows:
Load The ten year forecast of the ISO New England Control Area (CA) energy and seasonal peak load demand is based on econometric models of energy and seasonal peaks for the ISO-NE CA and the six New England states. The peak forecast has been adjusted to include the current MW reductions achieved by the Other Demand Resources during the ICAP Transition Period (ODR), as they are treated as a resource in the Installed Capacity Requirement (ICR) calculations. The ten year forecast for New England includes the load forecast for Northern Maine provided by the Maine Public Service Company.
Reserves Installed Reserves in megawatts (MW) are calculated by taking the total Capabilities (including the net of Purchases and Sales) for the ISO Control Area, less the Reference Load forecast for the ISO Control Area. The Installed Reserves as a percentage of Load are calculated by taking the total Installed Reserves and dividing them by the total Reference Load.
Capabilities Summer and Winter Rating: Claimed Capability Ratings are the maximum dependable load carrying ability of a generating unit or units, excluding capacity required for station service use. The rating is based on the Seasonal Claimed Capability (SCC) Audits conducted according to Market Rule 1, and ISO New England Manual for Installed Capacity Manual M-20. For additional information, please visit ISO-NE’s website at: http://www.iso-ne.com/rules_proceds/isone_mnls/index.html.
Forward Capacity Market Capability The CELT Report takes into account the generating capacity supply obligations for the Forward Capacity Market’s (FCM) 2010-2011 and 2011-2012 Capacity Commitment Periods. The ISO-NE’s first Forward Capacity Auction was held on February 4, 2008 and the second Forward Capacity Auction was held on December 8, 2008. These included new and existing generating resources, demand resources, as well as imports. Beginning in summer 2010, the CELT existing generating asset capacity included in the Section 1 totals is consistent with the existing generating assets that have Forward Capacity Market obligations. The obligation for the 2011-2012 Capacity Commitment Period is carried through the end of the CELT reporting period. All capacity supply obligations may be found at http://www.iso-ne.com/regulatory/ferc/filings/2008/mar/er08-633-000_03-03-08_fca_results_filing.pdf) and http://www.iso-ne.com/regulatory/ferc/filings/2008/dec/er09-467-000_12-23-08_fca_results.pdf). Values represent Resource Capacity Supply Obligations for the Capacity Commitment Period as of April 1, 2009.
Demand Response Demand Response (DR) programs at ISO New England are used to react to market supply conditions. These programs involve having the electricity customers reduce their consumption at critical times (such as peak) or in response to market prices.

Appendix A
CELT Report - April 2009 Page 119 ISO New England Inc.
Net of Firm Purchases/Sales: The firm power that is available to or from entities outside the ISO New England Control Area at the time of peak. A firm power purchase results when the seller is obligated to deliver power to the purchaser with the same degree of reliability as provided to the seller's own non-interruptible load customers. Capacity Purchase is a total of all capacity purchased from entities outside the interconnection boundaries of the ISO New England Control Area during the month of the seasonal peak of the purchasing Council or Reporting Party. Capacity Sale is a total of all capacity sales to entities outside the interconnection boundaries of the ISO New England Control Area during the month of the seasonal peak of the sales Council or Reporting Party.
Section 2 - ISO-NE Control Area Capability
ISO-NE Control Area Capability (Section 2.1) Capacity Values as of January 1, 2009 In Section 2.1, generating assets claimed toward capability are listed by Lead Market Participant. These are facilities which may, or may not, be owned, managed, or operated by the Lead Market Participant. These generating assets and the capabilities listed are as they existed as of January 1, 2009 in the ISO-NE Market System. Lead Participant updates to generating assets since January 1, are listed at the end of Section 2.1 on the endnotes page.
They also include some cogeneration and small power production facilities defined as Qualifying Facilities (QF) under the Public Utility Regulatory Policies Act (PURPA) of 1978 and any other generators not covered by PURPA but reported by a Participant. Some of these generating units sell electrical energy or capacity, or both, to ISO-NE Market Participants. As these generators are independent power producers, not subject to operational control by the Lead Market Participant, the facility owner and/or operator is responsible for facility's operation.
This section of the CELT Report was tabulated from data provided by ISO-NE Market Participants. Although every effort has been made to verify its content, ISO New England does not assume responsibility for the accuracy or clarity of the data presented.
The start dates for existing units claimed for capability are consistent with those reported by ISO-NE Market Participants.
Net of Firm Power Purchases and Sales Outside of ISO-NE Control Area (Section 2.2): Net of firm purchases and sales from outside the interconnection boundaries of the ISO New England Control area as of the Actual Winter Peak, which occurred on December 8, 2008, and Summer Peak Forecast of August 1, 2009.
Deactivated Units Removed from ISO-NE Control Area Capability (Section 2.3): List of units that have been placed on Deactivated Reserve.

Appendix A
CELT Report - April 2009 Page 120 ISO New England Inc.
Section 3 - Capability by Fuel/Unit Type
Existing Summer/Winter Capability by Fuel/Unit Type: Section 3 lists all generators claimed for capability as of the Actual Winter Peak (Section 3.1) for 2008/09, which occurred on December 8, 2008, and Summer Peak Forecast of August 1, 2009 (Section 3.2) of the reporting year in the ISO-NE Control Area.
Section 4 – Forward Capacity Market Resource Capabilities New this year is Section 4, “Forward Capacity Market Resource Capabilities.” The October 31, 2008 Forward Capacity Market (FCM)/Queue Amendments filing (FERC Docket ER09237 http://www.iso-ne.com/regulatory/ferc/filings/2008/oct/er09-237-000_10-8-31_fcm_queue.pdf ) established the Capacity Network Resource Capability (CNRC) values for each generating resource.
Capacity Network Resource Capability (CNRC): The CNRC defines the amount of Capacity Network Resource Interconnection Service rights that must be maintained for the generator. The CNRC also defines whether an Interconnection Request is required for a proposed increase in Capacity Network Resource Capability in accordance with Schedule 22 and 23 of the Tariff (Large/Small Generator Interconnection Procedures) and whether an initial interconnection analysis is required under FCM qualification for a proposed increase in output from an Existing Generating Capacity Resource. Section 4.1 lists the CNRC values available at the time of publication of the CELT Report for generating assets by resource.
Multi-Year Obligation Resources: Section 4.2, “Multi-Year Obligation Resources” is a list of FCM resources with a capacity supply obligation, in which an election has been made to offer their capacity for up to four additional and consecutive Capacity Commitment Periods in compliance with Section III.13.1.1.2.2.4 of Market Rule 1.
Section 5 - Transmission Information on the ISO New England Regional Transmission Projects is periodically published and can be found at: http://www.iso-ne.com/trans/rsp/index.html. It is currently published every April, July, and October and is referred to as the April, July, and October Regional System Plan (RSP) Update respectively.
The 'RSP Transmission Project Listing - April 2009 Update' contains the prospective ISO New England Transmission System that shall be considered part of the 2009 CELT Report.

Appendix A
CELT Report - April 2009 Page 121 ISO New England Inc.
A.2 Company Abbreviations The first column or header in Section 2 of this report lists company abbreviations. Below are the abbreviations used throughout the CELT Report along with their corresponding name.
LP Acronym Lead Participant ANP ANP Funding I, LLC BED Burlington Electric Department BELD Braintree Electric Light Department, Town of BEM Brookfield Energy Marketing Inc. BG Boston Generating, LLC BGDP BG Dighton Power, LLC BHI Blackstone Hydro, Inc. BSE Boralex Stratton Energy LP BSP Bear Swamp Power Company LLC CEC Constellation Energy Commodities CEEI Consolidated Edison Energy, Inc CES Calpine Energy Services, LP CESLLC Competitive Energy Services, LLC CHA Covanta Haverhill Associates CLP Connecticut Light and Power Company, The CM Covanta Maine, LLC CMEEC Connecticut Municipal Electric Energy Cooperative CMLP Chicopee Municipal Lighting Plant CMS CMS Energy Resource Management Company CNE Constellation NewEnergy, Inc. CVPS Central Vermont Public Service DEB Direct Energy Business, LLC DEM Dominion Energy Marketing, Inc. DPA Dartmouth Power Associates, LP DPM Dynegy Power Marketing, Inc.

Appendix A
CELT Report - April 2009 Page 122 ISO New England Inc.
LP Acronym Lead Participant ENE Energy New England LLC ENPM Entergy Nuclear Power Marketing LLC EWPV Evergreen Wind Power V, LLC EXNEH Exelon New England Holdings, LLC FGE Fitchburg Gas & Electric Light Company FPL NextEra Energy Power Marketing, LLC FPLEMH FPL Energy Maine Hydro LLC FPRM FirstLight Power Resources Management, LLC GBPM Great Bay Power Marketing, Inc GELD Groton Electric Light Department GMP Green Mountain Power Corporation HDEL Harvard Dedicated Energy Limited HGE Holyoke Gas & Electric Department HLPD Hudson Light & Power Department HMLP Hingham Municipal Lighting Plant HQE H.Q. Energy Services (US) Inc. HULL Hull Municipal Lighting Plant IEA Indeck Energy-Alexandria, L.L.C. IES Integrys Energy Services, Inc. IMLD Ipswich Municipal Light Department JPMVEC J.P. Morgan Ventures Energy Corporation LELWD Littleton Electric Light & Water Department LRGC Lake Road Generating Company MASSPOWER MASSPOWER MATEP MATEP, LLC MBTA MA Bay Transp Auth (MBTA) MEC Massachusetts Electric Company MET Mirant Energy Trading, LLC MEW Madison Electric Works MLC Merrill Lynch Commodities, Inc.
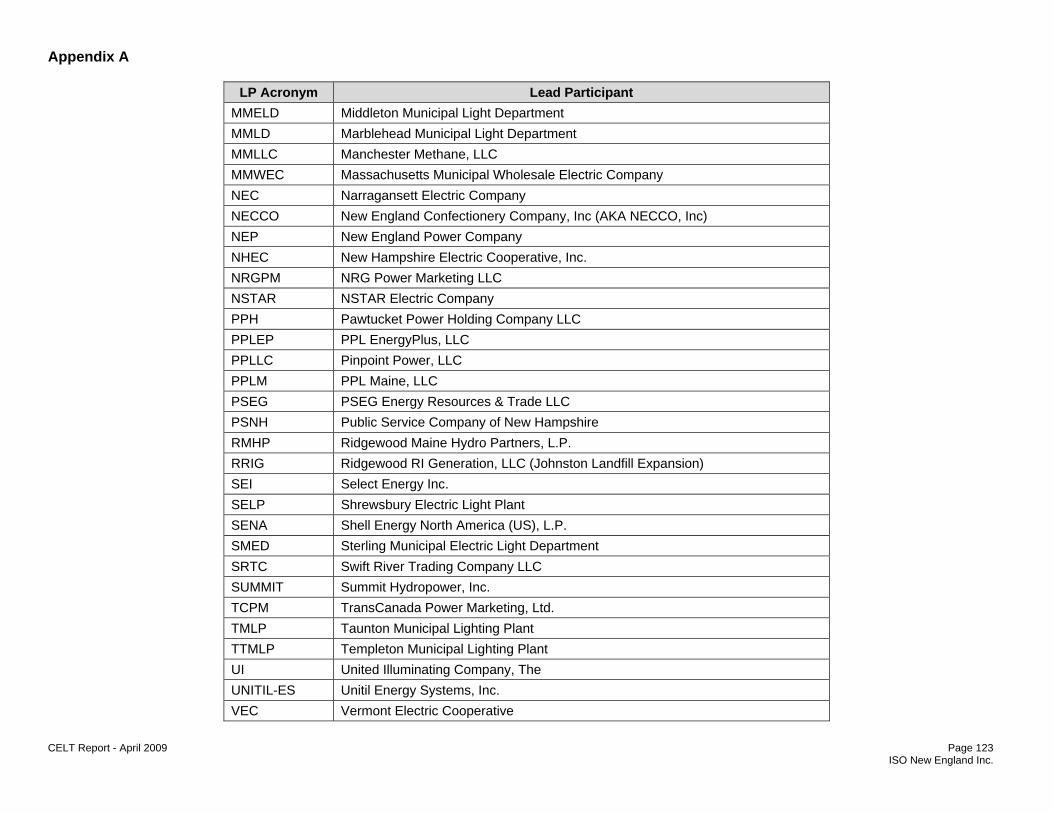
Appendix A
CELT Report - April 2009 Page 123 ISO New England Inc.
LP Acronym Lead Participant MMELD Middleton Municipal Light Department MMLD Marblehead Municipal Light Department MMLLC Manchester Methane, LLC MMWEC Massachusetts Municipal Wholesale Electric Company NEC Narragansett Electric Company NECCO New England Confectionery Company, Inc (AKA NECCO, Inc) NEP New England Power Company NHEC New Hampshire Electric Cooperative, Inc. NRGPM NRG Power Marketing LLC NSTAR NSTAR Electric Company PPH Pawtucket Power Holding Company LLC PPLEP PPL EnergyPlus, LLC PPLLC Pinpoint Power, LLC PPLM PPL Maine, LLC PSEG PSEG Energy Resources & Trade LLC PSNH Public Service Company of New Hampshire RMHP Ridgewood Maine Hydro Partners, L.P. RRIG Ridgewood RI Generation, LLC (Johnston Landfill Expansion) SEI Select Energy Inc. SELP Shrewsbury Electric Light Plant SENA Shell Energy North America (US), L.P. SMED Sterling Municipal Electric Light Department SRTC Swift River Trading Company LLC SUMMIT Summit Hydropower, Inc. TCPM TransCanada Power Marketing, Ltd. TMLP Taunton Municipal Lighting Plant TTMLP Templeton Municipal Lighting Plant UI United Illuminating Company, The UNITIL-ES Unitil Energy Systems, Inc. VEC Vermont Electric Cooperative
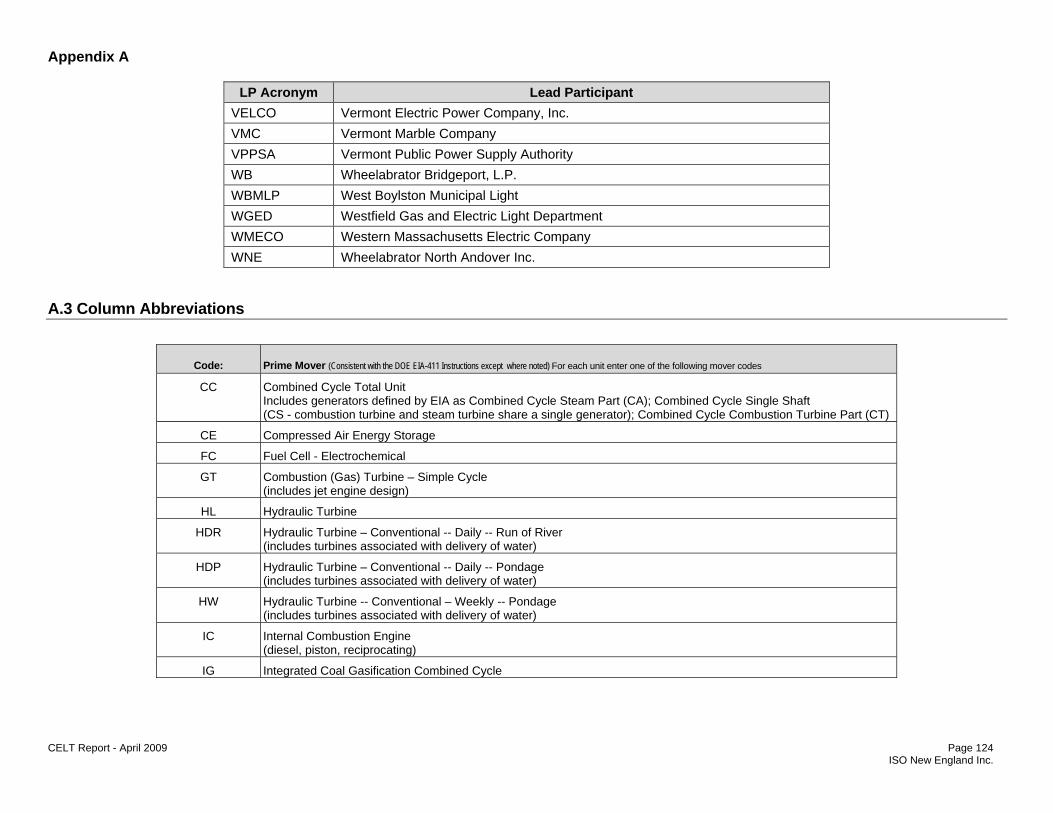
Appendix A
CELT Report - April 2009 Page 124 ISO New England Inc.
LP Acronym Lead Participant VELCO Vermont Electric Power Company, Inc. VMC Vermont Marble Company VPPSA Vermont Public Power Supply Authority WB Wheelabrator Bridgeport, L.P. WBMLP West Boylston Municipal Light WGED Westfield Gas and Electric Light Department WMECO Western Massachusetts Electric Company WNE Wheelabrator North Andover Inc.
A.3 Column Abbreviations
Code: Prime Mover (Consistent with the DOE EIA-411 Instructions except where noted) For each unit enter one of the following mover codes
CC Combined Cycle Total Unit Includes generators defined by EIA as Combined Cycle Steam Part (CA); Combined Cycle Single Shaft (CS - combustion turbine and steam turbine share a single generator); Combined Cycle Combustion Turbine Part (CT)
CE Compressed Air Energy Storage
FC Fuel Cell - Electrochemical
GT Combustion (Gas) Turbine – Simple Cycle (includes jet engine design)
HL Hydraulic Turbine
HDR Hydraulic Turbine – Conventional -- Daily -- Run of River (includes turbines associated with delivery of water)
HDP Hydraulic Turbine – Conventional -- Daily -- Pondage (includes turbines associated with delivery of water)
HW Hydraulic Turbine -- Conventional – Weekly -- Pondage (includes turbines associated with delivery of water)
IC Internal Combustion Engine (diesel, piston, reciprocating)
IG Integrated Coal Gasification Combined Cycle
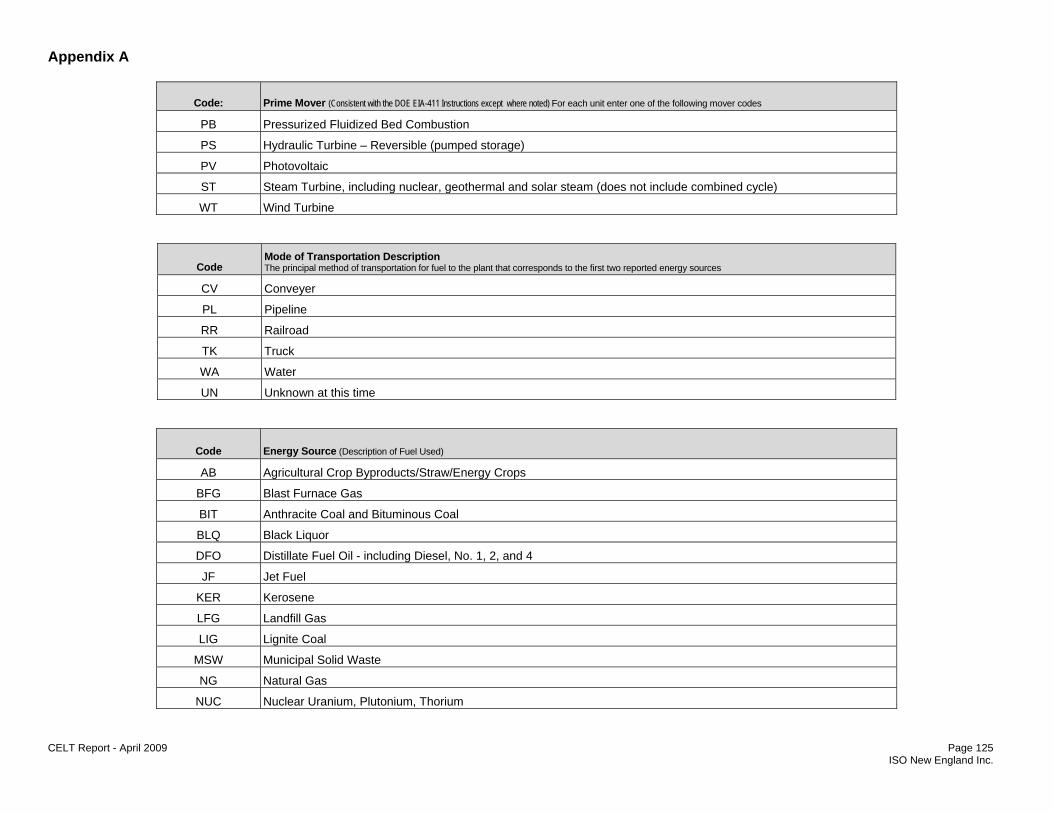
Appendix A
CELT Report - April 2009 Page 125 ISO New England Inc.
Code: Prime Mover (Consistent with the DOE EIA-411 Instructions except where noted) For each unit enter one of the following mover codes
PB Pressurized Fluidized Bed Combustion
PS Hydraulic Turbine – Reversible (pumped storage)
PV Photovoltaic
ST Steam Turbine, including nuclear, geothermal and solar steam (does not include combined cycle)
WT Wind Turbine
Code Mode of Transportation Description The principal method of transportation for fuel to the plant that corresponds to the first two reported energy sources
CV Conveyer
PL Pipeline
RR Railroad
TK Truck
WA Water
UN Unknown at this time
Code Energy Source (Description of Fuel Used)
AB Agricultural Crop Byproducts/Straw/Energy Crops
BFG Blast Furnace Gas
BIT Anthracite Coal and Bituminous Coal
BLQ Black Liquor
DFO Distillate Fuel Oil - including Diesel, No. 1, 2, and 4
JF Jet Fuel
KER Kerosene
LFG Landfill Gas
LIG Lignite Coal
MSW Municipal Solid Waste
NG Natural Gas
NUC Nuclear Uranium, Plutonium, Thorium

Appendix A
CELT Report - April 2009 Page 126 ISO New England Inc.
Code Energy Source (Description of Fuel Used)
OBG Other Biomass Gas - includes digester gas, methane, and other biomass gasses
OBL Other Biomass Liquids
OBS Other Biomass Solids
OG Other Gas
PC Petroleum Coke
PG Gaseous Propane
PUR Purchased Steam
RFO Residual Fuel Oil Includes: Bunker C, No. 5, and No. 6 (020, 030, 070, and 100)
SC Coal Synfuel - Coal-based solid fuel - processed by a coal synfuel plant; and coal-based fuels such as briquettes, pellets, or extrusions, which are formed from fresh or recycled coal and binding materials
SLW Sludge Waste
SUB Subbituminous Coal
SUN Solar
TDF Tire-derived Fuels
WAT Water at a Conventional Hydroelectric Turbine
WC Waste/Other Coal - including anthracite culm, bituminous gob, fine coal, lignite waste, waste coal
WDL Wood Waste Liquids excluding Black Liquor - includes red liquor, sludge wood, spent sulfite liquor, and other wood-based liquids
WDS Wood/Wood Waste Solids - including paper pellets, railroad ties, utility poles, wood chips, bark, and wood waste solids
WND Wind
WO Waste/Other Oil - including Crude Oil, Liquid Butane, Liquid Propane, Oil Waste, Re-Refined Motor Oil, Sludge Oil, Tar Oil, or other petroleum-based liquid wastes

CELT Report - April 2009 Page 127 ISO New England Inc.
Appendix B B.1 Federal Information Processing Standard (FIPS) Codes The location of each generating unit is expressed by using the Federal Information Processing Service's (FIPS) two-digit state code and three-digit county code.
FIPS Code County Name
FIPS Code County Name (Cont'd)
FIPS Code County Name (Cont'd)
FIPS Code County Name (Cont'd)
09 - State of Connecticut 001 Fairfield 005 Litchfield 009 New Haven 013 Tolland 003 Hartford 007 Middlesex 011 New London 015 Windham
23 - State of Maine 001 Androscoggin 009 Hancock 017 Oxford 025 Somerset 003 Aroostook 011 Kennebec 019 Penobscot 027 Waldo 005 Cumberland 013 Knox 021 Piscataquis 029 Washington 007 Franklin 015 Lincoln 023 Sagadahoc 031 York
25 - State of Massachusetts 001 Barnstable 009 Essex 017 Middlesex 025 Suffolk 003 Berkshire 011 Franklin 019 Nantucket 027 Worcester 005 Bristol 013 Hampden 021 Norfolk 007 Dukes 015 Hampshire 023 Plymouth
33 - State of New Hampshire 001 Belknap 007 Coös 013 Merrimack 019 Sullivan 003 Carroll 009 Grafton 015 Rockingham 005 Cheshire 011 Hillsborough (Hillsboro) 017 Strafford
44 - State of Rhode Island 001 Bristol 005 Newport 009 Washington 003 Kent 007 Providence
50 - State of Vermont 001 Addison 009 Essex 017 Orange 025 Windham 003 Bennington 011 Franklin 019 Orleans 027 Windsor 005 Caledonia 013 Grand Isle 021 Rutland 007 Chittenden 015 Lamoille 023 Washington

Appendix B
CELT Report - April 2009 Page 128 ISO New England Inc.
B.2 Regional System Plan (RSP) Subarea Descriptions
Subarea or Control Area Designation Region or State
BHE Northeastern Maine
ME Western and central Maine/Saco Valley, New Hampshire
SME Southeastern Maine
NH Northern, eastern, and central New Hampshire/eastern Vermont and southwestern Maine
VT Vermont/southwestern New Hampshire
BOSTON Greater Boston, including the North Shore
CMA/NEMA Central Massachusetts/ northeastern Massachusetts
WMA Western Massachusetts
SEMA Southeastern Massachusetts/Newport, Rhode Island
RI Rhode Island/bordering MA
CT Northern and eastern Connecticut
SWCT Southwestern Connecticut
NOR Norwalk/Stamford, Connecticut
M, NY, and HQ Maritimes, New York, and Hydro-Québec external Control Areas


![PSNH, Merrimack Station, NH0001465[002 with FGD wastewater] During the period beginning upon commencement of the FGD treatment system to treat FGD wastewater and lasting until expiration,](https://static.documents.pub/doc/80x56/6090bff2192bdd42e622cd57/psnh-merrimack-station-nh0001465-002-with-fgd-wastewater-during-the-period-beginning.jpg)


