69
Psyllid Shield Model Validation, Field Trial Simulations James Keesling, Jo Ann Lee, Ross Ptacek September 18, 2014

Psyllid Shield Model
Validation, Field Trial Simulations
James Keesling, Jo Ann Lee, Ross PtacekSeptember 18, 2014
Colima Validation
Data taken from:
M. M. Robles-González, J. J. Velázquez-Monreal, M. Á. Manzanilla-Ramirez, M. Orozco-Santos, V. M. Medina-Urrutia, J. I. López-Arroyo, and R. Flores-Virgen, Huanglongbing (HLB) disease in Mexican lime trees [Citrus aurantifolia (Christm) Swingle] and its dispersion in Colima State, Mexico, Revista Chapingo SerieHorticultura 19 (2013), 15–31.

Síntomas del Huanglongbing...
28
Los resultados obtenidos en este trabajo señalan que
los daños causados por el HLB en el follaje de los árboles
de limón mexicano, aun con niveles de afectación del 100 %
de su copa, no han afectado la forma de la fruta, y otras ca-
racterísticas como porcentaje de jugo, acidez y °Brix, como
ha sido reportado en otras regiones y para otras especies
de cítricos Bové, 2006; Bassanezi et al., 2009; Bassanezi et
al., 2011; Baldwin et al., 2010. Sin embargo, sí tiene efecto
el tamaño. No obstante, se requiere de más tiempo de in-
FIGURA 4. Distribución de los árboles con síntomas del HLB, observada durante un año después de la primera detección en un huerto de
limón mexicano.
FIGURE 4. Distribution of trees with HLB symptoms observed over a year after the first detection in a Mexican lime orchard.
a) Abril 2010 / April 2010 b) Julio 2010 / July 2010
c) Diciembre 2010 / December 2010 d) Mayo 2011 / May 2010
It is clear that the spread of HLB within this orchard
was caused by the Asian citrus psyllid, as evidenced by the
first aggregate formed from the initial focus of infection and
subsequently by other foci that developed secondarily. Ac-
cording to Bové (2006), in China it took five years for HLB
in an orchard without psyllid control to infect 100 % of the
trees. In the orchard under study, in only a one-year period
more than 50 % of the trees showed HLB symptoms and if
this trend continues, it is estimated that 100 % of the trees
• 2,909 four-year-old Mexican lime trees, grafted on macrofilalemon (C. macrophyllaWester)
• 4 x 8 m spacing
Colima

26 rows of trees 37 rows of trees
25 trees per row
23 trees per row
Colima: Grove Layout

Inoculum Level in Citrus Trees
The Inoculum Level is represented by the total number of infected flush shoots in a tree starting from the beginning of the simulation.
= between 1 and 10infected flush shoots
= between 11 and 100 infected flush shoots
= between 201 and 400infected flush shoots
= between 401 and 600infected flush shoots
= between 101 and 200infected flush shoots
Healthy Low Med High
= 0 infected flush shoots
= greater than 600infected flush shoots
Síntomas del Huanglongbing...
28
Los resultados obtenidos en este trabajo señalan que
los daños causados por el HLB en el follaje de los árboles
de limón mexicano, aun con niveles de afectación del 100 %
de su copa, no han afectado la forma de la fruta, y otras ca-
racterísticas como porcentaje de jugo, acidez y °Brix, como
ha sido reportado en otras regiones y para otras especies
de cítricos Bové, 2006; Bassanezi et al., 2009; Bassanezi et
al., 2011; Baldwin et al., 2010. Sin embargo, sí tiene efecto
el tamaño. No obstante, se requiere de más tiempo de in-
FIGURA 4. Distribución de los árboles con síntomas del HLB, observada durante un año después de la primera detección en un huerto de
limón mexicano.
FIGURE 4. Distribution of trees with HLB symptoms observed over a year after the first detection in a Mexican lime orchard.
a) Abril 2010 / April 2010 b) Julio 2010 / July 2010
c) Diciembre 2010 / December 2010 d) Mayo 2011 / May 2010
It is clear that the spread of HLB within this orchard
was caused by the Asian citrus psyllid, as evidenced by the
first aggregate formed from the initial focus of infection and
subsequently by other foci that developed secondarily. Ac-
cording to Bové (2006), in China it took five years for HLB
in an orchard without psyllid control to infect 100 % of the
trees. In the orchard under study, in only a one-year period
more than 50 % of the trees showed HLB symptoms and if
this trend continues, it is estimated that 100 % of the trees
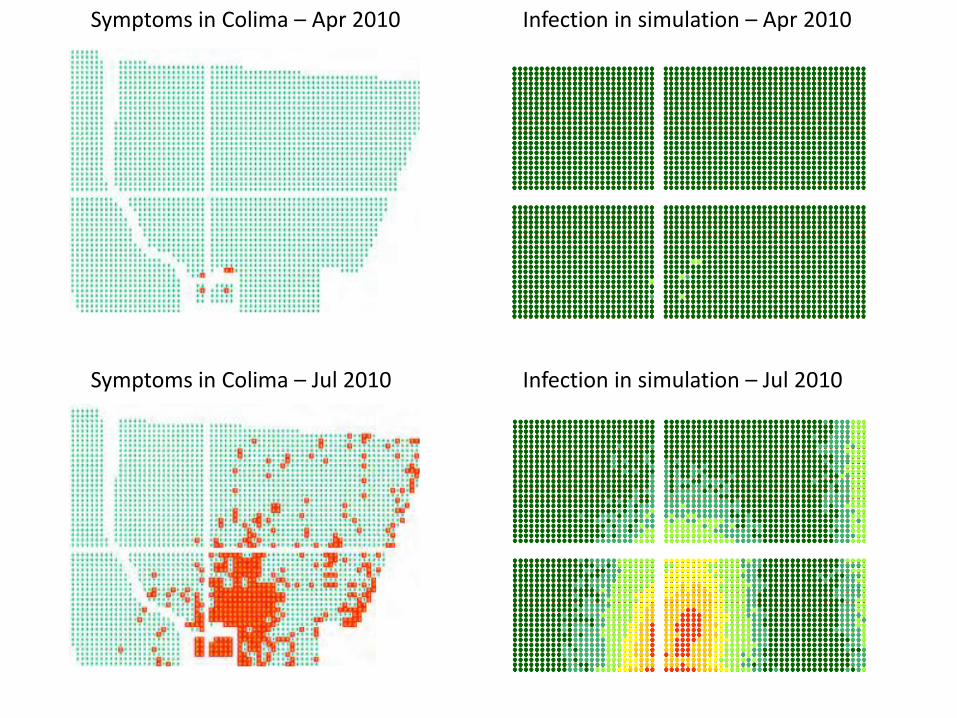
Symptoms in Colima – Apr 2010
Symptoms in Colima – Jul 2010
Infection in simulation – Apr 2010
Infection in simulation – Jul 2010

Síntomas del Huanglongbing...
28
Los resultados obtenidos en este trabajo señalan que
los daños causados por el HLB en el follaje de los árboles
de limón mexicano, aun con niveles de afectación del 100 %
de su copa, no han afectado la forma de la fruta, y otras ca-
racterísticas como porcentaje de jugo, acidez y °Brix, como
ha sido reportado en otras regiones y para otras especies
de cítricos Bové, 2006; Bassanezi et al., 2009; Bassanezi et
al., 2011; Baldwin et al., 2010. Sin embargo, sí tiene efecto
el tamaño. No obstante, se requiere de más tiempo de in-
FIGURA 4. Distribución de los árboles con síntomas del HLB, observada durante un año después de la primera detección en un huerto de
limón mexicano.
FIGURE 4. Distribution of trees with HLB symptoms observed over a year after the first detection in a Mexican lime orchard.
a) Abril 2010 / April 2010 b) Julio 2010 / July 2010
c) Diciembre 2010 / December 2010 d) Mayo 2011 / May 2010
It is clear that the spread of HLB within this orchard
was caused by the Asian citrus psyllid, as evidenced by the
first aggregate formed from the initial focus of infection and
subsequently by other foci that developed secondarily. Ac-
cording to Bové (2006), in China it took five years for HLB
in an orchard without psyllid control to infect 100 % of the
trees. In the orchard under study, in only a one-year period
more than 50 % of the trees showed HLB symptoms and if
this trend continues, it is estimated that 100 % of the trees
Symptoms in Colima – Dec 2010
Symptoms in Colima – May 2011
Infection in simulation – Dec 2010
Infection in simulation – May 2011
Field Trials
RNAi constructs, field trial size

Field Trial: Grove Layout
• A high tree density planting of 290 trees/acre is assumed– Tree spacing is 10 ft within rows and 15 ft between
rows
28 rows of trees
10 acre
103 treesper row
56 rows of trees
20 acre
103 treesper row

Field Trial: RNAi constructs
• There are many constructs to test. We present results of varying survival of nymphs and adults.
• RNAi constructs– None = no effects of RNAi assumed
– Weak = 60% of nymphs survive to adulthood and 2/3 of adults survive over a 15 day period
– Strong = 20% of nymphs survive to adulthood and 1/3 of adults survive over a 15 day period

Inoculum Level in Citrus Trees
The Inoculum Level is represented by the total number of infected flush shoots in a tree starting from the beginning of the simulation.
= between 1 and 10infected flush shoots
= between 11 and 100 infected flush shoots
= between 201 and 400infected flush shoots
= between 401 and 600infected flush shoots
= between 101 and 200infected flush shoots
Healthy Low Med High
= 0 infected flush shoots
= greater than 600infected flush shoots

Year 1: 10 acre groveNo RNAi, Low pressure
Healthy
Low
Med
High
15
2189
676
3
1
0
Number of Trees:
0
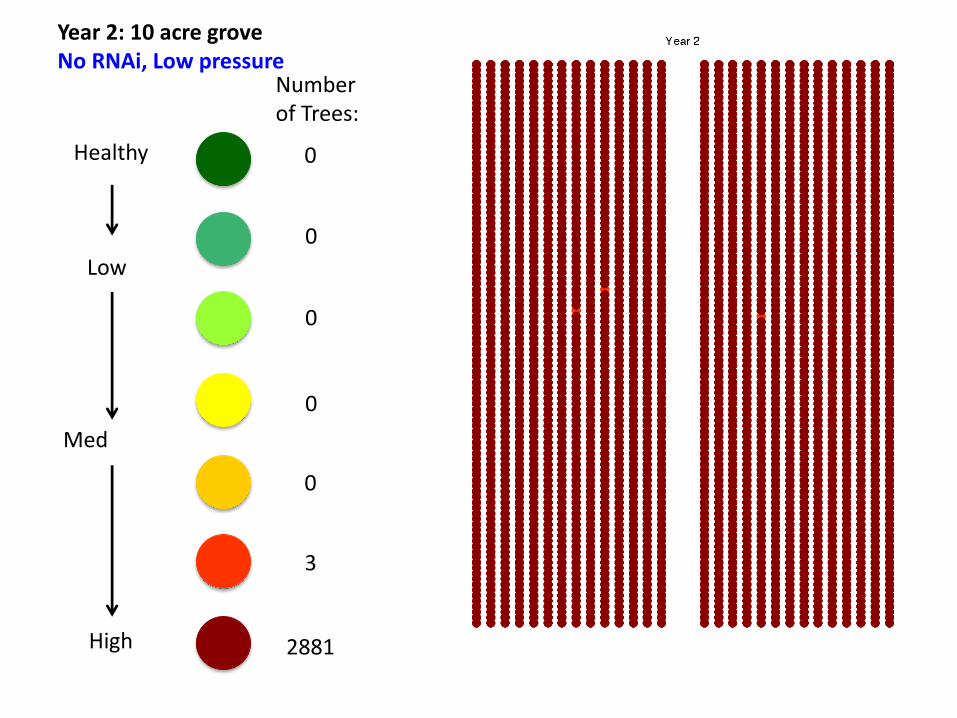
Year 2: 10 acre groveNo RNAi, Low pressure
Healthy
Low
Med
High
0
0
0
0
0
3
Number of Trees:
2881

Weak RNAi = 60% of nymphs survive to adulthood and 2/3 of adults survive over a 15 day period

Year 1: 10 acre groveWeak RNAi, Low pressure
Healthy
Low
Med
High
707
2050
127
0
0
0
Number of Trees:
0
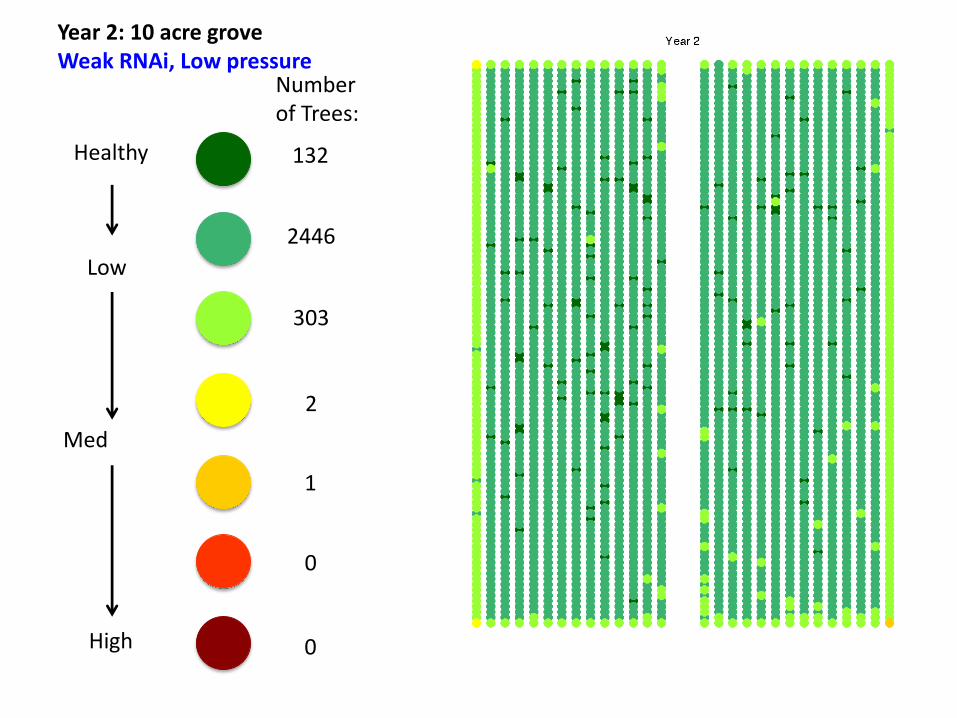
Year 2: 10 acre groveWeak RNAi, Low pressure
Healthy
Low
Med
High
132
2446
303
2
1
0
Number of Trees:
0

Year 3: 10 acre groveWeak RNAi, Low pressure
Healthy
Low
Med
High
39
2309
531
3
2
0
Number of Trees:
0

Year 4: 10 acre groveWeak RNAi, Low pressure
Healthy
Low
Med
High
7
1973
895
5
4
0
Number of Trees:
0

Year 5: 10 acre groveWeak RNAi, Low pressure
Healthy
Low
Med
High
1
1516
1335
27
4
1
Number of Trees:
0

Year 6: 10 acre groveWeak RNAi, Low pressure
Healthy
Low
Med
High
0
1090
1736
52
3
3
Number of Trees:
0
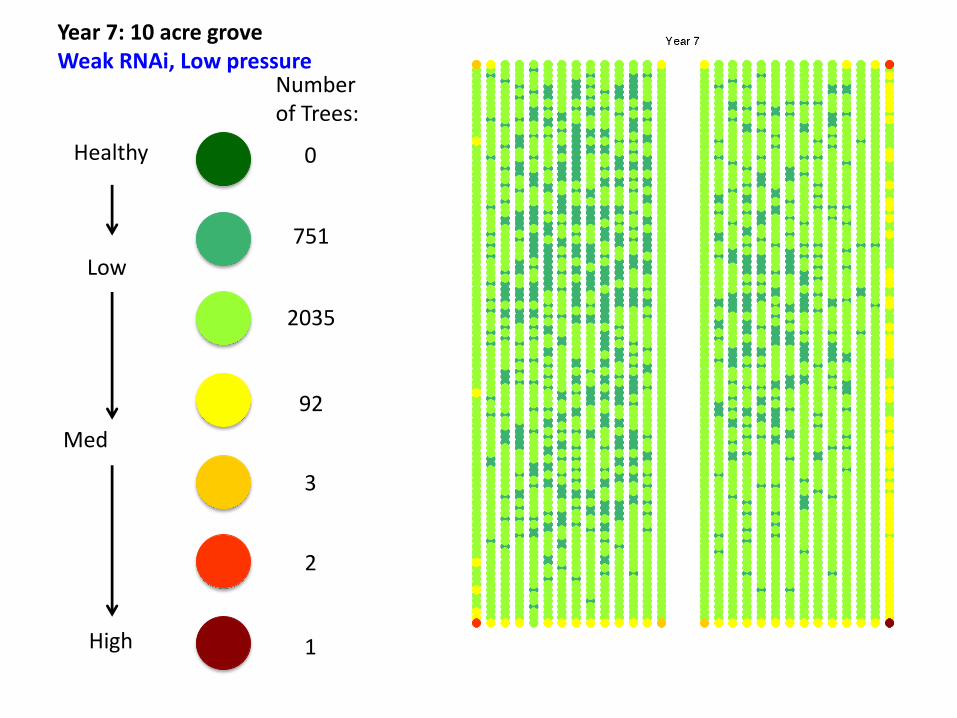
Year 7: 10 acre groveWeak RNAi, Low pressure
Healthy
Low
Med
High
0
751
2035
92
3
2
Number of Trees:
1
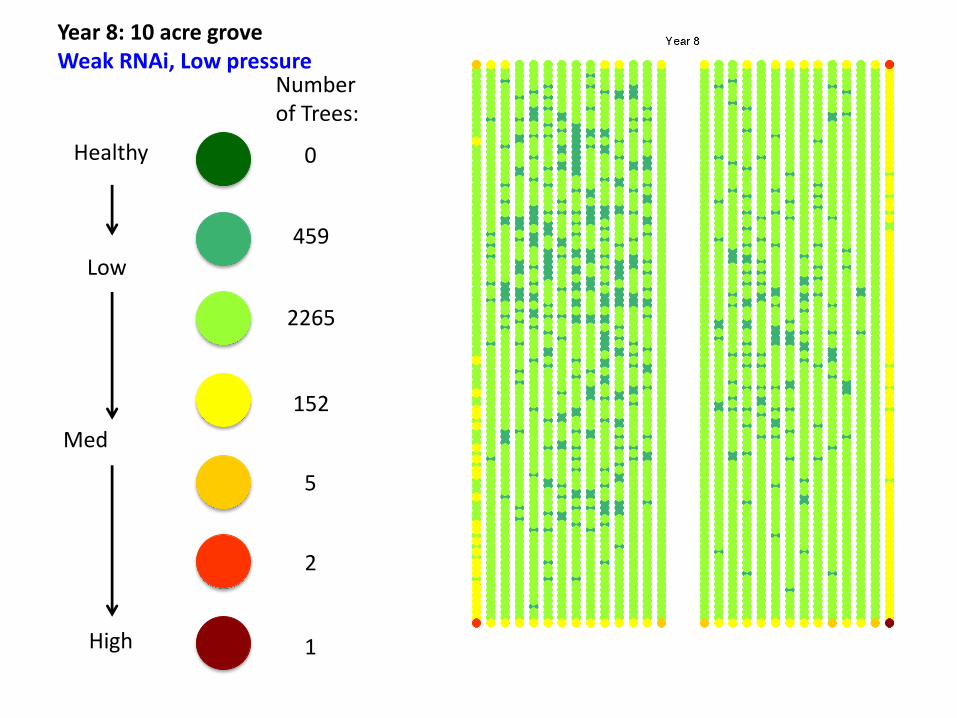
Year 8: 10 acre groveWeak RNAi, Low pressure
Healthy
Low
Med
High
0
459
2265
152
5
2
Number of Trees:
1

Year 9: 10 acre groveWeak RNAi, Low pressure
Healthy
Low
Med
High
0
294
2405
174
7
2
Number of Trees:
2
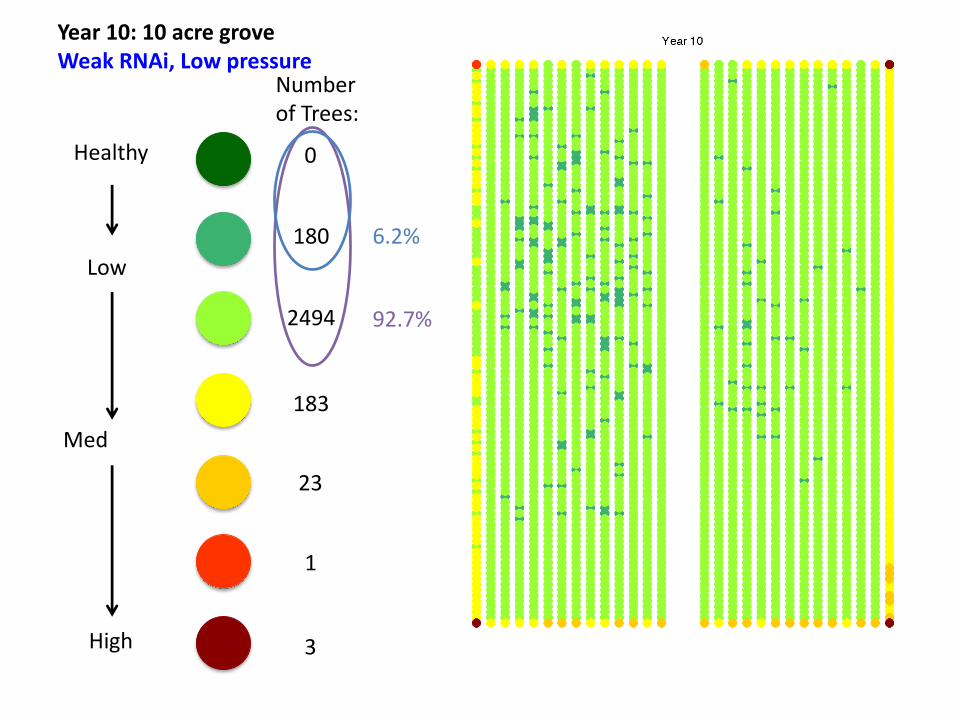
Year 10: 10 acre groveWeak RNAi, Low pressure
Healthy
Low
Med
High
0
180
2494
183
23
1
Number of Trees:
3
92.7%
6.2%

Strong RNAi = 20% of nymphs survive to adulthood and 1/3 of adults survive over a 15 day period
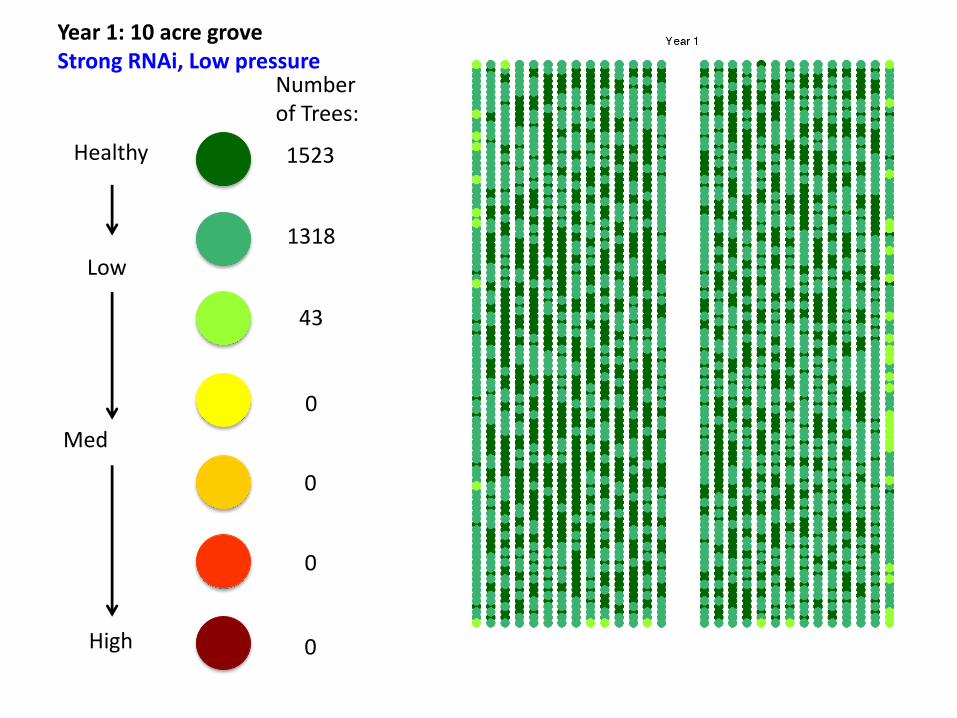
Year 1: 10 acre groveStrong RNAi, Low pressure
Healthy
Low
Med
High
1523
1318
43
0
0
0
Number of Trees:
0
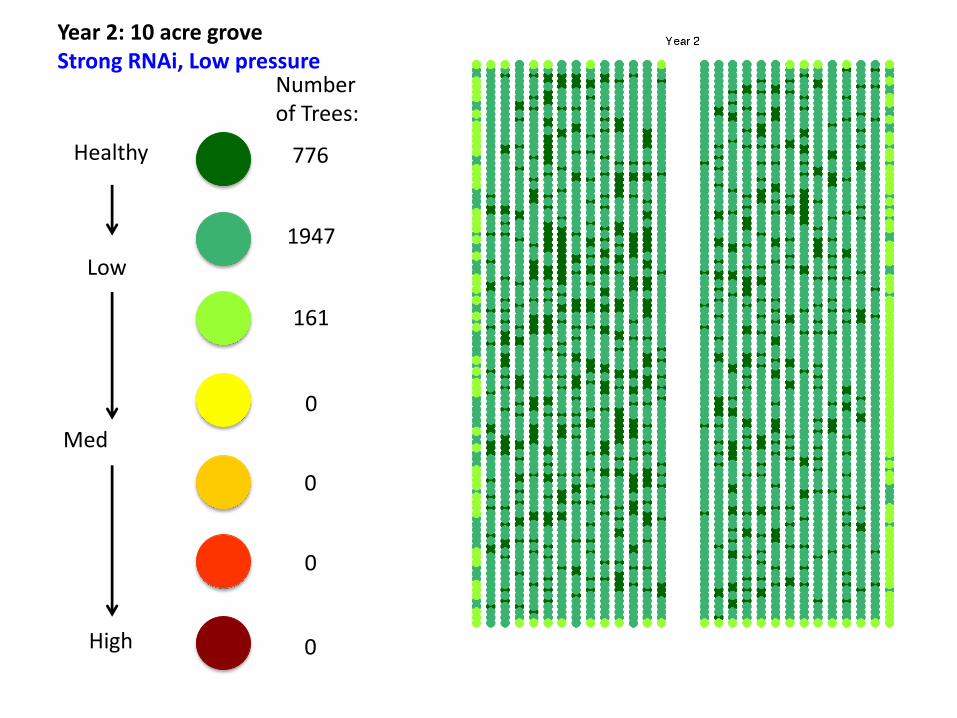
Year 2: 10 acre groveStrong RNAi, Low pressure
Healthy
Low
Med
High
776
1947
161
0
0
0
Number of Trees:
0

Year 3: 10 acre groveStrong RNAi, Low pressure
Healthy
Low
Med
High
450
2203
229
2
0
0
Number of Trees:
0
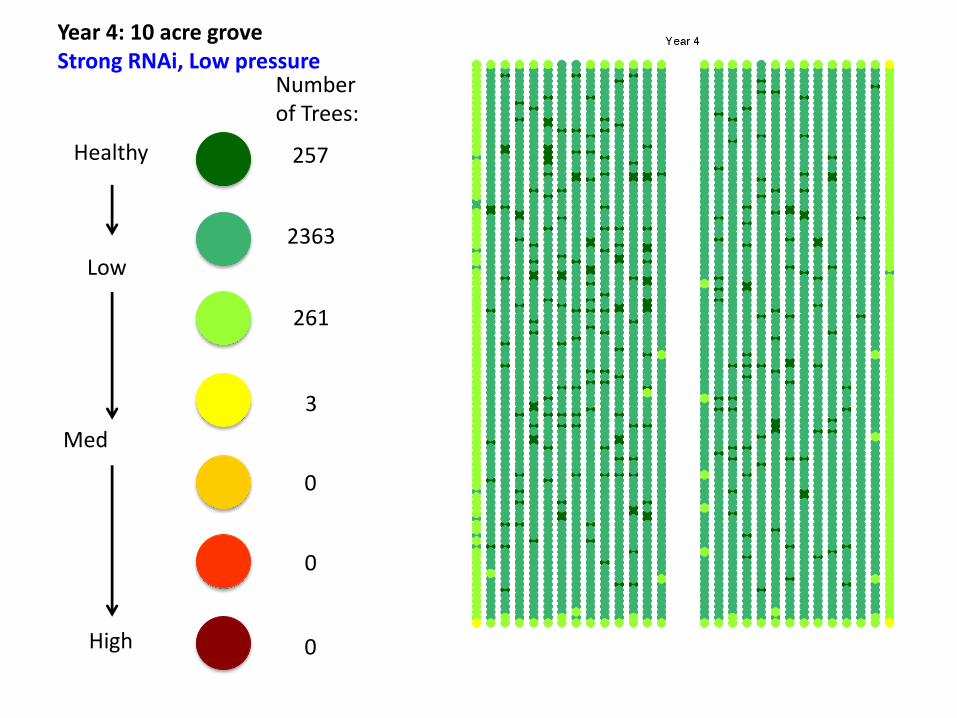
Year 4: 10 acre groveStrong RNAi, Low pressure
Healthy
Low
Med
High
257
2363
261
3
0
0
Number of Trees:
0
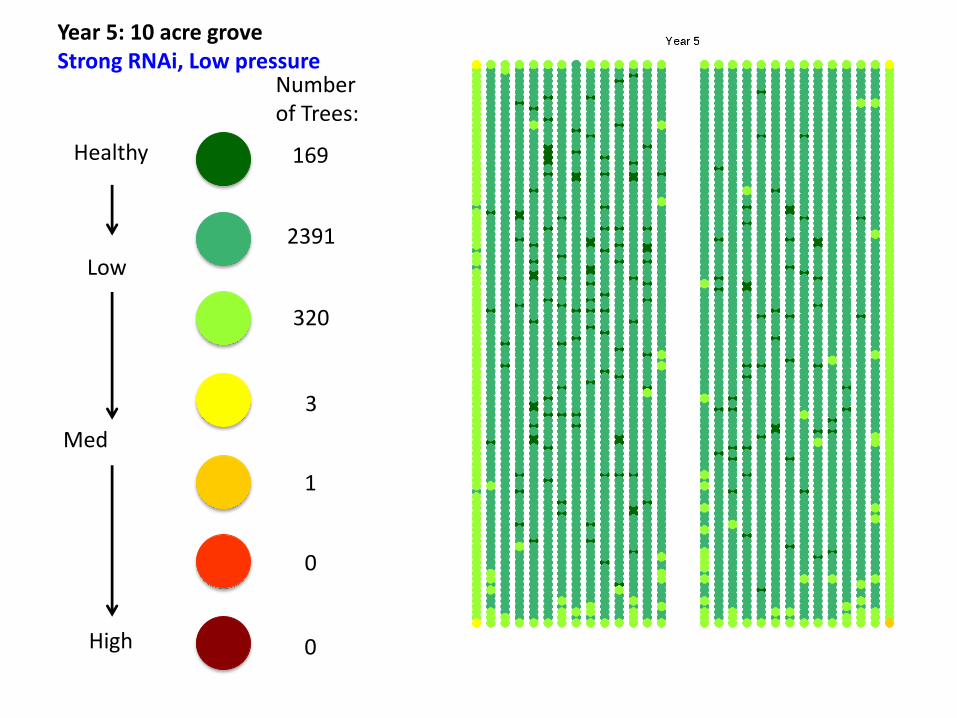
Year 5: 10 acre groveStrong RNAi, Low pressure
Healthy
Low
Med
High
169
2391
320
3
1
0
Number of Trees:
0

Year 6: 10 acre groveStrong RNAi, Low pressure
Healthy
Low
Med
High
113
2380
387
1
3
0
Number of Trees:
0

Year 7: 10 acre groveStrong RNAi, Low pressure
Healthy
Low
Med
High
75
2341
463
2
3
0
Number of Trees:
0
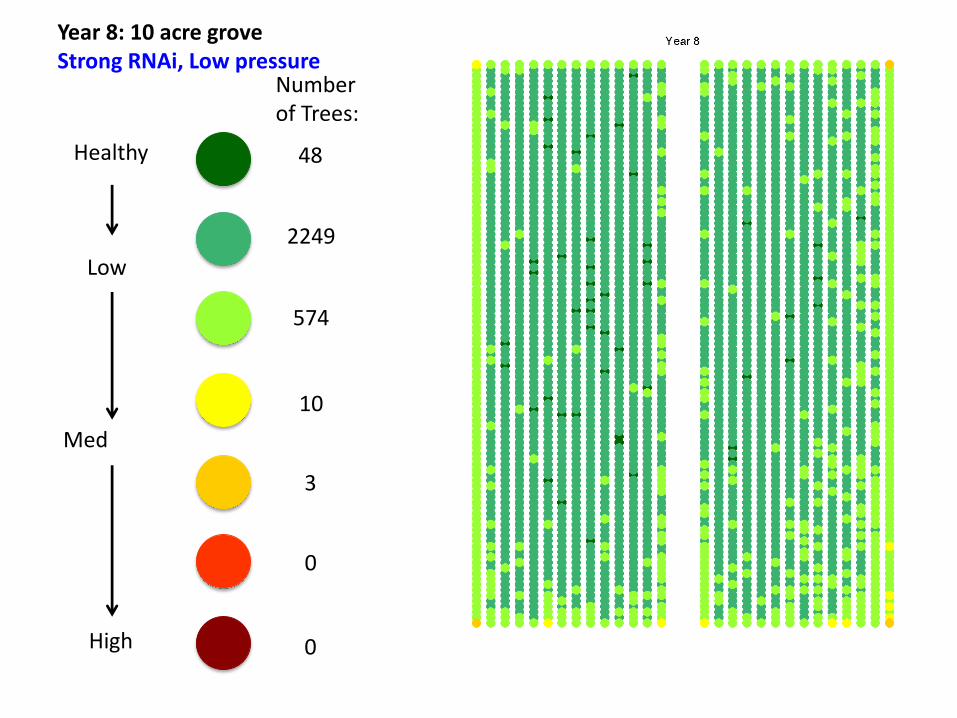
Year 8: 10 acre groveStrong RNAi, Low pressure
Healthy
Low
Med
High
48
2249
574
10
3
0
Number of Trees:
0

Year 9: 10 acre groveStrong RNAi, Low pressure
Healthy
Low
Med
High
32
2132
697
20
2
1
Number of Trees:
0
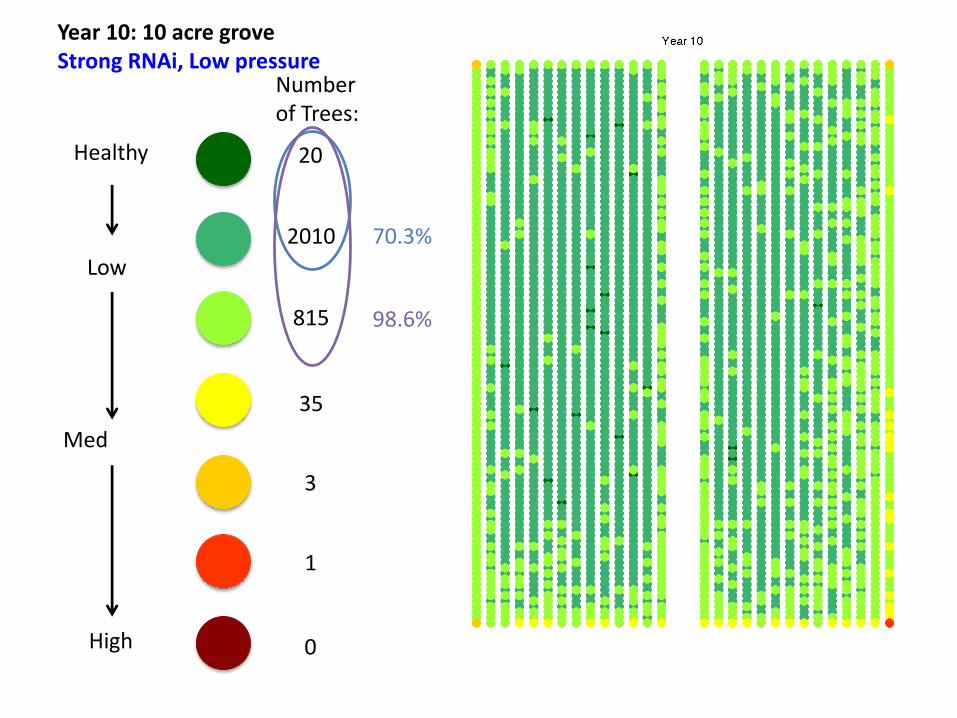
Year 10: 10 acre groveStrong RNAi, Low pressure
Healthy
Low
Med
High
20
2010
815
35
3
1
Number of Trees:
0
70.3%
98.6%
NEXT
• even if RNAi constructs are weak, we can increase grove size to 20 acres and see how well it protects the grove.
• Later we can also increase pressure (number of psyllids that invade the grove)
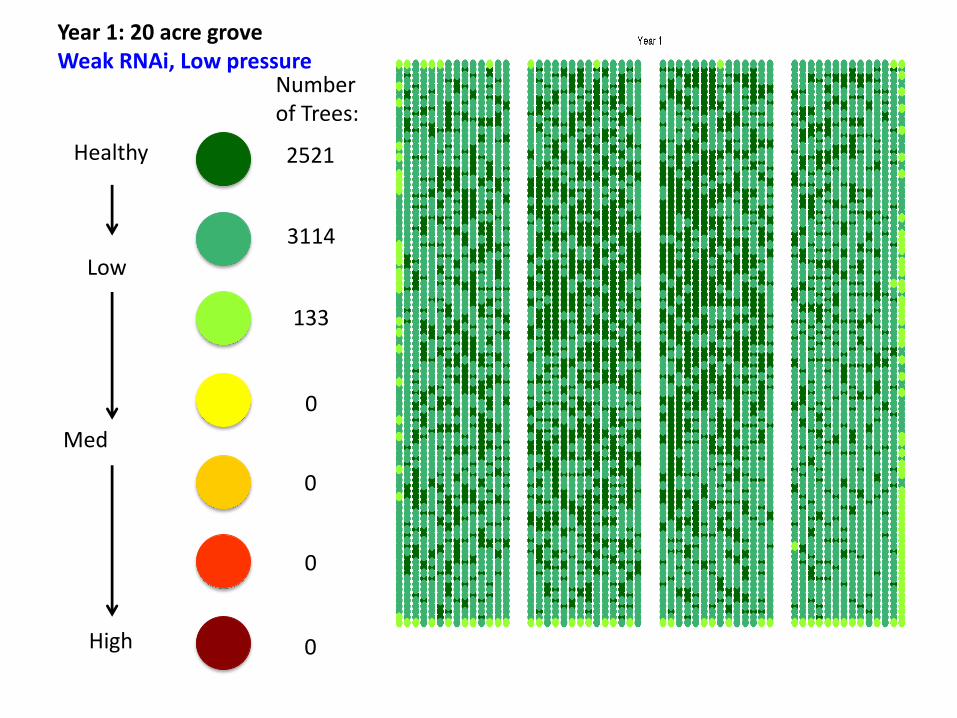
Year 1: 20 acre groveWeak RNAi, Low pressure
Healthy
Low
Med
High
2521
3114
133
0
0
0
Number of Trees:
0

Year 2: 20 acre groveWeak RNAi, Low pressure
Healthy
Low
Med
High
1036
4411
320
1
0
0
Number of Trees:
0

Year 3: 20 acre groveWeak RNAi, Low pressure
Healthy
Low
Med
High
518
4744
502
3
1
0
Number of Trees:
0
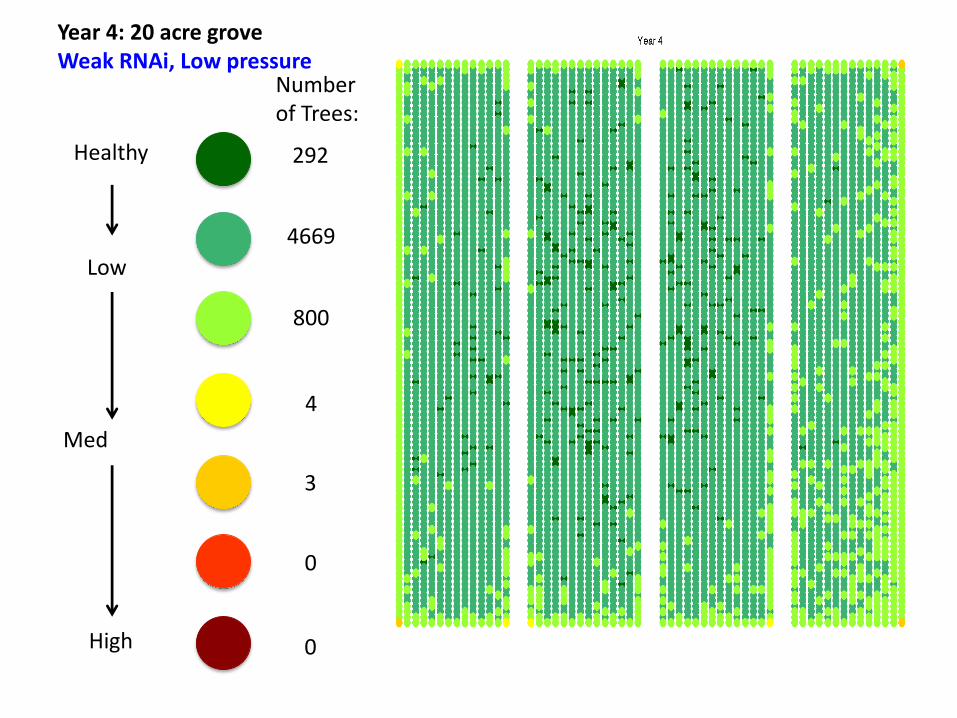
Year 4: 20 acre groveWeak RNAi, Low pressure
Healthy
Low
Med
High
292
4669
800
4
3
0
Number of Trees:
0
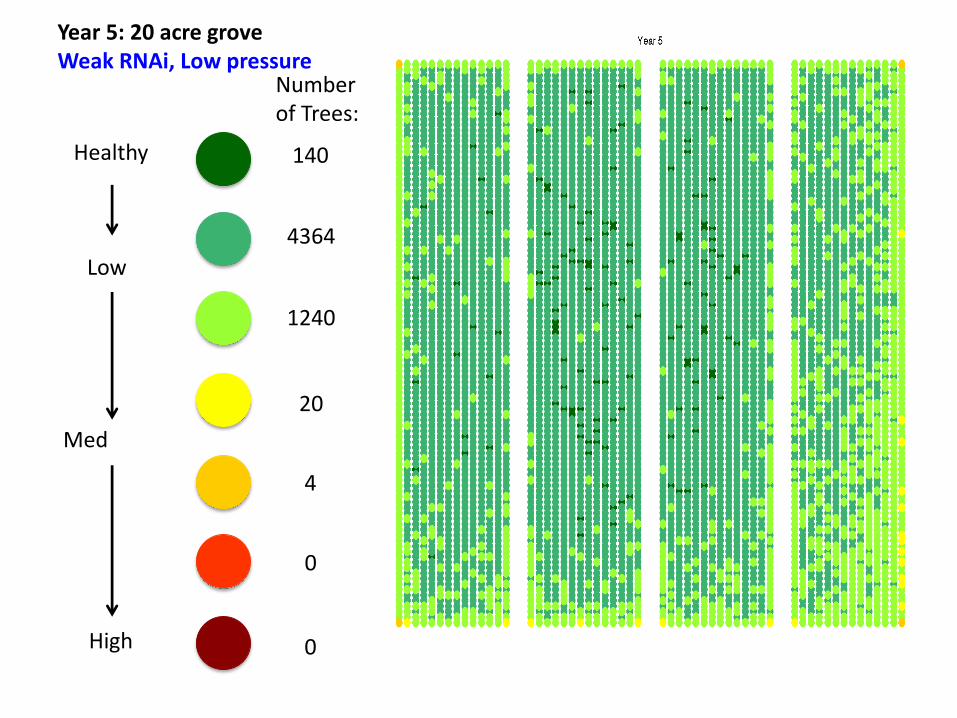
Year 5: 20 acre groveWeak RNAi, Low pressure
Healthy
Low
Med
High
140
4364
1240
20
4
0
Number of Trees:
0

Year 6: 20 acre groveWeak RNAi, Low pressure
Healthy
Low
Med
High
73
3956
1690
45
3
1
Number of Trees:
0

Year 7: 20 acre groveWeak RNAi, Low pressure
Healthy
Low
Med
High
51
3622
2001
90
3
1
Number of Trees:
0

Year 8: 20 acre groveWeak RNAi, Low pressure
Healthy
Low
Med
High
37
3218
2366
139
5
2
Number of Trees:
1

Year 9: 20 acre groveWeak RNAi, Low pressure
Healthy
Low
Med
High
26
2806
2765
161
7
2
Number of Trees:
1
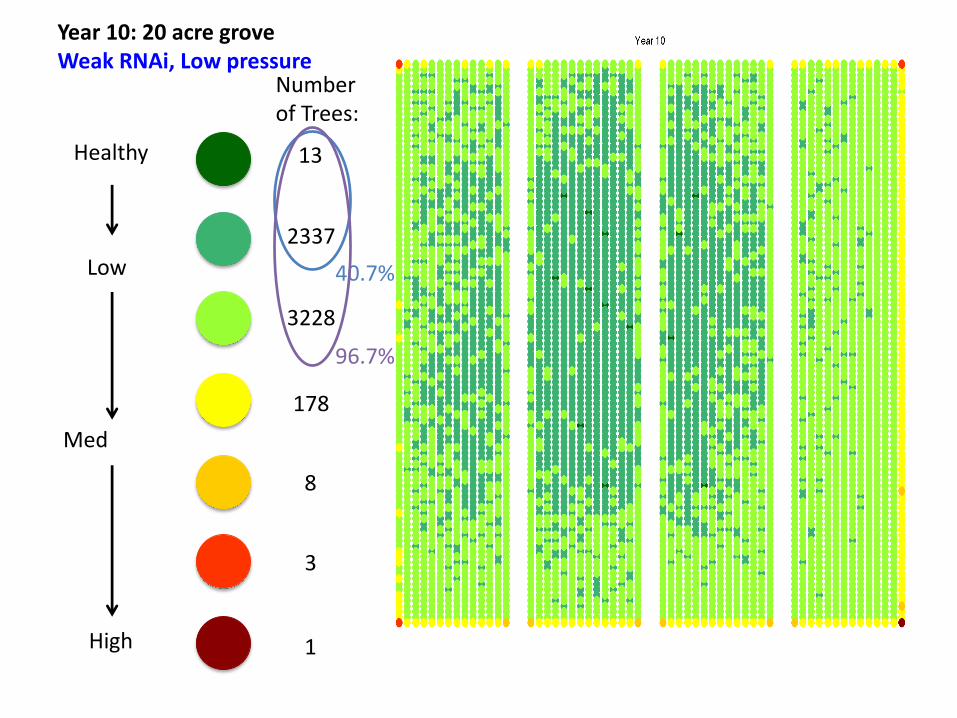
Year 10: 20 acre groveWeak RNAi, Low pressure
Healthy
Low
Med
High
13
2337
3228
178
8
3
Number of Trees:
1
40.7%
96.7%

THE END
EXTRA SLIDES (NOT FOR PRESENTATION)

0 1-10 11-100 101-200 201-400 401-600 > 600
Acres RNAilevel
Pressure
10 Weak Low 0 180 2494 183 23 1 3
10 Strong Low 20 2010 815 35 3 1 0
20 Weak Low 13 2337 3228 178 8 3 1
20 Weak High 0 335 5106 118 190 13 6
20 Strong High 119 3220 2208 172 46 1 2
Year 10 Summary# of trees in each category

0 1-10 11-100 101-200 201-400 401-600 > 600
Acres RNAilevel
Pressure
10 Weak Low 0 6.24 86.48 6.35 0.79 0.03 0.10
10 Strong Low 0.69 69.69 28.26 1.21 0.10 0.03 0
20 Weak Low 0.23 40.52 55.96 3.09 0.14 0.05 0.02
20 Weak High 0 5.81 88.52 2.05 3.29 0.22 0.10
20 Strong High 2.06 55.83 38.28 2.98 0.80 0.02 0.03
Year 10 Summary% of trees in each category

HIGH INVASION PRESSURE
20 acre grove, compare weak vs strong RNAi under higher invasion pressure
Results here are that we would need better RNAi constructs

Year 1: 20 acre groveWeak RNAi, High pressure
Healthy
Low
Med
High
1186
4298
283
1
0
0
Number of Trees:
0
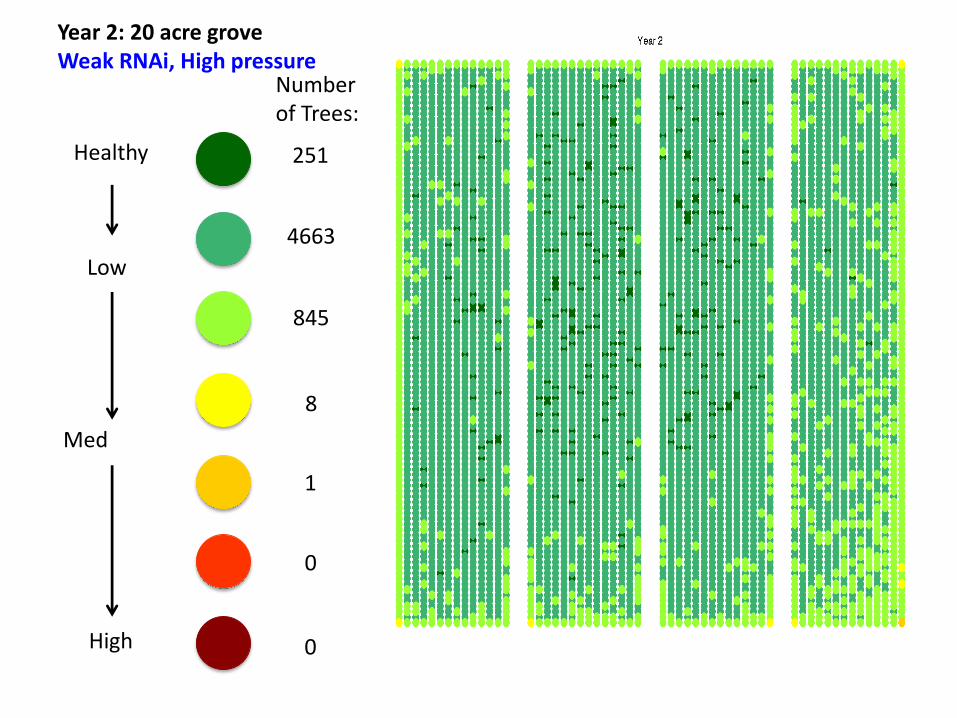
Year 2: 20 acre groveWeak RNAi, High pressure
Healthy
Low
Med
High
251
4663
845
8
1
0
Number of Trees:
0
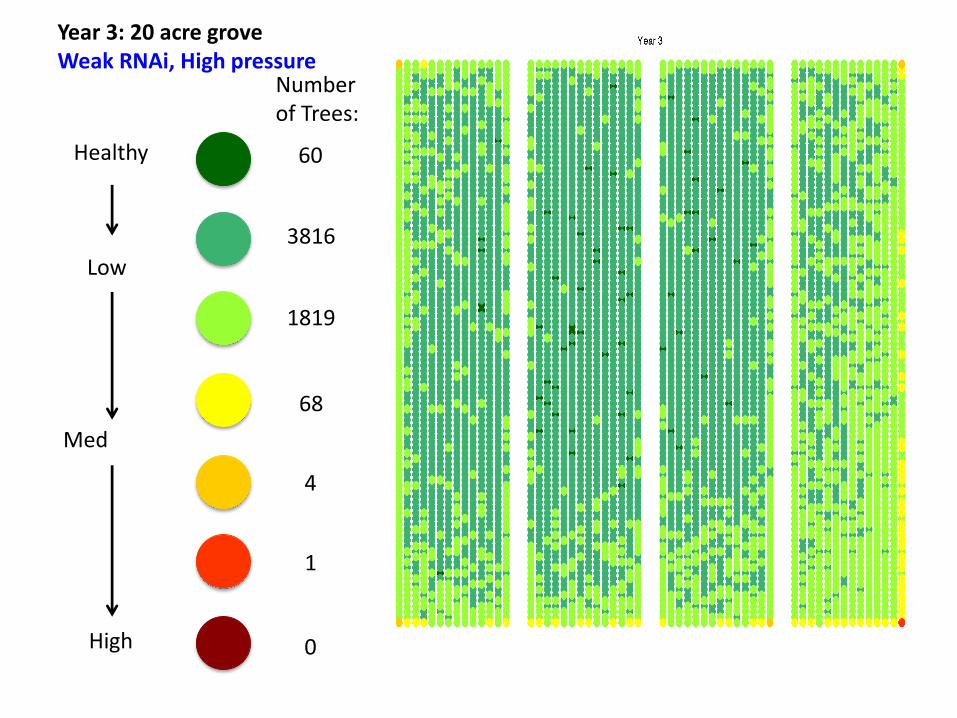
Year 3: 20 acre groveWeak RNAi, High pressure
Healthy
Low
Med
High
60
3816
1819
68
4
1
Number of Trees:
0

Year 4: 20 acre groveWeak RNAi, High pressure
Healthy
Low
Med
High
22
2942
2651
140
9
3
Number of Trees:
1
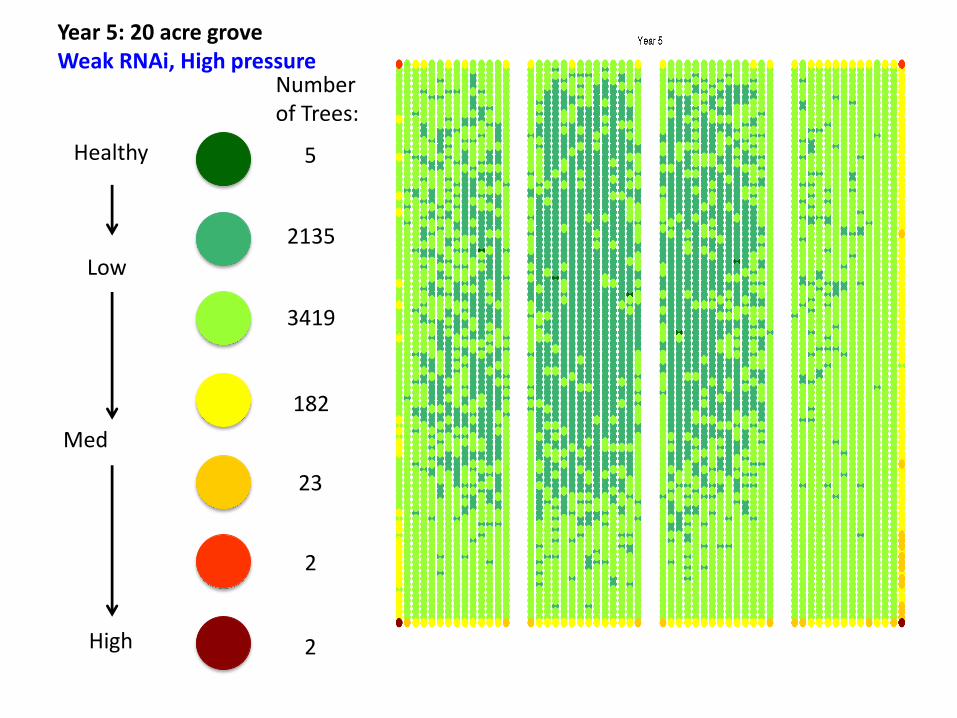
Year 5: 20 acre groveWeak RNAi, High pressure
Healthy
Low
Med
High
5
2135
3419
182
23
2
Number of Trees:
2

Year 6: 20 acre groveWeak RNAi, High pressure
Healthy
Low
Med
High
0
1548
3949
194
73
1
Number of Trees:
3
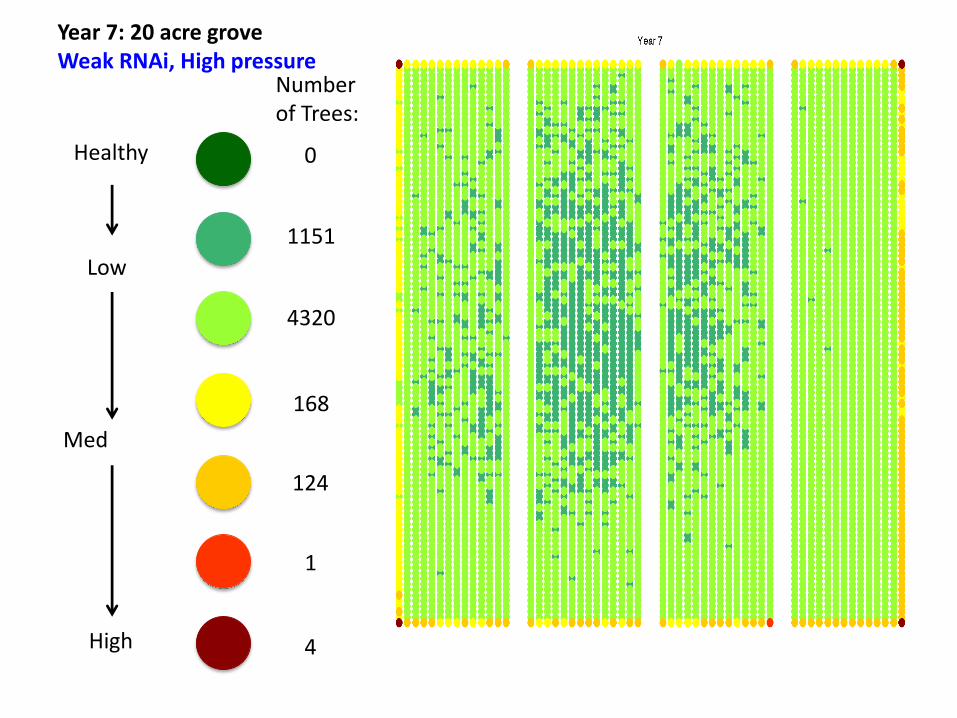
Year 7: 20 acre groveWeak RNAi, High pressure
Healthy
Low
Med
High
0
1151
4320
168
124
1
Number of Trees:
4

Year 8: 20 acre groveWeak RNAi, High pressure
Healthy
Low
Med
High
0
803
4651
150
154
6
Number of Trees:
4
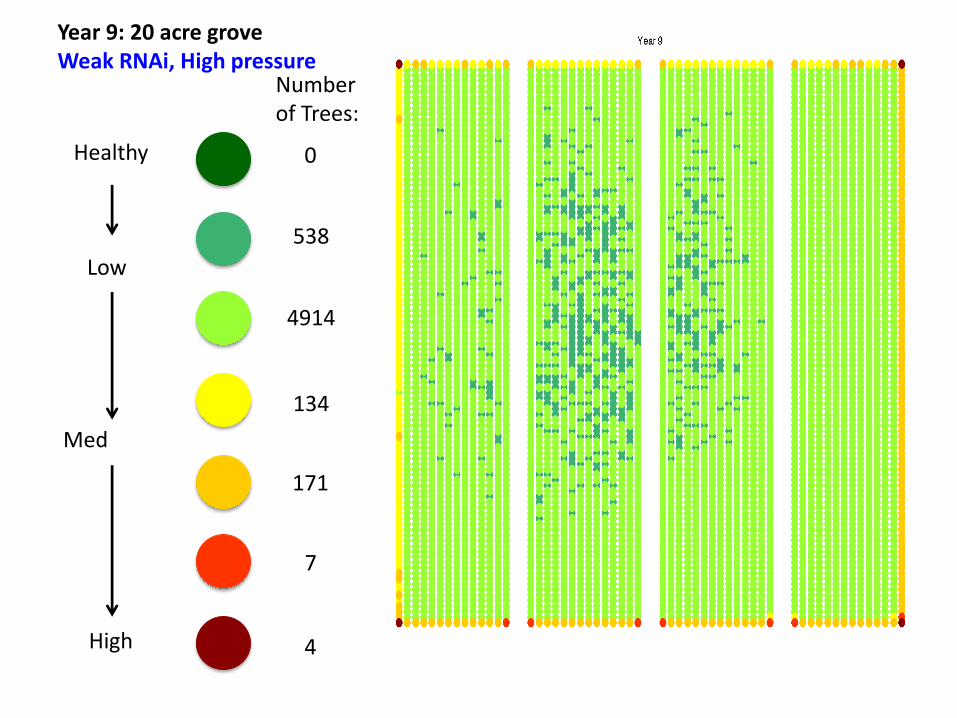
Year 9: 20 acre groveWeak RNAi, High pressure
Healthy
Low
Med
High
0
538
4914
134
171
7
Number of Trees:
4
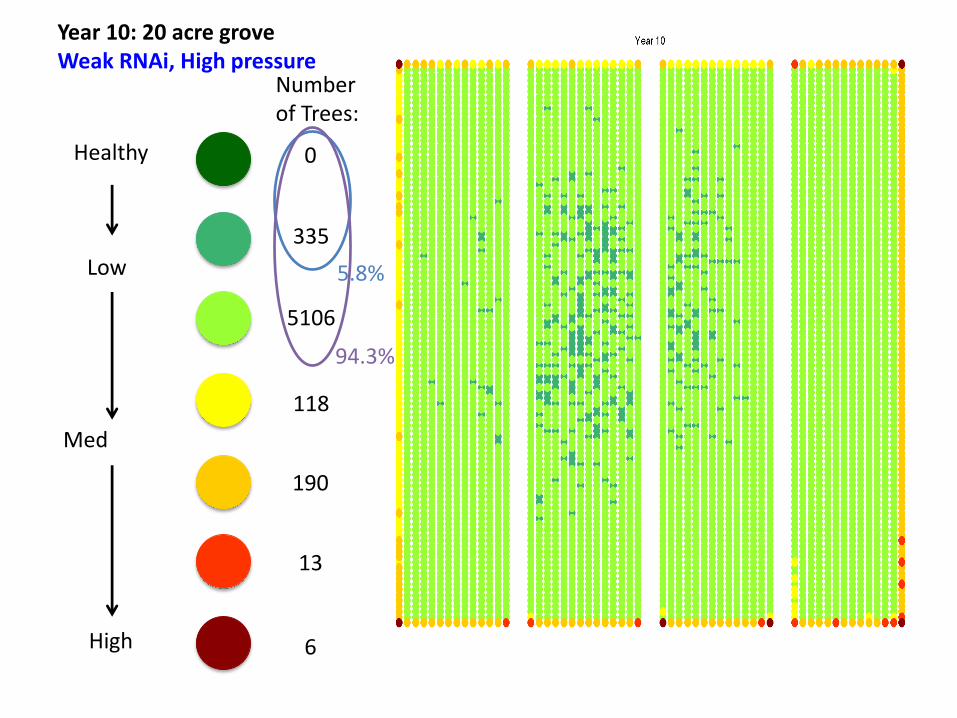
Year 10: 20 acre groveWeak RNAi, High pressure
Healthy
Low
Med
High
0
335
5106
118
190
13
Number of Trees:
6
5.8%
94.3%
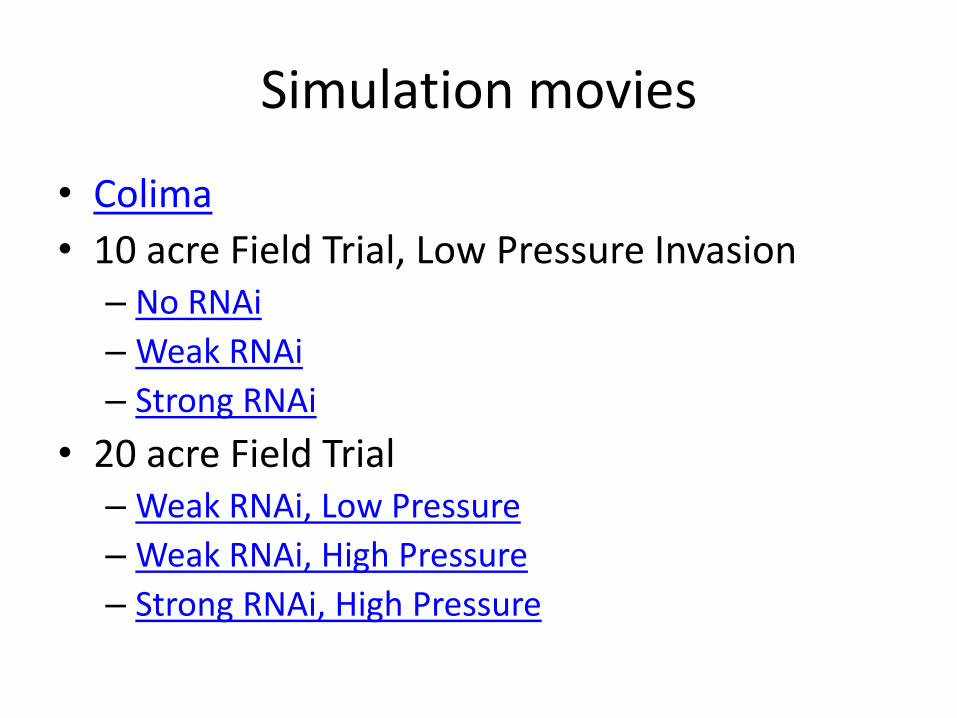
Simulation movies
• Colima
• 10 acre Field Trial, Low Pressure Invasion– No RNAi
– Weak RNAi
– Strong RNAi
• 20 acre Field Trial– Weak RNAi, Low Pressure
– Weak RNAi, High Pressure
– Strong RNAi, High Pressure

Movie: Colima
back to Movie List
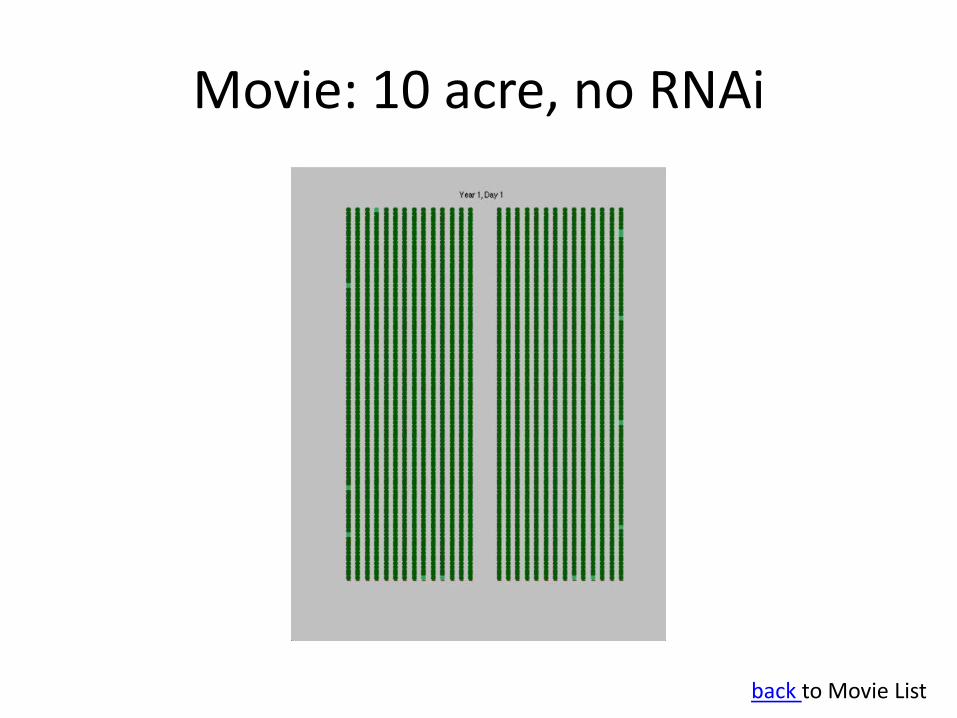
Movie: 10 acre, no RNAi
back to Movie List

Movie: 10 acre, weak RNAi
back to Movie List
Movie: 10 acre, strong RNAi
back to Movie List
Movie: 20 acre, weak RNAi, Low
back to Movie List
Movie: 20 acre, weak RNAi, High
back to Movie List

Movie: 20 acre, strong RNAi, High
back to Movie List


