P.T. FAJAR SURYA WISESA Tbk AND ITS SUBSIDIARY FINANCIAL STATEMENTS AND SUPPLEMENTARY INFORMATION AS OF MARCH 31, 2013 (UNAUDITED) AND DECEMBER 31, 2012 AND FOR THE THREE-MONTH PERIODS ENDED MARCH 31, 2013 AND 2012 (UNAUDITED) AND INDEPENDENT ACCOUNTANTS’ REPORT
Transcript
P.T. FAJAR SURYA WISESA Tbk AND ITS SUBSIDIARY FINANCIAL STATEMENTS AND SUPPLEMENTARY INFORMATION AS OF MARCH 31, 2013 (UNAUDITED) AND DECEMBER 31, 2012 AND FOR THE THREE-MONTH PERIODS ENDED MARCH 31, 2013 AND 2012 (UNAUDITED) AND INDEPENDENT ACCOUNTANTS’ REPORT
P.T. FAJAR SURYA WISESA Tbk AND ITS SUBSIDIARY TABLE OF CONTENTS
Page
DIRECTORS’ STATEMENT LETTER FINANCIAL STATEMENTS – As of March 31, 2013 (Unaudited) and December 31, 2012
and for three-month periods ended March 31, 2013 and 2012 *) (Unaudited)
Statements of Financial Position 2 Statements of Comprehensive Income 4 Statements of Changes in Equity 5 Statements of Cash Flows 6 Notes to Financial Statements 7
SUPPLEMENTARY INFORMATION
Schedule I : Statements of Financial Position Only Parent Company’s 47 Schedule II : Statements of Comprehensive Income Only Parent Company’s 49 Schedule III : Statements of Changes in Equity Only Parent Company’s 50 Schedule IV: Statements of Cash Flows Only Parent Company’s 51
*) For the three-month periods ended March 31, 2012 are the consolidated financial statements.
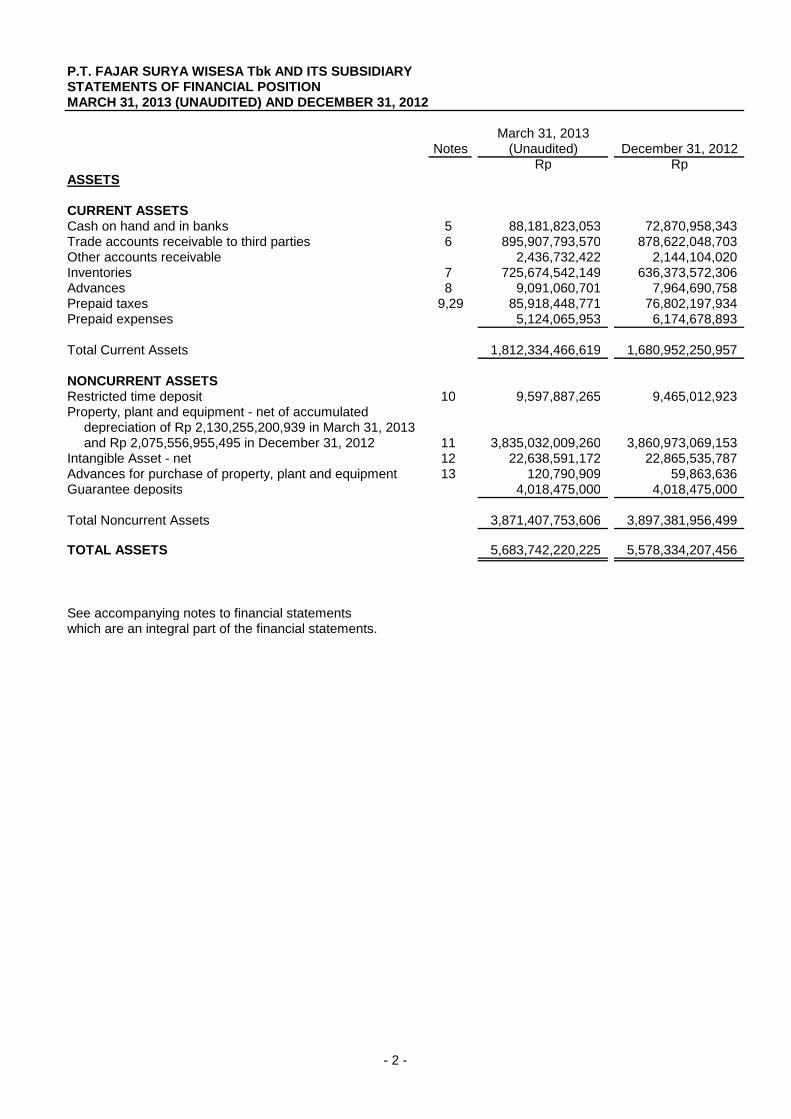
P.T. FAJAR SURYA WISESA Tbk AND ITS SUBSIDIARYSTATEMENTS OF FINANCIAL POSITIONMARCH 31, 2013 (UNAUDITED) AND DECEMBER 31, 2012
March 31, 2013Notes (Unaudited) December 31, 2012
Rp RpASSETS
CURRENT ASSETSCash on hand and in banks 5 88,181,823,053 72,870,958,343Trade accounts receivable to third parties 6 895,907,793,570 878,622,048,703Other accounts receivable 2,436,732,422 2,144,104,020Inventories 7 725,674,542,149 636,373,572,306Advances 8 9,091,060,701 7,964,690,758Prepaid taxes 9,29 85,918,448,771 76,802,197,934Prepaid expenses 5,124,065,953 6,174,678,893
Total Current Assets 1,812,334,466,619 1,680,952,250,957
NONCURRENT ASSETSRestricted time deposit 10 9,597,887,265 9,465,012,923Property, plant and equipment - net of accumulated
depreciation of Rp 2,130,255,200,939 in March 31, 2013 and Rp 2,075,556,955,495 in December 31, 2012 11 3,835,032,009,260 3,860,973,069,153
Intangible Asset - net 12 22,638,591,172 22,865,535,787Advances for purchase of property, plant and equipment 13 120,790,909 59,863,636Guarantee deposits 4,018,475,000 4,018,475,000
Total Noncurrent Assets 3,871,407,753,606 3,897,381,956,499
TOTAL ASSETS 5,683,742,220,225 5,578,334,207,456
See accompanying notes to financial statementswhich are an integral part of the financial statements.
- 2 -
P.T. FAJAR SURYA WISESA Tbk AND ITS SUBSIDIARYSTATEMENTS OF FINANCIAL POSITIONMARCH 31, 2013 (UNAUDITED) AND DECEMBER 31, 2012 (Continued)
March 31, 2013Notes (Unaudited) December 31, 2012
Rp Rp
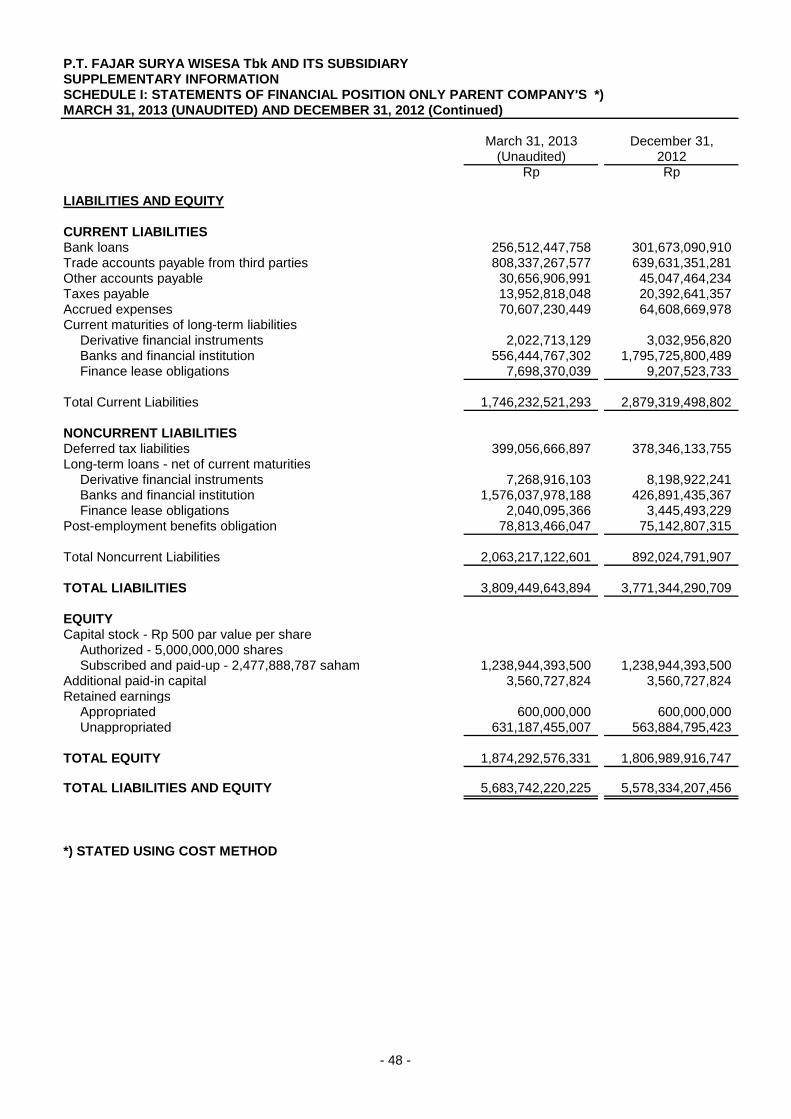
LIABILITIES AND EQUITY
CURRENT LIABILITIESBank loans 14 256,512,447,758 301,673,090,910Trade accounts payable to third parties 15 808,337,267,577 639,631,351,281Other accounts payable 16 30,656,906,991 45,047,464,234Taxes payable 17,29 13,952,818,048 20,392,641,357Accrued expenses 18 70,607,230,449 64,608,669,978Current maturities of long-term liabilities
TOTAL LIABILITIES AND EQUITY 5,683,742,220,225 5,578,334,207,456
See accompanying notes to financial statementswhich are an integral part of the financial statements.
- 3 -
P.T. FAJAR SURYA WISESA Tbk AND ITS SUBSIDIARYSTATEMENTS OF COMPREHENSIVE INCOMEFOR THE THREE-MONTH PERIODS ENDED MARCH 31, 2013 AND 2012 (UNAUDITED)
2013 2012 *)Notes (Unaudited) (Unaudited)
Rp Rp
NET SALES 24,32 1,213,561,575,587 862,342,262,399
COST OF GOODS SOLD 25 1,025,010,099,152 773,491,269,378
GROSS PROFIT 188,551,476,435 88,850,993,021
Selling expenses 26 (38,291,756,423) (19,909,403,869)General and administrative expenses 27 (14,868,482,236) (12,519,384,077)Financial charges 28 (31,304,135,149) (33,961,614,033)Loss on foreign exchange - net (16,637,349,487) (21,601,659,069)Gain (loss) on derivative financial instruments - net 34b 1,940,249,829 (739,806,398)Other gains 1,554,087,937 4,117,500,181
INCOME BEFORE TAX 90,944,090,906 4,236,625,756
TAX EXPENSE - NET 29 (23,641,431,322) (2,178,586,431)
NET INCOME FOR THE PERIOD 67,302,659,584 2,058,039,325Other comprehensive income - -
TOTAL COMPREHENSIVE INCOME 67,302,659,584 2,058,039,325
NET INCOME FOR THE PERIOD AND TOTAL COMPREHENSIVE INCOME ATTRIBUTABLE TO:Owners of the Company 67,302,659,584 2,058,039,325Non-controlling interest - -
NET INCOME FOR THE PERIOD AND TOTAL COMPREHENSIVE INCOME 67,302,659,584 2,058,039,325
BASIC EARNINGS PER SHARE 30 27.16 0.83
*) For the three-month periods ended March 31, 2012 are the consolidated financial statements.
See accompanying notes to financial statementswhich are an integral part of the financial statements.
- 4 -
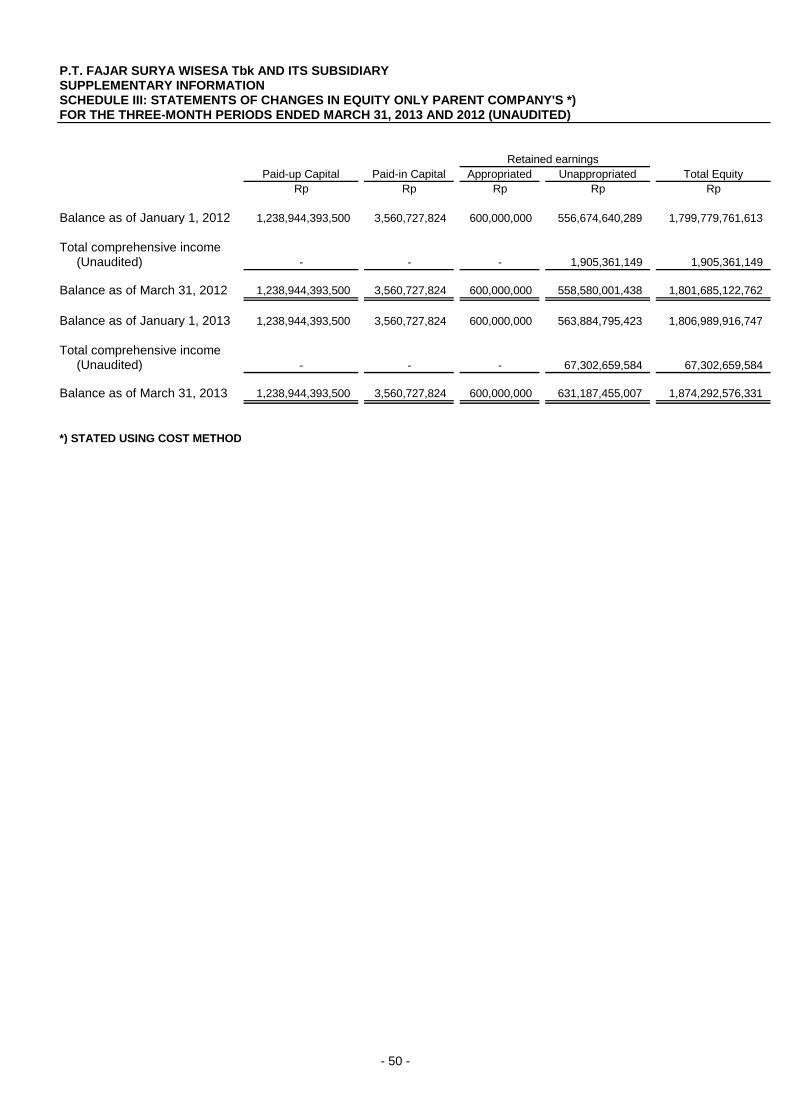
P.T. FAJAR SURYA WISESA Tbk AND ITS SUBSIDIARYSTATEMENTS OF CHANGES IN EQUITYFOR THE THREE-MONTH PERIODS ENDED MARCH 31, 2013 AND 2012 (UNAUDITED)
AdditionalPaid-up Capital Paid-in Capital Appropriated Unappropriated Total Equity
Rp Rp Rp Rp Rp
Balance as of January 1, 2012 1,238,944,393,500 3,560,727,824 600,000,000 558,592,332,553 1,801,697,453,877
Net income for the period and total comprehensive income - - - 2,058,039,325 2,058,039,325
Balance as of March 31, 2012 1,238,944,393,500 3,560,727,824 600,000,000 560,650,371,878 1,803,755,493,202
Balance as of January 1, 2013 1,238,944,393,500 3,560,727,824 600,000,000 563,884,795,423 1,806,989,916,747
Net income for the period and total comprehensive income - - - 67,302,659,584 67,302,659,584
Balance as of March 31, 2013 1,238,944,393,500 3,560,727,824 600,000,000 631,187,455,007 1,874,292,576,331
See accompanying notes to financial statementswhich are an integral part of the financial statements.
Retained earnings
- 5 -
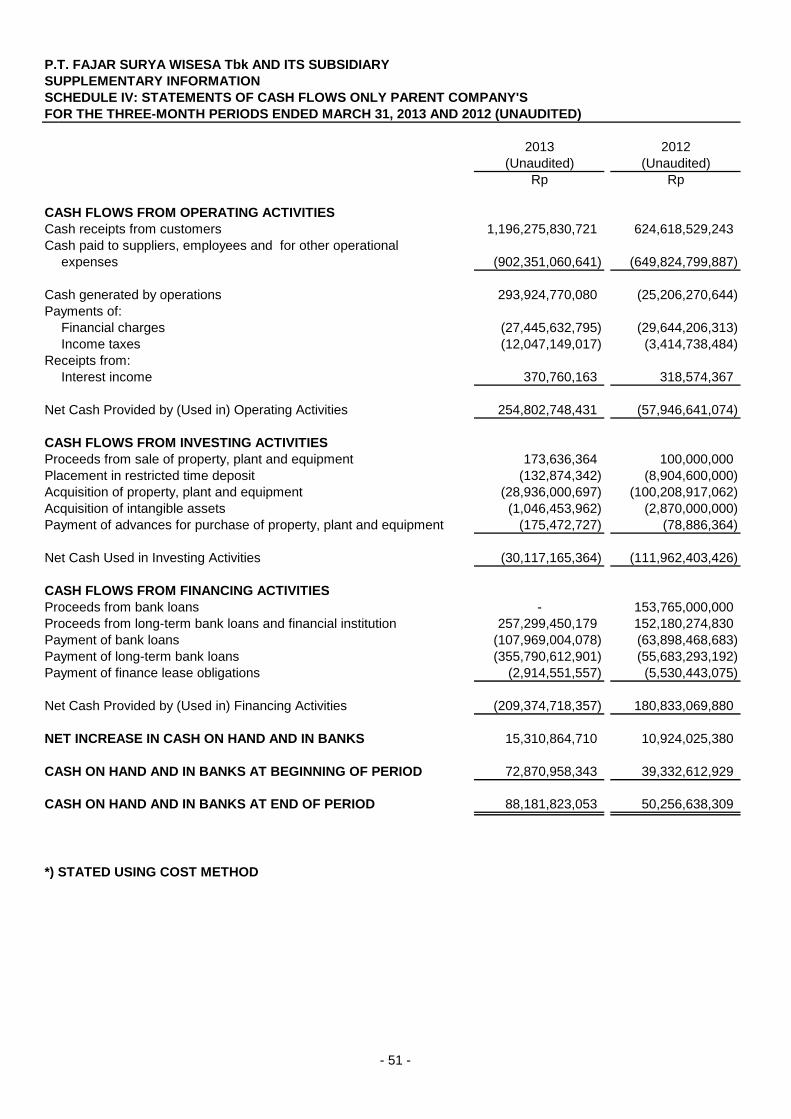
P.T. FAJAR SURYA WISESA Tbk AND ITS SUBSIDIARYSTATEMENTS OF CASH FLOWSFOR THE THREE-MONTH PERIODS ENDED MARCH 31, 2013 AND 2012 (UNAUDITED)
2013 2012 *)(Unaudited) (Unaudited)
Rp Rp
CASH FLOWS FROM OPERATING ACTIVITIESCash receipts from customers 1,196,275,830,721 624,618,529,243 Cash paid to suppliers, employees and for other operational expenses (902,351,060,641) (649,787,137,424)
Cash generated by operations 293,924,770,080 (25,168,608,181) Payments of:
Financial charges (27,445,632,795) (29,646,226,457) Income taxes (12,047,149,017) (3,414,738,483)
Receipts from:Interest income 370,760,163 318,574,367
Net Cash Provided by (Used in) Operating Activities 254,802,748,431 (57,910,998,754)
CASH FLOWS FROM INVESTING ACTIVITIESProceeds from sale of property, plant and equipment 173,636,364 100,000,000 Placement in restricted time deposit (132,874,342) (8,904,600,000) Acquisition of property, plant and equipment (28,936,000,697) (100,208,917,062) Acquisition of intangible assets (1,046,453,962) (2,870,000,000) Payment of advances for purchase of property, plant and equipment (175,472,727) (78,886,364)
Net Cash Used in Investing Activities (30,117,165,364) (111,962,403,426)
CASH FLOWS FROM FINANCING ACTIVITIESProceeds from bank loans - 153,765,000,000 Proceeds from long-term bank loans and financial institution 257,299,450,179 152,180,274,830 Payment of bank loans (107,969,004,078) (63,898,468,683) Payment of long-term bank loans (355,790,612,901) (55,683,293,192) Payment of finance lease obligations (2,914,551,557) (5,530,443,075)
Net Cash Provided by (Used in) Financing Activities (209,374,718,357) 180,833,069,880
NET INCREASE IN CASH ON HAND AND IN BANKS 15,310,864,710 10,959,667,700
CASH ON HAND AND IN BANKS AT BEGINNING OF PERIOD 72,870,958,343 42,218,367,909
CASH ON HAND AND IN BANKS AT END OF PERIOD 88,181,823,053 53,178,035,609
*) For the three-month periods ended March 31, 2012 are the consolidated financial statements.
See accompanying notes to financial statementswhich are an integral part of the financial statements.
- 6 -
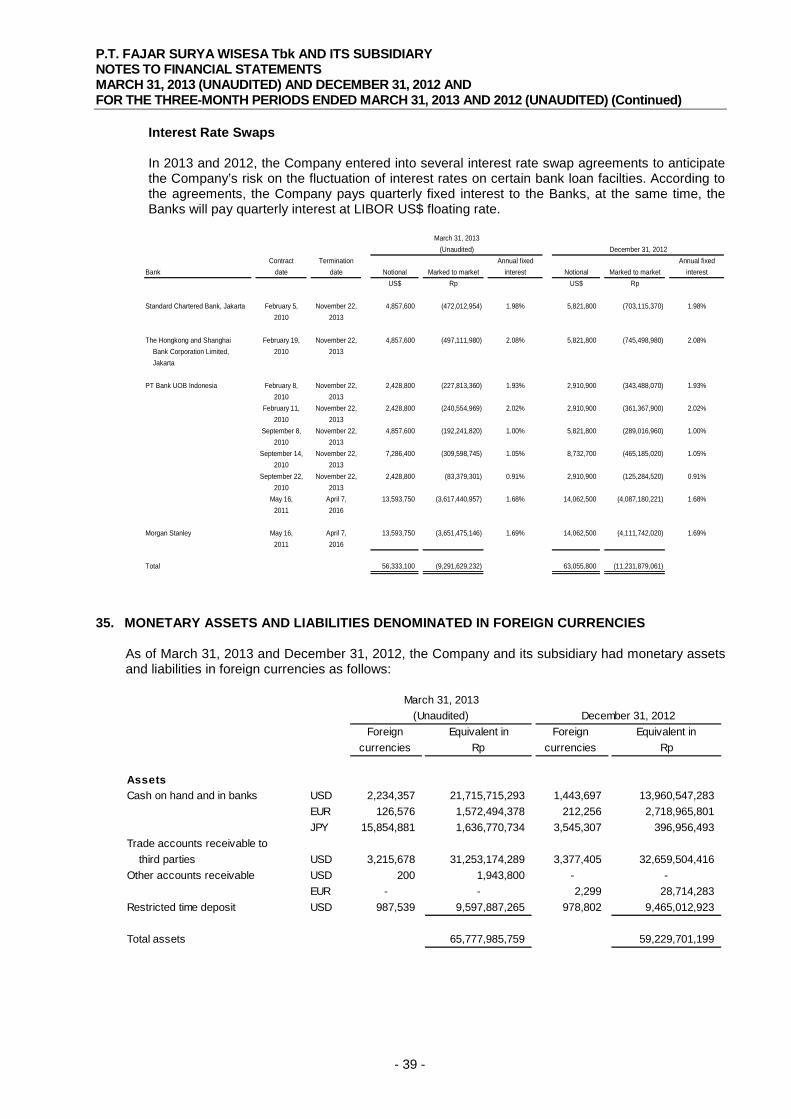
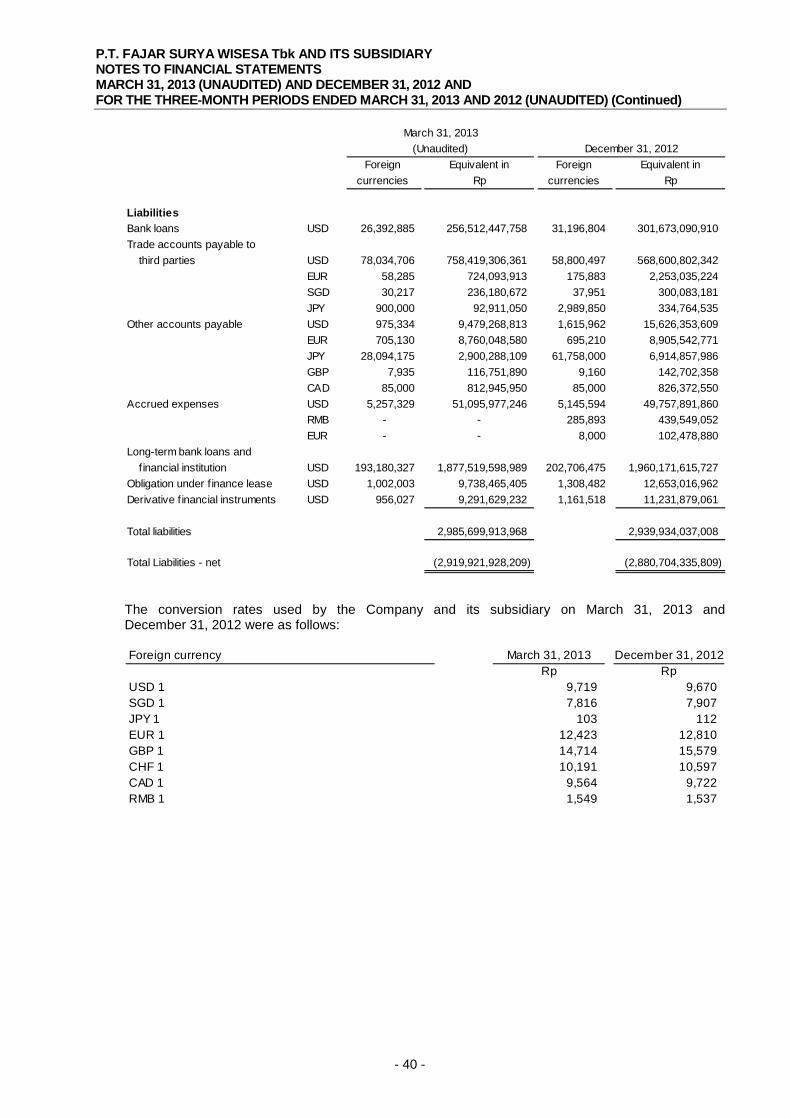
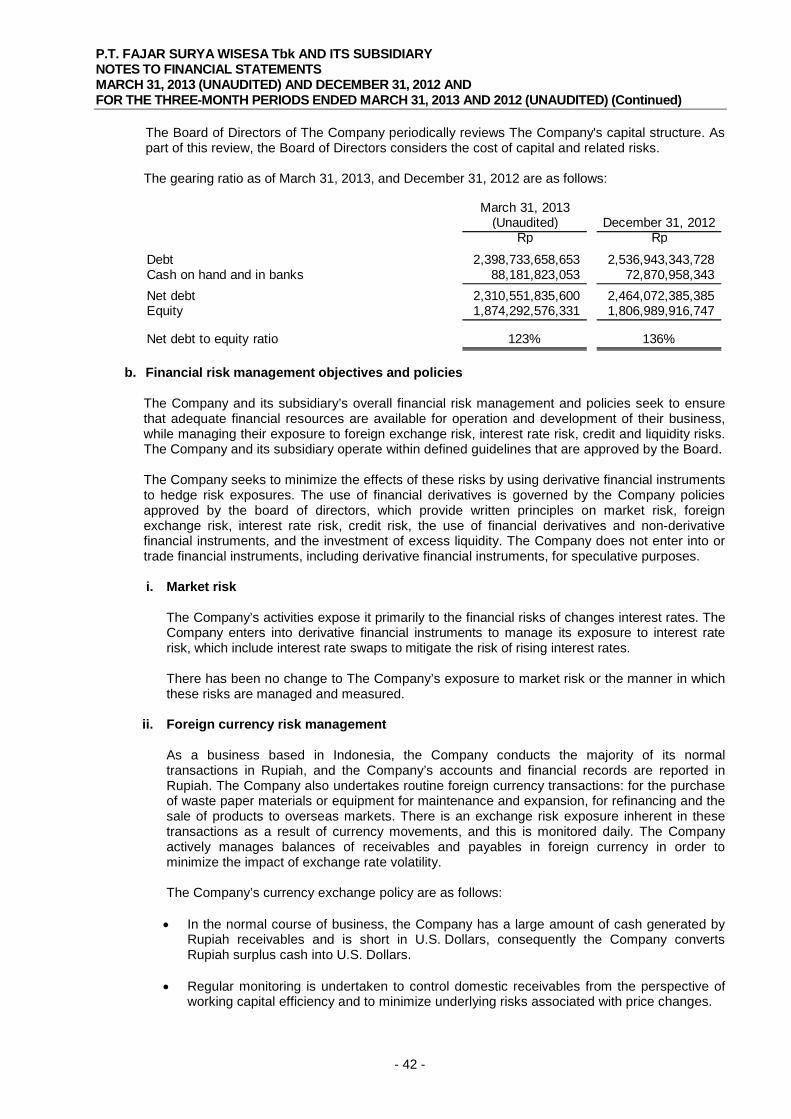
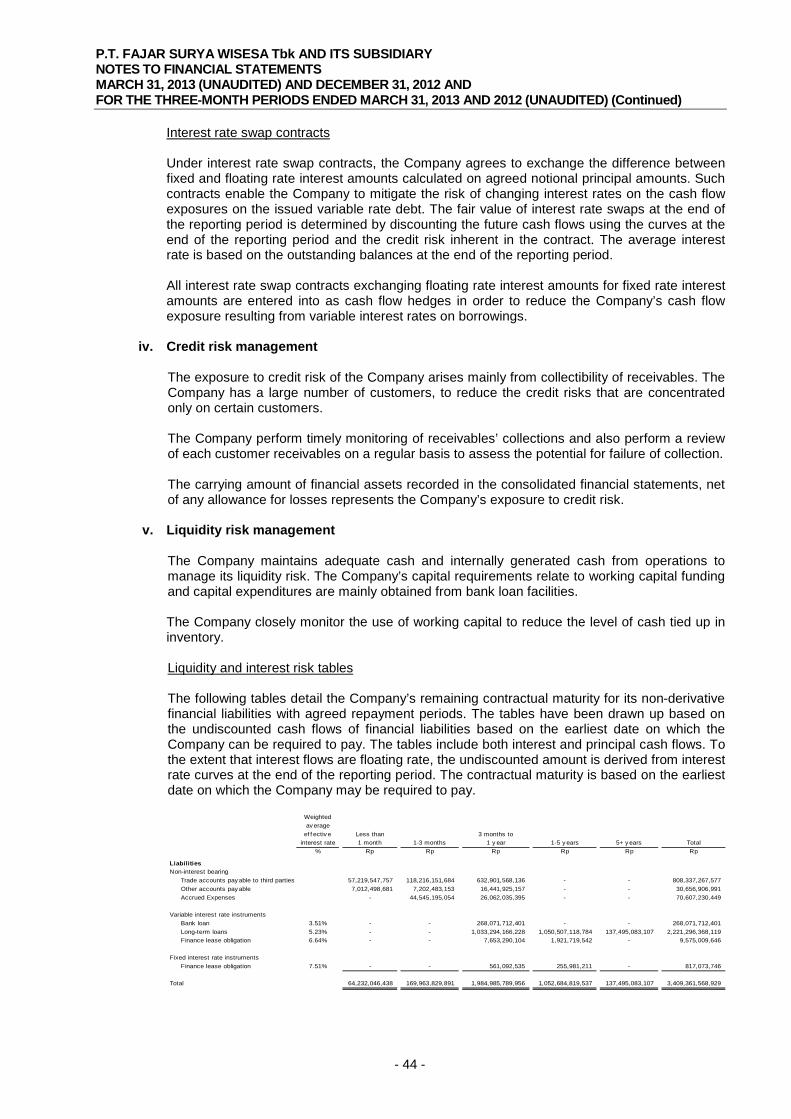
P.T. FAJAR SURYA WISESA Tbk AND ITS SUBSIDIARY NOTES TO FINANCIAL STATEMENTS MARCH 31, 2013 (UNAUDITED) AND DECEMBER 31, 2012 AND FOR THE THREE-MONTH PERIODS ENDED MARCH 31, 2013 AND 2012 (UNAUDITED)
- 7 -
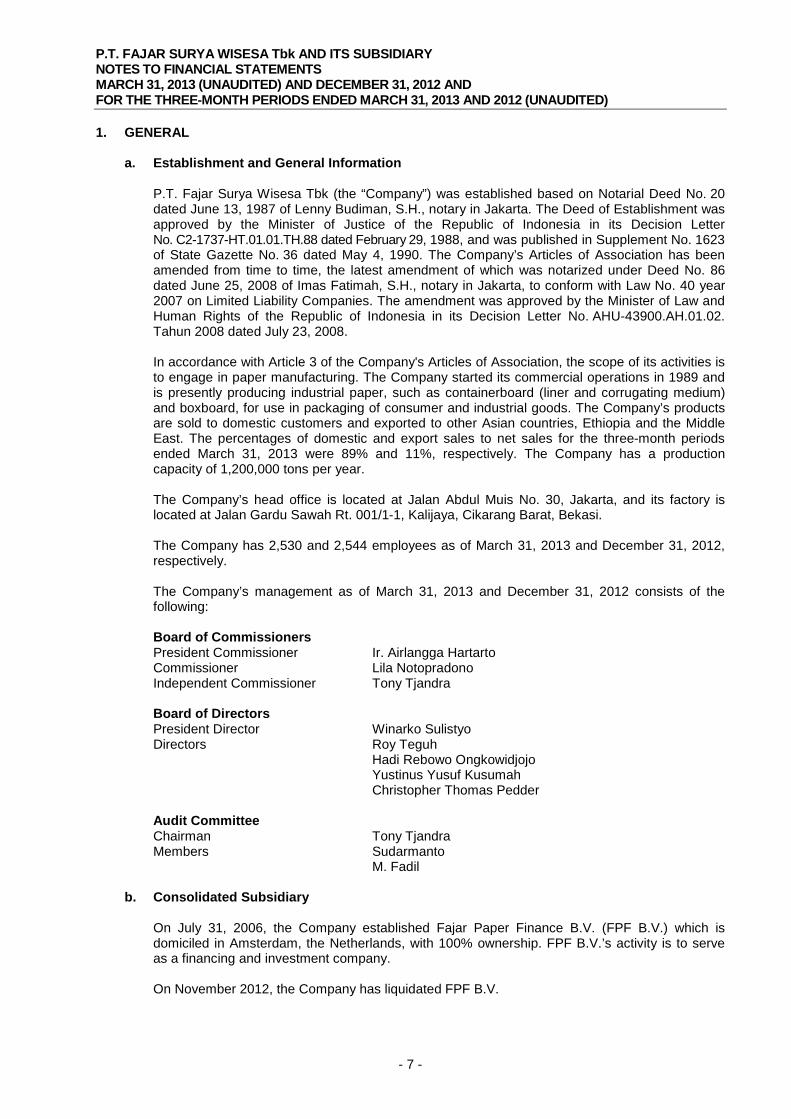
1. GENERAL
a. Establishment and General Information
P.T. Fajar Surya Wisesa Tbk (the “Company”) was established based on Notarial Deed No. 20 dated June 13, 1987 of Lenny Budiman, S.H., notary in Jakarta. The Deed of Establishment was approved by the Minister of Justice of the Republic of Indonesia in its Decision Letter No. C2-1737-HT.01.01.TH.88 dated February 29, 1988, and was published in Supplement No. 1623 of State Gazette No. 36 dated May 4, 1990. The Company’s Articles of Association has been amended from time to time, the latest amendment of which was notarized under Deed No. 86 dated June 25, 2008 of Imas Fatimah, S.H., notary in Jakarta, to conform with Law No. 40 year 2007 on Limited Liability Companies. The amendment was approved by the Minister of Law and Human Rights of the Republic of Indonesia in its Decision Letter No. AHU-43900.AH.01.02. Tahun 2008 dated July 23, 2008. In accordance with Article 3 of the Company's Articles of Association, the scope of its activities is to engage in paper manufacturing. The Company started its commercial operations in 1989 and is presently producing industrial paper, such as containerboard (liner and corrugating medium) and boxboard, for use in packaging of consumer and industrial goods. The Company’s products are sold to domestic customers and exported to other Asian countries, Ethiopia and the Middle East. The percentages of domestic and export sales to net sales for the three-month periods ended March 31, 2013 were 89% and 11%, respectively. The Company has a production capacity of 1,200,000 tons per year. The Company’s head office is located at Jalan Abdul Muis No. 30, Jakarta, and its factory is located at Jalan Gardu Sawah Rt. 001/1-1, Kalijaya, Cikarang Barat, Bekasi. The Company has 2,530 and 2,544 employees as of March 31, 2013 and December 31, 2012, respectively. The Company’s management as of March 31, 2013 and December 31, 2012 consists of the following:
Board of Commissioners President Commissioner Commissioner Independent Commissioner
Ir. Airlangga Hartarto Lila Notopradono Tony Tjandra
Board of Directors President Director Directors
Winarko Sulistyo Roy Teguh Hadi Rebowo Ongkowidjojo Yustinus Yusuf Kusumah Christopher Thomas Pedder
Audit Committee Chairman Members
Tony Tjandra Sudarmanto M. Fadil
b. Consolidated Subsidiary
On July 31, 2006, the Company established Fajar Paper Finance B.V. (FPF B.V.) which is domiciled in Amsterdam, the Netherlands, with 100% ownership. FPF B.V.’s activity is to serve as a financing and investment company. On November 2012, the Company has liquidated FPF B.V.
P.T. FAJAR SURYA WISESA Tbk AND ITS SUBSIDIARY NOTES TO FINANCIAL STATEMENTS MARCH 31, 2013 (UNAUDITED) AND DECEMBER 31, 2012 AND FOR THE THREE-MONTH PERIODS ENDED MARCH 31, 2013 AND 2012 (UNAUDITED) (Continued)
- 8 -
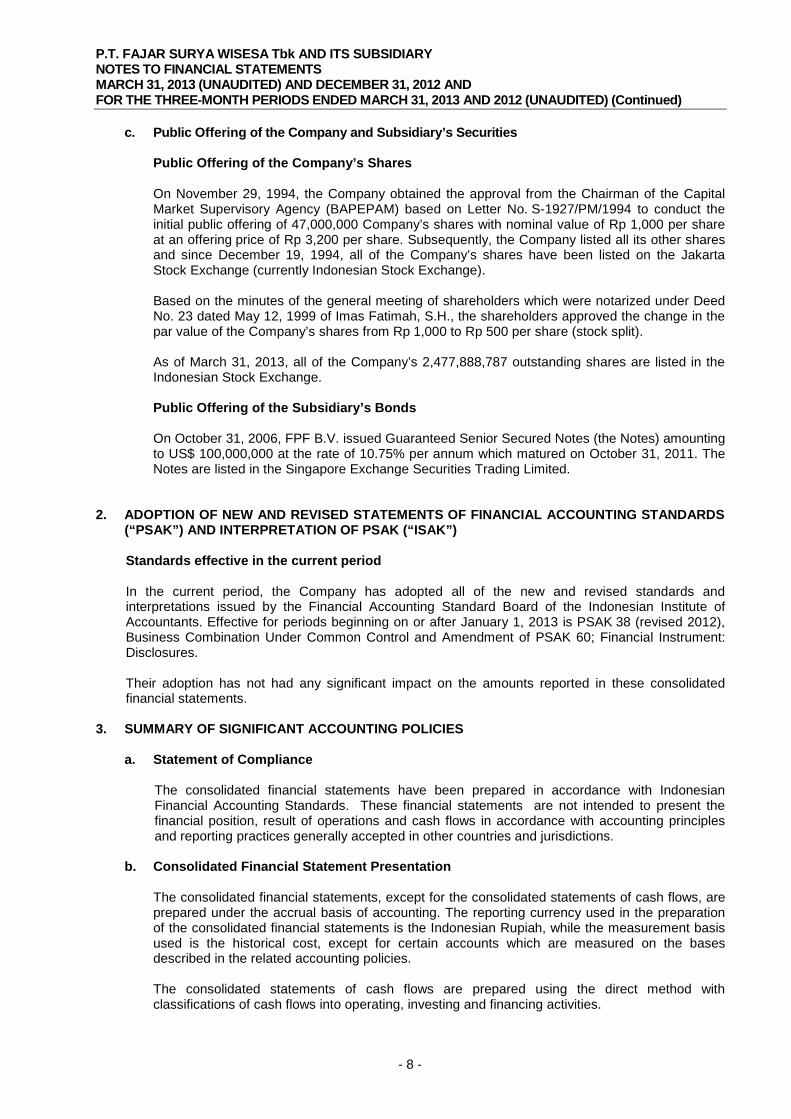
c. Public Offering of the Company and Subsidiary’s Securities Public Offering of the Company’s Shares On November 29, 1994, the Company obtained the approval from the Chairman of the Capital Market Supervisory Agency (BAPEPAM) based on Letter No. S-1927/PM/1994 to conduct the initial public offering of 47,000,000 Company’s shares with nominal value of Rp 1,000 per share at an offering price of Rp 3,200 per share. Subsequently, the Company listed all its other shares and since December 19, 1994, all of the Company’s shares have been listed on the Jakarta Stock Exchange (currently Indonesian Stock Exchange). Based on the minutes of the general meeting of shareholders which were notarized under Deed No. 23 dated May 12, 1999 of Imas Fatimah, S.H., the shareholders approved the change in the par value of the Company’s shares from Rp 1,000 to Rp 500 per share (stock split). As of March 31, 2013, all of the Company’s 2,477,888,787 outstanding shares are listed in the Indonesian Stock Exchange. Public Offering of the Subsidiary’s Bonds On October 31, 2006, FPF B.V. issued Guaranteed Senior Secured Notes (the Notes) amounting to US$ 100,000,000 at the rate of 10.75% per annum which matured on October 31, 2011. The Notes are listed in the Singapore Exchange Securities Trading Limited.
2. ADOPTION OF NEW AND REVISED STATEMENTS OF FINANCIAL ACCOUNTING STANDARDS (“PSAK”) AND INTERPRETATION OF PSAK (“ISAK”)
Standards effective in the current period In the current period, the Company has adopted all of the new and revised standards and interpretations issued by the Financial Accounting Standard Board of the Indonesian Institute of Accountants. Effective for periods beginning on or after January 1, 2013 is PSAK 38 (revised 2012), Business Combination Under Common Control and Amendment of PSAK 60; Financial Instrument: Disclosures. Their adoption has not had any significant impact on the amounts reported in these consolidated financial statements.
3. SUMMARY OF SIGNIFICANT ACCOUNTING POLICIES
a. Statement of Compliance
The consolidated financial statements have been prepared in accordance with Indonesian Financial Accounting Standards. These financial statements are not intended to present the financial position, result of operations and cash flows in accordance with accounting principles and reporting practices generally accepted in other countries and jurisdictions.
b. Consolidated Financial Statement Presentation The consolidated financial statements, except for the consolidated statements of cash flows, are prepared under the accrual basis of accounting. The reporting currency used in the preparation of the consolidated financial statements is the Indonesian Rupiah, while the measurement basis used is the historical cost, except for certain accounts which are measured on the bases described in the related accounting policies. The consolidated statements of cash flows are prepared using the direct method with classifications of cash flows into operating, investing and financing activities.
P.T. FAJAR SURYA WISESA Tbk AND ITS SUBSIDIARY NOTES TO FINANCIAL STATEMENTS MARCH 31, 2013 (UNAUDITED) AND DECEMBER 31, 2012 AND FOR THE THREE-MONTH PERIODS ENDED MARCH 31, 2013 AND 2012 (UNAUDITED) (Continued)
- 9 -
c. Principles of Consolidation
The consolidated financial statements incorporate the financial statements of the Company and entities controlled by the Company (its subsidiary – Note 1b). Control is achieved where the Company has the power to govern the financial and operating policies of an entity so as to obtain benefits from its activities. Where necessary, adjustments are made to the financial statements of the subsidiary to bring the accounting policies used in line with those used by the Company. All intra-group transaction, balances, income and expenses are eliminated on consolidation. On March 31, 2013, the Company did not apply the principles of consolidation, because the subsidiary, FPF B.V. has liquidated (Note 1b).
d. Foreign Currency Transactions and Translation
The books of accounts of the Company are maintained in Indonesian Rupiah. Transactions during the year involving foreign currencies are recorded at the rates of exchange prevailing at the time the transactions are made. At financial position date, monetary assets and liabilities denominated in foreign currencies are adjusted to reflect the exchange rates prevailing at that date. The resulting gains or losses are credited or charged to profit or loss. The operations of FPF B.V., a subsidiary in Amsterdam is integral to the Company’s operations, thus the book of accounts of the subsidiary which is maintained in U.S. Dollar is translated into Indonesian Rupiah using similar procedures as the Company.
e. Transactions with Related Parties
A related party is a person or entity that is related to the Company and its subsidiary (the reporting entity): a. A person or a close member of that person's family is related to the reporting entity if that
person:
i. has control or joint control over the reporting entity;
ii. has significant influence over the reporting entity; or iii. is a member of the key management personnel of the reporting entity or of a parent of the
reporting entity.
b. An entity is related to the reporting entity if any of the following conditions applies:
i. The entity and the reporting entity are members of the same the Company (which means that each parent, subsidiary and fellow subsidiary is related to the others).
ii. One entity is an associate or joint venture of the other entity (or an associate or joint
venture of a member of a the Company of which the other entity is a member). iii. Both entities are joint ventures of the same third party. iv. One entity is a joint venture of a third entity and the other entity is an associate of the third
entity.
v. The entity is a post-employment benefit plan for the benefit of employees of either the reporting entity, or an entity related to the reporting entity. If the reporting entity in itself such a plan, the sponsoring employers are also related to the reporting entity.
P.T. FAJAR SURYA WISESA Tbk AND ITS SUBSIDIARY NOTES TO FINANCIAL STATEMENTS MARCH 31, 2013 (UNAUDITED) AND DECEMBER 31, 2012 AND FOR THE THREE-MONTH PERIODS ENDED MARCH 31, 2013 AND 2012 (UNAUDITED) (Continued)
- 10 -
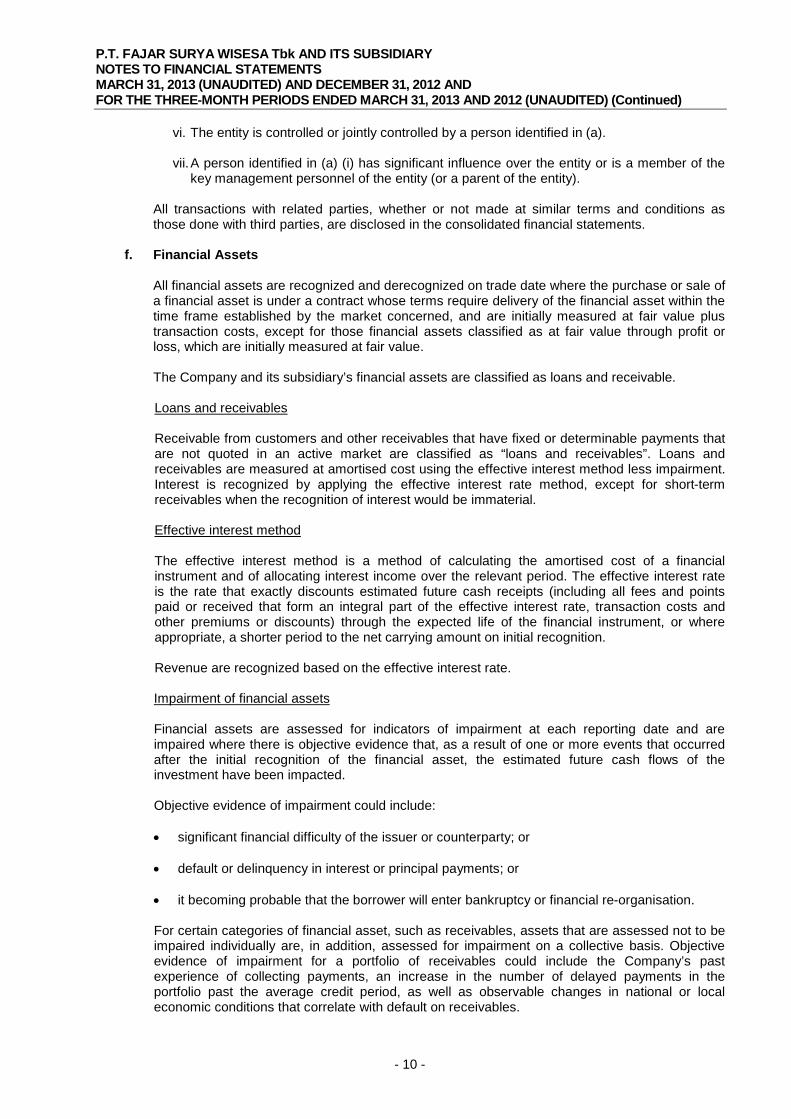
vi. The entity is controlled or jointly controlled by a person identified in (a).
vii. A person identified in (a) (i) has significant influence over the entity or is a member of the key management personnel of the entity (or a parent of the entity).
All transactions with related parties, whether or not made at similar terms and conditions as those done with third parties, are disclosed in the consolidated financial statements.
f. Financial Assets All financial assets are recognized and derecognized on trade date where the purchase or sale of a financial asset is under a contract whose terms require delivery of the financial asset within the time frame established by the market concerned, and are initially measured at fair value plus transaction costs, except for those financial assets classified as at fair value through profit or loss, which are initially measured at fair value. The Company and its subsidiary’s financial assets are classified as loans and receivable. Loans and receivables Receivable from customers and other receivables that have fixed or determinable payments that are not quoted in an active market are classified as “loans and receivables”. Loans and receivables are measured at amortised cost using the effective interest method less impairment. Interest is recognized by applying the effective interest rate method, except for short-term receivables when the recognition of interest would be immaterial. Effective interest method The effective interest method is a method of calculating the amortised cost of a financial instrument and of allocating interest income over the relevant period. The effective interest rate is the rate that exactly discounts estimated future cash receipts (including all fees and points paid or received that form an integral part of the effective interest rate, transaction costs and other premiums or discounts) through the expected life of the financial instrument, or where appropriate, a shorter period to the net carrying amount on initial recognition. Revenue are recognized based on the effective interest rate.
Impairment of financial assets Financial assets are assessed for indicators of impairment at each reporting date and are impaired where there is objective evidence that, as a result of one or more events that occurred after the initial recognition of the financial asset, the estimated future cash flows of the investment have been impacted. Objective evidence of impairment could include: significant financial difficulty of the issuer or counterparty; or default or delinquency in interest or principal payments; or it becoming probable that the borrower will enter bankruptcy or financial re-organisation. For certain categories of financial asset, such as receivables, assets that are assessed not to be impaired individually are, in addition, assessed for impairment on a collective basis. Objective evidence of impairment for a portfolio of receivables could include the Company’s past experience of collecting payments, an increase in the number of delayed payments in the portfolio past the average credit period, as well as observable changes in national or local economic conditions that correlate with default on receivables.
P.T. FAJAR SURYA WISESA Tbk AND ITS SUBSIDIARY NOTES TO FINANCIAL STATEMENTS MARCH 31, 2013 (UNAUDITED) AND DECEMBER 31, 2012 AND FOR THE THREE-MONTH PERIODS ENDED MARCH 31, 2013 AND 2012 (UNAUDITED) (Continued)
- 11 -
For financial assets carried at amortised cost, the amount of the impairment is the difference between the asset’s carrying amount and the present value of estimated future cash flows, discounted at the financial asset’s original effective interest rate. The carrying amount of the financial asset is reduced by the impairment loss directly for all financial assets with the exception of receivables, where the carrying amount is reduced through the use of an allowance account. When a receivable is considered uncollectible, it is written off against the allowance account. Subsequent recoveries of amounts previously written off are credited against the allowance account. Changes in the carrying amount of the allowance account are recognized in profit or loss. If, in a subsequent period, the amount of the impairment loss decreases and the decrease can be related objectively to an event occurring after the impairment was recognized, the previously recognized impairment loss is reversed through profit or loss to the extent that the carrying amount of the investment at the date the impairment is reversed does not exceed what the amortised cost would have been had the impairment not been recognized.
Derecognition of financial assets The Company and its subsidiary derecognize a financial asset only when the contractual rights to the cash flows from the asset expire, or when it transfers the financial asset and substantially all the risks and rewards of ownership of the asset to another entity. If the Company and its subsidiary neither transfers nor retains substantially all the risks and rewards of ownership and continues to control the transferred asset, the Company and its subsidiary recognize its retained interest in the asset and an associated liability for amounts it may have to pay. If the Company and its subsidiary retain substantially all the risks and rewards of ownership of a transferred financial asset, the Company and its subsidiary continue to recognize the financial asset and also recognize a collateralised borrowing for the proceeds received.
g. Financial Liabilities and Equity Instruments Classification as debt or equity Financial liabilities and equity instruments issued by The Company are classified according to the substance of the contractual arrangements entered into and the definitions of a financial liability and an equity instrument. Equity instruments An equity instrument is any contract that evidences a residual interest in the assets of an entity after deducting all of its liabilities. Equity instruments issued by The Company are recorded at the proceeds received, net of direct issue costs. Financial Liabilities at Amortized Cost Trade and other payables and other borrowings are initially measured at fair value, net of transaction costs, and subsequently measured at amortized cost using the effective interest rate method, with interest expense recognized on an effective yield basis. Any difference between the proceeds (net of transaction cost) and the settlement or redemption of borrowings is recognized over the term of the borrowings. Accounting policy for derivative financial instrument is detailed in Note 3t. Derecognition of financial liabilities The Company derecognizes financial liabilities when, and only when, The Company’s obligations are discharged, cancelled or expires.
P.T. FAJAR SURYA WISESA Tbk AND ITS SUBSIDIARY NOTES TO FINANCIAL STATEMENTS MARCH 31, 2013 (UNAUDITED) AND DECEMBER 31, 2012 AND FOR THE THREE-MONTH PERIODS ENDED MARCH 31, 2013 AND 2012 (UNAUDITED) (Continued)
- 12 -
h. Netting of Financial Assets and Financial Liabilities The Company and its subsidiary only offset financial assets and liabilities and present the net amount in the statement of financial position where they: currently have a legal enforceable right to set off the recognized amount; and
intend either to settle on a net basis, or to realize the asset and settle the liability
simultaneously.
i. Cash and Cash Equivalents
For cash flow presentation purposes, cash and cash equivalents consist of cash on hand and in banks and all unrestricted investments with maturities of three months or less from the date of placement.
j. Inventories
Inventories are stated at cost or net realizable value, whichever is lower. Cost is determined using the weighted average method.
k. Property, Plant and Equipment – Direct Acquisition
Property, plant and equipment held for use in the production or supply of goods or services, or for administrative purposes, are stated at cost, less accumulated depreciation and any accumulated impairment losses. Depreciation is recognized so as to write-off the cost of assets less residual values using the straight-line method based on the estimated useful lives of the assets as follows:
Years Buildings and improvements 20 Machineries and equipment 25 - 30 Vehicles 5 Furniture, fixtures and equipment 5
Assets under finance lease are depreciated based on the same estimated useful life with owned assets or depreciated over the lease period or useful life whichever is shorter. The estimated useful lives, residual values and depreciation method are reviewed at each year end, with the effect of any changes in estimate accounted for on a prospective basis. Land is stated at cost and is not depreciated. The cost of maintenance and repairs is charged to operations as incurred. Other costs incurred subsequently to add to, replace part of, or service an item of property, plant and equipment, are recognized as asset if, and only if it is probable that future economic benefits associated with the item will flow to the entity and the cost of the item can be measured reliably.
When assets are retired or otherwise disposed of, their carrying values and the related accumulated depreciation and any impairment loss are removed from the accounts and any resulting gain or loss is reflected in profit or loss. Construction in progress is stated at cost which includes borrowing costs during construction on debts incurred to finance the construction. Construction in progress is transferred to the respective property, plant and equipment account when completed and ready for use.
P.T. FAJAR SURYA WISESA Tbk AND ITS SUBSIDIARY NOTES TO FINANCIAL STATEMENTS MARCH 31, 2013 (UNAUDITED) AND DECEMBER 31, 2012 AND FOR THE THREE-MONTH PERIODS ENDED MARCH 31, 2013 AND 2012 (UNAUDITED) (Continued)
- 13 -
l. Impairment of Non-Financial Asset At the end of each reporting period, the Company and its subsidiary review the carrying amount of non-financial assets to determine whether there is any indication that those assets have suffered an impairment loss. If any such indication exists, the recoverable amount of the asset is estimated in order to determine the extent of the impairment loss (if any). Where it is not possible to estimate the recoverable amount of an individual asset, the Company and its subsidiary estimate the recoverable amount of the cash generating unit to which the asset belongs. Estimated recoverable amount is the higher of fair value less cost to sales and value in use. If the recoverable amount of a non-financial asset (cash generating unit) is less than its carrying amount, the carrying amount of the asset (cash generating unit) is reduced to its recoverable amount and an impairment loss is recognized immediately against earnings. Accounting policy for impairment of financial assets is discussed in Note 3f.
m. Lease Leases are classified as finance leases whenever the terms of the lease transfer substantially all the risks and rewards of ownership to the lessee. All other leases are classified as operating leases. The Company as Lessee Assets held under finance leases are initially recognized as assets of the Company at their fair value at the inception of the lease or, if lower, at the present value of the minimum lease payments. The corresponding liability to the lessor is included in the consolidated statements of financial position as a finance lease obligation. Lease payments are apportioned between finance charges and reduction of the lease obligation so as to achieve a constant rate of interest on the remaining balance of the liability. Contingent rentals are recognized as expenses in the periods in which they are incurred. Operating lease payments are recognized as an expense on a straight-line basis over the lease term, except where another systematic basis is more representative of the time pattern in which economic benefits from the leased asset are consumed. Contingent rentals arising under operating leases are recognized as an expense in the period in which they are incurred. In the event that lease incentives are received to enter into operating leases, such incentives are recognized as a liability. The aggregate benefit of incentives is recognized as a reduction of rental expense on a straight-line basis, except where another systematic basis is more representative of the time pattern in which economic benefits from the leased asset are consumed.
n. Post-Employment Benefits
In addition, The Company also provides post-employment benefits as required under Labor Law No. 13/2003 (the “Labor Law”). The cost of providing post employment benefits is determined using the Projected Unit Credit Method. The accumulated unrecognized actuarial gains and losses that exceed 10% of the greater of the present value of the Company’s defined benefit obligations are recognized on straight-line basis over the expected average remaining working lives of the participating employees (corridor approach). Past service cost is recognized immediately to the extent that the benefits are already vested, and otherwise is amortized on a straight-line basis over the average period until the benefits become vested.
P.T. FAJAR SURYA WISESA Tbk AND ITS SUBSIDIARY NOTES TO FINANCIAL STATEMENTS MARCH 31, 2013 (UNAUDITED) AND DECEMBER 31, 2012 AND FOR THE THREE-MONTH PERIODS ENDED MARCH 31, 2013 AND 2012 (UNAUDITED) (Continued)
- 14 -
The benefit obligation recognized in the consolidated statements of financial position represents the present value of the defined benefit obligation, as adjusted for unrecognized actuarial gains and losses and unrecognized past service cost.
o. Provisions Provisions are recognized when the Company have a present obligation (legal or constructive) as a result of a past event, it is probable that the Company and its subsidiary will be required to settle the obligation, and a reliable estimate can be made of the amount of the obligation. The amount recognized as a provision is the best estimate of the consideration required to settle the present obligation at the end of the reporting period, taking into account the risks and uncertainties surrounding the obligation. Where a provision is measured using the cash flows estimated to settle the present obligation, its carrying amount is the present value of those cash flows. When some or all of the economic benefits required to settle a provision are expected to be recovered from a third party, a receivable is recognized as an asset if it is virtually certain that reimbursement will be received and the amount of the receivable can be measured reliably.
p. Borrowing Costs Borrowing costs directly attributable to the acquisition, construction or production of qualifying assets, which are assets that necessarily take a substantial period of time to get ready for their intended use or sale, are added to the cost of those assets, until such time as the assets are substantially ready for their intended use or sale. All other borrowing costs are recognized in profit or loss in the period in which they are incurred.
q. Revenue and Expense Recognition
Sale of Goods Revenue from sales of goods is recognized when all of the following conditions are satisfied: The Company has transferred to the buyer the significant risks and rewards of ownership of
the goods;
The Company retains neither continuing managerial involvement to the degree usually associated with ownership nor effective control over the goods sold;
The amount of revenue can be measured reliably;
It is probable that the economic benefits associated with the transaction will flow to the Company; and
The cost incurred or to be incurred in respect of the transaction can be measured reliably. Interest Revenue Interest revenue is accrued on time basis, by reference to the principal outstanding and at the applicable interest rate.
P.T. FAJAR SURYA WISESA Tbk AND ITS SUBSIDIARY NOTES TO FINANCIAL STATEMENTS MARCH 31, 2013 (UNAUDITED) AND DECEMBER 31, 2012 AND FOR THE THREE-MONTH PERIODS ENDED MARCH 31, 2013 AND 2012 (UNAUDITED) (Continued)
- 15 -
Expenses Expenses are recognized when incurred.
r. Income Tax
Current tax expense is determined based on the taxable income for the year computed using prevailing tax rates.
Deferred tax assets and liabilities are recognized for the future tax consequences attributable to differences between the financial statement carrying amounts of existing assets and liabilities and their respective tax bases. Deferred tax liabilities are recognized for all taxable temporary differences and deferred tax assets are recognized for deductible temporary differences to the extent that it is probable that taxable income will be available in future periods against which the deductible temporary differences can be utilized. Deferred tax assets and liabilities are measured at the tax rates that are expected to apply in the period in which the liability is settled or the asset realized, based on the tax rates (and tax laws) that have been enacted, or substantively enacted, by the end of the reporting period. The measurement of deferred tax assets and liabilities reflects the consequences that would follow from the manner in which the Company and its subsidiary expect, at the end of the reporting period, to recover or settle the carrying amount of their assets and liabilities. The carrying amount of deferred tax asset is reviewed at the end of each reporting period and reduced to the extent that it is no longer probable that sufficient taxable profits will be available to allow all or part of the asset to be recovered. Deferred tax assets and liabilities are offset when there is legally enforceable right to set off current tax assets against current tax liabilities and when they relate to income taxes levied by the same taxation authority and the company and its subsidiary intend to settle their current tax assets and current tax liabilities on a net basis. Current and deferred tax are recognized as an expense or income in profit or loss, except when they relate to items that are recognized outside of profit or loss (whether in other comprehensive income or directly in equity), in which case the tax is also recognized outside of profit or loss.
s. Earnings per Share
Basic earnings per share is computed by dividing net income by the weighted average number of shares outstanding during the year.
t. Derivative Financial Instruments
The Company uses derivative financial instruments to manage its exposure to interest rate. Further details on the use of derivatives are disclosed in Note 34b. Derivatives are initially recognized at fair value at the date the derivative contract is entered into and are subsequently measured to their fair value at each reporting date. Although entered into as economic hedge of exposure against interest rate, these derivatives are not designated and do not qualify as accounting hedge and therefore changes in fair values are recognized immediately in earnings.
P.T. FAJAR SURYA WISESA Tbk AND ITS SUBSIDIARY NOTES TO FINANCIAL STATEMENTS MARCH 31, 2013 (UNAUDITED) AND DECEMBER 31, 2012 AND FOR THE THREE-MONTH PERIODS ENDED MARCH 31, 2013 AND 2012 (UNAUDITED) (Continued)
- 16 -
Derivatives embedded in other financial instruments or other host contracts are treated as separate derivatives when their risks and characteristics are not closely related to those of the host contracts and the host contracts are not measured at fair value with changes in fair value recognized in earnings. A derivative is presented as non-current asset or non-current liability if the remaining maturity of the instrument is more than 12 months and is not expected to be realized or settled within 12 months. Other derivatives are presented as current assets or current liabilities.
u. Segment Information
Operating segments are identified on the basis of internal reports about components of the Company and its subsidiary that are regularly reviewed by the chief operating decision maker in order to allocate resources to the segments and to assess their performances. An operating segment is a component of an entity:
a) that engages in business activities from which it may earn revenue and incur expenses
(including revenue and expenses relating to the transaction with other components of the same entity);
b) whose operating results are reviewed regularly by the entity’s chief operating decision maker
to make decision about resources to be allocated to the segments and assess its performance; and
c) for which discrete financial information is available. Information reported to the chief operating decision maker for the purpose of resource allocation and assessment of their performance is more specifically focused on the category of each product.
4. CRITICAL ACCOUNTING JUDGMENTS AND ESTIMATES
In the application of the Company accounting policies, which are described in Note 3, the directors are required to make judgments, estimates and assumptions about the carrying amounts of assets and liabilities that are not readily apparent from other sources. The estimates and associated assumptions are based on historical experience and other factors that are considered to be relevant. Actual results may differ from these estimates. Critical Judgments in applying the Company and its subsidiary’s Accounting Policies In the process of applying the accounting policies described in Note 3, management has not made any critical judgment that has significant impact on the amounts recognized in the consolidated financial statements, apart from those involving estimates, which are dealt with below. Key Sources of Estimation Uncertainty The key assumptions concerning future and other key sources of estimation uncertainty at the end of the reporting period, that have a significant risk of causing a material adjustment to the carrying amounts of assets and liabilities within the next financial year are discussed below:
P.T. FAJAR SURYA WISESA Tbk AND ITS SUBSIDIARY NOTES TO FINANCIAL STATEMENTS MARCH 31, 2013 (UNAUDITED) AND DECEMBER 31, 2012 AND FOR THE THREE-MONTH PERIODS ENDED MARCH 31, 2013 AND 2012 (UNAUDITED) (Continued)
- 17 -
The Estimated Economic Useful Life of Property, Plant and Equipment The useful life of each of the item of the Company’s property, plant and equipment are estimated based on the period over which the asset is expected to be used. Such estimation is based on internal technical evaluation and the Company’s experience with similar assets. The estimated useful life of each asset is reviewed periodically and updated if expectations differ from previous estimates due to physical wear and tear, technical or commercial obsolescence and legal or other limits on the use of the asset. It is possible, however, that future results of operations could be materially affected by changes in the amounts and timing of recorded expenses brought about by changes in the factors mentioned above. A change in the estimated useful life of any item of property, plant and equipment would affect the recorded depreciation expense and the carrying values of property, plant and equipment. The carrying amounts of property, plant and equipment are disclosed in Note 11.
Employee Benefits The determination of provision for post-employment benefits is dependent on selection of certain assumptions used by management in calculating such amounts. Those assumptions include among others, discount rate and rate of salary increase. Actual results that differ from the Company’s assumptions are accumulated and amortized over future periods and therefore, generally affect the recognized expense and recorded provision in future periods. While it is believed that the Company’s assumptions are reasonable and appropriate, significant differences in actual results or significant changes in assumptions may materially affect the Company’s provision for post-employment benefit. The carrying amounts of post-employment benefit obligation are disclosed in Note 21. Allowance for Decline in Value of Inventories The Company performs analysis for decline in value of inventories based on estimated future usage of such inventories. While it is believed that the assumptions used in the estimation of the allowance for decline in value of inventories are appropriate and reasonable, significant changes in these assumptions may materially affect the assessment of the allowance for decline in value of inventories, which ultimately will impact the result of the Company’s operations. The carrying amounts of inventories are disclosed in Note 7. Income Tax Under the tax laws of Indonesia, the Company submit tax returns on the basis of self-assessment. The tax authorities may assess or amend taxes within the statute of limitation under prevailing regulations. The Company has exposure to income taxes since significant judgment is involved in determining the Company provision for income taxes. There are certain transactions and computations for which the ultimate tax determination is uncertain during the ordinary course of business. Where the final tax outcome of these matters is different from the amounts that were initially recognised, such differences will impact the income tax provisions in the period in which such determination is made. The carrying amounts of the prepaid taxes disclosed in Notes 9 and 29.
P.T. FAJAR SURYA WISESA Tbk AND ITS SUBSIDIARY NOTES TO FINANCIAL STATEMENTS MARCH 31, 2013 (UNAUDITED) AND DECEMBER 31, 2012 AND FOR THE THREE-MONTH PERIODS ENDED MARCH 31, 2013 AND 2012 (UNAUDITED) (Continued)
- 18 -
5. CASH ON HAND AND IN BANKS
March 31, 2013(Unaudited) December 31, 2012
Rp Rp
Cash on handRupiah 9,648,641,713 5,449,010,026 U.S. Dollar 126,784,355 95,210,820
Cash in banks - third partiesRupiah
PT Bank Rakyat Indonesia (Persero) Tbk 7,112,160,001 31,570,716,627
PT Bank Rabobank InternationalIndonesia 29,639,016,651 10,623,345,418
PT Bank UOB Indonesia 7,571,266,832 3,398,893,522 The Hongkong and Shanghai Banking
Corporation Limited, Jakarta 3,689,568,291 1,473,923,992 PT Danamon Indonesia Tbk 2,367,065,877 1,537,590,094 Standard Chartered Bank, Jakarta 1,514,333,496 469,419,652 Others (below
Rp 1,000,000,000 each) 1,714,789,787 1,271,589,435 U.S. Dollar
Standard Chartered Bank, Jakarta 8,081,139,250 7,227,300,947 PT Bank Rakyat Indonesia
(Persero) Tbk 3,906,694,045 1,771,779,368 PT Bank UOB Indonesia 3,844,491,764 496,315,168 The Hongkong and Shanghai Banking
Corporation Limited, Jakarta 2,884,213,064 2,943,291,068 PT Bank OCBC NISP Tbk 1,293,502,973 389,414,768 Deutsche Bank A.G., Jakarta 1,125,848,571 381,597,153 Others (below Rp 500,000,000 each) 453,041,271 655,637,991
Japanese YenStandard Chartered Bank, Jakarta 1,449,792,591 194,109,574 The Hongkong and Shanghai Banking
Corporation Limited, Jakarta 186,978,143 202,846,919 Euro
Deutsche Bank A.G., Jakarta 1,180,787,289 381,411,532 The Hongkong and Shanghai Banking
Corporation Limited, Jakarta 391,707,089 2,337,554,269
Total 88,181,823,053 72,870,958,343
All of the above bank accounts are placed with third parties. There are no cash in banks balances placed with related parties.
P.T. FAJAR SURYA WISESA Tbk AND ITS SUBSIDIARY NOTES TO FINANCIAL STATEMENTS MARCH 31, 2013 (UNAUDITED) AND DECEMBER 31, 2012 AND FOR THE THREE-MONTH PERIODS ENDED MARCH 31, 2013 AND 2012 (UNAUDITED) (Continued)
- 19 -
6. TRADE ACCOUNTS RECEIVABLE TO THIRD PARTIES
March 31, 2013(Unaudited) December 31, 2012
Rp Rpa. By Debtor
Local customers 864,654,619,281 845,962,544,283Foreign customers 31,253,174,289 32,659,504,420
Total 895,907,793,570 878,622,048,703
b. By Age CategoryNot yet due 796,719,808,138 692,045,937,155Past due
1 - 30 days 94,713,746,107 170,875,670,63831 - 60 days 3,289,444,256 9,188,992,80461 - 90 days 863,166,619 4,689,718,954More than 90 days 321,628,450 1,821,729,152
Total 895,907,793,570 878,622,048,703
c. By CurrencyRupiah 864,654,619,281 845,962,544,287U.S. Dollar 31,253,174,289 32,659,504,416
Total 895,907,793,570 878,622,048,703
Trade receivables disclosed above include amounts that are past due at the end of the reporting period for which the Company has not recognized any allowance for impairment losses because there has not been a significant change in credit quality and the amounts are still considered recoverable. The Company does not hold any collateral or other credit enhancements over these balances nor does it have a legal right of offset against any amounts owed by the Company to the counterparty. In determining the allowance for doubtful accounts, the Company considers any change in the credit quality of the trade accounts receivable from the date the credit was initially granted until the end of the reporting period. The concentration of credit risk is limited as the customer base is large and unrelated.
7. INVENTORIES March 31, 2013
(Unaudited) December 31, 2012Rp Rp
Finished goods 218,808,912,173 250,750,902,666Work in process 2,836,931,360 4,310,965,819Raw materials 259,973,981,637 217,432,528,844Indirect materials and spare parts 146,399,556,283 143,029,829,694Goods in transit 97,655,160,696 20,849,345,283
Total 725,674,542,149 636,373,572,306
Based on the review of inventories at the end of the period, the Company’s management believes that no allowance for decline in value of inventories is required.
P.T. FAJAR SURYA WISESA Tbk AND ITS SUBSIDIARY NOTES TO FINANCIAL STATEMENTS MARCH 31, 2013 (UNAUDITED) AND DECEMBER 31, 2012 AND FOR THE THREE-MONTH PERIODS ENDED MARCH 31, 2013 AND 2012 (UNAUDITED) (Continued)
- 20 -
Inventories and property, plant and equipment, except land were insured as discussed in Note 11. 8. ADVANCES
March 31, 2013(Unaudited) December 31, 2012
Rp Rp
Advances for spare parts 6,319,103,506 6,627,198,625Advances for import 1,547,826,201 692,025,740Others 1,224,130,994 645,466,393
10. RESTRICTED TIME DEPOSIT On March 31, 2013 and December 31, 2012, restricted time deposit at PT Rabobank International Indonesia in U.S. Dollar with interest rate per annum 2.25% was used as collateral for long-term financial institution loan, Proparco (Note 19).
11. PROPERTY, PLANT AND EQUIPMENT
January 1, 2013 Additions Deduction Reclassifications March 31,2013Rp Rp Rp Rp Rp
Cost:Direct acquisitions
Land 26,990,085,634 100,100,000 - - 27,090,185,634 Buildings and land improvements 375,122,632,443 - - 254,216,428 375,376,848,871 Machineries and equipment 5,257,546,968,431 24,091,046,505 - 3,991,818,494 5,285,629,833,430 Vehicles 44,689,174,472 1,005,790,923 293,360,600 - 45,401,604,795 Furniture, fixtures and equipment 25,594,736,326 310,415,248 - - 25,905,151,574
Construction in progressBuildings and land improvements 698,202,539 171,931,665 - (254,216,428) 615,917,776 Machineries and equipment 157,127,311,093 3,371,261,810 - (3,991,818,494) 156,506,754,409
Assets under finance leaseMachineries and equipment 43,250,002,728 - - - 43,250,002,728 Vehicles 5,510,910,982 - - - 5,510,910,982
Total 5,936,530,024,648 29,050,546,151 293,360,600 - 5,965,287,210,199
Accumulated depreciation:Direct acquisitions
Buildings and land improvements 141,083,938,623 4,364,864,344 - - 145,448,802,967 Machineries and equipment 1,888,410,475,588 47,822,633,464 - - 1,936,233,109,052 Vehicles 27,118,485,566 1,416,427,180 293,360,600 - 28,241,552,146 Furniture, fixtures and equipment 15,879,431,182 750,899,175 - - 16,630,330,357
Assets under finance leaseMachineries and equipment 1,081,250,068 360,416,691 - - 1,441,666,759 Vehicles 1,983,374,468 276,365,190 - - 2,259,739,658
Total 2,075,556,955,495 54,991,606,044 293,360,600 - 2,130,255,200,939
Net book value 3,860,973,069,153 3,835,032,009,260
(Unaudited)
P.T. FAJAR SURYA WISESA Tbk AND ITS SUBSIDIARY NOTES TO FINANCIAL STATEMENTS MARCH 31, 2013 (UNAUDITED) AND DECEMBER 31, 2012 AND FOR THE THREE-MONTH PERIODS ENDED MARCH 31, 2013 AND 2012 (UNAUDITED) (Continued)
- 21 -
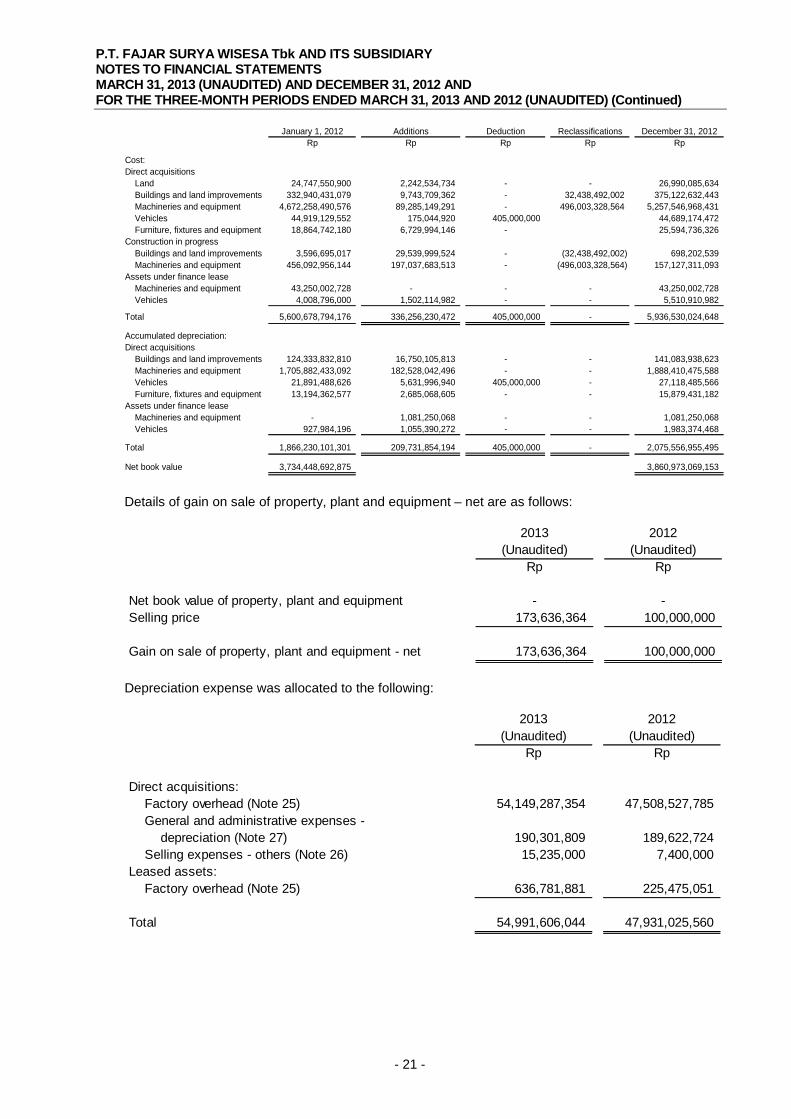
January 1, 2012 Additions Deduction Reclassifications December 31, 2012Rp Rp Rp Rp Rp
Cost:Direct acquisitions
Land 24,747,550,900 2,242,534,734 - - 26,990,085,634 Buildings and land improvements 332,940,431,079 9,743,709,362 - 32,438,492,002 375,122,632,443 Machineries and equipment 4,672,258,490,576 89,285,149,291 - 496,003,328,564 5,257,546,968,431 Vehicles 44,919,129,552 175,044,920 405,000,000 44,689,174,472 Furniture, fixtures and equipment 18,864,742,180 6,729,994,146 - 25,594,736,326
Construction in progressBuildings and land improvements 3,596,695,017 29,539,999,524 - (32,438,492,002) 698,202,539 Machineries and equipment 456,092,956,144 197,037,683,513 - (496,003,328,564) 157,127,311,093
Assets under finance leaseMachineries and equipment 43,250,002,728 - - - 43,250,002,728 Vehicles 4,008,796,000 1,502,114,982 - - 5,510,910,982
Total 5,600,678,794,176 336,256,230,472 405,000,000 - 5,936,530,024,648
Accumulated depreciation:Direct acquisitions
Buildings and land improvements 124,333,832,810 16,750,105,813 - - 141,083,938,623 Machineries and equipment 1,705,882,433,092 182,528,042,496 - - 1,888,410,475,588 Vehicles 21,891,488,626 5,631,996,940 405,000,000 - 27,118,485,566 Furniture, fixtures and equipment 13,194,362,577 2,685,068,605 - - 15,879,431,182
Assets under finance leaseMachineries and equipment - 1,081,250,068 - - 1,081,250,068 Vehicles 927,984,196 1,055,390,272 - - 1,983,374,468
Total 1,866,230,101,301 209,731,854,194 405,000,000 - 2,075,556,955,495
Net book value 3,734,448,692,875 3,860,973,069,153
Details of gain on sale of property, plant and equipment – net are as follows:
2013 2012(Unaudited) (Unaudited)
Rp Rp
Net book value of property, plant and equipment - -Selling price 173,636,364 100,000,000
Gain on sale of property, plant and equipment - net 173,636,364 100,000,000
Depreciation expense was allocated to the following:
2013 2012(Unaudited) (Unaudited)
Rp Rp
Direct acquisitions:Factory overhead (Note 25) 54,149,287,354 47,508,527,785 General and administrative expenses -
P.T. FAJAR SURYA WISESA Tbk AND ITS SUBSIDIARY NOTES TO FINANCIAL STATEMENTS MARCH 31, 2013 (UNAUDITED) AND DECEMBER 31, 2012 AND FOR THE THREE-MONTH PERIODS ENDED MARCH 31, 2013 AND 2012 (UNAUDITED) (Continued)
- 22 -
As of March 31, 2013, construction in progress represents the construction of steam boiler and paper machines, with percentage of completion of 35%. The Company estimated that the construction will be completed between 2013 until 2015. Related to the construction of the steam boiler and the paper machines, the Company also paid advances, which are recorded as advances for purchase of property, plant and equipment (Note 13). Borrowing costs capitalized to construction in progress amounted to Rp 5,660,760,944 in 2012. The average capitalization rate was 1.83% in 2012. The Company owns parcels of land totaling 485,184 m2 located in Cibitung, Bekasi which are covered by the Certificate Right to Build (Hak Guna Bangunan or HGB). HGB will expire between 2013 and 2038. Management believes that there will be no difficulty in obtaining the extension of the legal term of the landrights since all the parcels of land were acquired legally and are supported by sufficient evidence of ownership. All property, plant and equipment, except vehicles, are pledged as collateral for the long-term bank loans and financial institution (Note 19). The Company’s inventories, property, plant and equipment except land, were insured with PT Asuransi Jaya Proteksi, PT Asuransi Indrapura, PT Asuransi Bringin Sejahtera Artamakmur and PT Asuransi Ramayana Tbk for US$ 565,919,900 and Rp 16,370,100,000, respectively, as of March 31, 2013 and US$ 565,919,900 and Rp 16,885,100,000, respectively, as of December 31, 2012. The Company’s management believes that the insurance coverage is adequate to cover loss from fire, natural disasters and other risks. Cost of property, plant and equipment which were fully depreciated but still used by the Company amounted to Rp 50,267,632,565 and Rp 50,266,132,878 on March 31, 2013 and December 31, 2012, respectively. Based on management’s assessment, there are no events or changes in circumstances under which may indicate an impairment in value of property, plant and equipment as of March 31, 2013 and December 31, 2012.
12. INTANGIBLE ASSET-NET Intangible asset is costs incurred for the application of the system which were deferred and an amortized for five years. The gross carrying amount and accumulated amortization of intangible asset amounted to Rp 26,165,607,548 and Rp 3,527,016,376, respectively, as of March 31, 2013 and Rp 25,119,153,586 and Rp 2,253,617,799, respectively as of December 31, 2012. Amortization expense for the three-month period ended March 31, 2013 amounting to Rp 1,273,398,577, was allocated in factory overhead – others (Note 25).
13. ADVANCES FOR PURCHASE OF PROPERY, PLANT AND EQUIPMENT
Advances for purchase of property, plant and equipment are advance payments made for steam boiler construction and paper machines (Note 11).
P.T. FAJAR SURYA WISESA Tbk AND ITS SUBSIDIARY NOTES TO FINANCIAL STATEMENTS MARCH 31, 2013 (UNAUDITED) AND DECEMBER 31, 2012 AND FOR THE THREE-MONTH PERIODS ENDED MARCH 31, 2013 AND 2012 (UNAUDITED) (Continued)
- 23 -
14. BANK LOANS
March 31, 2013(Unaudited) December 31, 2012
Rp RpPT Bank UOB Indonesia
Working Capital LoanRevolving Loan(US$ 15,000,000 on March 31, 2013 and on December 31, 2012) 145,785,000,000 145,050,000,000 Letter of Credit(US$ 2,144,926 on March 31, 2013 and US$ 737,871 on December 31, 2012) 20,846,540,168 7,135,210,636
The Hongkong and Shanghai Banking Corporation Limited, JakartaImport Facilities
(US$ 3,793,958 on March 31, 2013 and US$ 5,423,933 on December 31, 2012) 36,873,481,591 52,449,430,274
Revolving Loan(US$ 5,000,000 on March 31, 2013 and December 31, 2012) 48,595,000,000 48,350,000,000
PT Bank OCBC NISP Tbk Demand Loan
(US$ 5,000,000 on December 31, 2012) - 48,350,000,000 Standard Chartered Bank, Jakarta
Credit Import(US$ 454,000 on March 31, 2013 and US$ 35,000 on December 31, 2012) 4,412,425,999 338,450,000
Total 256,512,447,758 301,673,090,910
Interest rate per annum in the current period 3.55% - 5.00% 2.58% - 5.00%
PT Bank UOB Indonesia (UOB) The Company has obtained several Working Capital credit (KMK) facilities, which include the following: a. Facility A which is a Letter of Credit facility with maximum credit limit amounting to
US$ 25,000,000. b. Facility B which is a Revolving Credit facility with a maximum credit limit amounting to
US$ 15,000,000.
This credit facility bears an interest rate of Libor three months + 2.75% per annum or Bank’s cost of fund + 1.935% per annum, whichever is higher. The working capital credit (KMK) will mature on May 30, 2013. The Hongkong and Shanghai Banking Corporation Limited, Jakarta Import facility with a maximum credit limit of US$ 50,000,000 on March 31, 2013 and December 31, 2012, respectively, or at any equivalent amount in other currencies. In June 5, 2012, the Company obtained revolving loan facility with a maximum credit limit US$ 5,000,000.
P.T. FAJAR SURYA WISESA Tbk AND ITS SUBSIDIARY NOTES TO FINANCIAL STATEMENTS MARCH 31, 2013 (UNAUDITED) AND DECEMBER 31, 2012 AND FOR THE THREE-MONTH PERIODS ENDED MARCH 31, 2013 AND 2012 (UNAUDITED) (Continued)
- 24 -
Both of the above loan facility will mature on May 31, 2013 and bears an interest rate of 7.05% per annum below HSBC’s best lending rate for loan in United States Dollar based on average daily balance of the loan. Based on the loan agreement with HSBC, the Company must obtain a written approval from the bank before executing activities, such as, receiving new loan from another creditor unless related to the normal course of business and securing the assets of the Company to others for any purpose, and fulfill certain requirements. PT Bank OCBC NISP Tbk (OCBC) The Company has obtained several credit facilities, which include the following:
a. The Combine Trade facility is LC Facility with maximum credit limit amounting to US$ 10,000,000. b. The Demand Loan facility with a maximum credit limit amounting to US$ 5,000,000 or equivalent
to Rp 50,000,000,000. c. Overdraft credit facility (KRK) with credit limit amounting to Rp 20,000,000,000. This Combine Trade bears an interest rate of one month LIBOR + 3% per annum, the Demand Loan bears an interest rate of one month LIBOR + 3.25% per annum for currency in USD and 9.75% per annum for currency in Rupiah, and the overdraft credit facility bear with initial interest rate of 10.25% per annum. On March 28, 2013, the Company has paid the demand loan facility. On March 31, 2013, Combine Trade facility and overdraft credit facility have not been utilized. All of the above loan facility will mature on October 31, 2013. Standard Chartered Bank, Jakarta Represents import credit facility with a maximum credit limit of US$ 35,000,000, or at any equivalent amount in other currencies and bears an interest rate of cost of fund + 2.25% for loan in U.S. Dollar and cost of fund + 2% for loan in Rupiah. The loan facility will mature on February 28, 2014.
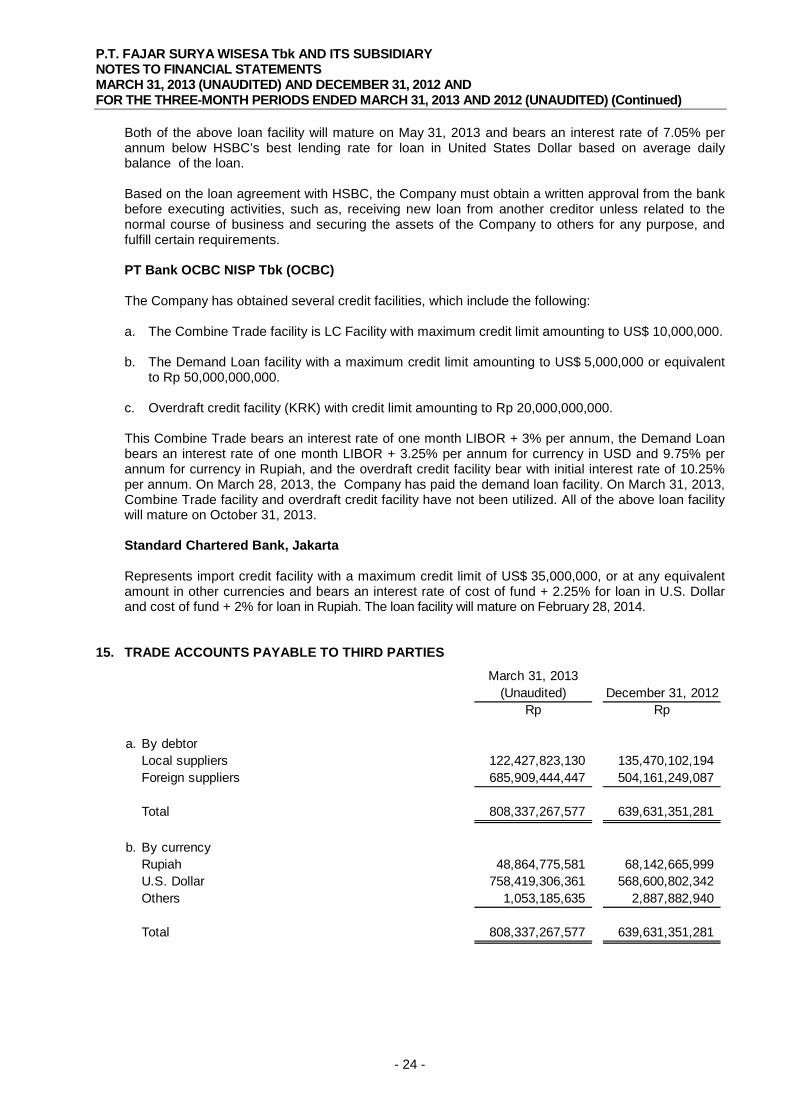
15. TRADE ACCOUNTS PAYABLE TO THIRD PARTIES
March 31, 2013(Unaudited) December 31, 2012
Rp Rp
a. By debtorLocal suppliers 122,427,823,130 135,470,102,194 Foreign suppliers 685,909,444,447 504,161,249,087
Total 808,337,267,577 639,631,351,281
b. By currencyRupiah 48,864,775,581 68,142,665,999U.S. Dollar 758,419,306,361 568,600,802,342Others 1,053,185,635 2,887,882,940
Total 808,337,267,577 639,631,351,281
P.T. FAJAR SURYA WISESA Tbk AND ITS SUBSIDIARY NOTES TO FINANCIAL STATEMENTS MARCH 31, 2013 (UNAUDITED) AND DECEMBER 31, 2012 AND FOR THE THREE-MONTH PERIODS ENDED MARCH 31, 2013 AND 2012 (UNAUDITED) (Continued)
- 25 -
March 31, 2013(Unaudited) December 31, 2012
Rp Rp
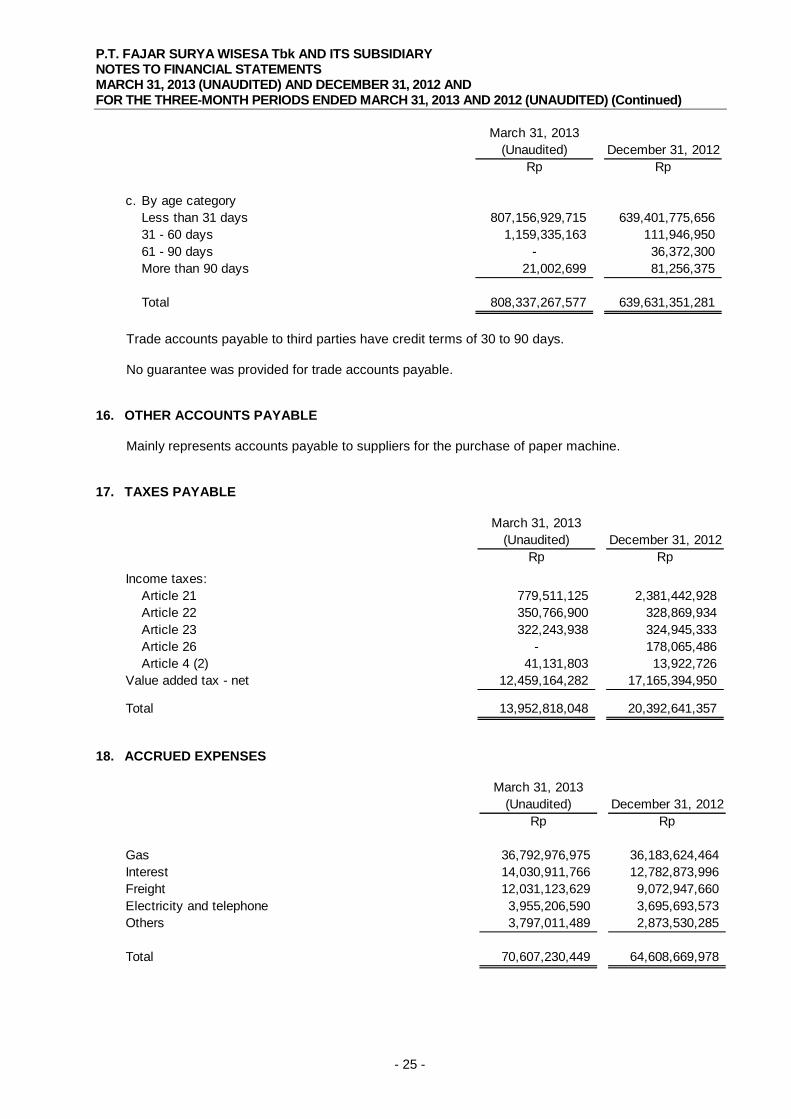
c. By age categoryLess than 31 days 807,156,929,715 639,401,775,65631 - 60 days 1,159,335,163 111,946,95061 - 90 days - 36,372,300More than 90 days 21,002,699 81,256,375
Total 808,337,267,577 639,631,351,281
Trade accounts payable to third parties have credit terms of 30 to 90 days. No guarantee was provided for trade accounts payable.
16. OTHER ACCOUNTS PAYABLE Mainly represents accounts payable to suppliers for the purchase of paper machine.
Value added tax - net 12,459,164,282 17,165,394,950
Total 13,952,818,048 20,392,641,357
18. ACCRUED EXPENSES
March 31, 2013(Unaudited) December 31, 2012
Rp Rp
Gas 36,792,976,975 36,183,624,464 Interest 14,030,911,766 12,782,873,996 Freight 12,031,123,629 9,072,947,660 Electricity and telephone 3,955,206,590 3,695,693,573 Others 3,797,011,489 2,873,530,285
Total 70,607,230,449 64,608,669,978
P.T. FAJAR SURYA WISESA Tbk AND ITS SUBSIDIARY NOTES TO FINANCIAL STATEMENTS MARCH 31, 2013 (UNAUDITED) AND DECEMBER 31, 2012 AND FOR THE THREE-MONTH PERIODS ENDED MARCH 31, 2013 AND 2012 (UNAUDITED) (Continued)
- 26 -
19. LONG-TERM BANK LOANS AND FINANCIAL INSTITUTION
March 31, 2013(Unaudited) December 31, 2012
Rp Rp
Syndicated loan (Club Deal)(US$ 108,750,000 on March 31, 2013 and US$ 112,500,000 on December 31, 2012 - net of unamortized transaction cost) 1,039,690,609,436 1,068,633,838,679
PT Bank Rakyat Indonesia (Persero) TbkRevolving loan - Tranche A 192,735,760,333 192,957,123,090 Working capital loan - Valas
(US$ 17,698,769 on March 31, 2013 and US$ 17,005,772 on December 31, 2012) 172,014,335,911 164,445,815,238
Working capital loan - Rupiah 41,494,045,558 49,828,419,594 Revolving loan - Tranche D 19,494,905,458 19,660,077,445
Syndicated loan(US$ 33,031,680 on March 31, 2013 and US$ 39,588,240 on December 31, 2012) 321,034,897,920 382,818,280,800
HSBC Bank Australia Limited(US$ 15,370,867 on March 31, 2013 and December 31, 2012) 149,389,455,790 148,636,283,309
The Hongkong and Shanghai Banking Corporation Limited
(US$ 10,945,661 on March 31, 2013 and December 31, 2012) 106,380,877,899 105,844,540,517
Societe de Promotion Et de Participation Pour La Cooperation Economique (Proparco)
(US$ 9,285,714 on March 31, 2013 and December 31, 2012) 90,247,857,185 89,792,857,184
Total 2,132,482,745,490 2,222,617,235,856
Less: amount due in 12 months(presented as current liabilities) (556,444,767,302) (1,795,725,800,489)
Long-term loans 1,576,037,978,188 426,891,435,367
Interest rate per annum during the periodU.S. Dollar 1.98% - 5.00% 1.60% - 5.00%Rupiah 9.00% 9.00%
P.T. FAJAR SURYA WISESA Tbk AND ITS SUBSIDIARY NOTES TO FINANCIAL STATEMENTS MARCH 31, 2013 (UNAUDITED) AND DECEMBER 31, 2012 AND FOR THE THREE-MONTH PERIODS ENDED MARCH 31, 2013 AND 2012 (UNAUDITED) (Continued)
- 27 -
The bank loans are payable based on the following schedule:
March 31, 2013(Unaudited) December 31, 2012
Rp Rp
Due in One year 563,792,483,891 606,220,712,900 The second year 723,166,008,909 710,731,368,144 The third year 313,220,336,650 310,432,432,777 The forth year 372,749,211,650 438,559,932,777 The fifth year 42,303,211,650 42,089,932,777 More than five years 134,502,133,303 133,824,017,802
Total 2,149,733,386,053 2,241,858,397,177 Unamortized transaction costs (17,250,640,563) (19,241,161,321)
Net 2,132,482,745,490 2,222,617,235,856
In 2012, the Company failed to meet the financial ratio required in agreement for syndicated, HSBC Bank Australia Limited, The Hongkong and Shanghai Banking Corporation Limited and Proparco, which is to maintain a ratio of total debt to EBITDA of not more than 3.5:1 and ratio of total debt to equity of not more than 1.25:1 (for Proparco only), therefore all loans are reclassified to current liabilities in accordance with PSAK 1, Presentation of Financial Statements.
On February 2013, the Company have received waivers from Syndicated, HSBC Bank Australia Limited, The Hongkong and Shanghai Banking Corporation Limited and Proparco for the breach of covenants, so the Company reclassified all loans from current liabilities to noncurrent liabilities. Syndicated Loan (Club Deal) On October 22, 2010, the Company signed a US$ 120,000,000 credit facility with local and international bank syndicate. The syndicated loan facility was arranged by The Hongkong and Shanghai Banking Corporation Limited (HSBC), Bank UOB Buana and Oversea-Chinese Banking Corporation (OCBC), that will be used to repay the bonds payable (“Notes”) and working capital. The loan has a term of 5 years and the repayment is scheduled into 16 quarterly installment payments starting after 15 months from the first utilization. The loan bears annual interest rate at 3% - 3.25% above London Interbank Offered Rate (LIBOR). Interest is payable quarterly starting on April 7, 2011. This loan is secured with fiducia in security over machines owned by the Company, Cogen 2 and PM7 including the insurance, lands owned by the Company with Right to Build Certificate No. 533/Harja Mekar with an area of 40,958 m2 and HGB No. 35/Kalijaya with an area of 1,523 m2. Except for Cogen 2 machine, all assets mentioned above are pledged in pari passu. The term of the facility agreement contains certain financial covenants, such as the requirement to maintain certain financial ratios, perform merger, limitation on sale of assets, pledge its asset to other similar loan or obtaining additional similar loan. PT Bank Rakyat Indonesia (Persero) Tbk (BRI) The Company have obtained several credit facilities which include the following: a. Revolving loan facilities, Tranche A, consists of Import Working Capital Credit (KMKI) with
maximum credits limit of Rp 226,577,500,000 in 2013 and 2012 and Stand By Letter of Credit (L/C) amounting to US$ 10,000,000 in 2013 and 2012. The loan bears annual interest rate of 9% which can be reviewed every month.
P.T. FAJAR SURYA WISESA Tbk AND ITS SUBSIDIARY NOTES TO FINANCIAL STATEMENTS MARCH 31, 2013 (UNAUDITED) AND DECEMBER 31, 2012 AND FOR THE THREE-MONTH PERIODS ENDED MARCH 31, 2013 AND 2012 (UNAUDITED) (Continued)
- 28 -
b. Working capital credit facility consists of working capital in Rupiah with a maximum credit limit of Rp 64,435,000,000 and working capital in foreign currency with maximum credits limit amounting to US$ 40,000,000 in 2013 and 2012, respectively. The loan bears annual interest rate of 9% and 5%, for KMK Rupiah and KMK in foreign currency, respectively, and which can be reviewed every month.
c. Revolving loan facilities, Tranche D, consists of Working Capital Credit (KMK) with maximum
credits limit amounting to Rp 20,942,560,000 in 2013 and 2012, respectively. The loan bears annual interest rate of 9%, which can be reviewed every month.
The revolving loan and working capital loan will mature on January 1, 2014. The loans from BRI are collateralized by the Company’s Certificate of Right to Build (HGB) No. 3/Kalijaya with an area of 130,638 m2, including the building thereon of PM1 and PM2, machineries and equipment, furniture and fixtures with the fiduciary rights over machineries and equipment of PM1 and PM2 and all the rights and interest arising from the Company’s policies and contracts of insurance and reinsurance. The loan agreement with BRI includes certain covenants that limit the Company’s right to modify its Articles of Association except for addition in paid-up capital, to make changes in legal status, to pay dividends beyond its dividend policy stated in the prospectus, to invest in another company, to grant loans to shareholder by any means, and to sell and transfer the Company’s assets to others. Syndicated Loan On October 20, 2008, the Company signed a US$ 70,000,000 loan agreement with a syndicate of local and international banks to finance the construction of a new paper machine. The syndicated term loan facility is arranged by The Hongkong and Shanghai Banking Corporation Limited (HSBC) and United Overseas Bank Limited (UOB). The syndicate of Banks is comprised of the following, Coordinating Arrangers HSBC, UOB, and PT Bank Rakyat Indonesia (Persero) Tbk. PT Bank Mandiri (Persero) Tbk, and Singapore Branch, as the lead manager. The loan has a term of 5 years and the repayment is scheduled into 12 quarterly installment payments, starting from the 27th month after the facility is obtained. The loan bears annual interest rate at 3% - 3.5% above LIBOR. The term of the facility agreement contains certain covenants, among other things, the requirement to maintain certain financial ratios, limitation on sale of assets, perform merger, payment of subordinated loans, payment of dividends and obtaining additional new loan. This syndicated loan is secured by PM5 (machine own by the Company), Grant Security Right over Land with the Build Certificate No. 588/Harja Mekar, land title certificate over Harja Mekar land with an area of 16,421 m2 and fiducia security over PM5 insurances. HSBC Bank Australia Limited In May 2011, the Company signed a term loan agreement with a principal amount in US$ equivalent of EUR 12,580,000 with the HSBC Bank Australia Limited which will be used for modification of PM7. The loan has a term of 10 years and the repayment is scheduled into 20 semi-annual installment payments, starting on June 30, 2012. The loan bears annual interest rate at 6 month LIBOR + 1.25%. As of March 31, 2013, the Company has withdrawn the whole facility from the HSBC Bank Australia Limited. The term of the facility agreement contains certain financial covenants, such as the requirement to maintain certain financial ratios, and limitation on sale of assets, pledge asset to other similar loan or obtaining additional new loan. This loan is secured with fiducia in pari passu security over PM7 (machine owned by the Company), fiducia security over PM7 insurances, and the Grant Security Right over land with Certificate Right to Build No. 533/Harja Mekar, covering an area of 40,958 m2 located in Desa Harja Mekar, Cikarang Utara, Bekasi where PM7 operates.
P.T. FAJAR SURYA WISESA Tbk AND ITS SUBSIDIARY NOTES TO FINANCIAL STATEMENTS MARCH 31, 2013 (UNAUDITED) AND DECEMBER 31, 2012 AND FOR THE THREE-MONTH PERIODS ENDED MARCH 31, 2013 AND 2012 (UNAUDITED) (Continued)
- 29 -
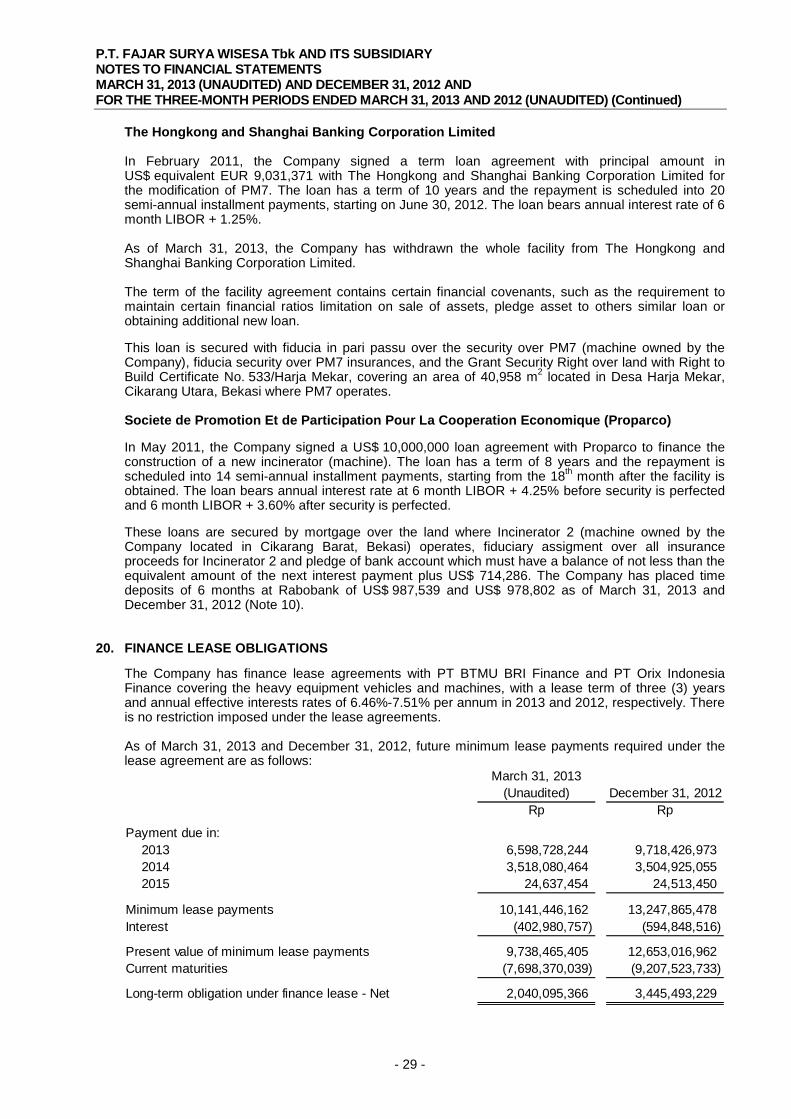
The Hongkong and Shanghai Banking Corporation Limited In February 2011, the Company signed a term loan agreement with principal amount in US$ equivalent EUR 9,031,371 with The Hongkong and Shanghai Banking Corporation Limited for the modification of PM7. The loan has a term of 10 years and the repayment is scheduled into 20 semi-annual installment payments, starting on June 30, 2012. The loan bears annual interest rate of 6 month LIBOR + 1.25%. As of March 31, 2013, the Company has withdrawn the whole facility from The Hongkong and Shanghai Banking Corporation Limited. The term of the facility agreement contains certain financial covenants, such as the requirement to maintain certain financial ratios limitation on sale of assets, pledge asset to others similar loan or obtaining additional new loan. This loan is secured with fiducia in pari passu over the security over PM7 (machine owned by the Company), fiducia security over PM7 insurances, and the Grant Security Right over land with Right to Build Certificate No. 533/Harja Mekar, covering an area of 40,958 m2 located in Desa Harja Mekar, Cikarang Utara, Bekasi where PM7 operates. Societe de Promotion Et de Participation Pour La Cooperation Economique (Proparco) In May 2011, the Company signed a US$ 10,000,000 loan agreement with Proparco to finance the construction of a new incinerator (machine). The loan has a term of 8 years and the repayment is scheduled into 14 semi-annual installment payments, starting from the 18th month after the facility is obtained. The loan bears annual interest rate at 6 month LIBOR + 4.25% before security is perfected and 6 month LIBOR + 3.60% after security is perfected. These loans are secured by mortgage over the land where Incinerator 2 (machine owned by the Company located in Cikarang Barat, Bekasi) operates, fiduciary assigment over all insurance proceeds for Incinerator 2 and pledge of bank account which must have a balance of not less than the equivalent amount of the next interest payment plus US$ 714,286. The Company has placed time deposits of 6 months at Rabobank of US$ 987,539 and US$ 978,802 as of March 31, 2013 and December 31, 2012 (Note 10).
20. FINANCE LEASE OBLIGATIONS
The Company has finance lease agreements with PT BTMU BRI Finance and PT Orix Indonesia Finance covering the heavy equipment vehicles and machines, with a lease term of three (3) years and annual effective interests rates of 6.46%-7.51% per annum in 2013 and 2012, respectively. There is no restriction imposed under the lease agreements. As of March 31, 2013 and December 31, 2012, future minimum lease payments required under the lease agreement are as follows:
Present value of minimum lease payments 9,738,465,405 12,653,016,962 Current maturities (7,698,370,039) (9,207,523,733)
Long-term obligation under finance lease - Net 2,040,095,366 3,445,493,229
P.T. FAJAR SURYA WISESA Tbk AND ITS SUBSIDIARY NOTES TO FINANCIAL STATEMENTS MARCH 31, 2013 (UNAUDITED) AND DECEMBER 31, 2012 AND FOR THE THREE-MONTH PERIODS ENDED MARCH 31, 2013 AND 2012 (UNAUDITED) (Continued)
- 30 -
21. POST–EMPLOYMENT BENEFITS OBLIGATION The Company calculates and records estimated post-employment benefits obligation for its eligible employees based on the Collective Labour Agreement and with Labor Law No. 13/2003. The number of employees entitled to the benefits are 2,500 and 2,512 on March 31, 2013 and December 31, 2012. Amounts recognized in the statements of comprehensive income with respect to these post-employment benefits are as follows:
2013 2012(Unaudited) (Unaudited)
Rp Rp
Current service cost 2,754,784,115 2,033,057,438Interest cost 1,416,247,228 1,226,849,245Actuarial gain 358,762,307 94,830,563Past service cost 122,800,082 122,800,082
Total 4,652,593,732 3,477,537,328
For the three-month period ended March 31, 2013 and 2012, Rp 1,911,747,880 and Rp 1,968,552,892, respectively, was included in factory overhead and the remainder in general and administrative expenses and the selling expenses. The amounts included in the consolidated statements of financial position arising from the Company’s obligation in respect of these post-employment benefits are as follows:
March 31, 2013
(Unaudited) December 31, 2012Rp Rp
Present value of unfunded obligation 112,360,300,063 106,082,409,510Unrecognized past service cost (4,781,781,952) (4,904,582,034)Unrecognized actuarial loss (28,765,052,064) (26,035,020,161)
Net Liability 78,813,466,047 75,142,807,315
Movements in the present value of unfunded obligation in the current period are as follows:
P.T. FAJAR SURYA WISESA Tbk AND ITS SUBSIDIARY NOTES TO FINANCIAL STATEMENTS MARCH 31, 2013 (UNAUDITED) AND DECEMBER 31, 2012 AND FOR THE THREE-MONTH PERIODS ENDED MARCH 31, 2013 AND 2012 (UNAUDITED) (Continued)
- 31 -
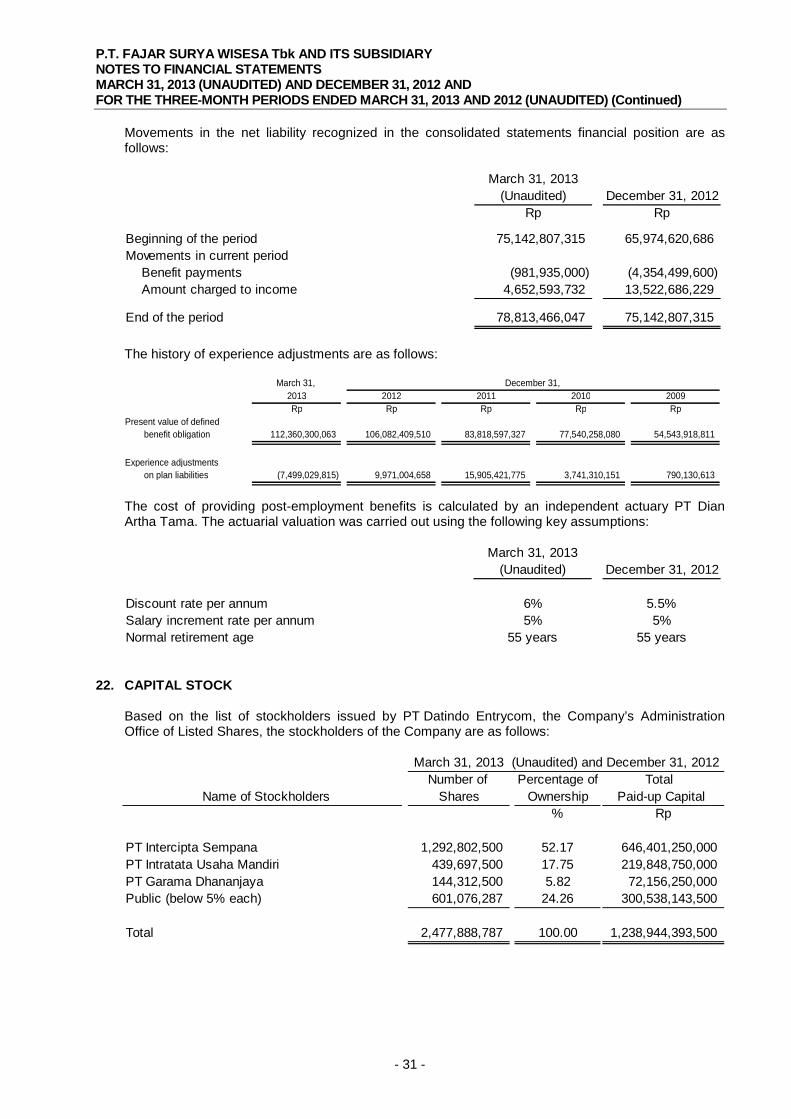
Movements in the net liability recognized in the consolidated statements financial position are as follows:
March 31, 2013
(Unaudited) December 31, 2012Rp Rp
Beginning of the period 75,142,807,315 65,974,620,686Movements in current period
Benefit payments (981,935,000) (4,354,499,600)Amount charged to income 4,652,593,732 13,522,686,229
End of the period 78,813,466,047 75,142,807,315
The history of experience adjustments are as follows:
March 31, 2013 2012 2011 2010 2009Rp Rp Rp Rp Rp
Present value of defined benefit obligation 112,360,300,063 106,082,409,510 83,818,597,327 77,540,258,080 54,543,918,811
Experience adjustments on plan liabilities (7,499,029,815) 9,971,004,658 15,905,421,775 3,741,310,151 790,130,613
December 31,
The cost of providing post-employment benefits is calculated by an independent actuary PT Dian Artha Tama. The actuarial valuation was carried out using the following key assumptions:
March 31, 2013(Unaudited) December 31, 2012
Discount rate per annum 6% 5.5%Salary increment rate per annum 5% 5%Normal retirement age 55 years 55 years
22. CAPITAL STOCK
Based on the list of stockholders issued by PT Datindo Entrycom, the Company’s Administration Office of Listed Shares, the stockholders of the Company are as follows:
Number of Percentage of Total Name of Stockholders Shares Ownership Paid-up Capital
P.T. FAJAR SURYA WISESA Tbk AND ITS SUBSIDIARY NOTES TO FINANCIAL STATEMENTS MARCH 31, 2013 (UNAUDITED) AND DECEMBER 31, 2012 AND FOR THE THREE-MONTH PERIODS ENDED MARCH 31, 2013 AND 2012 (UNAUDITED) (Continued)
- 32 -
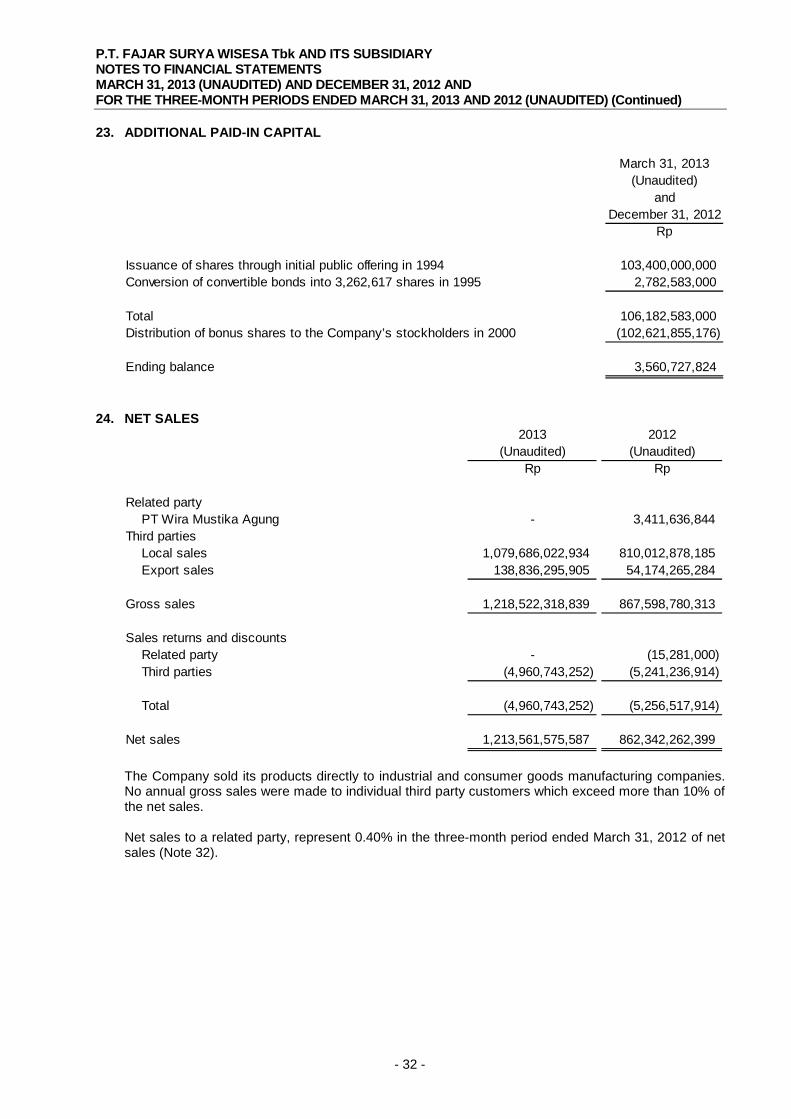
23. ADDITIONAL PAID-IN CAPITAL
March 31, 2013(Unaudited)
andDecember 31, 2012
Rp
Issuance of shares through initial public offering in 1994 103,400,000,000Conversion of convertible bonds into 3,262,617 shares in 1995 2,782,583,000
Total 106,182,583,000Distribution of bonus shares to the Company’s stockholders in 2000 (102,621,855,176)
Ending balance 3,560,727,824
24. NET SALES 2013 2012
(Unaudited) (Unaudited)Rp Rp
Related party PT Wira Mustika Agung - 3,411,636,844
Third partiesLocal sales 1,079,686,022,934 810,012,878,185 Export sales 138,836,295,905 54,174,265,284
Gross sales 1,218,522,318,839 867,598,780,313
Sales returns and discountsRelated party - (15,281,000) Third parties (4,960,743,252) (5,241,236,914)
Total (4,960,743,252) (5,256,517,914)
Net sales 1,213,561,575,587 862,342,262,399
The Company sold its products directly to industrial and consumer goods manufacturing companies. No annual gross sales were made to individual third party customers which exceed more than 10% of the net sales. Net sales to a related party, represent 0.40% in the three-month period ended March 31, 2012 of net sales (Note 32).
P.T. FAJAR SURYA WISESA Tbk AND ITS SUBSIDIARY NOTES TO FINANCIAL STATEMENTS MARCH 31, 2013 (UNAUDITED) AND DECEMBER 31, 2012 AND FOR THE THREE-MONTH PERIODS ENDED MARCH 31, 2013 AND 2012 (UNAUDITED) (Continued)
- 33 -
25. COST OF GOODS SOLD 2013 2012
(Unaudited) (Unaudited)Rp Rp
Raw materialsAt beginning of period 217,432,528,844 253,028,359,543 Purchases 775,822,193,209 480,084,612,303 At end of period (259,973,981,637) (248,297,811,420)
Raw materials used 733,280,740,416 484,815,160,426
Direct labor 13,478,126,731 15,016,876,608
Factory overheadElectricity, gas and water 133,543,793,871 90,494,230,948 Depreciation (Note 11) 54,786,069,235 47,734,030,511 Indirect labor 25,015,824,401 19,061,946,543 Repairs and maintenance 6,101,585,574 7,413,404,865 Others 25,387,933,972 19,692,039,372
Total factory overhead 244,835,207,053 184,395,652,239
Total manufacturing cost 991,594,074,200 684,227,689,273
Work in processAt beginning of period 4,310,965,819 462,119,034 At end of period (2,836,931,360) (2,902,186,361)
Cost of goods manufactured 993,068,108,659 681,787,621,946
Finished goodsAt beginning of period 250,750,902,666 214,807,704,601 At end of period (218,808,912,173) (123,104,057,169)
Cost of goods sold 1,025,010,099,152 773,491,269,378
No annual purchases from any of the individual third party suppliers exceed more than 10% of the sales.
P.T. FAJAR SURYA WISESA Tbk AND ITS SUBSIDIARY NOTES TO FINANCIAL STATEMENTS MARCH 31, 2013 (UNAUDITED) AND DECEMBER 31, 2012 AND FOR THE THREE-MONTH PERIODS ENDED MARCH 31, 2013 AND 2012 (UNAUDITED) (Continued)
- 34 -
27. GENERAL AND ADMINISTRATIVE EXPENSES
2013 2012(Unaudited) (Unaudited)
Rp Rp
Salaries and employees’ benefits 12,037,677,253 9,315,763,788 Rents 1,128,611,106 1,064,860,610 Profesional fee 339,825,470 356,354,985 Representation and donation 201,596,600 754,606,000 Depreciation (Note 11) 190,301,809 189,622,724 Repairs and maintenance 99,167,454 66,842,757 Tax and permit 251,766 1,459,756 Others 871,050,778 769,873,457
Current tax 2,930,898,180 -Deferred tax 20,710,533,142 2,178,586,431
Total Tax Expense 23,641,431,322 2,178,586,431
P.T. FAJAR SURYA WISESA Tbk AND ITS SUBSIDIARY NOTES TO FINANCIAL STATEMENTS MARCH 31, 2013 (UNAUDITED) AND DECEMBER 31, 2012 AND FOR THE THREE-MONTH PERIODS ENDED MARCH 31, 2013 AND 2012 (UNAUDITED) (Continued)
- 35 -
Current tax A reconciliation between income before tax per consolidated statements of comprehensive income and taxable income is as follows:
2013 2012
(Unaudited) (Unaudited)Rp Rp
Income before tax per consolidated statements of comprehensive income 90,944,090,906 4,236,625,756
Income before tax of subsidiary - -
Income before tax - the Company 90,944,090,906 4,236,625,756
and fiscal depreciation (43,301,553,112) (6,987,920,250) Finance lease (2,277,769,676) (5,304,968,022) Difference between commercial
and fiscal amortization (1,235,757,819) -
Total (40,533,957,291) (11,571,689,538)
Permanent differences:Staff welfare 3,460,327,970 3,712,564,205 Representation and donation expenses 436,766,566 989,521,200 Difference between commercial and fiscal depreciation 95,300,000 94,208,924 Interest income already subjected to final tax (370,760,163) (318,574,367)
Total 3,621,634,373 4,477,719,962
Taxable fiscal income before fiscal loss carryforward 54,031,767,988 (2,857,343,820) Uncompensated prior year fiscal loss carryforward (42,308,175,270) -
Taxable income (loss) of the Company 11,723,592,718 (2,857,343,820)
Current tax expense and payable of the Company are computed as follows:
2013 2012
(Unaudited) (Unaudited)Rp Rp
Current tax expense 2,930,898,180 -
Less: Prepayment of income taxes - Article 22 12,047,149,017 3,414,738,483
Prepaid tax - The Company (Notes 9) (9,116,250,837) (3,414,738,483)
Fiscal loss and prepaid tax of the Company for 2012 are in accordance with the corporate tax returns filed with the Tax Service Office.
P.T. FAJAR SURYA WISESA Tbk AND ITS SUBSIDIARY NOTES TO FINANCIAL STATEMENTS MARCH 31, 2013 (UNAUDITED) AND DECEMBER 31, 2012 AND FOR THE THREE-MONTH PERIODS ENDED MARCH 31, 2013 AND 2012 (UNAUDITED) (Continued)
- 36 -
Deferred Tax The details of the Company’s deferred tax liabilities are as follows:
Credited (charged) Credited (charged) to income for to income for
January 1, 2012 the year December 31, 2012 the period March 31, 2013Rp Rp Rp Rp Rp
Deferred tax liabilities - net (372,609,115,123) (5,737,018,632) (378,346,133,755) (20,710,533,142) (399,056,666,897)
A reconciliation between the total tax expense and the amounts computed by applying the effective rate to income before tax is as follows:
2013 2012
(Unaudited) (Unaudited)Rp Rp
Income before tax per consolidated statements of comprehensive income 90,944,090,906 4,236,625,756
Income before tax of subsidiary - -
Income before tax - the Company 90,944,090,906 4,236,625,756
Tax at effective tax rates 22,736,022,727 1,059,156,439
Tax effect of permanent differences 905,408,595 1,119,429,992
Total Tax Expense - The Company 23,641,431,322 2,178,586,431
30. BASIC EARNINGS PER SHARE
The computation of basic earnings per share is based on the following data:
2013 2012(Unaudited) (Unaudited)
Rp RpEarningsEarnings for computation of
basic earnings per share 67,302,659,584 2,058,039,325
Number of sharesShares Shares
Weighted average number of shares 2,477,888,787 2,477,888,787
As of the consolidated statement of financial position date, the Company does not have potentially dilutive shares.
P.T. FAJAR SURYA WISESA Tbk AND ITS SUBSIDIARY NOTES TO FINANCIAL STATEMENTS MARCH 31, 2013 (UNAUDITED) AND DECEMBER 31, 2012 AND FOR THE THREE-MONTH PERIODS ENDED MARCH 31, 2013 AND 2012 (UNAUDITED) (Continued)
- 37 -
31. SUPPLEMENTAL DISCLOSURES ON NONCASH INVESTING AND FINANCING ACTIVITIES In 2013 and 2012, the Company and its subsidiary performed investment transactions and financing activities not affecting cash on hand and in banks and are not included in the consolidated cash flow statement, with the following details :
2013 2012(Unaudited) (Unaudited)
Rp Rp
Purchase of inventories through bank loans 59,950,826,981 38,321,641,474
Reclassification of advances for purchase property, plant and equipment to property, plant and equipment 114,545,454 47,583,799,818
Acquisition of property, plant and equipment under finance lease obligations - 1,502,114,982
Property, plant and equipment addition from capitalization of borrowing costs - 5,660,760,944
Reclassification of advances for purchase property, plant and equipment to intangible aset - 10,618,576,000
32. NATURE OF RELATIONSHIP AND TRANSACTIONS WITH RELATED PARTIES
Nature of Relationship a. PT Intercipta Sempana is the majority shareholder. b. PT Wira Mustika Agung is an entity that is controlled by a key management personnel of the
Company. c. Lila Notopradono is a commissioner of the Company.
Transactions with Related Parties In the normal course of business, the Company and its subsidiary entered into certain transactions with related parties as follows: a. The Company provides short-term benefits to the Commissioners and Directors of the Company
P.T. FAJAR SURYA WISESA Tbk AND ITS SUBSIDIARY NOTES TO FINANCIAL STATEMENTS MARCH 31, 2013 (UNAUDITED) AND DECEMBER 31, 2012 AND FOR THE THREE-MONTH PERIODS ENDED MARCH 31, 2013 AND 2012 (UNAUDITED) (Continued)
- 38 -
b. The Company has appointed PT Wira Mustika Agung as a distributor of the Company's products. Net sales to PT Wira Mustika Agung represent 0.40% of the Company’s net sales for three-month period ended March 31, 2012.
c. The Company entered into a land and building rental agreement with Lila Notopradono, a
commissioner of the Company, with a total annual rent of US$ 472,222, which is recorded as rent expense under General and Administrative Expense.
33. SEGMENT INFORMATION
The Company does not present business segment information since it only has one business segment, packaging paper. Therefore, the Company presented by geographical information (sales according to location of customers) as follows:
2013 2012(Unaudited) (Unaudited)
Rp Rp
Indonesia 1,074,734,385,813 808,167,997,115 Middle East 26,919,486,382 15,198,758,781 Other part of Asia 111,018,300,724 38,975,506,503 Others 889,402,668 -
Total 1,213,561,575,587 862,342,262,399
All of the Company’s noncurrent assets consist of property, plant and equipment, intangible assets and guarantee deposits located in Indonesia.
34. COMMITMENTS
a. Unused credit facilities
The Company has unused short-term and long-term credit facilities from several banks, equivalent to US$ 94,926,041 as of March 31, 2013 and US$ 107,056,243 as of December 31, 2012.
b. Derivative contracts
The estimated fair values of the Company’s derivative instruments are summarized below:
Total Fair Total Fairnotional value notional value
Presented on statement of financialposition as:Current liabilities 29,145,600 2,022,713,129 34,930,800 3,032,956,820Noncurrent liabilities 27,187,500 7,268,916,103 28,125,000 8,198,922,241
Total 9,291,629,232 11,231,879,061
(Unaudited) December 31, 2012March 31, 2013
P.T. FAJAR SURYA WISESA Tbk AND ITS SUBSIDIARY NOTES TO FINANCIAL STATEMENTS MARCH 31, 2013 (UNAUDITED) AND DECEMBER 31, 2012 AND FOR THE THREE-MONTH PERIODS ENDED MARCH 31, 2013 AND 2012 (UNAUDITED) (Continued)
- 39 -
Interest Rate Swaps In 2013 and 2012, the Company entered into several interest rate swap agreements to anticipate the Company’s risk on the fluctuation of interest rates on certain bank loan facilties. According to the agreements, the Company pays quarterly fixed interest to the Banks, at the same time, the Banks will pay quarterly interest at LIBOR US$ floating rate.
Contract Termination Annual fixed Annual fixedBank date date Notional Marked to market interest Notional Marked to market interest
US$ Rp US$ Rp
Standard Chartered Bank, Jakarta February 5, November 22, 4,857,600 (472,012,954) 1.98% 5,821,800 (703,115,370) 1.98%2010 2013
The Hongkong and Shanghai February 19, November 22, 4,857,600 (497,111,980) 2.08% 5,821,800 (745,498,980) 2.08%Bank Corporation Limited, 2010 2013Jakarta
PT Bank UOB Indonesia February 8, November 22, 2,428,800 (227,813,360) 1.93% 2,910,900 (343,488,070) 1.93%2010 2013
February 11, November 22, 2,428,800 (240,554,969) 2.02% 2,910,900 (361,367,900) 2.02%2010 2013
September 8, November 22, 4,857,600 (192,241,820) 1.00% 5,821,800 (289,016,960) 1.00%2010 2013
September 14, November 22, 7,286,400 (309,598,745) 1.05% 8,732,700 (465,185,020) 1.05%2010 2013
September 22, November 22, 2,428,800 (83,379,301) 0.91% 2,910,900 (125,284,520) 0.91%2010 2013
May 16, April 7, 13,593,750 (3,617,440,957) 1.68% 14,062,500 (4,087,180,221) 1.68%2011 2016
Morgan Stanley May 16, April 7, 13,593,750 (3,651,475,146) 1.69% 14,062,500 (4,111,742,020) 1.69%
2011 2016
Total 56,333,100 (9,291,629,232) 63,055,800 (11,231,879,061)
December 31, 2012(Unaudited)March 31, 2013
35. MONETARY ASSETS AND LIABILITIES DENOMINATED IN FOREIGN CURRENCIES
As of March 31, 2013 and December 31, 2012, the Company and its subsidiary had monetary assets and liabilities in foreign currencies as follows:
Foreign Equivalent in Foreign Equivalent incurrencies Rp currencies Rp
AssetsCash on hand and in banks USD 2,234,357 21,715,715,293 1,443,697 13,960,547,283
Restricted time deposit USD 987,539 9,597,887,265 978,802 9,465,012,923
Total assets 65,777,985,759 59,229,701,199
(Unaudited) December 31, 2012March 31, 2013
P.T. FAJAR SURYA WISESA Tbk AND ITS SUBSIDIARY NOTES TO FINANCIAL STATEMENTS MARCH 31, 2013 (UNAUDITED) AND DECEMBER 31, 2012 AND FOR THE THREE-MONTH PERIODS ENDED MARCH 31, 2013 AND 2012 (UNAUDITED) (Continued)
- 40 -
Foreign Equivalent in Foreign Equivalent incurrencies Rp currencies Rp
LiabilitiesBank loans USD 26,392,885 256,512,447,758 31,196,804 301,673,090,910Trade accounts payable to
Long-term bank loans and f inancial institution USD 193,180,327 1,877,519,598,989 202,706,475 1,960,171,615,727
Obligation under f inance lease USD 1,002,003 9,738,465,405 1,308,482 12,653,016,962Derivative f inancial instruments USD 956,027 9,291,629,232 1,161,518 11,231,879,061
Total liabilities 2,985,699,913,968 2,939,934,037,008
Total Liabilities - net (2,919,921,928,209) (2,880,704,335,809)
(Unaudited) December 31, 2012March 31, 2013
The conversion rates used by the Company and its subsidiary on March 31, 2013 and December 31, 2012 were as follows: Foreign currency March 31, 2013 December 31, 2012
P.T. FAJAR SURYA WISESA Tbk AND ITS SUBSIDIARY NOTES TO FINANCIAL STATEMENTS MARCH 31, 2013 (UNAUDITED) AND DECEMBER 31, 2012 AND FOR THE THREE-MONTH PERIODS ENDED MARCH 31, 2013 AND 2012 (UNAUDITED) (Continued)
- 41 -
36. CATEGORIES AND CLASSES OF FINANCIAL INSTRUMENTS
Liabilties atLiabilities at fair value
Loans and amortized through profit receivables cost or loss Total
Rp Rp Rp Rp March 31, 2013
ASSETS
CURRENT ASSETSCash and cash equivalents 88,181,823,053 - - 88,181,823,053 Trade accounts receivable to third parties 895,907,793,570 - - 895,907,793,570 Other accounts receivable 2,436,732,422 - 2,436,732,422
TOTAL 1,000,142,711,310 3,308,335,063,670 9,291,629,232 4,317,769,404,212
The Company does not hold financial assets categorized as Fair Value Through Profit or Loss (FVTPL), held to maturity and available-for-sale.
37. FINANCIAL INSTRUMENTS, FINANCIAL RISK AND CAPITAL RISK MANAGEMENT
a. Capital Risk Management
The Company manages capital risk to ensure that it will be able to continue as going concern, in addition to maximizing the profits of the shareholders through the optimization of the balance of debt and equity. The Company's capital structure consists of debt (Notes 14, 19 and 20) offset by cash on hand and in banks (Note 5) and equity shareholders of the holding consisting of capital stock (Note 22), additional paid-in capital (Note 23), and retained earnings.
P.T. FAJAR SURYA WISESA Tbk AND ITS SUBSIDIARY NOTES TO FINANCIAL STATEMENTS MARCH 31, 2013 (UNAUDITED) AND DECEMBER 31, 2012 AND FOR THE THREE-MONTH PERIODS ENDED MARCH 31, 2013 AND 2012 (UNAUDITED) (Continued)
- 42 -
The Board of Directors of The Company periodically reviews The Company's capital structure. As part of this review, the Board of Directors considers the cost of capital and related risks.
The gearing ratio as of March 31, 2013, and December 31, 2012 are as follows:
March 31, 2013(Unaudited) December 31, 2012
Rp Rp
Debt 2,398,733,658,653 2,536,943,343,728 Cash on hand and in banks 88,181,823,053 72,870,958,343 Net debt 2,310,551,835,600 2,464,072,385,385 Equity 1,874,292,576,331 1,806,989,916,747
Net debt to equity ratio 123% 136%
b. Financial risk management objectives and policies The Company and its subsidiary’s overall financial risk management and policies seek to ensure that adequate financial resources are available for operation and development of their business, while managing their exposure to foreign exchange risk, interest rate risk, credit and liquidity risks. The Company and its subsidiary operate within defined guidelines that are approved by the Board. The Company seeks to minimize the effects of these risks by using derivative financial instruments to hedge risk exposures. The use of financial derivatives is governed by the Company policies approved by the board of directors, which provide written principles on market risk, foreign exchange risk, interest rate risk, credit risk, the use of financial derivatives and non-derivative financial instruments, and the investment of excess liquidity. The Company does not enter into or trade financial instruments, including derivative financial instruments, for speculative purposes.
i. Market risk
The Company’s activities expose it primarily to the financial risks of changes interest rates. The Company enters into derivative financial instruments to manage its exposure to interest rate risk, which include interest rate swaps to mitigate the risk of rising interest rates.
There has been no change to The Company’s exposure to market risk or the manner in which these risks are managed and measured.
ii. Foreign currency risk management As a business based in Indonesia, the Company conducts the majority of its normal transactions in Rupiah, and the Company’s accounts and financial records are reported in Rupiah. The Company also undertakes routine foreign currency transactions: for the purchase of waste paper materials or equipment for maintenance and expansion, for refinancing and the sale of products to overseas markets. There is an exchange risk exposure inherent in these transactions as a result of currency movements, and this is monitored daily. The Company actively manages balances of receivables and payables in foreign currency in order to minimize the impact of exchange rate volatility. The Company’s currency exchange policy are as follows:
In the normal course of business, the Company has a large amount of cash generated by
Rupiah receivables and is short in U.S. Dollars, consequently the Company converts Rupiah surplus cash into U.S. Dollars.
Regular monitoring is undertaken to control domestic receivables from the perspective of working capital efficiency and to minimize underlying risks associated with price changes.
P.T. FAJAR SURYA WISESA Tbk AND ITS SUBSIDIARY NOTES TO FINANCIAL STATEMENTS MARCH 31, 2013 (UNAUDITED) AND DECEMBER 31, 2012 AND FOR THE THREE-MONTH PERIODS ENDED MARCH 31, 2013 AND 2012 (UNAUDITED) (Continued)
- 43 -
The Company has loan facilities that can be drawndown in U.S. Dollar or other currencies (Rupiah).
The Company manages the foreign currency exposure by matching, as far as possible, receipts and payments in each individual currency. The Company’s net open foreign currency exposure as of reporting date is disclosed in Note 35. Foreign currency sensitivity analysis
The Company’s sensitivity to a 1.35% increase and decrease in the Rp against U.S. Dollar is discussed below. 1.35% is the sensitivity rate used when reporting foreign currency risk internally to key management personnel and represents management's assessment of the reasonably possible change in foreign exchange rates. The sensitivity analysis includes only outstanding U.S. Dollar denominated monetary items and adjusts their translation at the period end for a 1.35% change in U.S. Dollar rates. At March 31, 2013, if US$ had weakened/strengthened by 1.35% against Rupiah with all other variables held constant, net income for the year net of tax would have been Rp 29,458,565,697 higher/lower, mainly as a result of the effect of the gain/loss on foreign exchange of the Company’s external loans in U.S. Dollars. The Company’s sensitivity to foreign currency is quite significant mainly due to principal and accrued interest of short-term bank loan and long-term loans from financial institution mostly denominated in US$ which has resulted in higher US$ denominated liabilities.
iii. Interest rate risk management The Company and its subsidiary are exposed to interest rate risk because of the borrowings with floating rates. The Company entered into several interest rate swap agreements to anticipate the Company’s risk on the fluctuation of interest rates on certain bank loan facilties. According to the agreements, the Company pays quarterly fixed interest to the Banks, at the same time, the Banks will pay quarterly interest at LIBOR US$ floating rate. As of March 31, 2013, the Company entered into an interest rate swap (IRS) contract with notional amount of US$ 56,333,100, whereas the syndicated loan facility with floating interest rate based on 3-month LIBOR is changed to average fixed interest rate for 2012 until 2016 as described in Note 34b. Interest rate sensitivity analysis The sensitivity analyses below have been determined based on the exposure to interest rates for derivatives and non-derivative instruments at the end of the reporting period. For floating rate liabilities, the analysis is prepared assuming the amount of the liability outstanding at the end of the reporting period was outstanding for the whole year. A 10 basis point increase or decrease is used when reporting interest rate risk internally to key management personnel and represents management's assessment of the reasonably possible change in interest rates. If interest rates had been 10 basis points higher/lower and all other variables were held constant, the Company profit for the year, net of tax ended March 31, 2013 would decrease/ increase by Rp 2,021,965,128. This is mainly attributable to the Company’s exposure to interest rates on its variable rate borrowings.
P.T. FAJAR SURYA WISESA Tbk AND ITS SUBSIDIARY NOTES TO FINANCIAL STATEMENTS MARCH 31, 2013 (UNAUDITED) AND DECEMBER 31, 2012 AND FOR THE THREE-MONTH PERIODS ENDED MARCH 31, 2013 AND 2012 (UNAUDITED) (Continued)
- 44 -
Interest rate swap contracts Under interest rate swap contracts, the Company agrees to exchange the difference between fixed and floating rate interest amounts calculated on agreed notional principal amounts. Such contracts enable the Company to mitigate the risk of changing interest rates on the cash flow exposures on the issued variable rate debt. The fair value of interest rate swaps at the end of the reporting period is determined by discounting the future cash flows using the curves at the end of the reporting period and the credit risk inherent in the contract. The average interest rate is based on the outstanding balances at the end of the reporting period. All interest rate swap contracts exchanging floating rate interest amounts for fixed rate interest amounts are entered into as cash flow hedges in order to reduce the Company’s cash flow exposure resulting from variable interest rates on borrowings.
iv. Credit risk management The exposure to credit risk of the Company arises mainly from collectibility of receivables. The Company has a large number of customers, to reduce the credit risks that are concentrated only on certain customers. The Company perform timely monitoring of receivables’ collections and also perform a review of each customer receivables on a regular basis to assess the potential for failure of collection. The carrying amount of financial assets recorded in the consolidated financial statements, net of any allowance for losses represents the Company’s exposure to credit risk.
v. Liquidity risk management The Company maintains adequate cash and internally generated cash from operations to manage its liquidity risk. The Company’s capital requirements relate to working capital funding and capital expenditures are mainly obtained from bank loan facilities. The Company closely monitor the use of working capital to reduce the level of cash tied up in inventory. Liquidity and interest risk tables The following tables detail the Company’s remaining contractual maturity for its non-derivative financial liabilities with agreed repayment periods. The tables have been drawn up based on the undiscounted cash flows of financial liabilities based on the earliest date on which the Company can be required to pay. The tables include both interest and principal cash flows. To the extent that interest flows are floating rate, the undiscounted amount is derived from interest rate curves at the end of the reporting period. The contractual maturity is based on the earliest date on which the Company may be required to pay.
Weightedav erage
ef f ectiv e Less than 3 months tointerest rate 1 month 1-3 months 1 y ear 1-5 y ears 5+ y ears Total
% Rp Rp Rp Rp Rp Rp
LiabilitiesNon-interest bearing Trade accounts pay able to third parties 57,219,547,757 118,216,151,684 632,901,568,136 - - 808,337,267,577 Other accounts pay able 7,012,498,681 7,202,483,153 16,441,925,157 - - 30,656,906,991
Total 64,232,046,438 169,963,829,891 1,984,985,789,956 1,052,684,819,537 137,495,083,107 3,409,361,568,929
P.T. FAJAR SURYA WISESA Tbk AND ITS SUBSIDIARY NOTES TO FINANCIAL STATEMENTS MARCH 31, 2013 (UNAUDITED) AND DECEMBER 31, 2012 AND FOR THE THREE-MONTH PERIODS ENDED MARCH 31, 2013 AND 2012 (UNAUDITED) (Continued)
- 45 -
The Company has access to financing facilities as described in Note 34a which were unused at the end of the reporting period. The Company planned to meet its obligations from operating cash flows and proceeds of maturing financial assets. The following table details the Company’s liquidity analysis for its derivative financial instruments. The table has been drawn up based on the undiscounted contractual net cash inflows and outflows on derivative instruments that settle on a net basis, and the undiscounted gross inflows and outflows on those derivatives that require gross settlement. When the amount payable or receivable is not fixed, the amount disclosed has been determined by reference to the projected interest rates as illustrated by the yield curves at the end of the reporting period.
Less than 3 months1 month 1-3 months to 1 y ear 1-5 y ears 5+ y ears
c. Fair value of financial instruments Fair value of financial instruments carried at amortized cost Except as detailed in the following table, the directors consider that the carrying amounts of financial assets and financial liabilities recognized in the consolidated financial statements approximate their fair values because of their short-term maturities or they carry market interest rate.
Valuation techniques and assumptions applied for the purposes of measuring fair value The fair values of other financial liabilities for lease obligations are determined in accordance with generally accepted pricing models based on discounted cash flow analysis using interest rate for similar instruments.
Specifically, significant assumptions used in determining the fair value of the finance lease obligation, estimated to be Rp 703,181,354 using an 6.50% discount rate based on market interest rate from similar finance leased obligations. Fair value measurements recognised in the consolidated statement of financial position The following table provides an analysis of financial instruments that are measured subsequent to initial recognition at fair value, categorized into Levels 1 to 3 based on the degree to which the fair value is observable. Level 1 fair value measurements are those derived from quoted prices (unadjusted) in active
markets for identical assets or liabilities.
P.T. FAJAR SURYA WISESA Tbk AND ITS SUBSIDIARY NOTES TO FINANCIAL STATEMENTS MARCH 31, 2013 (UNAUDITED) AND DECEMBER 31, 2012 AND FOR THE THREE-MONTH PERIODS ENDED MARCH 31, 2013 AND 2012 (UNAUDITED) (Continued)
- 46 -
Level 2 fair value measurements are those derived from inputs other than quoted prices included within Level 1 that are observable for the asset or liability, either directly (i.e. as prices) or indirectly (i.e. derived from prices).
Level 3 fair value measurements are those derived from valuation techniques that include
inputs for the asset or liability that are not based on observable market data (unobservable inputs).
Level 1 Level 2 Level 3 Total
Rp Rp Rp Rp
Financial liabilities at FVTPL Other f inancial liabilities- derivatives - 9,291,629,232 - 9,291,629,232
There were no transfers between level 1 and 2 in the period.
38. LITIGATION On March 28, 2013, the Company has recently commenced arbitration proceedings before the Singapore International Arbitration Council in connection with a claim against one of our suppliers of machines used at one of our plants in relation to the supplier’s failure to fulfill its obligations. These proceedings are currently at an initial stage. The Company currently believes that the ultimate outcome of these matters or disputes will not give negative impact on the business activities of the Company.
39. SUBSEQUENT EVENT Based on letter dated April 19, 2013, the Company obtained an extension on the maturity of credit agreement from Bank UOB until May 30, 2013.
40. FINANCIAL INFORMATION OF THE PARENT COMPANY ONLY
The financial information of the parent company only presents the statements financial position, statements of comprehensive income, statements of changes in equity and statements of cash flows information in which the investment in its subsidiary, Fajar Finance BV, domiciled in Amsterdam with 100% ownership (Note 1b) was accounted for using the cost method. Financial information of the parent company only, was presented on pages 47 to 51.
41. MANAGEMENT RESPONSIBILITY AND APPROVAL OF CONSOLIDATED FINANCIAL STATEMENTS The preparation and fair presentation of the consolidated financial statements on pages 2 to 46 and the supplementary information on pages 47 to 51 were the responsibilities of the management and were approved and authorized for issue by the Directors on May 6, 2013.
P.T. FAJAR SURYA WISESA Tbk AND ITS SUBSIDIARYSUPPLEMENTARY INFORMATIONSCHEDULE I: STATEMENTS OF FINANCIAL POSITION ONLY PARENT COMPANY'S *)MARCH 31, 2013 (UNAUDITED) AND DECEMBER 31, 2012
March 31, 2013 December 31,(Unaudited) 2012
Rp RpASSETS
CURRENT ASSETSCash on hand and in banks 88,181,823,053 72,870,958,343 Trade accounts receivable to third parties 895,907,793,570 878,622,048,703 Other accounts receivable 2,436,732,422 2,144,104,020 Inventories 725,674,542,149 636,373,572,306 Advances 9,091,060,701 7,964,690,758 Prepaid taxes 85,918,448,771 76,802,197,934 Prepaid expenses 5,124,065,953 6,174,678,893
Total Current Assets 1,812,334,466,619 1,680,952,250,957
NONCURRENT ASSETSRestricted time deposit 9,597,887,265 9,465,012,923 Property, plant and equipment - net of accumulated
depreciation of Rp 2,130,255,200,939 inMarch 31, 2013 and Rp 2,075,556,955,495 in December 31, 2012 3,835,032,009,260 3,860,973,069,153
Intangible Asset - net 22,638,591,172 22,865,535,787 Advances for purchase of property, plant and equipment 120,790,909 59,863,636 Guarantee deposits 4,018,475,000 4,018,475,000
Total Noncurrent Assets 3,871,407,753,606 3,897,381,956,499
TOTAL ASSETS 5,683,742,220,225 5,578,334,207,456
*) STATED USING COST METHOD
- 47 -
P.T. FAJAR SURYA WISESA Tbk AND ITS SUBSIDIARYSUPPLEMENTARY INFORMATIONSCHEDULE I: STATEMENTS OF FINANCIAL POSITION ONLY PARENT COMPANY'S *)MARCH 31, 2013 (UNAUDITED) AND DECEMBER 31, 2012 (Continued)
March 31, 2013 December 31,(Unaudited) 2012
Rp Rp
LIABILITIES AND EQUITY
CURRENT LIABILITIESBank loans 256,512,447,758 301,673,090,910 Trade accounts payable from third parties 808,337,267,577 639,631,351,281 Other accounts payable 30,656,906,991 45,047,464,234 Taxes payable 13,952,818,048 20,392,641,357 Accrued expenses 70,607,230,449 64,608,669,978 Current maturities of long-term liabilities
TOTAL LIABILITIES AND EQUITY 5,683,742,220,225 5,578,334,207,456
*) STATED USING COST METHOD
- 48 -
P.T. FAJAR SURYA WISESA Tbk AND ITS SUBSIDIARYSUPPLEMENTARY INFORMATIONSCHEDULE II: STATEMENTS OF COMPREHENSIVE INCOME ONLY PARENT COMPANY'S*)FOR THE THREE-MONTH PERIODS ENDED MARCH 31, 2013 AND 2012 (UNAUDITED)
2013 2012(Unaudited) (Unaudited)
Rp Rp
NET SALES 1,213,561,575,587 862,342,262,399
COST OF GOODS SOLD 1,025,010,099,152 773,491,269,378
GROSS PROFIT 188,551,476,435 88,850,993,021
Selling expenses (38,291,756,423) (19,909,403,869)General and administrative expenses (14,868,482,236) (12,519,384,077)Financial charges (31,304,135,149) (33,961,614,033)Loss on foreign exchange - net (16,637,349,487) (21,754,337,245)Gain (loss) on derivative financial instruments - net 1,940,249,829 (739,806,398)Others - net 1,554,087,937 4,117,500,181
INCOME BEFORE TAX 90,944,090,906 4,083,947,580
TAX EXPENSE - NET (23,641,431,322) (2,178,586,431)
NET INCOME FOR THE PERIOD 67,302,659,584 1,905,361,149Other comprehensive income - -
TOTAL COMPREHENSIVE INCOME 67,302,659,584 1,905,361,149
BASIC EARNINGS PER SHARE 27.16 0.77
*) STATED USING COST METHOD
- 49 -
P.T. FAJAR SURYA WISESA Tbk AND ITS SUBSIDIARYSUPPLEMENTARY INFORMATIONSCHEDULE III: STATEMENTS OF CHANGES IN EQUITY ONLY PARENT COMPANY'S *)FOR THE THREE-MONTH PERIODS ENDED MARCH 31, 2013 AND 2012 (UNAUDITED)
Paid-up Capital Paid-in Capital Appropriated Unappropriated Total EquityRp Rp Rp Rp Rp
Balance as of January 1, 2012 1,238,944,393,500 3,560,727,824 600,000,000 556,674,640,289 1,799,779,761,613
Total comprehensive income(Unaudited) - - - 1,905,361,149 1,905,361,149
Balance as of March 31, 2012 1,238,944,393,500 3,560,727,824 600,000,000 558,580,001,438 1,801,685,122,762
Balance as of January 1, 2013 1,238,944,393,500 3,560,727,824 600,000,000 563,884,795,423 1,806,989,916,747
Total comprehensive income(Unaudited) - - - 67,302,659,584 67,302,659,584
Balance as of March 31, 2013 1,238,944,393,500 3,560,727,824 600,000,000 631,187,455,007 1,874,292,576,331
*) STATED USING COST METHOD
Retained earnings
- 50 -
P.T. FAJAR SURYA WISESA Tbk AND ITS SUBSIDIARYSUPPLEMENTARY INFORMATIONSCHEDULE IV: STATEMENTS OF CASH FLOWS ONLY PARENT COMPANY'SFOR THE THREE-MONTH PERIODS ENDED MARCH 31, 2013 AND 2012 (UNAUDITED)
2013 2012(Unaudited) (Unaudited)
Rp Rp
CASH FLOWS FROM OPERATING ACTIVITIESCash receipts from customers 1,196,275,830,721 624,618,529,243 Cash paid to suppliers, employees and for other operational
expenses (902,351,060,641) (649,824,799,887)
Cash generated by operations 293,924,770,080 (25,206,270,644) Payments of:
Financial charges (27,445,632,795) (29,644,206,313) Income taxes (12,047,149,017) (3,414,738,484)
Receipts from:Interest income 370,760,163 318,574,367
Net Cash Provided by (Used in) Operating Activities 254,802,748,431 (57,946,641,074)
CASH FLOWS FROM INVESTING ACTIVITIESProceeds from sale of property, plant and equipment 173,636,364 100,000,000 Placement in restricted time deposit (132,874,342) (8,904,600,000) Acquisition of property, plant and equipment (28,936,000,697) (100,208,917,062) Acquisition of intangible assets (1,046,453,962) (2,870,000,000) Payment of advances for purchase of property, plant and equipment (175,472,727) (78,886,364)
Net Cash Used in Investing Activities (30,117,165,364) (111,962,403,426)
CASH FLOWS FROM FINANCING ACTIVITIESProceeds from bank loans - 153,765,000,000 Proceeds from long-term bank loans and financial institution 257,299,450,179 152,180,274,830 Payment of bank loans (107,969,004,078) (63,898,468,683) Payment of long-term bank loans (355,790,612,901) (55,683,293,192) Payment of finance lease obligations (2,914,551,557) (5,530,443,075)
Net Cash Provided by (Used in) Financing Activities (209,374,718,357) 180,833,069,880
NET INCREASE IN CASH ON HAND AND IN BANKS 15,310,864,710 10,924,025,380
CASH ON HAND AND IN BANKS AT BEGINNING OF PERIOD 72,870,958,343 39,332,612,929
CASH ON HAND AND IN BANKS AT END OF PERIOD 88,181,823,053 50,256,638,309