484 VOLUME 20 | NUMBER 5 | MAY 2014 nature medicine
a r t i c l e s
Inflammation is an integral component of insulin resistance and type 2 diabetes1–3, and activation of both circulating monocytes and tissue-resident macrophages is necessary for the development of peripheral insulin resistance4,5. As such, mice with adipose-specific deletion of monocyte chemoattractant protein-1 (MCP-1, also called Ccl2) have reduced adipose macrophage content and are protected from high-fat diet (HFD)-induced insulin resistance6,7.
Macrophages consist of multiple subtypes. Among these are the proinflammatory or classically activated M1 macrophages and the anti-inflammatory or alternatively activated M2 macrophages. Each sub-type modulates inflammation through secretion of cytokines, such as proinflammatory tumor necrosis factor-α (TNF-α) and interleukin-12 (IL-12) and anti-inflammatory transforming growth factor-β (TGF-β), IL-1β and IL-1 receptor antagonist, by M1 and M2 macrophages, respectively8,9. In addition, M2 macrophages promote scavenging of debris, tissue growth, remodeling and repair8,10. Thus, overall inflam-mation is determined by the balance between the two polarizing states, the fate of which is regulated by both humoral and neuronal factors11. Strategies to promote macrophage differentiation toward the M2 pheno-type would offer new therapeutic potential for type 2 diabetes.
Recent evidence points to a previously unidentified neuronal regu-lation of M2 macrophage activation through the autonomic nervous
system known as the ‘anti-inflammatory reflex’12,13. In this pathway, the afferent inflammatory signals from peripheral tissues are integrated by the nucleus tractus solitarius (NTS) within the brainstem, which are then transmitted to rostral ventrolateral medullary neurons and the nucleus ambiguous, where they are translated into the vagal autonomic outflow by the dorsal vagal motor nucleus (DVM)14–16. Vagal activa-tion and subsequent acetylcholine (Ach) release from nerve terminals to target tissues have been shown to inhibit cytokine production by the innervated tissues17–20. Specifically, in the spleen, Ach binding to its nicotinic receptor (nAchR) on macrophages has been shown to acti-vate the Jak2-Stat3 signaling pathway and subsequent differentiation into the M2 subtype21. Paraventricular hypothalamic (PVH) nuclei have been shown to mediate this efferent autonomic pathway, linking energy homeostasis that is regulated by the hypothalamus to peripheral inflammatory control22–24. However, the importance of the cholinergic anti-inflammatory reflex and specific signal transduction pathways within these defined neurons that mediate this process have not been investigated in the context of insulin resistance and type 2 diabetes.
In this report we show that mice with Pten deletion in neurons expressing Cre through the Rip-cre transgene (herein referred to as RIP-Cre neurons) exhibited higher PI3K activation in the hypothalamus, particularly the PVH. These mice displayed an anti-inflammatory
1Toronto General Research Institute, University Health Network, Toronto, Ontario, Canada. 2Department of Medical Biophysics, University of Toronto, Toronto, Ontario, Canada. 3Faculty of Medicine, University of Toronto, Toronto, Ontario, Canada. 4Department of Molecular and Integrative Physiology, Department of Internal Medicine, University of Michigan, Ann Arbor, Michigan, USA. 5Institute of Medical Science, University of Toronto, Toronto, Ontario, Canada. 6The Campbell Family Institute for Breast Cancer Research, Toronto, Ontario, Canada. 7Ontario Cancer Institute, Princess Margaret Cancer Centre, University Health Network, Toronto, Ontario, Canada. 8Division of Cancer Genetics, Medical Institute of Bioregulation, Kyushu University, Fukuoka, Japan. 9Department of Immunology, University of Toronto, Toronto, Ontario, Canada. 10Department of Pathology, University Health Network, University of Toronto, Toronto, Ontario, Canada. 11Division of Endocrinology and Metabolism, Department of Medicine, University Health Network, University of Toronto, Toronto, Ontario, Canada. Correspondence should be addressed to M.W. ([email protected]).
Received 2 January 2013; accepted 13 March 2014; published online 20 April 2014; doi:10.1038/nm.3527
Pten deletion in RIP-Cre neurons protects against type 2 diabetes by activating the anti-inflammatory reflexLinyuan Wang1–3, Darren Opland4, Sue Tsai1, Cynthia T Luk1,3,5, Stephanie A Schroer1, Margaret B Allison4, Andrew J Elia6,7, Caren Furlonger7, Akira Suzuki8, Christopher J Paige2,7,9, Tak W Mak2,6,7,9, Daniel A Winer1,9–11, Martin G Myers Jr4 & Minna Woo1–3,5,11
Inflammation has a critical role in the development of insulin resistance. Recent evidence points to a contribution by the central nervous system in the modulation of peripheral inflammation through the anti-inflammatory reflex. However, the importance of this phenomenon remains elusive in type 2 diabetes pathogenesis. Here we show that rat insulin-2 promoter (Rip)-mediated deletion of Pten, a gene encoding a negative regulator of PI3K signaling, led to activation of the cholinergic anti-inflammatory pathway that is mediated by M2 activated macrophages in peripheral tissues. As such, Rip-cre+ Ptenflox/flox mice showed lower systemic inflammation and greater insulin sensitivity under basal conditions compared to littermate controls, which were abolished when the mice were treated with an acetylcholine receptor antagonist or when macrophages were depleted. After feeding with a high-fat diet, the Pten-deleted mice remained markedly insulin sensitive, which correlated with massive subcutaneous fat expansion. They also exhibited more adipogenesis with M2 macrophage infiltration, both of which were abolished after disruption of the anti-inflammatory efferent pathway by left vagotomy. In summary, we show that Pten expression in Rip+ neurons has a critical role in diabetes pathogenesis through mediating the anti-inflammatory reflex.
nature medicine VOLUME 20 | NUMBER 5 | MAY 2014 485
phenotype with a predominance of M2 macrophages and greater peripheral insulin sensitivity, which were dependent on cholinergic activation of the macrophages. In line with their anti-inflammatory state, these mice were completely protected against HFD-induced diabetes and remained highly insulin sensitive, with preferential fat deposition in the subcutaneous compartment. Notably, the visceral adipose tissue of these mice showed more evidence of adipogenesis, higher secretion of insulin-sensitizing hormones and greater M2 macrophage infiltration. In addition, protection against insulin resistance and higher adipogenesis were lost when these mice were subjected to macrophage depletion or surgical disruption of vagal output, which together illustrate the essential role of the cholinergic anti-inflammatory pathway in type 2 diabetes pathogenesis.
RESULTSRip-driven neuronal Pten deletion activates PI3KIn mammals, pancreatic beta cells are the predominant, if not sole, source of circulating insulin; however, insulin promoter activity is observed during development in the central nervous system, and these cells appear to regulate important metabolic functions. As such, genetic manipula-tion that is driven by Rip-cre leads to alterations in whole-body metabo-lism that cannot be explained by changes in pancreatic insulin secretion alone25. Here we aimed to determine the role of PI3K signaling in these neurons with insulin promoter activity by deleting Pten, a potent negative regulator of the PI3K pathway, in these neurons. We were able to achieve this cell-specific deletion by crossing Ptenflox/flox mice with Rip-cre mice. In whole hypothalamic lysates from the Rip-cre Ptenflox/flox offspring, we observed considerably lower Pten protein expression than in Rip-cre+ Pten+/+ littermates (Fig. 1a). We also saw deletion in pancreatic islets (Fig. 1a), as has been shown previously26. We detected no difference in Pten protein expression in other peripheral tissues, including adipose tissue, liver, muscle, spleen and macrophages (Supplementary Fig. 1a). Consistent with the lower hypothalamic expression of Pten protein, we observed higher amounts of phosphorylated Akt (pAkt) and pFoxO1
in whole hypothalamic extracts, confirming greater PI3K activation in the Pten-deficient hypothalamus (Fig. 1b).
The anatomical localization of RIP-Cre neurons has been charac-terized extensively. These neurons are distributed in multiple areas in the brain, including the hypothalamus, caudate, putamen and forebrain25,27,28. Within the hypothalamus, Rip activity has been reported in the arcuate, dorsomedial, ventromedial, lateral and PVH nuclei25,27. Consistent with these reports, Rip-cre+ Ptenflox/flox mice showed greater expression of pS6, a marker of PI3K activation, in all of these neuronal regions compared to littermate controls (Fig. 1c and Supplementary Fig. 2), which is supportive of more active PI3K signaling in Pten-deficient RIP-Cre neurons. We also observed larger pS6-positive neurons in Rip-cre+ Ptenflox/flox mice compared to the respective neurons of control littermates (Fig. 1d), which is consistent with the well-known role of Pten in cell-size determina-tion29. In the PVH, higher expression of c-Fos protein was present in neurons that did not coexpress pS6, suggesting that Pten-deficient RIP-Cre neurons probably activated neighboring cells through para-crine effects (Fig. 1c). Given the connection between the PVH and brainstem that is implicated in the anti-inflammatory reflex that occurs through the splenic vagal outflow12,24, we next examined the NTS and DVM, both of which are implicated in this pathway specifically. Indeed, higher neuronal activation, as illustrated by c-Fos protein expression, was present in the NTS and DVM of Rip-cre+ Ptenflox/flox mice compared to Rip-cre+ Pten+/+ littermates (Fig. 1c).
Alternatively activated Rip-cre+ Ptenflox/flox macrophagesThe anti-inflammatory reflex has been shown to attenuate systemic inflammation by modulating splenic macrophage differentiation through acetylcholine secretion at the vagus nerve terminus12,13. The enhanced neuronal activation that was present in the PVH and vagal outflow track of the brainstem of Rip-cre+ Ptenflox/flox mice prompted us to hypothesize that the cholinergic anti-inflammatory pathway may be activated in these mice. In support of this hypothesis, we observed
PtenHFD P
ten–/
–
HFD Pten+/
+
HFD Pten+/
+
HFD Pten–/
–
Actin
Hyp Isleta
Pte
n ex
pres
sion
(fol
d ch
ange
from
con
trol
)
HFD Pten+/+
HFD Pten–/–
00.20.40.60.81.01.2
Hyp Islet
*
**
ChowPten+/+
ChowPten–/–
0
0.006
0.012
0.018
pS6-
posi
tive
cell
size
(are
a in
pix
els)
d*
Pten+/+ Pten–/–
PVH
c
Hindbrain NTS
DVM
NTS
DVM
VMH
ARCARC
ARCVMH
pS6:greenc-Fos:red
VMH
Pro
tein
exp
ress
ion
(fol
d ch
ange
from
con
trol
)
0
pAkt
pFox
O1
FoxO
1Akt
2468
101214
HFD Pten+/+
HFD Pten–/–**
*
pAkt
Akt
pFoxO1
FoxO1
Actin
bPten
+/+
Pten
–/–
Figure 1 Rip-cre–mediated Pten deletion leads to PI3K activation and neuronal activation in hypothalamic and brainstem nuclei. (a) Western blots of Pten protein levels in hypothalamic (Hyp) and islet lysates (top) and quantification (bottom) in Rip-cre+ Pten+/+ (Pten+/+) and Rip-cre+ Ptenflox/flox (Pten−/−) mice (n = 6 per group). (b) Western blots (top) and quantification (bottom) of whole hypothalamic pAkt, total Akt, pFoxO1 and total FoxO1 from Pten+/+ and Pten−/− mice (n = 6 per group). (c) Representative immunofluorescent staining of pS6 (green) and c-Fos (red) in arcuate (ARC), ventromedial (VMH) and paraventricular (PVH) nuclei of the hypothalamus (20× magnification; scale bars, 100 µm) and in NTS and DVM nuclei of the brainstem (10× magnification; scale bars, 200 µm) from Pten+/+ and Pten−/− mice. (d) Size of pS6-postive cells in pixels from the PVH nucleus (n = 6 per group). All data are presented as the means ± s.e.m. *P < 0.05, **P < 0.01 (independent-sample t test).
486 VOLUME 20 | NUMBER 5 | MAY 2014 nature medicine
more Jak2-Stat3 signaling, which is activated by acetylcholine, in protein lysates of both the spleen and isolated peritoneal macrophages of Rip-cre+ Ptenflox/flox mice (Fig. 2a–c). The levels of pAkt and pAMPK were also higher in these tissues, suggesting greater insulin sensitivity in these immune cells (Fig. 2a–c). Notably, Pten protein expression was unaltered to account for the changes in signaling that occurred in the spleen and macrophages of these mice (Fig. 2a–c). Furthermore, the macrophages of these mice demonstrated higher gene expression of anti-inflammatory M2 markers, including Chil3, Mgl2, Mrc2 and Arg1 (Fig. 2d). In contrast, proinflammatory M1 markers, including Ccl2 (encoding MCP-1) and Il1b (encoding Il-1β), were attenuated (Fig. 2d). Consistent with the anti-inflammatory phenotype, Rip-cre+ Ptenflox/flox mice showed considerably lower circulating amounts of proinflammatory cytokines such as Tnfa, whereas the amounts of anti-inflammatory cytokines, adiponectin and Il-10 were higher compared to littermate controls (Fig. 2e–g).
In addition to the role of PVH in the anti-inflammatory reflex, these neurons are known to modulate systemic inflammation through the hypothalamus-pituitary-adrenal axis. We therefore measured cor-ticosterone, the murine analog of cortisol, in Rip-cre+ Ptenflox/flox mice and found no difference compared to control littermates (Fig. 2g), which is in line with normal hypothalamic corticotropin-releasing hormone levels in these mice30.
Increased insulin sensitivity in Rip-cre + Pten flox/flox miceGiven the integral role of inflammation in metabolism, we next assessed the metabolic profile of Rip-cre+ Ptenflox/flox mice. On chow diet, these mice had lower fasting serum glucose levels that were within the euglycemic range, and this difference was maintained until up to 9 months of age (Fig. 3a). Furthermore, these mice demon-strated better glucose tolerance during a glucose tolerance test (GTT)
compared to control littermates (Fig. 3b). They were also more insulin sensitive under basal conditions, as demonstrated by greater lowering of glucose levels during an insulin tolerance test (ITT) (Fig. 3b) and lower fasting serum insulin levels (Fig. 3c).
In keeping with the higher peripheral insulin sensitivity in Rip-cre+ Ptenflox/flox mice, the peripheral metabolic tissues of these mice, includ-ing the liver, muscle and visceral adipose tissue, showed greater levels of pAkt and pAMPK under basal conditions (Fig. 3d–f). Stimulation with exogenous insulin further increased Akt phosphorylation in these tissues from Rip-cre+ Ptenflox/flox mice, whereas the expression of tissue insulin receptor remained unchanged (Supplementary Fig. 1b), indicating constitutive PI3K activation in these metabolic tissues with further enhanced activation after insulin challenge.
nAchR is required for insulin sensitivity and M2 activationThe anti-inflammatory reflex has been shown to be an acetylcholine-dependent signaling pathway through nAchRs on target cells12,13. To determine the role of nAchR activation in modulating the inflam-matory state of Rip-cre+ Ptenflox/flox mice, we blocked nAchR sign-aling with a noncompetitive inhibitor, mecamylamine. Consistent with cholinergic activation of the Jak2-Stat3 pathway, this signaling pathway was attenuated after mecamylamine treatment in both the whole spleen and isolated macrophages of Rip-cre+ Ptenflox/flox mice (Fig. 2a–c). Notably, nAchR blockade reversed the predominance of M2 markers (Chil3, Mgl2, Mrc2 and Arg1) and the attenuation of M1 markers (Ccl2 and Il1b) in macrophages of Rip-cre+ Ptenflox/flox mice to levels similar to those in controls (Fig. 2d). The higher peripheral insulin sensitivity, as shown by ITT, was also abolished in Rip-cre+ Ptenflox/flox mice after mecamylamine treatment (Fig. 4a). Moreover, the higher pAkt and pAMPK levels in the spleen and peritoneal
a
Pla
sma
conc
entr
atio
n(p
g m
l–1)
Chow HFDPla
sma
conc
entr
atio
n(p
g m
l–1)
0
20
40
60
80Tnfa
f
**
Chow HFDPla
sma
conc
entr
atio
n(p
g m
l–1)
0
200
400
600Il-6
**
0
200,000
400,000
600,000
800,000Corticosterone
g
0
2
4
6
8
10
12
Chil3
Mgl2
Mrc2
Arg1
Ccl2
Il1b
Gen
e ex
pres
sion
(fol
d ch
ange
from
con
trol
)
M1M2
d
*
*
*
*
** *
Saline Pten+/+
Saline Pten–/–
Mec Pten+/+
Mec Pten–/–
Pro
tein
exp
ress
ion
(fol
d ch
ange
from
con
trol
) Saline Pten+/+
Saline Pten–/–
Mec Pten+/+
Mec Pten–/–
b
c
0
1
2
3
4
5
pJak
2Ja
k2
pSta
t3Sta
t3pA
kt Akt
pAM
PK
AMPK
Pten
****
* *
Spleen
0
1
2
3
4
5
6
pJak
2Ja
k2
pSta
t3Sta
t3pA
kt Akt
pAM
PK
AMPK
Pten
Pro
tein
exp
ress
ion
(fol
d ch
ange
from
con
trol
)
**
**
*
*
Macrophage Saline Pten+/+
Saline Pten–/–
Mec Pten+/+
Mec Pten–/–
Pten
–/–
Pten
+/+
0
10
20
30
40Adiponectin
Leptin
0
100,000
200,000
300,000
Chow HFD Chow HFDPla
sma
conc
entr
atio
n(p
g m
l–1)
Pla
sma
conc
entr
atio
n(n
g m
l–1)
** **
ePten–/–Pten+/+
Chow HFDPla
sma
conc
entr
atio
n(p
g m
l–1)
0
10
20
30Il-10
*
*
Pten–/–Pten+/+
Pten
+/+
Pten
+/+
Pten
–/–
Pten
–/–
pJak2
Jak2
pStat3
Stat3
pAkt
Akt
pAMPK
AMPK
Actin
Pten
+/+
Pten
+/+
Pten
–/–
Pten
–/–
MecSal MecSal
Pten
Macrophage Spleen
Figure 2 Rip-cre+ Ptenflox/flox mice exhibit predominant M2 macrophage polarization and decreased inflammation. (a) Western blots of peritoneal macrophages and splenic lysates for pJak2, total Jak2, pStat3, total Stat3, pAkt, total Akt, pAMPK, total AMPK and Pten levels in Rip-cre+ Pten+/+ (Pten+/+) and Rip-cre+ Ptenflox/flox (Pten−/−) mice on chow diet after treatment with either saline (Sal) or mecamylamine (Mec) (n = 6 per group). (b,c) Quantification of protein levels in peritoneal macrophages (b) and splenic lysates (c) (n = 6 per group). (d) Quantitative PCR to indicate the transcript levels of genetic markers of M2 polarized macrophages (Chil3, Mgl2, Mrc2 and Arg1) and M1 macrophages (Ccl2 and Il1b) in Pten+/+ and Pten−/− mice on chow diet after treatment with either saline or mecamylamine (n = 6 per group). (e–g) Fasting plasma adipokines adiponectin (left) and leptin (right) (e), cytokines Tnfa (left), Il-6 (center) and Il-10 (right) (f) and corticosterone (g) in Pten+/+ and Pten−/− mice on chow or HFD (n = 10 per group). All data are presented as the means ± s.e.m. *P < 0.05, **P < 0.01 (independent-sample t test).
nature medicine VOLUME 20 | NUMBER 5 | MAY 2014 487
macrophages of these mice were also abolished by mecamylamine injection without changes in Pten protein expression in these tissues (Fig. 2a–c).
Because mecamylamine is a nonselective inhibitor of nAchR, we further took a genetic approach and introduced a null α7 nico-tinic acetylcholine receptor (α7nAchR) mutation to Rip-cre+ Ptenflox/+ mice. We crossed α7nAchR (Chrna7) knockout mice with Rip-cre+ Pten+/flox mice to generate Rip-cre+ Pten+/flox Chrna7−/− and Rip-cre+ Pten+/+ Chrna7−/− mice. We previously reported a gene dosage effect in which heterozygous Rip-cre+ Pten+/flox mice also demon-strated enhanced insulin sensitivity compared to Rip-cre+ Pten+/+ littermates30 (Fig. 4b). The enhanced insulin sensitivity of these mice was abolished completely in the absence of α7nAchR (Fig. 4b). Together, our findings using both pharmacologic and genetic means to abolish cholinergic activation show its requirement for the anti- inflammatory pathway and the enhanced insulin sensitivity in Rip-cre+ Ptenflox/flox mice.
RIP-Cre neuron Pten deletion prevents HFD-induced diabetesWe next assessed whether the M2 macrophage predominance in Rip-cre+ Ptenflox/flox mice would protect against the chronic inflam-mation that occurs during HFD feeding. After 7 months on HFD, Rip-cre+ Ptenflox/flox mice continued to show persistently lower circu-lating levels of Tnfa and higher levels of anti-inflammatory cytokines, adiponectin and Il-10 (Fig. 2e,f). Notably, high plasma levels of Il-6 were present in Rip-cre+ Ptenflox/flox mice in both the chow-fed and HFD-fed groups, which suggests that Il-6 was acting as an insulin-sensitizing hormone in the Rip-cre+ Ptenflox/flox mice (Fig. 2f)31,32.
Consistent with these anti-inflammatory phenotypes, these mice remained remarkably euglycemic, glucose tolerant and insulin sensitive
the entire time they were on the HFD, in contrast to the controls that developed hyperglycemia and insulin resistance (Fig. 4c,d). In keeping with the enhanced insulin sensitivity in Rip-cre+ Ptenflox/flox mice on prolonged HFD, these mice exhibited low fasting circulating insulin levels (Fig. 3c) and enhanced pAMPK and pAkt activation in peripheral insulin-responsive tissues, including the liver, muscle and visceral adipose tissue (Fig. 3d–f). Furthermore, these Rip-cre+ Ptenflox/flox mice on prolonged HFD were protected against hepato-steatosis completely (Fig. 4e).
Pancreas Pten does not regulate peripheral insulin sensitivityIt is well appreciated that Rip-cre mediated gene deletion leads to changes in whole-body metabolism that are not explained by changes in pancreatic hormone alone25,30,33. Interestingly, when gene ablation was mediated by another pancreatic promoter, pancreatic and duodenal homeobox 1 (Pdx1), minimal changes were observed in whole-body metabolism34,35. This finding was attrib-uted at least in part to considerably lower Pdx1 promoter activity in the brain compared to that of Rip27. More importantly, the expres-sion patterns of these two promoters in the brain are different. For example, Pdx1 promoter activity was absent in the PVH, the region shown to be important in the anti-inflammatory reflex27,28. To further assess the specificity of Pten deletion in Rip-expressing neurons rather than Pdx1 promoter–expressing neurons, we gen-erated mice with an inducible Pten deletion that is driven by the Pdx1 promoter and induced by tamoxifen (herein referred to as Pdx1-Cre-ER Ptenflox/flox mice; further details about these mice are given in the Online Methods). These mice exhibited Pten deletion predominantly in the pancreas, with markedly less deletion in neurons34 (Supplementary Fig. 3a,b).
0
2
4
6
Chow HFD
Pla
sma
conc
entr
atio
n (n
g m
l–1)
Insulin
b
a
0
2
4
6
8
10
12
0 1 2 3 4 5 6 7
Fas
ting
bloo
d gl
ucos
e
(mm
ol l–1
)
Time on chow diet (months)
Chow Pten+/+
Chow Pten–/–
* * * ** *
**
0
10
20
30
0 15 30 45 60 120 0 15 30 45 60 12
0
Blo
od g
luco
se (
mM
)
Time after glucose injection (min)
**
*
** 0
40
80
120
Per
cent
age
ofba
sal b
lood
glu
cose
Time after insulin injection (min)
* **
c Pten+/+
Pten–/–
pAkt
Akt
pAMPK
AMPK
Pgc-1α
Srebp-1c
Actin
Chow P
ten+/
+
Chow P
ten–/
–
HFD Pten–/
–
HFD Pten+/
+d
0
1
2
3
4
5
pAkt Akt
pAM
PK
AMPK
pAkt Akt
pAM
PK
AMPK
Pro
tein
exp
ress
ion
(fol
d ch
ange
from
con
trol
)
0
5
10
15
20
25
Pgc-1
α
Srebp
-1c
Chow Pten+/+
Chow Pten–/–
HFD Pten+/+
HFD Pten–/–
****
*
**
***** **
Chow P
ten+/
+
Chow P
ten–/
–
HFD Pten+/
+
pAkt
AktpAMPK
AMPKActin
e f
0
1
2
3
4
Pro
tein
exp
ress
ion
(fol
d ch
ange
from
con
trol
)
Chow Pten+/+
Chow Pten–/–HFD Pten+/+
HFD Pten–/–
** **
**
** **HFD P
ten–/
–
pAkt
AktpAMPK
AMPKActin
Chow Pten+/+
Chow Pten–/–HFD Pten+/+
HFD Pten–/–
pAkt Akt
pAM
PK
AMPK
0
1
2
3
4
Pro
tein
exp
ress
ion
(fol
d ch
ange
from
con
trol
)
** **
**
**
Chow P
ten+/
+
Chow P
ten–/
–
HFD Pten+/
+
HFD Pten–/
–
Figure 3 Rip-cre+ Ptenflox/flox mice have enhanced whole-body and metabolic tissue insulin sensitivity on chow and HFD. (a) Fasting blood glucose levels of Rip-cre+ Pten+/+ (Pten+/+) and Rip-cre+ Ptenflox/flox (Pten−/−) mice on 7 months of chow diet starting at 2 months of age (n = 15 per group). (b) GTT (left) of Pten+/+ and Pten−/− mice after 7 months of chow diet (n = 15 per group) and ITT (right) of Pten+/+ and Pten−/− mice after 7 months of chow diet (n = 15 per group). (c) Fasting plasma insulin concentrations from Pten+/+ and Pten−/− mice on chow or HFD (n = 10 per group). (d) Western blots (left) and quantification (right) of visceral adipose tissue pAkt, total Akt, pAMPK, total AMPK, peroxisome proliferative activated receptor, γ, coactivator 1α (Pgc-1α, also called Ppargc1a) and sterol regulatory element binding transcription factor 1 (Srebp-1c, also called Srebf1) of Pten+/+ and Pten−/− mice on chow or HFD (n = 6 per group). (e,f) Western blots (left) and quantification (right) of pAkt, total Akt, pAMPK and total AMPK in liver (e) and muscle (f; top and bottom, respectively) of Pten+/+ and Pten−/− mice on chow or HFD (n = 6 per group). All data are presented as the means ± s.e.m. *P < 0.05, **P < 0.01 (independent-sample t test).
488 VOLUME 20 | NUMBER 5 | MAY 2014 nature medicine
Notably, in contrast to Rip-cre+ Ptenflox/flox mice that exhibited higher insulin sensitivity as early as 3 weeks of age under basal conditions, these mice did not show differences in peripheral insulin sensitivity (Supplementary Fig. 3c), with levels of pAkt in the liver, muscle and visceral fat similar to those in control mice (Supplementary Fig. 3d). On HFD, these mice developed insulin resistance to a similar degree as control mice (Supplementary Fig. 3e). However, glucose tolerance was still better in the Pdx1-Cre-ER Ptenflox/flox mice than in control littermates (Supplementary Fig. 3f) because of Pten deletion in pancreatic beta cells leading to greater beta cell mass and enhanced insulin secretion (Supplementary Fig. 3g,h). These data further sup-port the unique role of Pten deletion in RIP-Cre neurons in mediating peripheral inflammation and metabolism.
M2 macrophages in Rip-cre+ Ptenflox/flox adipose tissue Resident adipose tissue macrophages (ATMs) have been shown to have an important role in regulating adipocyte phenotype and are major contributors to both local and circulating cytokines in the setting of obesity36. Notably, the visceral adipose tissue of HFD-fed Rip-cre+ Ptenflox/flox mice showed abundant crown-like struc-tures and macrophage Emr1 (F4/80) gene expression (Fig. 5a,b and Supplementary Fig. 2b). However, similar to the M2 predominance in their peritoneal macrophages, the ATMs of these mice demon-strated high expression of M2 markers (Chil3, Mgl2, Mrc2 and Arg1) (Fig. 5c), along with low expression of M1 markers (Ccl2, Il1b and Tnf) in the stromal vascular fraction (SVF) (Fig. 5d). Notably, we observed no change in Pten or pAkt expression in the ATMs of Rip-cre+ Ptenflox/flox mice (Supplementary Fig. 2b), emphasizing that the effects observed in the ATMs were not due to nonspecific deletion of Pten in the hematopoietic linage.
To determine the effects of the anti-inflammatory reflex on T cell functional parameters, we first measured interferon-γ (Ifn-γ) expres-sion by intracellular flow cytometry. A lower percentage of CD4 T cells from the spleen and subcutaneous and visceral adipose depots showed Ifn-γ expression in Rip-cre+ Ptenflox/flox mice compared to in littermate controls (Fig. 5e). This observation is consistent with less T helper type 1 (TH1) cell polarization, which is in keeping with the attenuated M1 macrophages in these mice. CD8 T cells from
these compartments also showed a similar trend (Supplementary Fig. 4a,b). We observed a trend to a higher percentage of regulatory T (Treg) cells, as assessed by the presence of Foxp3, within the visceral adipose tissue, but this trend did not occur in the spleen or lymph nodes (Supplementary Fig. 4c–e). In line with the comparable pro-portion of Treg cells, the levels of pAkt from activated lymphocytes also showed no statistically significant difference between control and Rip-cre+ Ptenflox/flox mice (Supplementary Fig. 4f). Notably, endo-genous Pten protein levels were not changed to account for any dif-ferences in T cell parameters (Supplementary Fig. 4f). Furthermore, CD44, a marker of T cell activation and memory, showed reduced expression in both CD4 and CD8 T cells isolated from visceral fat pads (Supplementary Fig. 4g–i), whereas CD69 expression (data not shown) and the overall numbers of T and B lymphocytes in the thy-mus, spleen and bone marrow of Rip-cre+ Ptenflox/flox mice remained similar to those in controls (Supplementary Fig. 5). Together these data are consistent with splenic vagal activation in mediating an anti-inflammatory reflex, resulting in alternatively activated macrophages and reduction in TH1 cell polarization, leading to overall attenuation in inflammation.
Increased adipogenesis in Rip-cre+ Ptenflox/flox miceThe role of M2 macrophages in anti-inflammation is well appreciated, as they enhance insulin sensitivity, tissue repair and growth37. In line with these functions of M2 macrophages, Rip-cre+ Ptenflox/flox mice showed increased adipogenesis compared to controls, particularly within the visceral adipose depots. Adipocytes in these depots were smaller in size (Fig. 5a), with higher expression of genes involved in adipogenesis such as Pparg, Ppargc1a and Adipoq (Fig. 5f). Circulating adiponectin levels were also elevated. Serum leptin levels were higher, reflecting massive adiposity (Fig. 2e). Notably, the expression of lipo-genic genes (Fasn and Srebf1) as well as a lipolytic gene (Pnpla2) was also elevated (Fig. 5f), which was in keeping with high insulin sen-sitivity, whereas the expression of thermogenic Ucp1 gene, a marker for brown fat, was unchanged (Fig. 5f). These changes were limited to the visceral depot, and adipogenesis genes in the subcutaneous compartment were not significantly affected in Rip-cre+ Ptenflox/flox mice (Supplementary Fig. 6a–e).
0
40
80
120
015 30 45 60 120
Per
cent
age
ofba
selin
ebl
ood
gluc
ose
Time after insulininjection (min)
** * * *0
10
20
30
015 30 45 60 120
Blo
od g
luco
se(m
M)
Time after glucoseinjection (min)
* * * * **
d
02468
1012
0 1 2 3 4 5 6 7
Fas
ting
bloo
dgl
ucos
e (m
mol
l–1)
Time on high fat diet(months)
* * * * * * * *
cHFD Pten+/+
HFD Pten–/–
aMec Pten+/+
Mec Pten–/–
0
40
80
120
0 15304560 120Time after insulin injection
(min)
0
40
80
120
0 15304560 120
Per
cent
age
ofba
sal b
lood
glu
cose
Per
cent
age
ofba
sal b
lood
glu
cose
Time after insulin injection(min)
Saline Pten+/+
Saline Pten–/–
*
**
Pten+/– Chrna7+/+Pten+/+ Chrna7+/+b
0
40
80
120
0 15 30 45 60 120
Per
cent
age
of b
asal
bloo
d gl
ucos
e
Time after insulin injection(min)
** *
Time after insulin injection(min)
0
40
80
120
0 15 30 45 60 120
Per
cent
age
of b
asal
bloo
d gl
ucos
e
Pten+/+ Chrna7–/–
Pten+/– Chrna7–/–
HFD
Chow
Pten+/+ Pten–/–eFigure 4 Improved insulin sensitivity in Rip-cre+ Ptenflox/flox mice is dependent on cholinergic activation and is present after HFD. (a) ITT of chow-fed Rip-cre+ Pten+/+ (Pten+/+) and Rip-cre+ Ptenflox/flox (Pten−/−) mice after treatment with either saline (left) or mecamylamine (right) (n = 10 per group). (b) ITT of chow-fed Rip-cre+ Pten+/+ Chrna7+/+ (Pten+/+ Chrna7+/+) and Rip-cre+ Pten+/flox Chrna7+/+ (Pten+/− Chrna7+/+) mice (left, n = 10 per group). ITT of chow-fed Rip-cre+ Pten+/+ Chrna7−/− (Pten+/+ Chrna7−/−) and Rip-cre+ Pten+/flox Chrna7−/− (Pten+/− Chrna7−/−) mice (right, n = 7 per group). (c) Fasting blood glucose levels of Pten+/+ and Pten−/− mice on 7 months of HFD starting at 2 months of age (n = 15 per group). (d) GTT of Pten+/+ and Pten−/− mice after 7 months of HFD (left, n = 15 per group) and ITT of Pten+/+ and Pten−/− mice after 7 months of HFD (right, n = 15 per group). (e) Representative Oil Red O–stained liver sections of Pten+/+ and Pten−/− mice on either chow or HFD (scale bars, 80 µm). All data are presented as the means ± s.e.m. *P < 0.05, **P < 0.01 (independent-sample t test).
nature medicine VOLUME 20 | NUMBER 5 | MAY 2014 489
In keeping with their higher insulin sensitivity compared to littermate controls, Rip-cre+ Ptenflox/flox mice exhibited fat accumu-lation preferentially in the subcutaneous compartment after HFD challenge (Fig. 5g–i and Supplementary Fig. 6b). Additionally, these mice gained more weight, which was associated lower energy expenditure, when compared to control mice fed HFD (Supplementary Fig. 7a–h). Given that leptin is a well-known central mediator of energy expenditure, partly through RIP-Cre neurons33, we assessed whether Pten-deficient RIP-Cre neurons had a defect in their leptin response to potentially account for the decreased energy expenditure in Rip-cre+ Ptenflox/flox mice. Indeed, leptin injection suppressed food intake similarly between genotypes (Supplementary Fig. 7i). However, the overall weight loss during leptin treatment was markedly blunted in Rip-cre+ Ptenflox/flox mice, suggesting an impairment of the expected leptin-induced increase in metabolic rate (Supplementary Fig. 7j). In support of these findings, constitutive PI3K activation in leptin-responsive neurons has been shown to cause hyperpolarization and subse-quent neuronal silencing by activating K+-ATP channels, thereby resulting in obesity38. Our findings are also in keeping with the
well-established notion that leptin-stimulated Stat3 and PI3K signaling preferentially modulate food intake and metabolism, respectively39. Together our data suggest that the weight gain in Rip-cre+ Ptenflox/flox mice was due at least in part to a defect in central leptin action, whereas the fat accumulation in the subcutaneous compartment reflected greater insulin sensitivity, probably due to higher levels of insulin-sensitizing adipokines.
Rip-cre+ Ptenflox/flox macrophages increase insulin sensitivityTo assess whether macrophages had a causal role in improving insulin sensitivity in Rip-cre+ Ptenflox/flox mice, we depleted their macrophages using liposome-encapsulated clodronate (Fig. 6a,b), which abolished their greater insulin sensitivity (Fig. 6c). Notably, the higher levels of adipogenic markers (Pparg, Ppargc1a, Lep and Adipoq) present in the visceral adipose tissue of Rip-cre+ Ptenflox/flox mice were also attenuated after macrophage depletion (Fig. 6d), and there were no notable adverse effects after clodronate treatment (Supplementary Fig. 8a–h). Together these results support the causal role of ATMs in determining adipocyte phenotype and their favorable metabolic profiles in Rip-cre+ Ptenflox/flox mice.
Figure 5 HFD-fed Rip-cre+ Ptenflox/flox mice demonstrate greater M2 macrophage infiltration and adipogenesis in the visceral compartment. (a) Representative H&E-stained visceral adipose tissue sections (left; scale bars, 200 µm) and quantification of adipocyte size (right) in Rip-cre+ Pten+/+ (Pten+/+) and Rip-cre+ Ptenflox/flox (Pten−/−) mice on chow or HFD (n = 6 per group). (b) Quantitative PCR of Emr1 transcript levels in visceral adipocytes of Pten+/+ and Pten−/− mice on chow or HFD (n = 6 per group). (c) Quantitative PCR of Chil3, Mgl2, Mrc2 and Arg1 transcript levels of adipocytes (Adipo) and the SVF from HFD-fed Pten+/+ and Pten−/− mice (n = 6 per group). AU, arbitrary units. (d) Quantitative PCR of Ccl2, Il1b and Tnf transcript levels of adipocytes and the SVF from HFD-fed Pten+/+ and Pten−/− mice (n = 6 per group). (e) Phorbol myristate acetate (PMA)-stimulated Ifn-γ production by CD4+ T cells isolated from the spleen (left), lymph node (LN) (center) and visceral (VIS) and subcutaneous (SQ) adipose tissue (right) of two to three pooled Pten+/+ and Pten−/− mice on HFD (n = 4 per group). (f) Gene expression of markers for adipogenesis (Pparg, Ppargc1a, Adipoq, Lep, Cebpa and Fabp4), lipogenesis (Fasn and Srebf1), lipolysis (Lipe and Pnpla2), inflammation (Tnf) and thermogenesis (Ucp1) (n = 6 per group). (g) Representative magnetic resonance imaging (MRI) and dual-energy X-ray absorptiometry (DEXA) images of Pten+/+ and Pten−/− mice after 7 months on HFD starting at 2 months of age (scale bars, 75 mm). (h) Percentage body fat of Pten+/+ and Pten−/− mice after 7 months of HFD by DEXA (n = 5). (i) Quantification of VIS and SQ adipose tissue in cross-sectional areas of MRIs of Pten+/+ and Pten−/− mice (n = 5). All data are presented as the means ± s.e.m. *P < 0.05, **P < 0.01 (independent-sample t test).np
490 VOLUME 20 | NUMBER 5 | MAY 2014 nature medicine
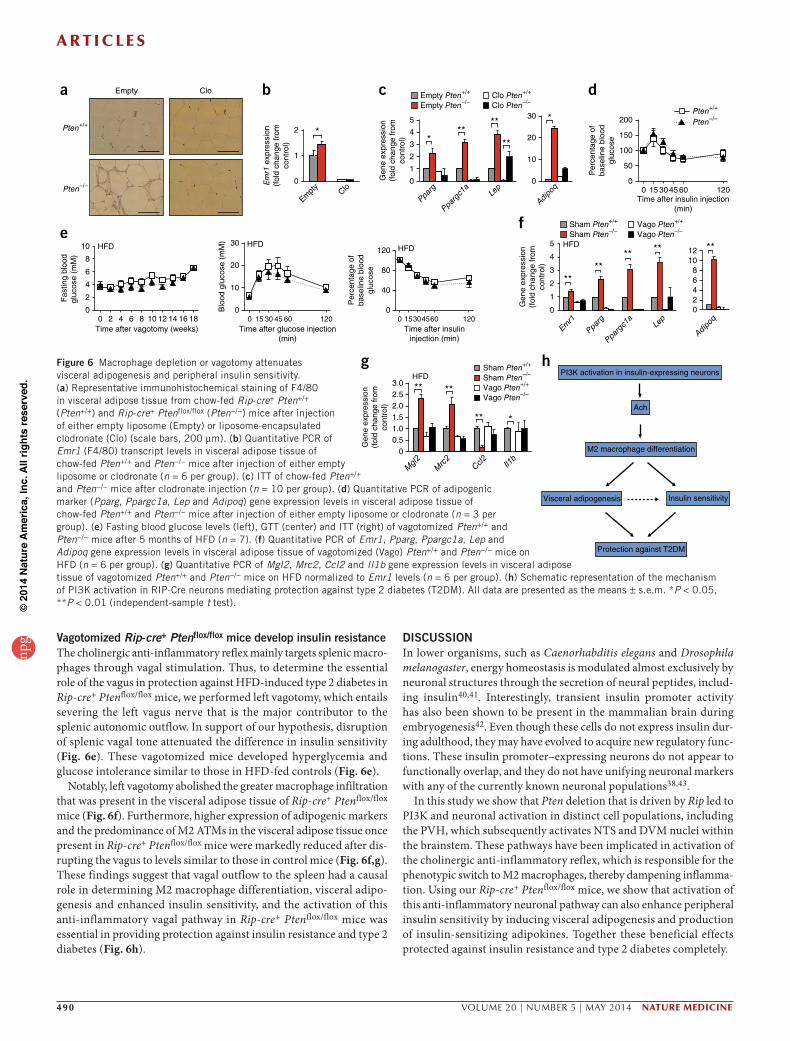
Vagotomized Rip-cre+ Ptenflox/flox mice develop insulin resistanceThe cholinergic anti-inflammatory reflex mainly targets splenic macro-phages through vagal stimulation. Thus, to determine the essential role of the vagus in protection against HFD-induced type 2 diabetes in Rip-cre+ Ptenflox/flox mice, we performed left vagotomy, which entails severing the left vagus nerve that is the major contributor to the splenic autonomic outflow. In support of our hypothesis, disruption of splenic vagal tone attenuated the difference in insulin sensitivity (Fig. 6e). These vagotomized mice developed hyperglycemia and glucose intolerance similar to those in HFD-fed controls (Fig. 6e).
Notably, left vagotomy abolished the greater macrophage infiltration that was present in the visceral adipose tissue of Rip-cre+ Ptenflox/flox mice (Fig. 6f). Furthermore, higher expression of adipogenic markers and the predominance of M2 ATMs in the visceral adipose tissue once present in Rip-cre+ Ptenflox/flox mice were markedly reduced after dis-rupting the vagus to levels similar to those in control mice (Fig. 6f,g). These findings suggest that vagal outflow to the spleen had a causal role in determining M2 macrophage differentiation, visceral adipo-genesis and enhanced insulin sensitivity, and the activation of this anti-inflammatory vagal pathway in Rip-cre+ Ptenflox/flox mice was essential in providing protection against insulin resistance and type 2 diabetes (Fig. 6h).
DISCUSSIONIn lower organisms, such as Caenorhabditis elegans and Drosophila melanogaster, energy homeostasis is modulated almost exclusively by neuronal structures through the secretion of neural peptides, includ-ing insulin40,41. Interestingly, transient insulin promoter activity has also been shown to be present in the mammalian brain during embryogenesis42. Even though these cells do not express insulin dur-ing adulthood, they may have evolved to acquire new regulatory func-tions. These insulin promoter–expressing neurons do not appear to functionally overlap, and they do not have unifying neuronal markers with any of the currently known neuronal populations38,43.
In this study we show that Pten deletion that is driven by Rip led to PI3K and neuronal activation in distinct cell populations, including the PVH, which subsequently activates NTS and DVM nuclei within the brainstem. These pathways have been implicated in activation of the cholinergic anti-inflammatory reflex, which is responsible for the phenotypic switch to M2 macrophages, thereby dampening inflamma-tion. Using our Rip-cre+ Ptenflox/flox mice, we show that activation of this anti-inflammatory neuronal pathway can also enhance peripheral insulin sensitivity by inducing visceral adipogenesis and production of insulin-sensitizing adipokines. Together these beneficial effects protected against insulin resistance and type 2 diabetes completely.
0
10
20
30
0 15 30 45 60 120
Blo
od g
luco
se (
mM
)
Time after glucose injection(min)
HFD
0
40
80
120
0 15304560 120
Per
cent
age
ofba
selin
e bl
ood
gluc
ose
Time after insulininjection (min)
HFD
0
2
4
6
8
10
0 2 4 6 8 10 12 14 16 18
Fas
ting
bloo
dgl
ucos
e (m
M)
Time after vagotomy (weeks)
eHFD
hPI3K activation in insulin-expressing neurons
Ach
M2 macrophage differentiation
Insulin sensitivityVisceral adipogenesis
Protection against T2DM
0
1
2
Empt
yClo
Emr1
exp
ress
ion
(fol
d ch
ange
from
cont
rol)
b
*Pten+/+
Pten–/–
a CloEmpty
0
Pparg
Ppargc1a Le
p
Adipoq
1
2
3
4
5
Gen
e ex
pres
sion
(fol
d ch
ange
from
cont
rol)
0
10
20
30
***
c
***
**
Empty Pten+/+
Empty Pten–/–Clo Pten+/+
Clo Pten–/–
Pparg
Emr1
Ppargc1a Le
p
Adipoq
02468
1012
0
1
2
3
4
5
Gen
e ex
pres
sion
(fol
d ch
ange
from
cont
rol)
fHFD
****
** ** **
Sham Pten+/+
Sham Pten–/–Vago Pten+/+
Vago Pten–/–
Mgl2
Mrc2
Ccl2 Il1
b
g
00.51.01.52.02.53.0
Gen
e ex
pres
sion
(fol
d ch
ange
from
cont
rol)
HFD
**
*
**
**
Sham Pten+/+
Sham Pten–/–
Vago Pten+/+
Vago Pten–/–
0
50
100
150
200
0 15304560 120
Per
cent
age
ofba
selin
e bl
ood
gluc
ose
Time after insulin injection(min)
Pten+/+
Pten–/–
d
Figure 6 Macrophage depletion or vagotomy attenuates visceral adipogenesis and peripheral insulin sensitivity. (a) Representative immunohistochemical staining of F4/80 in visceral adipose tissue from chow-fed Rip-cre+ Pten+/+ (Pten+/+) and Rip-cre+ Ptenflox/flox (Pten−/−) mice after injection of either empty liposome (Empty) or liposome-encapsulated clodronate (Clo) (scale bars, 200 µm). (b) Quantitative PCR of Emr1 (F4/80) transcript levels in visceral adipose tissue of chow-fed Pten+/+ and Pten−/− mice after injection of either empty liposome or clodronate (n = 6 per group). (c) ITT of chow-fed Pten+/+ and Pten−/− mice after clodronate injection (n = 10 per group). (d) Quantitative PCR of adipogenic marker (Pparg, Ppargc1a, Lep and Adipoq) gene expression levels in visceral adipose tissue of chow-fed Pten+/+ and Pten−/− mice after injection of either empty liposome or clodronate (n = 3 per group). (e) Fasting blood glucose levels (left), GTT (center) and ITT (right) of vagotomized Pten+/+ and Pten−/− mice after 5 months of HFD (n = 7). (f) Quantitative PCR of Emr1, Pparg, Ppargc1a, Lep and Adipoq gene expression levels in visceral adipose tissue of vagotomized (Vago) Pten+/+ and Pten−/− mice on HFD (n = 6 per group). (g) Quantitative PCR of Mgl2, Mrc2, Ccl2 and Il1b gene expression levels in visceral adipose tissue of vagotomized Pten+/+ and Pten−/− mice on HFD normalized to Emr1 levels (n = 6 per group). (h) Schematic representation of the mechanism of PI3K activation in RIP-Cre neurons mediating protection against type 2 diabetes (T2DM). All data are presented as the means ± s.e.m. *P < 0.05, **P < 0.01 (independent-sample t test).
nature medicine VOLUME 20 | NUMBER 5 | MAY 2014 491
It is well appreciated that macrophages are important in modulat-ing inflammation and have been recognized more recently to regulate metabolism. Mice with macrophage-specific peroxisome proliferator activated receptor-γ (PPAR-γ) or PPAR-δ depletion showed a consid-erable attenuation of alternatively activated M2 macrophages, lead-ing to adipocyte dysfunction and insulin resistance44,45. Similarly, humans treated with PPAR-γ agonists showed differentiation of monocytes into M2 macrophages that was associated with insulin-sensitizing effects46. In addition to ATMs, adipose-resident T and B lymphocytes have also been shown to have a role in modulating energy metabolism in the setting of diet-induced obesity47–50. In our Rip-cre+ Ptenflox/flox mice, the number of these immune cells was not markedly different in the adipose tissues, bone marrow or peripheral immune organs. Their proinflammatory function, however, appeared to be suppressed, which is consistent with anti-inflammatory reflex activation and attenuation of M1 macrophage differentiation, lead-ing to skewing away from TH1 lymphocyte polarization in Rip-cre+ Ptenflox/flox mice.
The cholinergic anti-inflammatory pathway is the efferent branch of the autonomic nervous system that is controlled at the brainstem. The main targets that are implicated in this anti-inflammatory path-way are the splenic macrophages, such that vagotomy of the splenic nerve substantially attenuates the anti-inflammatory effects12,13. In Rip-cre+ Ptenflox/flox mice, similar disruption of the left vagus abolished the M2 skewing of both the circulating macrophages and ATMs. However, the possibility of direct local vagal innervation to the adipose tissue still remains. Adipose vagal stimulation has been shown to be essential in mediating adipogenesis and tissue insulin sensitivity22. Furthermore, parasympathetic stimulation through the nicotinic receptor has been shown to increase lipolysis and adipocyte differentiation51. Collectively, these findings are consistent with the vagus stimulating visceral adipogenesis and adipocyte differentia-tion in Rip-cre+ Ptenflox/flox mice, either directly or indirectly through the spleen.
Acetylcholine signaling has been shown to be essential in mediat-ing the anti-inflammatory phenotype of macrophages such that M2 differentiation is prevented after bone marrow transplantation from mice lacking functional nAchR52. In Rip-cre+ Ptenflox/flox mice, higher Jak2-Stat3 signaling was observed in the spleen, which was reversed through pharmacological blockade of nAchR activation. Similarly, the M2 macrophage polarization and insulin sensitivity in these mice were also abolished after disruption of nAchR activation. In keeping with the essential role of nAchR activation, the α7nAchR-null muta-tion in Rip-cre+ Ptenflox/flox mice abolished their enhanced insulin sensitivity.
Interestingly, Rip-cre+ Ptenflox/flox mice demonstrated high insulin sensitivity with a paradoxical weight gain when fed HFD. The weight gain in Rip-cre+ Ptenflox/flox mice was likely due to impaired central leptin-mediated regulation in energy expenditure39 with a disruption in the compensatory increase in metabolic rate. This impairment was probably due to constitutive PI3K signaling in RIP-Cre neurons, lead-ing to K+-ATP channel activation and subsequent neuronal silencing, a mechanism that has been demonstrated in a similar diet-induced obesity model38. Thus, on one hand, Rip-cre mediated Pten deletion activates the anti-inflammatory reflex, leading to reduced inflam-mation and insulin sensitization. On the other hand, the resultant PI3K activation in RIP-Cre neurons impairs central leptin action, leading to a reduced metabolic rate and obesity. However, because of their enhanced insulin sensitivity, fat accumulation occurs pre-dominately in the healthy subcutaneous compartment, much like in
healthy obese individuals, thereby dissociating insulin resistance from obesity53–55.
Our study shows that RIP-Cre neurons that are probably evolu-tionarily primitive and have insulin promoter activity are integral in linking the autonomic nervous system to the fundamental control of metabolism. These cells, together with evolutionarily modern pan-creatic beta cells, are critical for determining insulin sensitivity and glucose homeostasis, the two fundamental defects in the pathogenesis of type 2 diabetes. The integrative role of Pten in these specific neu-ronal cells outlined in this study and that of pancreatic beta cells26 illustrate the intricate functions of potentially commonly derived cells in evolution to assume distinct biological roles to meet the demands of higher organisms while providing new paradigms and guidance for a better understanding of the complexity of type 2 diabetes.
METHODSMethods and any associated references are available in the online version of the paper.
Note: Any Supplementary Information and Source Data files are available in the online version of the paper.
ACknOWLEDGMEnTSWe thank Y. Dor (Department of Developmental Biology and Cancer Research, The Institute for Medical Research Israel-Canada, The Hebrew University-Hadassah Medical School) for providing the Pdx1-Cre-ER mice. This work was supported by grants to M.W. from the Canadian Institutes of Health Research (CIHR; MOP-93707) and the Canadian Diabetes Association (CDA). M.W. holds a Canada Research Chair in Signal Transduction in Diabetes Pathogenesis. M.G.M.Jr. was supported by a grant from the US National Institutes of Health (DK57768). Support was also received from grants to D.A.W. from the CIHR (MOP-119414) and CDA. L.W. was supported by Frederick Banting and Charles Best Canada Graduate Scholarship from CIHR, a Novo Nordisk Graduate Scholarship from the Banting and Best Diabetes Centre, a Canada Graduate Scholarship from the Natural Sciences and Engineering Research Council of Canada (NSERC) and a Comprehensive Research Experience for Medical Students (CREMS) Scholarship from the Faculty of Medicine, University of Toronto. S.T. was supported by a Toronto General Research Institute Postdoctoral Fellowship. C.T.L. is supported by the Eliot Phillipson Clinician Scientist Training Program and a Banting and Best Diabetes Centre Postdoctoral Fellowship.
AUTHOR COnTRIBUTIOnSL.W. performed experiments, analyzed data, wrote the manuscript and contributed to the study concept. D.O., S.T., M.B.A., A.J.E. and C.F. performed experiments, analyzed data and prepared data for presentation. C.T.L. analyzed data and edited the manuscript. S.A.S. developed methods and animal models and performed experiments. A.S. and T.W.M. developed animal models. C.J.P., D.A.W. and M.G.M.Jr. contributed to study design, discussion and the manuscript. M.W. supervised the project, developed the study concept and edited the manuscript.
COMPETInG FInAnCIAL InTERESTSThe authors declare no competing financial interests.
Reprints and permissions information is available online at http://www.nature.com/reprints/index.html.
2. Shoelson, S.E., Lee, J. & Goldfine, A.B. Inflammation and insulin resistance. J. Clin. Invest. 116, 1793–1801 (2006).
3. Osborn, O. & Olefsky, J.M. The cellular and signaling networks linking the immune system and metabolism in disease. Nat. Med. 18, 363–374 (2012).
4. Xu, H. et al. Chronic inflammation in fat plays a crucial role in the development of obesity-related insulin resistance. J. Clin. Invest. 112, 1821–1830 (2003).
5. Weisberg, S.P. et al. Obesity is associated with macrophage accumulation in adipose tissue. J. Clin. Invest. 112, 1796–1808 (2003).
6. Kanda, H. et al. MCP-1 contributes to macrophage infiltration into adipose tissue, insulin resistance, and hepatic steatosis in obesity. J. Clin. Invest. 116, 1494–1505 (2006).
7. Weisberg, S.P. et al. CCR2 modulates inflammatory and metabolic effects of high-fat feeding. J. Clin. Invest. 116, 115–124 (2006).
492 VOLUME 20 | NUMBER 5 | MAY 2014 nature medicine
8. Gordon, S. & Taylor, P.R. Monocyte and macrophage heterogeneity. Nat. Rev. Immunol. 5, 953–964 (2005).
9. Mantovani, A. et al. The chemokine system in diverse forms of macrophage activation and polarization. Trends Immunol. 25, 677–686 (2004).
10. Bronte, V. & Zanovello, P. Regulation of immune responses by l-arginine metabolism. Nat. Rev. Immunol. 5, 641–654 (2005).
11. Van Ginderachter, J.A. et al. Classical and alternative activation of mononuclear phagocytes: picking the best of both worlds for tumor promotion. Immunobiology 211, 487–501 (2006).
12. Tracey, K.J. Reflex control of immunity. Nat. Rev. Immunol. 9, 418–428 (2009).13. Andersson, U. & Tracey, K.J. Reflex principles of immunological homeostasis.
Annu. Rev. Immunol. 30, 313–335 (2012).14. Sternberg, E.M. Neural regulation of innate immunity: a coordinated nonspecific
host response to pathogens. Nat. Rev. Immunol. 6, 318–328 (2006).15. Maier, S.F., Goehler, L.E., Fleshner, M. & Watkins, L.R. The role of the vagus nerve
in cytokine-to-brain communication. Ann. NY Acad. Sci. 840, 289–300 (1998).16. Groves, D.A. & Brown, V.J. Vagal nerve stimulation: a review of its applications and
potential mechanisms that mediate its clinical effects. Neurosci. Biobehav. Rev. 29, 493–500 (2005).
17. Borovikova, L.V. et al. Vagus nerve stimulation attenuates the systemic inflammatory response to endotoxin. Nature 405, 458–462 (2000).
18. Bernik, T.R. et al. Pharmacological stimulation of the cholinergic antiinflammatory pathway. J. Exp. Med. 195, 781–788 (2002).
19. Saeed, R.W. et al. Cholinergic stimulation blocks endothelial cell activation and leukocyte recruitment during inflammation. J. Exp. Med. 201, 1113–1123 (2005).
20. Huston, J.M. et al. Splenectomy inactivates the cholinergic antiinflammatory pathway during lethal endotoxemia and polymicrobial sepsis. J. Exp. Med. 203, 1623–1628 (2006).
21. de Jonge, W.J. et al. Stimulation of the vagus nerve attenuates macrophage activation by activating the Jak2-STAT3 signaling pathway. Nat. Immunol. 6, 844–851 (2005).
22. Kreier, F. et al. Selective parasympathetic innervation of subcutaneous and intra-abdominal fat—functional implications. J. Clin. Invest. 110, 1243–1250 (2002).
23. Watkins, L.R. & Maier, S.F. Immune regulation of central nervous system functions: from sickness responses to pathological pain. J. Intern. Med. 257, 139–155 (2005).
24. The, F. et al. Central activation of the cholinergic anti-inflammatory pathway reduces surgical inflammation in experimental post-operative ileus. Br. J. Pharmacol. 163, 1007–1016 (2011).
25. Choudhury, A.I. et al. The role of insulin receptor substrate 2 in hypothalamic and beta cell function. J. Clin. Invest. 115, 940–950 (2005).
26. Wang, L. et al. Deletion of Pten in pancreatic β-cells protects against deficient β-cell mass and function in mouse models of type 2 diabetes. Diabetes 59, 3117–3126 (2010).
27. Song, J., Xu, Y., Hu, X., Choi, B. & Tong, Q. Brain expression of Cre recombinase driven by pancreas-specific promoters. Genesis 48, 628–634 (2010).
28. Wicksteed, B. et al. Conditional gene targeting in mouse pancreatic β-cells: analysis of ectopic Cre transgene expression in the brain. Diabetes 59, 3090–3098 (2010).
29. Backman, S.A. et al. Deletion of Pten in mouse brain causes seizures, ataxia and defects in soma size resembling Lhermitte-Duclos disease. Nat. Genet. 29, 396–403 (2001).
30. Nguyen, K.T. et al. Essential role of Pten in body size determination and pancreatic beta-cell homeostasis in vivo. Mol. Cell. Biol. 26, 4511–4518 (2006).
31. Petersen, A.M. & Pedersen, B.K. The anti-inflammatory effect of exercise. J. Appl. Physiol. 98, 1154–1162 (2005).
32. Petersen, A.M. & Pedersen, B.K. The role of IL-6 in mediating the anti-inflammatory effects of exercise. J. Physiol. Pharmacol. 57 (suppl. 10), 43–51 (2006).
33. Kubota, N. et al. Insulin receptor substrate 2 plays a crucial role in beta cells and the hypothalamus. J. Clin. Invest. 114, 917–927 (2004).
34. Stanger, B.Z. et al. Pten constrains centroacinar cell expansion and malignant transformation in the pancreas. Cancer Cell 8, 185–195 (2005).
35. Cantley, J. et al. Pancreatic deletion of insulin receptor substrate 2 reduces beta and alpha cell mass and impairs glucose homeostasis in mice. Diabetologia 50, 1248–1256 (2007).
36. Lumeng, C.N., Bodzin, J.L. & Saltiel, A.R. Obesity induces a phenotypic switch in adipose tissue macrophage polarization. J. Clin. Invest. 117, 175–184 (2007).
37. Bourlier, V. et al. Remodeling phenotype of human subcutaneous adipose tissue macrophages. Circulation 117, 806–815 (2008).
38. Plum, L. et al. Enhanced PIP3 signaling in POMC neurons causes KATP channel activation and leads to diet-sensitive obesity. J. Clin. Invest. 116, 1886–1901 (2006).
39. Münzberg, H. & Myers, M.G. Jr. Molecular and anatomical determinants of central leptin resistance. Nat. Neurosci. 8, 566–570 (2005).
40. Rulifson, E.J., Kim, S.K. & Nusse, R. Ablation of insulin-producing neurons in flies: growth and diabetic phenotypes. Science 296, 1118–1120 (2002).
41. Kodama, E. et al. Insulin-like signaling and the neural circuit for integrative behavior in C. elegans. Genes Dev. 20, 2955–2960 (2006).
42. Gannon, M., Shiota, C., Postic, C., Wright, C.V. & Magnuson, M. Analysis of the Cre-mediated recombination driven by rat insulin promoter in embryonic and adult mouse pancreas. Genesis 26, 139–142 (2000).
43. Plum, L. et al. Enhanced leptin-stimulated Pi3k activation in the CNS promotes white adipose tissue transdifferentiation. Cell Metab. 6, 431–445 (2007).
44. Odegaard, J.I. et al. Macrophage-specific PPARγ controls alternative activation and improves insulin resistance. Nature 447, 1116–1120 (2007).
45. Odegaard, J.I. et al. Alternative M2 activation of Kupffer cells by PPARδ ameliorates obesity-induced insulin resistance. Cell Metab. 7, 496–507 (2008).
46. Bouhlel, M.A. et al. PPARγ activation primes human monocytes into alternative M2 macrophages with anti-inflammatory properties. Cell Metab. 6, 137–143 (2007).
47. Winer, S. et al. Normalization of obesity-associated insulin resistance through immunotherapy. Nat. Med. 15, 921–929 (2009).
48. Winer, D.A. et al. B cells promote insulin resistance through modulation of T cells and production of pathogenic IgG antibodies. Nat. Med. 17, 610–617 (2011).
49. Feuerer, M. et al. Lean, but not obese, fat is enriched for a unique population of regulatory T cells that affect metabolic parameters. Nat. Med. 15, 930–939 (2009).
50. Mauer, J. et al. Myeloid cell–restricted insulin receptor deficiency protects against obesity-induced inflammation and systemic insulin resistance. PLoS Genet. 6, e1000938 (2010).
51. Andersson, K. & Arner, P. Cholinoceptor-mediated effects on glycerol output from human adipose tissue using in situ microdialysis. Br. J. Pharmacol. 115, 1155–1162 (1995).
52. Olofsson, P.S. et al. α7 nicotinic acetylcholine receptor (α7nAChR) expression in bone marrow–derived non-T cells is required for the inflammatory reflex. Mol. Med. 18, 539–543 (2012).
53. Kim, J.Y. et al. Obesity-associated improvements in metabolic profile through expansion of adipose tissue. J. Clin. Invest. 117, 2621–2637 (2007).
54. Primeau, V. et al. Characterizing the profile of obese patients who are metabolically healthy. Int. J. Obes. (Lond.) 35, 971–981 (2011).
55. Karelis, A.D. et al. The metabolically healthy but obese individual presents a favorable inflammation profile. J. Clin. Endocrinol. Metab. 90, 4145–4150 (2005).
ONLINE METHODSMice. Ptenflox/flox mice were mated with Rip-cre mice26,56 (cre transgene under the control of the rat insulin 2 promoter TgN[ins2-cre]25Mgn from Jackson Laboratories) and Pdx1-Cre-ER mice34 (cre-Esr1 ligand binding domain con-struct under the control of the Pdx1 promoter, gift from Y. Dor). Rip-cre+ Pten+/flox mice or Pdx1-Cre-ER Pten+/flox mice were intercrossed to generate Rip-cre+ Pten+/+ controls and Rip-cre+ Ptenflox/flox mice or Pdx1-Cre-ER Pten+/+ controls and Pdx1-Cre-ER Ptenflox/flox mice, respectively. Rip-cre+ Pten+/flox mice were crossed to Chrna7 (α7nAchR)−/− mice (Jackson Laboratories) to obtain Rip-cre+ Pten+/flox Chrna7−/− mice, which were then intercrossed to generate Rip-cre+ Pten+/flox Chrna7+/+, Rip-cre+ Pten+/+ Chrna7+/+, Rip-cre+ Pten+/flox Chrna7−/− and Rip-cre+ Pten+/+ Chrna7−/− mice. Only male mice were used for experiments, and littermates were used as controls. No rand-omization or blinding was employed. Genotypes for the cre and Pten genes were determined with PCR using ear clip DNA as described previously57. PCR primer sequences and reaction conditions are available by request. Cre-ER was activated by intraperitoneal (i.p.) tamoxifen injection (10 mg/ml of peanut oil) at 270 µl per day for 12 d. Pancreatic islets and hypothalami were isolated 8–10 weeks after tamoxifen activation. All mice were maintained on a mixed 129J-C57BL/6 background and housed in a pathogen-free facility on a 12-h light, 12-h dark cycle and fed ad libitum with standard irradiated rodent chow (5% fat; Harlan Tecklad, Indianapolis, IN) without restriction on activity in accordance with Ontario Cancer Institute and Toronto General Research Institute Animal Care Facility Protocols.
Vagotomy. The left vagus nerve was severed, and 0.5 cm of the nerve was removed to prevent regeneration. All mice were 2 months of age when vagotomy was performed.
HFD feeding. HFD (60% kcal from fat; Bio-Serv, F3282) (total, 5.49 kcal/g; protein, 0.82 kcal/g; fat, 3.24 kcal/g; carbohydrate, 1.43 kcal/g) for Rip-cre+ Pten+/+ and Rip-cre+ Ptenflox/flox mice started at 2 months of age and continued for 7 months. HFD for vagotomized mice started 10 d after surgery and continued for 5 months.
Metabolic studies, hormone measurements and body composition analysis. All overnight fasts were carried out between 5 p.m. and 10 a.m. All blood glucose tests, GTTs and ITTs were performed on overnight-fasted animals as described previously58. Serum adiponectin, leptin, corticosterone, TNF-α, IL-6 and IL-10 were measured by Pierce Searchlight Protein Analysis (Perbio Science, Woburn, MA). DEXA body composition tests were carried out at the Toronto Centre for Phenogenomics (Toronto, Ontario, Canada) using a PIXI-mus Small Animal Densitometer (LUNAR, Madison, WI). Metabolic activities were measured for 24 h using a comprehensive animal metabolic system (CLAMS, Columbus Instruments, Columbus, OH). O2 consumption and CO2 emission were normal-ized to body weight and are presented for the light (7 a.m. to 7 p.m.) and dark (7 p.m. to 7 a.m.) cycles. For leptin administration studies, mice were caged individually, and murine leptin (PeproTech, Rocky Hill, NJ) was injected i.p. (2.5 mg per kg body weight) twice daily (9 a.m. and 6 p.m.) for 2 d. Body weight and food intake were measured daily before injection, during the treatment period and after a 3-d wash-out period after injections.
MRI. MRI analysis was carried by the Spatio-Temporal Targeting and Amplification of Radiation Response (STTAR) program (Toronto, Ontario, Canada) in accordance with the Ontario Cancer Institute Animal Care Protocol using a 7 Tesla BioSpec MRI system (Bruker Canada, Milton, Ontario, Canada) with the B-GA12 gradient system and a quadrature volume resonator RF trans-ceiver coil. Mice were oriented in a prone position on the associated rat slider bed and maintained with 2% isoflurane delivery through the nose cone. A respira-tory pillow provided physiological monitoring (SA Instruments, Stony Brook, NY). To accentuate contrast between fat and bounding tissues, two-dimensional RARE images were acquired as series of contiguous 1-mm-thick axial sections encompassing the umbilical abdominal region (echo time (TE)/repetition time (TR) = 56/5,200 ms, matrix size = 224 × 134 providing 225 × 225 µm in-plane resolution over a 50 × 30 mm field of view, 6 averages, approximate 8 min scan
time). MRI images from the umbilical region were used for intra-abdominal and subcutaneous adipose quantification with the Image J program.
Western blotting and quantitative PCR. Islets, hypothalami, liver, fat and mus-cle were isolated, and protein lysates were obtained as previously described30. For in vivo insulin stimulation, insulin was injected i.p. at 5 units per kg of body weight, and tissues were harvested 10 min after injection. Antibodies against Pten (1:1,000, NeoMarker, Fremont, CA, RB-10436-PI), Akt (1:1,000, Cell Signaling Technology, Beverly, MA, 9272), pAkt (Ser473) (1:1,000, Cell Signaling Technology, Beverly, MA, 9271), AMPK (1:1,000, Cell Signaling Technology, Beverly, MA, 2603), pAMPK (1:1,000, Cell Signaling Technology, Beverly, MA, 2535), FoxO1 (1:1,000, Santa Cruz Biotechnology, Santa Cruz, CA, sc-11350), pFoxO1 (1:1,000, Cell Signaling Technology, Beverly, MA, 9461), Jak2 (1:1,000, Cell Signaling Technology, Beverly, MA, 3230), pJak2 (1:1,000; Cell Signaling Technology, Beverly, MA, 3771), Pgc-1α (1:1,000, Cell Signaling Technology, Beverly, MA, 2178), Srebp-1c (1:1,000, Santa Cruz Biotechnology, Santa Cruz, CA, sc-8984), Stat3 (1:1,000, Cell Signaling Technology, Beverly, MA, 9132) and pStat3 (1:1,000, Cell Signaling Technology, Beverly, MA, 9145) were used. RNA was extracted with the RNeasy Plus Mini Kit (Qiagen, Valencia, CA) according to the protocol provided. cDNA was synthesized according to a protocol published elsewhere59. PCR was monitored in real time using the ABI Prism 7900HT Real-Time PCR system (Applied Biosystem). Experiments were performed in triplicates for each sample. Primer sequences are avail-able by request. Transcript levels were normalized against glyceraldehyde 3-phosphate dehydrogenase (GAPDH) and are expressed in arbitrary units rela-tive to littermate control levels.
Immunohistochemistry and morphological analyses. Adipose tissue was fixed in 4% paraformaldehyde in 0.1 M PBS (pH 7.4) overnight and then embedded. Adipocyte size was determined on H&E-stained sections using the microscopy software ImageJ. Adipocyte numbers were determined in a field of 1 mm2. Adipose tissue–resident Treg cells were detected by immunostaining for Foxp3 (eBiosciences) at 1:200 dilution overnight. Antigen retrieval for FoxP3 staining was performed in TE9 buffer (0.5 M Tris, 20 mM EDTA and 10 mM NaCl, pH 9.0). Primary antibodies were detected using an impress polymer–based immunohistochemistry kit (Vector labs). Positive stained cells were quantified per 200×-power field. Oil Red O staining was conducted on livers immersed in optimal cutting temperature compound (OCT) and immediately frozen using liquid nitrogen. Sections were fixed with 4% paraformaldehyde, washed with 60% isopropanol, stained with Oil Red O (Sigma) and then washed again with 60% isopropanol. Hypothalamic perfusion and immunohistochemistry were performed as previously described60. All bregma coordinates and abbreviations were taken from ref. 61.
Flow cytometry. Femurs and tibias were flushed with sterile PBS to obtain marrow. Spleen, thymus and axillary lymph nodes were forced through a 40-µm nylon cell strainer (BD Biosciences, Mississauga, Canada) in sterile PBS. After red blood cell lysis with NH4Cl solution, cells were washed with PBS and resuspended in PBS with 3% FCS. Cells were incubated for 20 min at 4 °C with combinations of the following antibodies conjugated to FITC, PE, allophycocyanin (APC), PerCP-Cy5.5 or biotin: CD4 (1:200 or 1:800, RM4-5, BioLegend), CD8 (1:300 or 1:800, 53-6.7, eBioscience), CD25 (1:400, PC61.5, BD Bioscience), B220 (1:600, RA3-6B2, BioLegend), IgM (1:400, 33.60, gener-ated in house), IgD (1:800, 11-26, eBioscience), CD11b (1:1,500, M1/70, eBio-science), GR1 (1:1,500, RB-6-8C5, eBioscience) and CD44 (1:100, Biolegend). Cells were washed and incubated for an additional 15 min with streptavidin PerCP (BioLegend). To detect FoxP3, cells were fixed, permeabilized and stained according to the instructions supplied with the reagent (buffer set eBioscience; antibody 1:5, 150D, eBioscience). For intracellular staining of Ifn-γ, cells were plated with or without a PMA and ionomycin cell-stimulation cocktail (eBio-science) with brefeldin A (eBioscience) for 5 h at 37 °C, followed by surface staining (CD45.2 1:200, CD3 1:100, CD4 1:100 and CD8 1:100), fixation and per-meabilization (eBioscience Foxp3 staining Buffer Set) and intracellular staining for Ifn-γ (Biolegend). Dead cells were excluded using the LIVE/DEAD Fixable Blue Dead Cell Stain (Life Technologies).
Liposome-encapsulated clodronate injection. 1 ml of either empty liposome or liposome-encapsulated clodronate (5 mg/ml) (Encapsula NanoSciences LLC, Nashville, TN) was injected i.p. into each mouse at 2 months of age. All experi-ments were carried out 10 d after injection.
Peritoneal macrophage isolation. 1 ml of thioglycollate (4%) was injected i.p. into each mouse at 2 months of age. Mice were euthanized with CO2 on the fifth day after injection. Their abdomens were washed with PBS to harvest peritoneal macrophages and centrifuged at 1,250 r.p.m. for 5 min.
Mecamylamine treatment. Mecamylamine hydrochloride (Sigma) was injected i.p. at a dose of 1 mg per kg body weight per day for 7 d. All experiments were carried out at the end of the treatment period.
Adipocyte-SVF separation. Collagenase solution (1 mg/ml) was added to adi-pose tissues, which were thoroughly minced and incubated at 37 °C on the mixer for 15–45 min and centrifuged at 500g for 10 min. Floating adipocytes were removed, and the pellet was used as the SVF.
Statistics. The sample size was estimated to be 10–15 per genotype for metabolic studies and 3–6 for protein and transcript expressions, as has been demonstrated
by previous publications to be adequate for animal studies. All data demon-strated a normal distribution and similar variation between groups. The exclu-sion criterion was set to be 1.5 s.d. from the mean. No data met this criterion, and thus all data points were included in the analysis. All data are presented as the means ± s.e.m. and were analyzed by independent-sample t test where appropriate. All data were analyzed using the statistical software package SPSS (version 11.0) for Macintosh.
56. Postic, C. et al. Dual roles for glucokinase in glucose homeostasis as determined by liver and pancreatic beta cell–specific gene knock-outs using Cre recombinase. J. Biol. Chem. 274, 305–315 (1999).
57. Wijesekara, N. et al. Muscle-specific Pten deletion protects against insulin resistance and diabetes. Mol. Cell. Biol. 25, 1135–1145 (2005).
58. Nguyen, K.T. et al. Essential role of Pten in body size determination and pancreatic beta-cell homeostasis in vivo. Mol. Cell. Biol. 26, 4511–4518 (2006).
59. Choi, D. et al. Erythropoietin protects against diabetes through direct effects on pancreatic beta cells. J. Exp. Med. 207, 2831–2842 (2010).
60. Münzberg, H. et al. Appropriate inhibition of orexigenic hypothalamic arcuate nucleus neurons independently of leptin receptor/STAT3 signaling. J. Neurosci. 27, 69–74 (2007).
61. Franklin, K.B.J. & Paxinos, G. The Mouse Brain in Sterotaxic Coordinates (Academic Press, New York, 2008).