DRAFT EPD INCOME DISTRIBUTION PROJECT DATA ON THEl DISTRIBUTION OF INCOME IN EL SALVADOR Jong-goo Park Divisi'on Working Paper No.1980-7 October 1980 Economic and Social Data Division Economic Analysis and Projections Department Development Policy Staff The World Bank Division Working Papers report on work in progress and are circulated for Bank staff use to stimulate discussion and comment. The views and interpretations in a Working Paper are those of the author and may not be attributed to the World Bank or its affiliated organizations. Public Disclosure Authorized Public Disclosure Authorized Public Disclosure Authorized Public Disclosure Authorized Public Disclosure Authorized Public Disclosure Authorized Public Disclosure Authorized Public Disclosure Authorized
Transcript
DRAFT
EPD INCOME DISTRIBUTION PROJECT
DATA ON THEl DISTRIBUTION OF INCOME IN EL SALVADOR
Jong-goo Park
Divisi'on Working Paper No.1980-7
October 1980
Economic and Social Data DivisionEconomic Analysis and Projections DepartmentDevelopment Policy StaffThe World Bank
Division Working Papers report on work in progress and are circulatedfor Bank staff use to stimulate discussion and comment. The views andinterpretations in a Working Paper are those of the author and may notbe attributed to the World Bank or its affiliated organizations.
Pub
lic D
iscl
osur
e A
utho
rized
Pub
lic D
iscl
osur
e A
utho
rized
Pub
lic D
iscl
osur
e A
utho
rized
Pub
lic D
iscl
osur
e A
utho
rized
Pub
lic D
iscl
osur
e A
utho
rized
Pub
lic D
iscl
osur
e A
utho
rized
Pub
lic D
iscl
osur
e A
utho
rized
Pub
lic D
iscl
osur
e A
utho
rized
DATA ON THE DISTRIBUTION OF INCOME
IN EL SALVADOR
This paper contains an evaluation of the data on the
distribution of income in El Salvador from a 1976/77 survey
of household budgets. The paper then adjusts data from the
survey, and derives a more representative distribution of
income for the country by household.
ECONOMIC AND SOCIAL DATA DIVISION
ECONOMIC ANALYSIS AND PROJECTIONS DEPARTMENT
OCTOBER 1980
TABLE OF CONTENTS
Page
I. Introduction ........... ........................... 1
II. The 1976/77 Survey of Household Budgets (ENPF) . 2
III. Evaluation of the 1976/77 ENPF . . . . . . . . . .. . 2
IV. Data Adjustment and Estimation of HouseholdIncome Distribution. . .............. 4
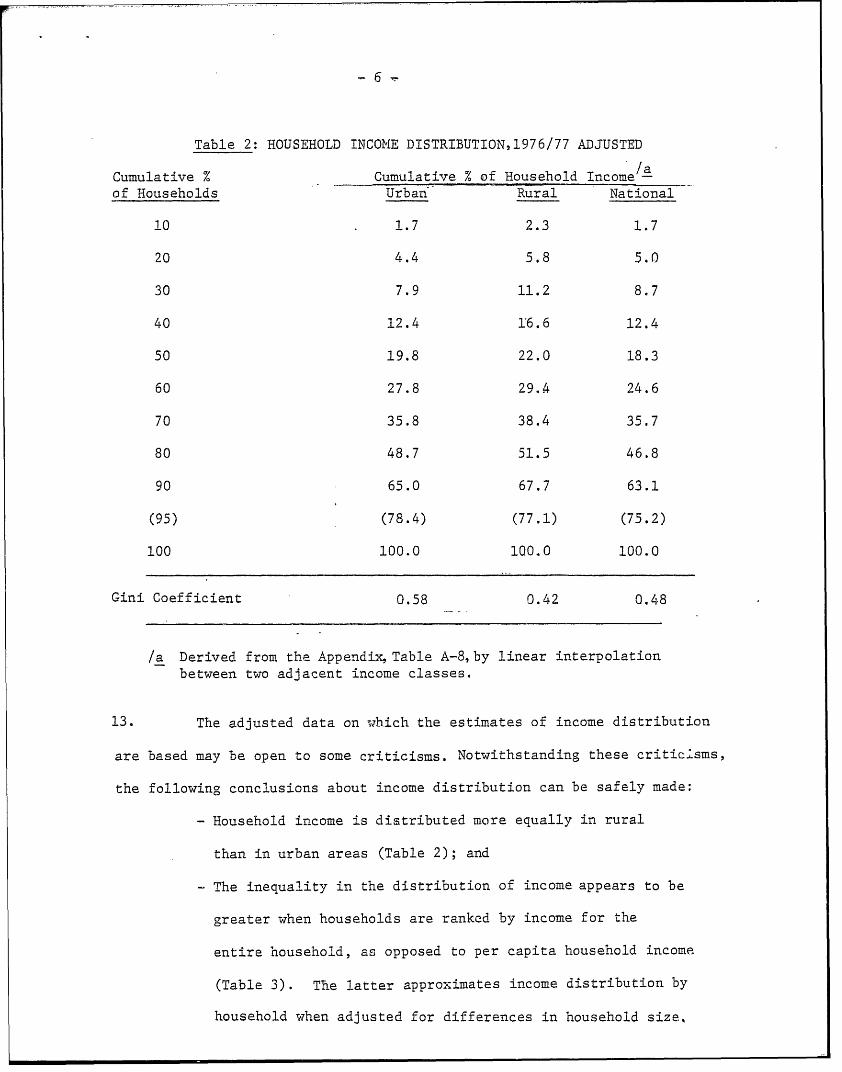
1. This paper briefly reviews the data on the distribution of income
in El Salvador and evaluates the country's 1976/77 survey of household budgets.
It then derives an estimate of income distribution in El Salvador by household
for 1976/77.
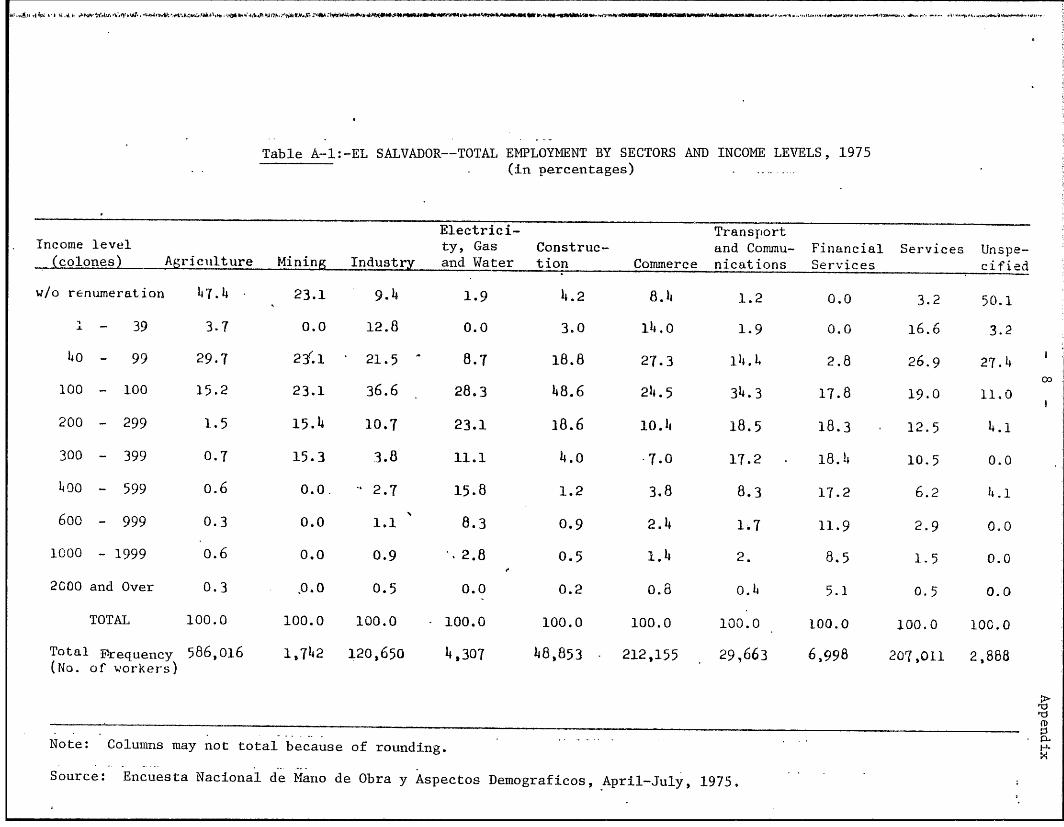
2. There are two national surveys which provide information on income
distribution in El Salvador. One is the 1975 Encuesta Nacional de Mano de
Obra y Aspectos Demograficos (ENMOAD). It was a national survey on the labor
force and on demographics, and provides data on distribution of income for
individual income earners for the period April-June 1975 (Appendix Table A-1).
The second survey is the 1976/77 Encuesta Nacional de Presupuestos Familiars (ENPF),
a national surve' of household budgets which provides data on income distribution
by household for the whole country.
3. The final report on the ENPF survey has not yet been published. Pre-
liminary reports / include data on distribution of income by individual income
earner, by household, and by household member (per capita household income).
A summary of the data on per capita distribution of income (with households
classified into percentile groups and ranked according to per capita income)
/1 Ministerio de Planificacion y Coordinacion, Banco Central de Reserva andDireccion General de Estadistica y Census, Caracteristicas de los Hogares ydelas Viviendas, San Salvador, May 1979; "t Distribucion del Ingresopor Deciles de Perceptores," (mimeo), November 1978; "'Algunos Resultados dela Encuesta Nacional de Presupuestos Familiares (1976-77) y Calculo de Co-efficientes de Elasticidad-Ingreso del Gasto, de los Principales Subgrupos deArticulos Consumidos por las Familias Salvadorenas," (mimeo), undated;ttMuestra de Hogares," (mimeo), April 1978.
was published in the 1980 Social Indicators Data Sheets of the World Bank..
II. The 1976/77 Survey of Household Budgets (ENPF)
4. The 1976/77 ENPF was conducted by the Planning Ministry (Ministerio
de Planificacion y Coordinacion del Desarrollo Economico y Social) in
collaboration with the Central Bank and National Statistics and Census Office,
between August 1976 and July 1977. Its purpose was to obtain information on
household income and expenditures, consumption patterns, employment, levels of
education and characteristics of dwellings.
5. The survey sample contained 3,227 private house-holds, about 0.4%
of the total private households in the country. A household was defined as
including one or more persons, not necessarily related, sharing the same dwell-
ing and contributing to a common budget. Household income was defined as the
after-tax income of all members of the household, including income both in cash
and in kind, transfers, imputed rents from owner-occupied dwellings and produc-
tion consumed by the producer.
III. Evaluation of the 1976/77 ENPF
Under-Reporting of Income
6. The 1976/77 ENPF data on distribution of per capita household income
shows that El Salvador's total household income amounted to 3,658.4 million
colones for an estimated population of 4.29 million in 1976/77./2 The popula-
tion estimates derived from the survey is comparable to that of 4.11 million
derived from other official sources. /3 As a rough check on the total household
/1 Shail Jain's Size Distribution of Income (World Bank, 1975) includes afew estimates of El Salvador's income distribution for earlier years. Dataused for these estimates were not available Lor evaluation of the estimates.
/2 See the Appendix, Tables A-2, A-3 and A-4 for the original ENPF data.
/3 Ministerio de Planificacion y Coordinacion and Latin American Demographic Center.
-3-
income yielded by the survey, that figure was compared with private consumption
expenditures derived from the country's national accounts. The former was 83
percent of the latter. This implies that income was under-reported in the
survey, since private consumption expenditures are expected to be less than
aggregate personal income in El Salvador (see Table 1, below).
7. Because of the lack of data on average household income by income
class, it was not possible to assess directly the under-reporting of income by
different income classes. Preliminary data obtained for only a part (August-
October 1976) of the whole survey period provide average household income and
expenditures by broad income classes. These data show that as average household
income increases, the expenditure-income ratio decreases until there is a
sudden rise in the 'top" income class (average monthly income of over 1,000
colones) (Table 1). There is no evidence of under-reporting of expenditures by
the "top" income class. This suggests relatively greater under-reporting of
income by this class, since its average savings ratio is normally expected to be
the highest (or the expenditure-income ratio the lowest) of the classes in the
country.
/1 A more proper comparison would have been between total household incomederived from survey data and personal income from the national accounts.There were not enough data to derive the latter in El Salvador. Sincein the national acconts, private consumption expenditures are normallyless than personal income, certainly household income, which is less thanprivate consumption expenditures, will also be less than the nationalaccounts personal income.
-4
Table 1: AVERAGE HOUSEHOLD MONTHLY INCOMEAND EXPENDITURES, 1976/77
Income Class Percentage of Average Average(colones) Households Income (Y) Expenditure (C) C/Y
Total Prequency 586,016 1,742 120,650 4,307 48,,853 - 212,155 29,663 6,998 207,011 2,888(No. of wor-kers)
~t
Note: Columns may not total because of rounding.
Source: Encuesta Nacional de Manio de Obra y Aspectos Demograficos, April-July, 1975.
Appendix
-9-
Table A-2 DISTRIBUTION OF URBAN HOUSEHOLD INCOME, BY PERCENTILEHOUSEHOLD GROUPS, RANKED ACCORDING TO PER CAPITAHOUSEHOLD-INCOME, 1976/77
Per Capita Total Household IncomeHousehold Income Households (1,OO. - -(coloties/month) No. % colones/month) %
0.0 - 27.7 36,104 10 4,116.7 2.1
27.7 - 42.1 36,120 10 6,473.6 3.4
42.1 - 55.0 36,118 10 9,876.9 5.1
55.0 - 70.0 35,972 10 11,100.9 5.8
70. 0 86.6 36,138 10 14,034.0 7.3
86.6 - 109.3 36,219 10 17,401.3 9.1
109.3 - 140.0 35,856 10 20,424.5 10.6
140.1 - 182.3 36,207 10 24,389.6 12.7
182.3 - 262.5 36,053 10 26,396.0 13.7
262.5 - 1,885.5 36,364 10 57,890.2 30.1
TOTAL 361,151 100 192,103.3 100
Source: "Muestra de Hogares," op. cit. p.11.
Appendix
- 10 -
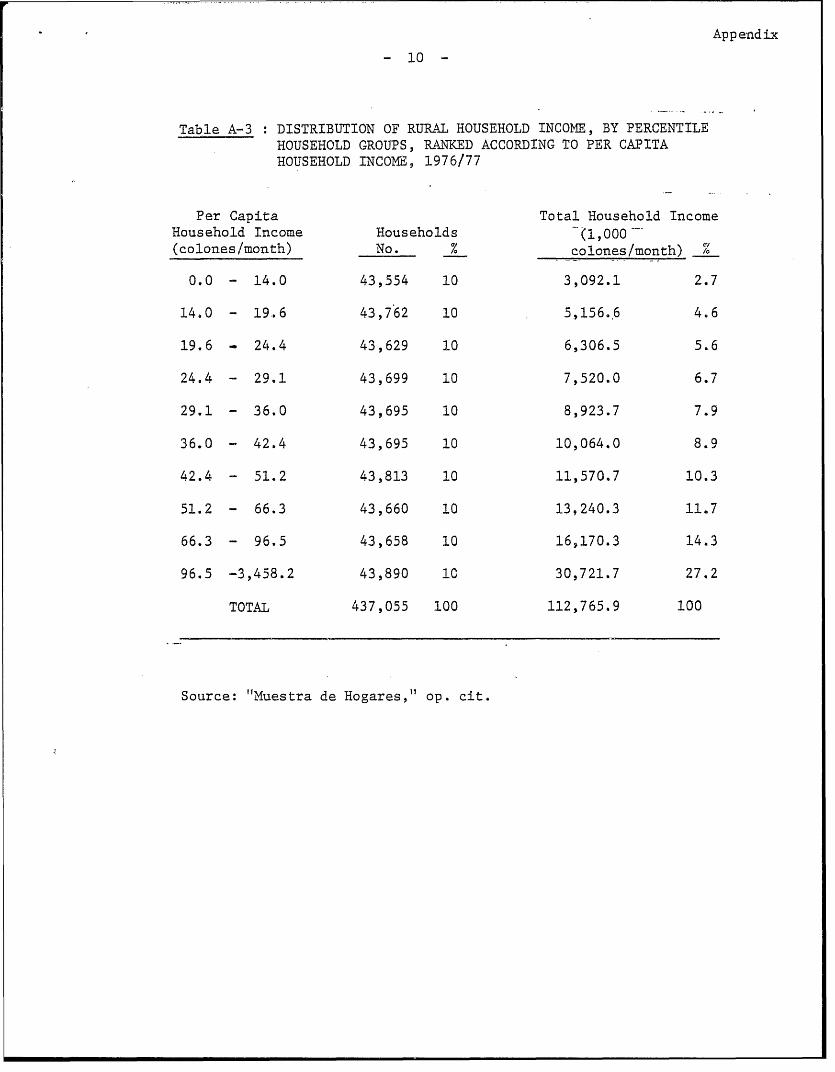
Table A-3 DISTRIBUTION OF RURAL HOUSEHOLD INCOME, BY PERCENTILEHOUSEHOLD GROUPS, RANKED ACCORDING TO PER CAPITAHOUSEHOLD INCOME, 1976/77
Per Capita Total Household IncomeHousehold Income Households (1,000-(colones/month) No. % colones/month) %
0.0 - 14.0 43,554 10 3,092.1 2.7
14.0 - 19.6 43,762 10 5,156.*6 4.6
19.6 24.4 43,629 10 6,306.5 5.6
24.4 - 29.1 43,699 10 7,520.0 6.7
29.1 - 36.0 43,695 10 8,923.7 7.9
36.0 - 42.4 43,695 10 10,064.0 8.9
42.4 51.2 43,813 10 11,570.7 10.3
51.2 - 66.3 43,660 10 13,240.3 11.7
66.3 - 96.5 43,658 10 16,170.3 14.3
96.5 -3,458.2 43,890 10 30,721.7 27.2
TOTAL 437,055 100 112,765.9 100
Source: "Muestra de Hogares," op. cit.
Appendix
11 -
Table A-4 DISTRIBUTION OF NATIONAL HOUSEHOLD INCOME, BY PERCENTILEHOUSEHOLD GROUPS, RANKED ACCORDING TO PER CAPITAHOUSEHOLD INCOME, 1976/77
Per Capita Total Household IncomeHousehold Income Households (1,000(colones/month) No. Colones/mor.th) %
0.0 - 17.1 79,795 10 6,401.0 2.1
17.1 - 24.6 79,810 10 11,182.7 3.7
24.6 - 32.4 79,677 10 14,075.2 4.6
32.4 40.5 79,865 10 16,453.7 5.4
40.5 - 50.6 79,910 10 20,526.7 6.7
50.6 - 64.3 79,701 10 24,323.6 8.0
64.3 - 85.0 79,784 10 27,712.5 9.1
85.0 - 120.0 79,763 10 38,669.4 12.7
120.0 - 187.5 79,909 10 50,074.3 16.4
187.5 -3,458.2 79,992 10 95,450.2 31.3
TOTAL 798,206 100 304,869.3 100
Source: "Muestra de Hogares," op. cit. p.6.
Appendix
- 12 -
-able A-S: DISTRIBUTION OF HOUSEHOLDS BY INCOME CLASSES, 1976/77
Monthly Urban Rural NationalIncome Class -Nor of % of No. of % of No. of % of(colones) Households Households Households Households Households Households
0 1,736 0.5 - - 1,736 0.2
1 - 49 5,390 1.5 18,532 4.2 23,922 3.0
50 - 99 18,925 5.2 55,908 12.8 74,833 9.4
100 199 64,840 17.9 163,521 37.4 228,361 28.6
200 - 299 60,560 16.8 87,252 20.0 147,812 18.5
300 - 599 109,202 30.2 85,740 19.6 194,942 24.4
600 - 999 58,049 16.1 18,679 4.3 76,728 9.6
1,000 - 1,999 32,400 9.0 5,309 1.2 37,709 4.7
2,000 - 3,999 8,574 2.4 1,451 0.3 10,025 1.3
4,000 + 1,475 o.4 663 0.2 2,138 0.3
LOTAL 361,151 100 437,055 100 798,206 100
Source: Caracteristicas de los Hogares y de las Viviendas, op. cit.,Tables N.1 - V.1.
Appendix
- 13 -
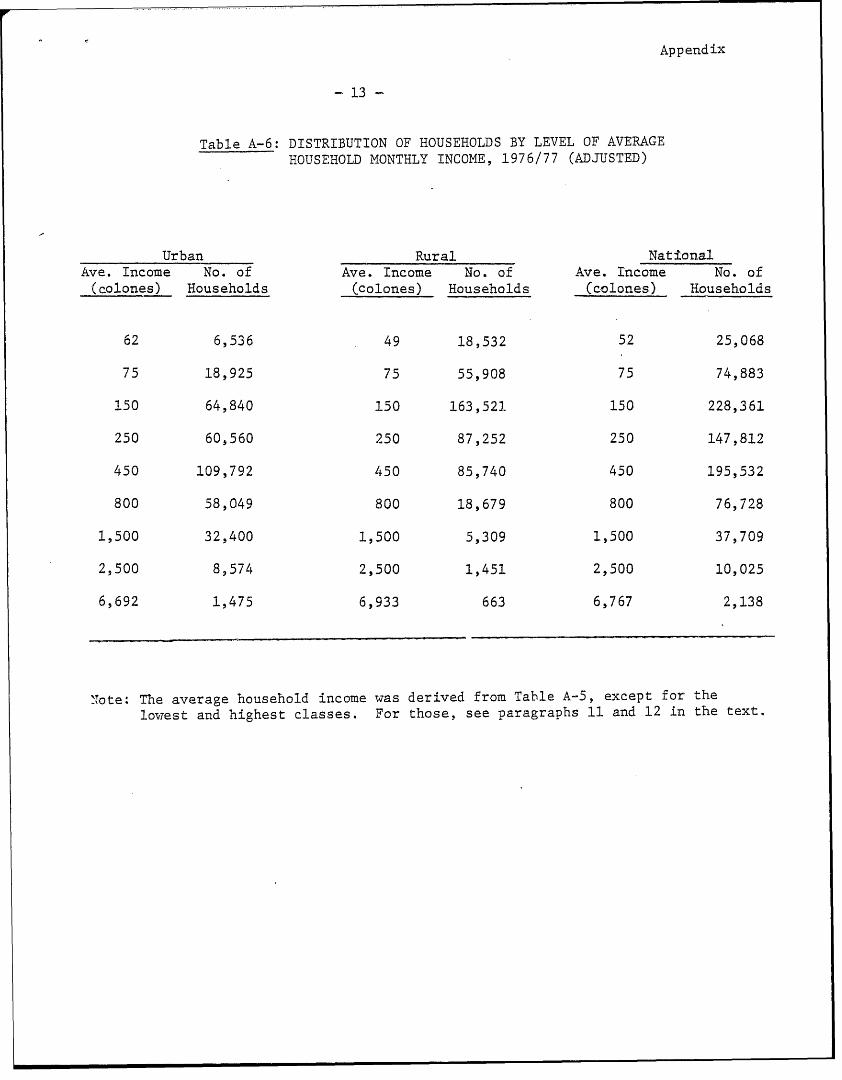
Table A-6: DISTRIBUTION OF HOUSEHOLDS BY LEVEL OF AVERAGEHOUSEHOLD MONTHLY INCOME, 1976/77 (ADJUSTED)
Urban Rural NationalAve. Income No. of Ave. Income No. of Ave. Income No. of
Note: The average household income was derived from Table A-5, except for thelowest and highest classes. For those, see paragraphs 11 and 12 in the text.
Appendix
- 14 -
Table A-7: AVERAGE HOUSEHOLD INCOME BY URBAN ANDRURAL AREAS, AUGUST - OCTOBER 1976
Monthly Urban RuralIncome Class Percentage of Ave. Income Percentage of Ave. Income