Water Papers Water Papers THIRSTY ENERGY Diego J. Rodriguez, Anna Delgado, Pat DeLaquil, Antonia Sohns June 2013 Water Papers are published by the Water Unit, Transport, Water and ICT Department, Sustainable Development Vice Presidency. Water Papers are available online at www.worldbank.org/water. Comments should be e-mailed to the authors. Public Disclosure Authorized Public Disclosure Authorized Public Disclosure Authorized Public Disclosure Authorized
Transcript
Water PapersWater Papers
THIRSTY ENERGY
Diego J. Rodriguez, Anna Delgado, Pat DeLaquil, Antonia Sohns
June 2013
Water Papers are published by the Water Unit, Transport, Water and ICT Department, Sustainable Development Vice Presidency. Water Papers are available online at www.worldbank.org/water. Comments should be e-mailed to the authors.
Pub
lic D
iscl
osur
e A
utho
rized
Pub
lic D
iscl
osur
e A
utho
rized
Pub
lic D
iscl
osur
e A
utho
rized
Pub
lic D
iscl
osur
e A
utho
rized
wb350881
Typewritten Text
78923
Approving Manager
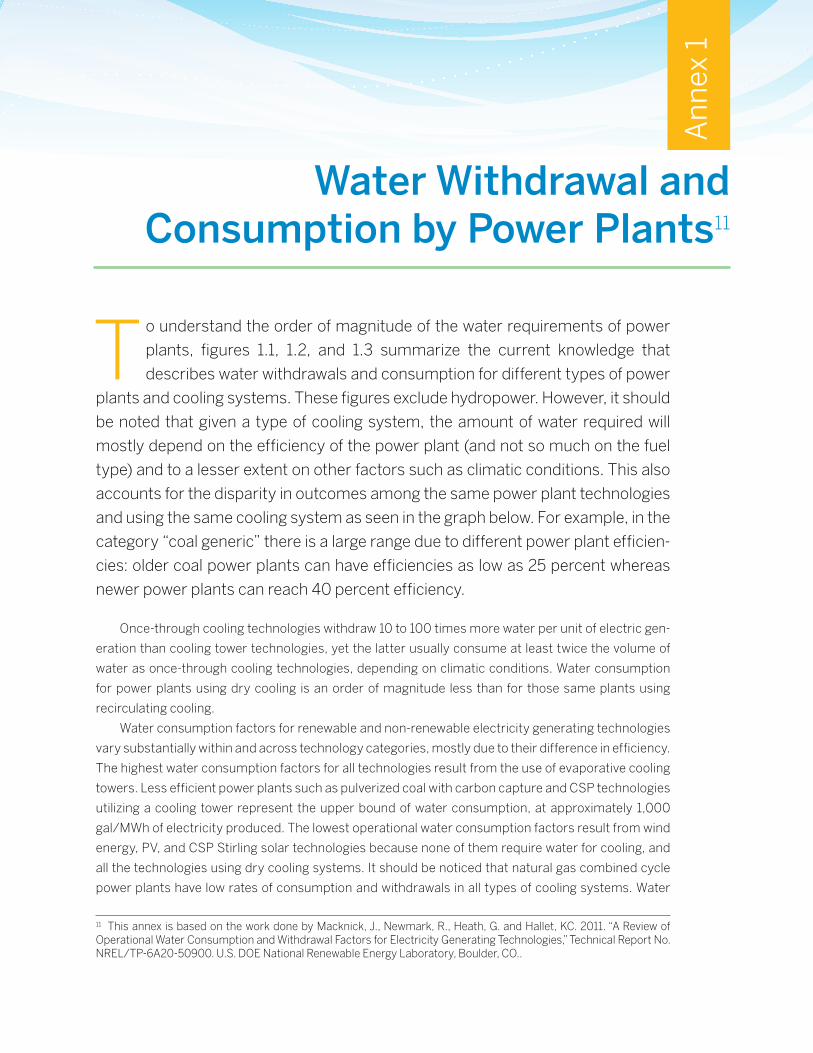
Julia Bucknall
Contact Information
This paper is available online at www.worldbank.org/water. Authors may also be contacted through the Water
The tradeoffs between energy and water have been gaining international attention in recent years as demand for both resources mount and governments continue to struggle to ensure reliable supply to meet
sectoral needs. As almost all energy generation processes require significant amounts of water, and water requires energy for treatment and transport, these two resources are inextricably linked. This relationship is the energy-water nexus.
As population and economies grow many regions of the world experience water and energy
security challenges that must be addressed now. During the next 20 years, cities in developing
countries will have to meet the demand of 70 million more people each year. Recent FAO estimates
show that by 2050, feeding a planet of 9 billion people will require a 60 percent increase in agricultural
production and a 6 percent increase in already-strained water withdrawals (FAO, 2012). Further, over
1.3 billion people worldwide still lack access to electricity; most of them reside in sub-Saharan Africa
and East-Asia (IEA, 2012). About 2.8 billion people live in areas of high water stress and 1.2 billion live
in areas of physical scarcity. It is estimated that by 2030, nearly half of the world’s population will be
living in areas of high water stress affecting energy and food security (WWAP, 2012). According to
recent estimates from the World Energy Council, emerging economies like China, India, and Brazil will
double their energy consumption in the next 40 years. By 2050, Africa’s electricity generation will be
seven times as high as it is today. Similarly, in Asia, primary energy production will almost double, and
electricity generation will more than triple by 2050. And in Latin America, increased production will
come from non-conventional oil, thermal, and gas sources and the amount of electricity generated is
expected to increase fivefold, tripling the amount of water needed (World Energy Council, 2010). The
increased demand for energy will put additional pressure on already constrained water resources.
Mitigating the challenges presented by the nexus will be made more difficult by climate
variability and related extreme weather, which are already causing major floods and droughts
and putting populations, livelihoods, and assets in danger. Climate change will increase the vulner-
ability of countries as rising temperatures accelerate evaporation and precipitation. In addition, rain
patterns will shift and intensify, thereby enhancing uncertainty in energy development. In some cases
future water scarcity will threaten the viability of projects and hinder development. The power sector
is vulnerable to increased water temperature and diminished water availability. Several power plants
Introduction
have already been forced to shut down in the
United States, India, France, and other countries
due to lack of water or high water temperatures
compromising cooling processes. Thermal
power plant projects are being re-examined
due to their impact on regional water resources
and their vulnerability to climate impacts. More
recurrent and longer droughts are threatening
the hydropower capacity of many countries,
such as Sri Lanka, China, and Brazil.
Those involved in the energy sector rec-
ognize the magnitude of this issue. Last year
(and for the first time since it was first published
in 1994), the International Energy Agency’s World
Energy Outlook report included a special section
on the water needs and the possible future water
constraints of the energy sector. The report con-
cluded that “constraints on water can challenge
the reliability of existing operations and the via-
bility of proposed projects, imposing additional
costs for necessary adaptive measures.” Most
recently, General Electric’s Director for Global
Strategy and Planning stated that expansion
plans for coal power plants in China and India
could become unfeasible due to water scarcity.
A World Resources Institute report assessed
existing and planned power plants in India and
Southeast Asia and concluded that more than
half are in areas that will likely face water short-
ages in the future. The 2012 UN Water Report
surveyed more than 125 countries on this topic
and found that the problem of water for energy
was high or very high on the list of priorities in 48
percent of the countries surveyed.
To address these challenges, the World
Bank has launched a new global initiative
entitled “Quantifying the Tradeoffs of the
Water and Energy Nexus” that is a joint effort
of the energy and the water groups. The goal of
the initiative is to generate innovative approaches
and evidence-based operational tools to assist
developing countries to assess and quantify the
economic, environmental, and social tradeoffs of
water constraints in energy security and power
expansion plans. In addition, the initiative will
demonstrate the importance of integrated plan-
ning of energy and water investments to sustain-
able economic growth. As part of this initiative,
the World Bank will produce technical and policy-
oriented material to support its client countries
as they address this challenge. This document
is the first report in this series and focuses on an
introduction of the nexus (in particular on water
for energy) and examines the water requirements
of power generation. As such, it is not meant to
be a technical piece, but rather, its aim is to raise
awareness in both the energy and water sectors
of the linkages and complexities of the challenge.
Section 1 of this paper examines the existing
models, literature, and management frameworks
on the nexus, as it seeks to determine what gaps
exist. Section 2 describes the water demands of
power generation in order to identify potential
areas of future uncertainty and delineate areas
where integrated energy-water management
may improve the reliability of operating power
plants and the viability of proposed schemes.
Section 3 describes possible solutions that
may alleviate challenges resulting from the link
between energy and water by improving energy
efficiency and integrating water resources man-
agement into energy planning.
THIRSTY ENERGYvi
The Global Challenges in Energy and Water
The Energy-Water Nexus
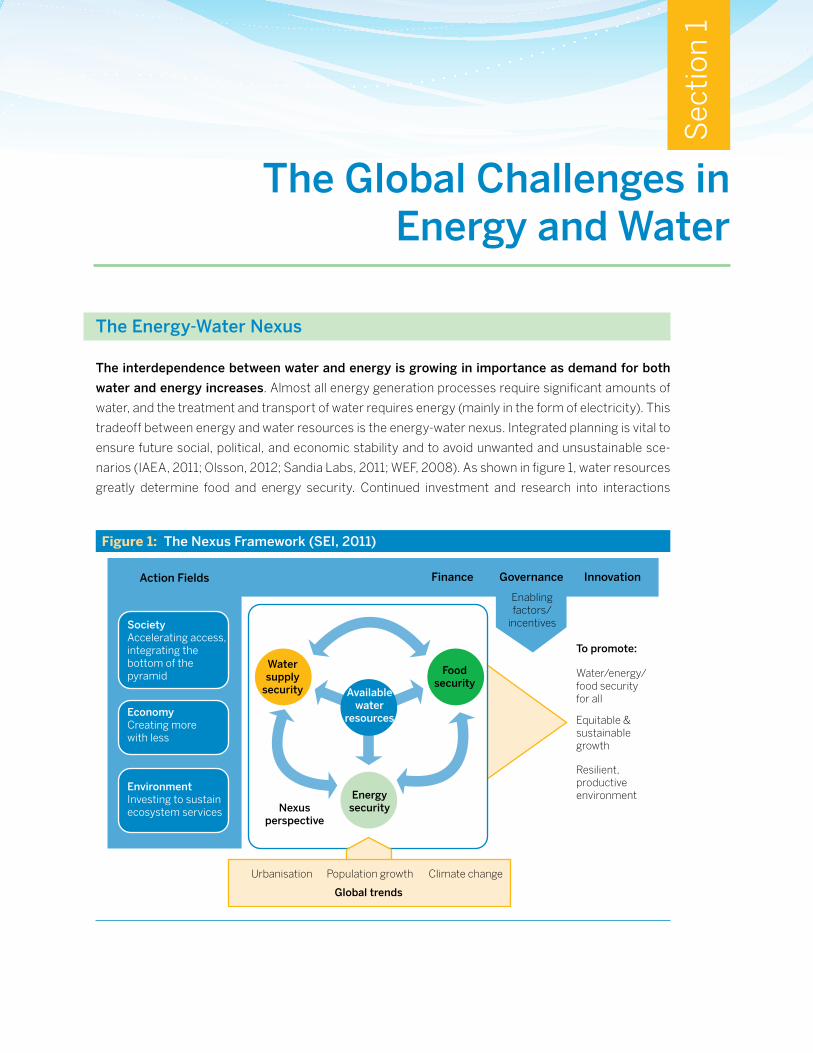
The interdependence between water and energy is growing in importance as demand for both
water and energy increases. Almost all energy generation processes require significant amounts of
water, and the treatment and transport of water requires energy (mainly in the form of electricity). This
tradeoff between energy and water resources is the energy-water nexus. Integrated planning is vital to
ensure future social, political, and economic stability and to avoid unwanted and unsustainable sce-
narios (IAEA, 2011; Olsson, 2012; Sandia Labs, 2011; WEF, 2008). As shown in figure 1, water resources
greatly determine food and energy security. Continued investment and research into interactions
Sec
tion
.1 .
Figure 1: The Nexus Framework (SEI, 2011)
FinanceAction Fields Governance Innovation
Urbanisation Population growth
Global trends
Energysecurity
Foodsecurity
Watersupply
security Availablewater
resources
Nexusperspective
Climate change
SocietyAccelerating access, integrating the bottom of the pyramid Water/energy/
food security for all
Enabling factors/
incentives
Resilient, productive environment
Equitable & sustainable growth
EconomyCreating more with less
EnvironmentInvesting to sustain ecosystem services
To promote:
within the nexus are critical for smart climate and
infrastructure planning and to ensure a sustain-
able future.
Population and economic growth are
expected to increase demand for food,
energy, and water. Global economic growth is
being driven largely by emerging markets. Over
the medium term, it is estimated that economic
growth will average 6 percent in the developing
countries compared to 2.7 percent in higher-
income countries (World Bank, 2011). Yet, cur-
rently 783 million people lack access to clean
drinking water and 2.5 billion people remain with-
out sanitation. Growing stresses such as rapid
urbanization and climate change are affect-
ing all water uses. During the next 20 years, cit-
ies in developing countries will have to meet the
demand of 70 million more people each year.
Recent FAO estimates show that by 2050, feed-
ing a planet of 9 billion people will require a 60
percent increase in agricultural production and
a 15 percent increase in already-strained water
withdrawals (FAO, 2012). Further, over 1.3 bil-
lion people worldwide still lack access to elec-
tricity with most of them residing in sub-Saha-
ran Africa and East-Asia (IEA, 2012). Closing the
energy gap could have negative implications on
water resources because water is needed for
fuel extraction, cooling thermal power plants,
and to turn hydropower turbines.
Water scarcity is increasing. About 2.8
billion people live in areas of high water stress
and 1.2 billion live in areas of physical scarcity.
It is estimated that by 2030, nearly half of the
world’s population will be living in areas of high
water stress affecting energy and food security
(WWAP, 2012). Worldwide, decreasing water
quality also impacts growth as it degrades eco-
systems; causes health-related diseases; con-
strains economic activities such as agriculture,
energy generation, industrial production, and
tourism; affects the value of property and assets,
and increases wastewater treatment costs.
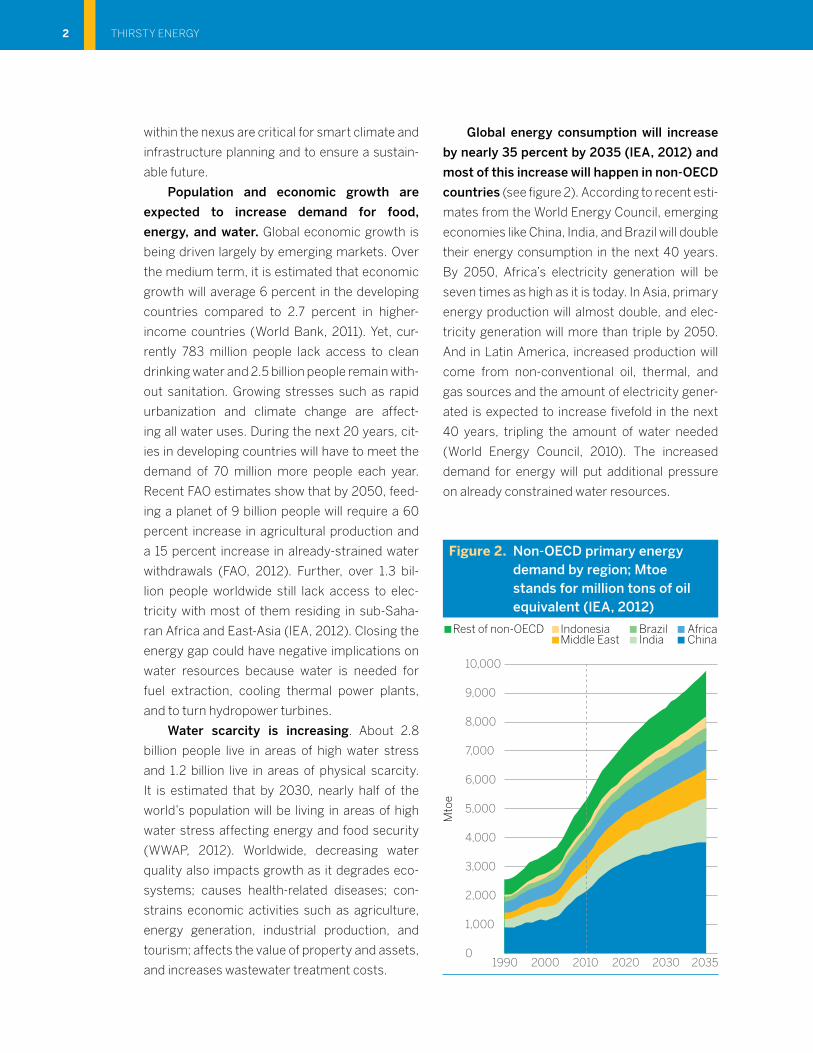
Global energy consumption will increase
by nearly 35 percent by 2035 (IEA, 2012) and
most of this increase will happen in non-OECD
countries (see figure 2). According to recent esti-
mates from the World Energy Council, emerging
economies like China, India, and Brazil will double
their energy consumption in the next 40 years.
By 2050, Africa’s electricity generation will be
seven times as high as it is today. In Asia, primary
energy production will almost double, and elec-
tricity generation will more than triple by 2050.
And in Latin America, increased production will
come from non-conventional oil, thermal, and
gas sources and the amount of electricity gener-
ated is expected to increase fivefold in the next
40 years, tripling the amount of water needed
(World Energy Council, 2010). The increased
demand for energy will put additional pressure
on already constrained water resources.
Figure 2. Non-OECD primary energy demand by region; Mtoe stands for million tons of oil equivalent (IEA, 2012)
0
10,000
9,000
8,000
7,000
5,000
6,000
3,000
4,000
2,000
1,000
Mto
e
1990 2000 2010 2020 2030 2035
Rest of non-OECD Indonesia Brazil AfricaMiddle East India China
THIRSTY ENERGY2
Sec
tion
1
well as demand for motorized transportation
are hallmarks of the transition to higher-value-
added, more diversified and integrated eco-
nomic activity. Similarly, as economies grow
and diversify, competing demands for water
broaden to include more intensive municipal and
industrial uses, as well as increased demands for
agriculture. Environmental considerations also
come into play: increased demands for potable
water and air pollution control increase energy
use; expansion of renewable energy utilization
increases the need to consider the water require-
ments of diverse technologies from traditional
hydropower, to renewable thermal power, to
biofuel feedstock production.
Water is needed in almost all energy gen-
eration processes. Most thermal power plants
require large quantities of water, primarily for
cooling purposes. Water drives energy produc-
tion in hydropower generation and is also critical
in energy development (such as coal, oil, and
gas extraction and refining). Only wind (which
requires virtually no water) and photovoltaic
(which requires a small quantity of water to wash
the panels) have negligible impacts on the water
and energy nexus. Both energy and water are
used in the production of crops and some crops
are used to generate energy through biofuels.
Determining energy-water tradeoffs
is a complex matter. Energy development
requires varying quantities of water by
resource and defining water use by the energy
sector is challenging because not all uses are
the same. Water and energy managers must
consider the water requirements in energy devel-
opment in order to ensure the long-term viability
of operations. In such an analysis, the water
requirements are usually broken down into water
withdrawal, water consumption, and discharge.
Withdrawal is defined as the amount of water
taken from a water source (lake, river, ocean,
aquifer, etc.). Consumption is the water that is
lost from the total water withdrawn. Discharge is
Climate change is exacerbating energy
and water insecurity, due to extreme weather
conditions, such as prolonged drought periods
and major floods, which will put populations,
livelihoods, and assets in danger. The number
of people affected by climate-related disasters
doubled every decade in the last 40 years. The
effects and intensity of climate change will vary
regionally, as populations experience a change
in average precipitation, surface runoff, and
stream flow, deviation from rainfall averages, and
increased probability of extreme events, such as
intense storms, floods and droughts. Altered
precipitation and evapotranspiration patterns
are predicted to reduce runoff in southern Africa,
the Mediterranean basin, Central America,
the southwestern United States and Australia,
among other places (FAO, 2008). This is likely to
increase competition for water across sectors,
such as agriculture, energy, water supply and the
environment.
The combined effects of population
growth, climate change, and increasing hydro-
logical variability will result in a heightened
reliance on energy-intensive water supply
options, such as water transport or desalina-
tion plants to supplement urban water supply.
Moreover, as temperatures rise, more water will
be needed by the energy sector to meet both
its own demand for water for cooling per unit of
energy produced, and also to meet increased
energy demands for the cooling of houses,
offices, and factories. Climate change will also
impact the energy sector through changes in
energy demand, and through the need to transi-
tion to energy supply options involving low or
zero greenhouse gas emissions.
As economic development at the house-
hold level depends on access to basic energy
and water services, economy-wide growth
and poverty reduction depend on water and
energy systems to provide reliable and afford-
able services. Growth in electricity demand, as
THE GLOBAL CHALLENGES IN ENERGY AND WATER 3
figure 3). Conversely, while mining and energy
development do not require large volumes of
water at the national level (see figure 3), resource
development requires large volumes during
extraction, transportation, and processing. As a
result, it can dramatically affect water availability
regionally, both in time and place. The vast dif-
ferences in water demand in the energy sector,
imposes an important challenge when analyzing
and quantifying potential water constraints.
Visualization tools, such as the one
depicted in figure 3 allow resource managers
to better project water and energy needs and
determine if supplies will be adequate. Using
data from the United States, figure 3 illustrates
how water resources are withdrawn, discharged
the amount of water that is returned to the water
source in a different state. Therefore, the water
consumed is equal to the water withdrawn minus
the water discharged to the environment.
These requirements can differ dra-
matically depending on the type of process
or technology employed. For example, hydro-
power requires the availability of large quantities
of water, but the water is only diverted and can
be used downstream by other sectors, such
as agriculture. In biofuels, most of the water
is consumed through irrigation and a reduced
amount is returned to the system. In thermal
power plants, large quantities of water are
withdrawn for cooling purposes, but most of the
water is returned to the freshwater source (see
Figure 3: Estimated Water Flow in the United States in 2005
Source: LLNL 2011. Data is based on USGS Circular 1344, October 2009. If this information or a reproduction of it is used, credit must be given to the Lawrence Livermore National Laboratory and the Department of Energy, under whose auspices the work was performed. All quantities are rounded to 2 significant digits and annual flows of less than 0.05 MGal/day are not included. Totals may not equal sum of flows due to independent rounding. Further detail on how all flows are calculated can be found at http://flowcharts.llnl.gov. LLNL-TR-475772.
THIRSTY ENERGY4
Sec
tion
1
and consumed by different sectors. In the United
States, the withdrawal rate for thermal power
plant cooling processes is almost as much as
the withdrawals for agriculture, which consumes
water for food and biofuel production. While
most of the water in the energy sector is not con-
sumed and is returned to the source, the large
volume of water withdrawn by the power sector
greatly impacts the ecosystem and the water
resources of a region.
In 2010, water withdrawals for energy
production were estimated at 583 billion
cubic meters (bcm), of which 66 bcm were
not returned to the water body (IEA 2012).
Water withdrawal is predicted to increase by 20
percent by 2035, with consumption increasing
by 85 percent. This increase in consumption is
mostly due to a shift from once through cooling
to closed loop cooling systems, which withdraw
less water, but consume most of it, and also due
to the expansion of crop production for biofuels.
Water withdrawals are typically greater than
consumptive use and are, therefore, considered
the limiting factor for energy production in loca-
tions where water is a constrained resource.
Even if water use for electricity generation is
non-consumptive, the timing of water releases
and water quality issues can have material
impacts on other sectors, giving rise to trad-
eoffs and potential conflicts with other water
uses, particularly in water scarce regions and
basins.
Expansion of many forms of renew-
able energy could increase accompanying
demands for water (e.g., in solar thermal, bio-
fuels feed stocks, geothermal, and hydro-
power). In the coming decades the energy
demand and greenhouse gas emissions are esti-
mated to triple under a business-as-usual sce-
nario (IAEA, 2011). One of the proposed solu-
tions is the substitution of fossil energy sources
with renewable low-carbon sources, such as
hydropower, wind, solar-thermal, geothermal or
biomass. Nuclear energy has also been advo-
cated for in many countries. Most of these solu-
tions are thermal power plants, and due to their
lower efficiency compared to conventional fos-
sil fuel power plants, they usually require larger
amounts of water for cooling purposes. Non-
thermal renewable generation technologies such
as wind and photovoltaics consume negligible
amounts of water. However, they provide inter-
mittent service. Thus, without the existence of
large scale electricity storage, it seems inevitable
that thermal power plants will continue to be used
as base-load and dispatchable power. Pressures
for adoption of low carbon sources of energy can
be expected to increase the demand for invest-
ment in the development of hydropower in ways
that may change the timing and delivery of water
to other users. Policy choices are further com-
plicating addressing the energy-water nexus as
people select more water-intensive energy and
more energy-intensive water sources to meet
demand (WWAP, 2012).
The competition between water and
energy is asymmetrical. Water scarcity threat-
ens energy production, and energy is also
needed for water production, yet water availabil-
ity is not threatened by energy scarcity. Water
consumption for energy generation contrib-
utes to water scarcity; as more energy is gen-
erated significantly less water may be available.
On the other side of the equation, the energy
use for the treatment, transport and pumping of
water can be significant, but it is not seen as a
major determinant of energy scarcity. This study
focuses on addressing this imbalance; in partic-
ular, the tradeoffs between these resources, by
proposing solutions that emphasize their com-
mon dependence given that they are inextrica-
bly linked. This interdependence is already crit-
ical in many regions, and the resulting stresses
are compounded as demand grows from emerg-
ing economies and “graduating” countries. The
impact of climate change on water and energy
THE GLOBAL CHALLENGES IN ENERGY AND WATER 5
resources is also a factor. Projected conse-
quences of these factors are alarming enough
to require the urgent development of more accu-
rate integrated planning tools.
Existing Efforts in the Energy-Water Nexus
A review of the literature shows a consistent
theme of water stress and scarcity as well as
the expectation that these will increase over
time. The impact of cross-sector competition
on the energy-water nexus highlights the need
for a more integrated approach to energy-
water planning. There are several components
of integrated energy-water planning that should
be addressed, both systematically and over long
planning horizons. The major planning aspects
relate to technical, policy, and socioeconomic
factors. Specifically, there are political and insti-
tutional barriers that affect energy-water plan-
ning because these resources are very profitable.
Thus, entrenched political and economic inter-
ests may prefer that resources and data sharing
remain separate. The literature also reveals that
while many organizations examine the water and
energy nexus, most of the existing analysis deals
primarily with physical and technical variables.
Few analysts are trying to quantify the tradeoffs.
Despite growing concerns over these
trends, decision makers are often ill-informed
about what drives the trends, their possible
outcomes, and the merits of different techni-
cal options. The study of growing water and
energy needs often occurs in isolation from plans
for expanding the provision of these resources.
For example, research on siting for a solar ther-
mal plant may take into account the availability
of water for cooling at specific sites, but the
systemic implications of solar thermal versus
other technology choices receives less attention.
Energy planning is often made without taking
into account possible changes in water avail-
ability due to climate change or other competing
uses. Water resources planning rarely takes into
account the energy used to pump, treat, and
desalinate the water, which in turn has an impact
on the water used by the power sector. Assess-
ment of a large hydropower project for electricity
generation may not sufficiently consider that the
agricultural value-added of using that water for
irrigation may be greater than using alternative
groundwater sources for food production.
Currently, the majority of integrated
energy-water planning efforts are specific to
the United States and many of the programs
are in pilot and research stages. Developing
countries have limited literature on energy pro-
jections and associated water consumption. Late
last year, and in an effort to quantify the chal-
lenges facing the nexus, the IEA World Energy
Outlook included a section on the possible future
water constraints in the energy sector for the
first time in its 19-year history (IEA, 2012).
The issue of water scarcity at the basin
level is less well understood and illustrates
one of the gaps in planning in the energy-
water nexus. Water scarcity is typically ana-
lyzed on a high-level conceptual approach that
is supported by the data that is available. This
gap illustrates an area where the conceptual pro-
gramming of energy-water tradeoffs could be
applied to provide real-time data and feedback
through a basin study focused on a region with
electricity generation needs that may compete
for water resources with other sectors, such
as industry, municipalities, agriculture, and the
environment.
Energy and water policies are disjointed,
with many federal, state, and local decision
makers but few mechanisms to coordinate
action. This lack of integrated planning, manage-
ment, and regulation has already had an impact
in the power sector. In the United States, power
plant permits have been rejected due to water
THIRSTY ENERGY6
Sec
tion
2
concerns (US Department of Energy, 2006). Yet,
there are technologies and policy approaches
that could be adopted that would improve a
country’s position with regard to energy, water,
and climate security, if only the means of coordi-
nation were in place.
Water allocation modeling does not ade-
quately address scale and time in energy
modeling from planning to operation. Water
supply planning generally uses a fairly broad
spatial scale (river basin) and a fairly coarse time
scale (months or weeks). Energy operational
models generally run on a more refined time
scale (minutes or hours) that are not necessarily
concerned with the spatial component or supply
limitations evidenced with the underlying hydro-
logic systems.
A better understanding of the cross-sec-
toral implications and the potential magnitude
of water and energy stresses for the energy
sector is needed for climate-smart and inclu-
sive green growth planning. The need to under-
stand the interactions between energy and water
use is growing, and in addition to energy and water,
planning and development challenges are likely to
involve land use, food production, urbanization,
demographics, and environmental protection. A
number of modeling platforms have been devel-
oped to support an assessment of energy sector
development under different economic and envi-
ronmental policy conditions, and to support inte-
grated resource development in the water sec-
tor. The water models take into account water use
for hydroelectricity expansion versus other uses;
and some energy models include calculations
of water requirements for different technology
investments. Typically, however, the models are
designed for different purposes and the linkages
between energy and water sector development
are limited. Moreover, the level of technical detail
and complexity in the models can preclude their
application for upstream sector strategy devel-
opment, a crucial analytical need in development
planning. The converse is also true for the needs
at the river basin or sub-basin level, when models
are too general and do not include the necessary
level of detail.
Despite the importance of energy and
water, and their interconnectedness, funding,
policy making, and oversight are scattered
among many agencies. Practitioners also often
manage these resources broadly, including land
and food in their management approach. The
current internal incentives system still favors
independent sectoral outcomes over cross-
sectoral results.
THE GLOBAL CHALLENGES IN ENERGY AND WATER 7
Sec
tion
.2 .
Water Demands of Power Generation
Introduction
Water is required in almost all types of electricity generation. The most obvious and well-known is
hydropower. However, most thermal power plants, which produce most of the electricity in many
regions of the world, also require large quantities of water for their operation. Thermoelectric power
plants account for 39 percent of annual freshwater withdrawal in the United States (USGS, 2005) and
43 percent in Europe (Rubbelke and Vogele, 2011). Only open cycle power plants, which require no
water for cooling, and energy from wind and photovoltaics have a negligible impact on the water and
energy nexus.
Thermal Power Plants
Thermal power plants generate around 75 percent of the electricity produced in the world (IEA,
2012). Most of these plants require large quantities of water, mainly for cooling purposes.
Thermal power plants convert heat into power in the form of electricity. The heat is generated
from a diverse range of sources, including pulver-
ized coal, natural gas, uranium, solar energy, and
geothermal energy. Most of these thermal power
plants, including coal power plants, geothermal,
solar thermal, biomass, nuclear, and in part, natu-
ral gas combined cycle power plants use steam as
the prime mover. In these plants water is heated
and turned into steam. The steam spins a turbine
which drives an electric generator. After passing
through the turbine the steam is cooled down and
condensed to start the cycle again (closing the
so-called steam cycle). In other words, all the heat
put into the plant that is not converted into elec-
tricity is “waste heat” and has to be dissipated into
the environment. Most of this heat (blue arrow in
figure 4) is rejected to the environment through
Figure 4. Simplified Visualization of Heat Balance of a Fossil Fuel Power Plant
Flue Gas
Other heat losses
Heat toCooling
Electricity
Heatinput
Source: Delgado, 2012.
the cooling system, which usually uses water as
the heat transfer medium (UCS, 2011).
As power plants become more efficient, less
waste heat needs to be rejected (yellow arrow
becomes bigger and blue arrow smaller), which
diminishes the cooling requirements per kWh
produced. Therefore, more efficient new natural
gas combined cycle power plants (around 50
percent efficient) require less water than a new
coal power plant (38 percent) or a solar thermal
power plant (25 to 40 percent) and much less
than an old coal power plant (efficiencies could
be as low as 25 percent) or new coal power
plants with carbon capture (33 percent).1 On the
other hand, open-cycle gas turbines, which are
usually used as peaking power plants, have no
steam cycle and thus do not require water for
cooling.
The amount of water required for cooling
is highly dependent on the type of cooling
system used in the plant. Although water is also
used in smaller quantities for steam generation
and in other processes, such as ash handling
and flue gas desulfurization, most of the water
is used for cooling purposes. In a coal plant with
cooling towers, it is estimated that 90 percent of
the water is used in the cooling system and the
other 10 percent is used in other processes (DOE,
2009). Therefore, the choice of cooling system
should take water requirements into account in
order to minimize environmental impacts.
There are four types of cooling systems,
and water withdrawn and consumed is highly
variable depending on the system implemented:
once-through cooling systems, closed-loop or
wet-recirculating systems, dry cooling systems,
and hybrid cooling systems.
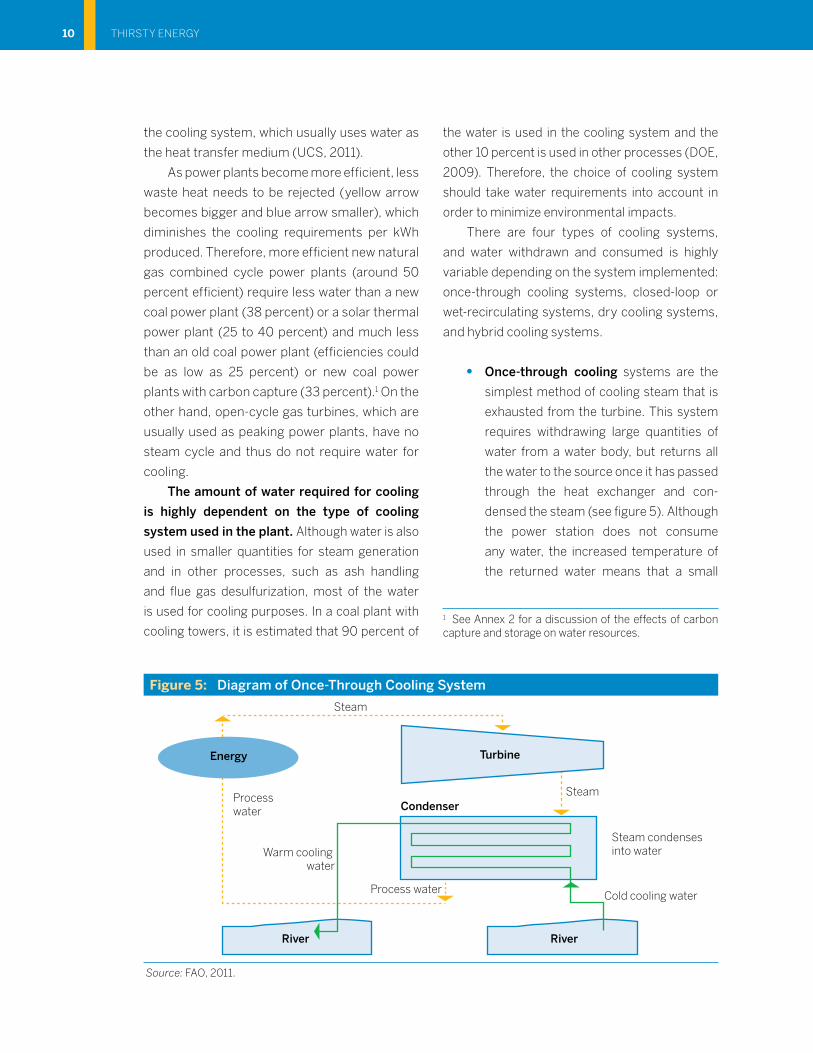
●● Once-through cooling systems are the
simplest method of cooling steam that is
exhausted from the turbine. This system
requires withdrawing large quantities of
water from a water body, but returns all
the water to the source once it has passed
through the heat exchanger and con-
densed the steam (see figure 5). Although
the power station does not consume
any water, the increased temperature of
the returned water means that a small
1 See Annex 2 for a discussion of the effects of carbon capture and storage on water resources.
Figure 5: Diagram of Once-Through Cooling System
Steam
Steam
Steam condensesinto water
Processwater
Warm cooling water
Cold cooling waterProcess water
Condenser
River
Energy Turbine
River
Source: FAO, 2011.
THIRSTY ENERGY10
Sec
tion
2
percentage (around 1 percent) of it evapo-
rates downstream. Moreover, the warm
water may cause thermal pollution of the
environment and have an adverse impact
on ecosystems. ●● Closed-loop or wet-recirculating sys-
tems include wet cooling towers and
cooling ponds. Both cooling systems use
a recirculating loop of water. Wet cool-
ing towers are the most common sys-
tems used. After the water goes through
the steam condenser and removes the
waste heat, it is sprayed down the cool-
ing tower while air comes up from the
bottom of the tower and goes out into the
environment. This process exchanges
heat from the water to the air, cooling the
water. Some water is lost due to evapo-
ration. The remaining water is then col-
lected at the bottom of the cooling tower
and reused in the steam condenser of
the power plant, closing the recirculating
loop (see figure 6). Although this cool-
ing system withdraws far less water than
once-through systems, water consump-
tion is higher due to evaporation; around
85 percent of the water withdrawn is
consumed. ●● Dry cooling systems use air instead
of water to cool the steam leaving the
turbine, and therefore can decrease
the power plant’s water consumption
by more than 90 percent. (UCS, 2010).
Compared to the other cooling systems,
dry cooling systems have minimal envi-
ronmental impacts. However, since air is
not as efficient as water in heat transfer,
dry cooling systems require a greater
surface area to dissipate waste heat to
the environment. Therefore, dry cool-
ing is two to four times more expensive
than an equivalent wet tower cooling
system. Moreover, since dry cooling is
less efficient than water cooled systems,
it affects the efficiency of the plant, so
these systems are used in extreme situa-
tions of water scarcity, although in ambi-
ent temperatures of above 100 degrees
Fahrenheit, it is much less effective than
other systems. (UCS, 2010).●● Hybrid cooling systems combine wet
and dry cooling approaches. Although
Figure 6. Diagram of Closed-Loop Cooling with Cooling Towers
Steam
Steam
Steam condensesinto water
Warm coolingwater
Cold coolingwater
Evaporation
Make-up water Process water
Condenser
River
Energy
CoolingTower
Turbine
Source: FAO, 2011.
WATER DEMANDS OF POWER GENERATION 11
there are different types of systems, they
still fall between wet and dry in terms of
cost, performance, and water use.
The cooling system employed by the
power plant has an impact on power plant
efficiency, capital and operation costs, water
consumption, water withdrawal, and total
environmental impacts. Therefore, tradeoffs
must be evaluated case-by-case, taking into
consideration regional and ambient conditions,
and existing regulations. It is also important to
note that there is a wide range of operational
consumption for the same type of system,
reflecting local conditions in particular areas
and countries and depending on the efficiency of
the power plant (see annex 1). Any assessment
must clearly identify and quantify the tradeoffs
between cooling systems in terms of water use,
costs, and efficiency (see table 2).
Thermal electric power plants can also
have an adverse effect on water quality.
Once-through cooling discharges alter the water
temperature and cause thermal pollution and
changes in oxygen levels in the surrounding envi-
ronment. Air emissions from fuel combustion in
thermal power plants can contain mercury, sul-
fur, and nitrogen oxides, among other chemicals,
which can have an impact on the water quality
and aquatic ecosystems downwind. In wet cool-
ing towers, smaller amounts of water, known as
“blowdown,” are purged from the cooling water
circuit to avoid the buildup of harmful contam-
inants and concentration of dissolved and sus-
pended solids. These streams of water contain
several pollutants and should be treated before
being returned to the water source or sent to hold-
ing ponds. Fossil fuel power plants also require
greater volumes of water for processes, such as
flue-gas desulfurization, coal washing, and dust
removal. This water must be treated before it is
discharged because it could pollute surrounding
water resources with toxic chemicals.
Hydropower
While there is abundant potential hydropower
in developing countries, it has not yet been
harnessed. Unexploited hydropower potential
amounts to 93 percent in Africa, 82 percent in
East Asia and the Pacific, 79 percent in the Middle
East and North Africa, 78 percent in Europe and
Central Asia, 75 percent in South Asia, and 62
percent in Latin America and the Caribbean
(WBG, 2009).
Hydropower is also a water intensive
source of energy, although there are different
water concerns in the electrical generation
processes. In hydropower plants, most of the
water is not consumed but diverted to generate
electricity. As a result, it can be used downstream
of the dam for other purposes, such as irrigation
and for urban use. In a world of severe energy
shortages and increasing water variability, hydro-
power and its multipurpose water infrastructure
will play an expanding role in providing electricity
and allocating scarce water resources.
Table 2: Cooling System Tradeoffs
Cooling TypeWater Withdrawal
Water Consumption Capital Cost
Plant Efficiency
Ecological Impact
Once-Through intense moderate low most efficient intense
environment, where reservoir storage is very large,
evaporative losses can be significant compared to
run-of-the-river hydropower plants, which store
little water, and therefore have evaporative losses
near zero. However, a run-of-the-river site cannot
be used for water storage, nor can it control the
efficient generation of the electricity when needed
(for peak loads, for example).
Hydropower plants impact the land and
water. Hydropower plants change the hydrogeol-
ogy of an area because they convert a free-flowing
river into a reservoir, thus altering the timing and
flow of the water. This impounded water affects
water quality and aquatic life, as rivers and lakes
can fill with sediment and baseline nutrient
levels can be altered. Water rushing through the
turbines can increase the presence of dissolved
oxygen in the water, affecting aquatic life. Eco-
systems and water quality are further affected by
the dam because hydropower plants may slow
the river’s flow, thus potentially increasing the
temperature stratification of the water body.
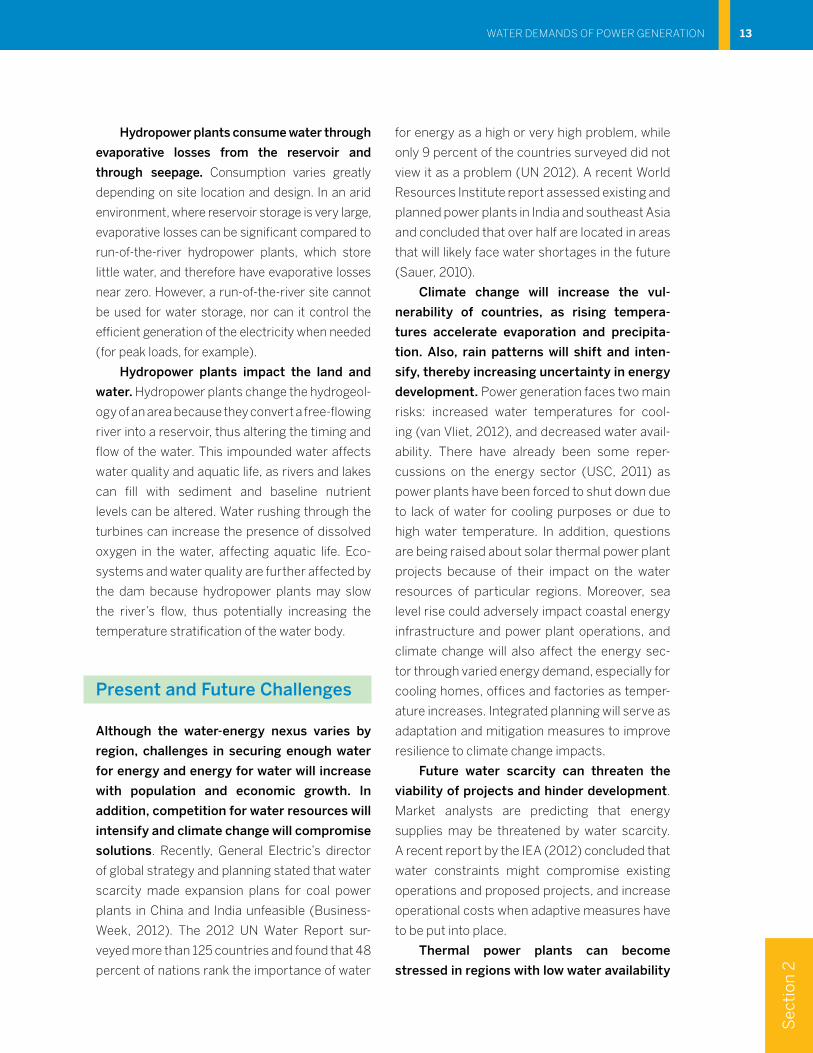
Present and Future Challenges
Although the water-energy nexus varies by
region, challenges in securing enough water
for energy and energy for water will increase
with population and economic growth. In
addition, competition for water resources will
intensify and climate change will compromise
solutions. Recently, General Electric’s director
of global strategy and planning stated that water
scarcity made expansion plans for coal power
plants in China and India unfeasible (Business-
Week, 2012). The 2012 UN Water Report sur-
veyed more than 125 countries and found that 48
percent of nations rank the importance of water
for energy as a high or very high problem, while
only 9 percent of the countries surveyed did not
view it as a problem (UN 2012). A recent World
Resources Institute report assessed existing and
planned power plants in India and southeast Asia
and concluded that over half are located in areas
that will likely face water shortages in the future
(Sauer, 2010).
Climate change will increase the vul-
nerability of countries, as rising tempera-
tures accelerate evaporation and precipita-
tion. Also, rain patterns will shift and inten-
sify, thereby increasing uncertainty in energy
development. Power generation faces two main
risks: increased water temperatures for cool-
ing (van Vliet, 2012), and decreased water avail-
ability. There have already been some reper-
cussions on the energy sector (USC, 2011) as
power plants have been forced to shut down due
to lack of water for cooling purposes or due to
high water temperature. In addition, questions
are being raised about solar thermal power plant
projects because of their impact on the water
resources of particular regions. Moreover, sea
level rise could adversely impact coastal energy
infrastructure and power plant operations, and
climate change will also affect the energy sec-
tor through varied energy demand, especially for
cooling homes, offices and factories as temper-
ature increases. Integrated planning will serve as
adaptation and mitigation measures to improve
resilience to climate change impacts.
Future water scarcity can threaten the
viability of projects and hinder development.
Market analysts are predicting that energy
supplies may be threatened by water scarcity.
A recent report by the IEA (2012) concluded that
water constraints might compromise existing
operations and proposed projects, and increase
operational costs when adaptive measures have
to be put into place.
Thermal power plants can become
stressed in regions with low water availability
WATER DEMANDS OF POWER GENERATION 13
due to their large water requirements. In order
to reduce vulnerability to water scarcity, power
plants will most likely employ closed-loop cool-
ing systems. While this may reduce water with-
drawals, water consumption could significantly
increase (IEA, 2012). There are many alterna-
tives to address the water-energy nexus in
power generation, such as better cooling system
technologies. However, many current options
are less efficient and more costly, so operators
prefer conventional systems until regulation or
pricing dictates otherwise.
Thermal power plant operations can also
be threatened by increased water tempera-
tures. Increased water temperatures are corre-
lated with rising air temperatures (Stewart et al.,
2013) and can prevent power plants from cooling
properly, causing them to shut down. These
concerns will become increasingly important
as companies consider alternative technologies
(such as dry cooling), and governments study
the placement of power plants along rivers,
ensuring the plant’s sustainable future operation
under increased energy demand and potentially
warmer climate. Due to these risks, govern-
ments must re-examine where thermal power
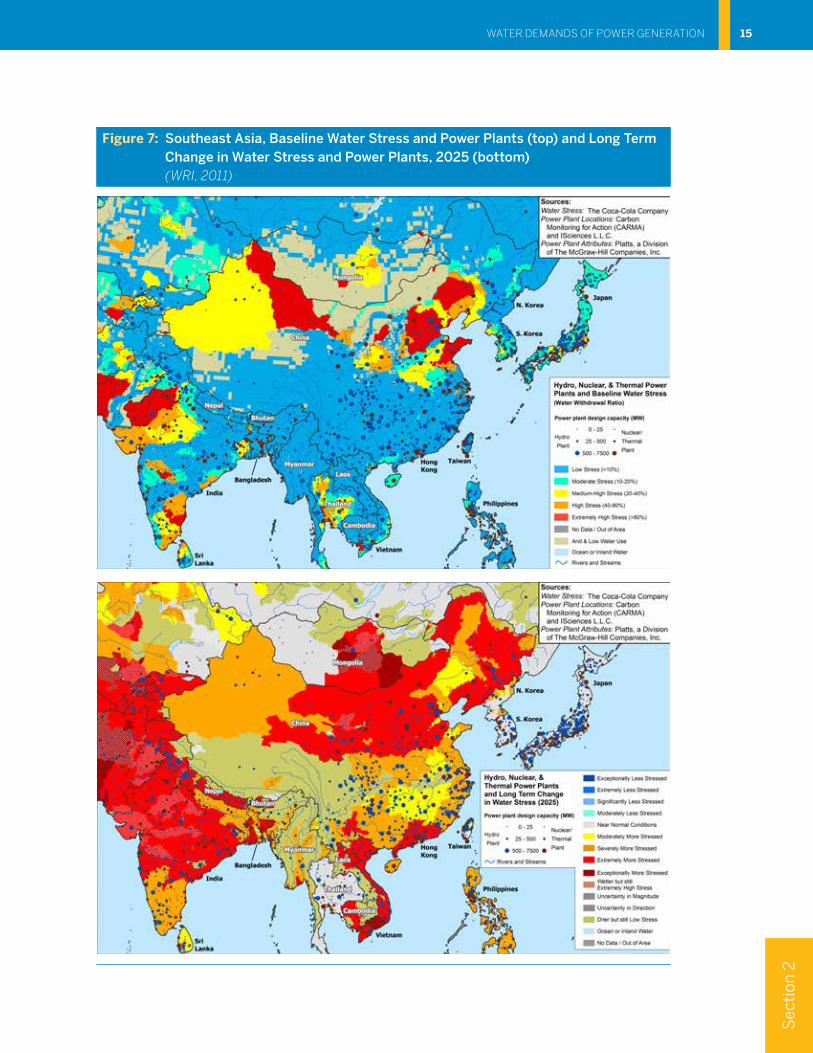
plant projects are located. Figure 6 depicts the
risks assessed by a study done by the World
Resources Institute (WRI) for Southeast Asia. The
impact of climate change and population growth
in the region will increase water stress on power
plant operations. The map at the top reveals the
baseline2 water stress3 conditions in Southeast
Asia, and the map at the bottom depicts water
stress power plants will face in 2025. The maps
show that 19 percent of the design capacity
of power plants in southeast Asia is located in
areas of “medium-high,4” “high,” or “extremely
high” baseline water stress, and that by 2025
(map on the right), 55 percent of these plants will
have “significantly worse,”5 “extremely worse,”
or “exceptionally worse” water stress. As climate
change impacts manifest themselves and global
resources are placed under additional pressure,
it is critical that governments prepare to ensure
the security and stability of their countries.
A changing climate and increasing water
variability will also affect hydropower as flows
shift due to changing precipitation. In addi-
tion, glaciers that feed hydropower plants
may disappear, thus jeopardizing the ability
of nations to generate power. Compounded
uncertainty due to changes in surface water
temperature, flows, and availability are forcing
companies to develop more sustainable prac-
tices to ensure the long-term viability of their
operations and infrastructure.
2 The baselines water stress is defined as the ratio of total annual freshwater withdrawals for the year 2000, relative to expected annual renewable freshwater supply based on 1950–1990 climatic norms. This ratio provides an assessment of the demand for freshwater from households, industry, and irrigation agriculture relative to freshwater availability in a typical year.3 In this study, water stress is defined as the ratio of water withdrawal to renewable supply.4 ‘Medium-high’ corresponds to a ratio of 20 to 40 per-cent of available freshwater used; ‘high’ corresponds to a ratio of 40 to 80 percent of available freshwater used; and ‘extremely-high’ corresponds to a ratio of more than 80 percent of available water used.5 WRI defines “significantly worse” as 2 to 2.8 times worse than baseline conditions; “extremely worse” means 2.8 to 8 times worse than baseline conditions; and “exceptionally worse” means more than 8 times worse than baseline conditions.
THIRSTY ENERGY14
Sec
tion
2
Figure 7: Southeast Asia, Baseline Water Stress and Power Plants (top) and Long Term Change in Water Stress and Power Plants, 2025 (bottom) (WRI, 2011)
WATER DEMANDS OF POWER GENERATION 15
Sec
tion
.3 .
Towards Potential Solutions: Improved .Management .of .the .Nexus
Opportunities for Synergies in Water and Energy Infrastructure
Although the link between water and energy is now evident, these two sectors have historically
been regulated and managed separately. The complexity of the system requires a more systematic
approach that takes into account all the existing interactions and relationships between sectors and
explores the strategic complementarities and potential synergies among infrastructure sectors, as
well as with other sectors. Energy and water planning must be integrated in order to optimize invest-
ments and avoid inefficiencies. Similarly, cross-sectoral implications need to be better understood.
In addition to taking water constraints in the energy sector into account when undertaking power
expansion plans, there are also many opportunities for the joint development and management of
water and energy infrastructure and technologies, maximizing co-benefits and minimizing negative
tradeoffs. When assessing the needs of the energy sector, water planners and decision makers must
fully understand the requirements of electricity generation technologies and their potential impact
on the resource. Similarly, energy planners and investors must take into account the complexities of
the hydrological cycle and other competing uses when assessing plans and investments. One way of
ensuring robust planning efforts is by implementing technical approaches and reforming governing
institutions. Specifically, technical approaches may include employing co-production synergies, such
as developing combined power and desalination plants, and using alternative sources of water for
thermal power plant cooling processes. Institutional reform will require integrated planning and cross-
sectoral communication to bolster efforts to mitigate the energy-water nexus, and must be achieved
before technical solutions can be successfully adapted.
An integrated energy and water planning approach can ensure that both resources are
developed sustainably as well as explore synergies more effectively. It is important to create inno-
vative approaches that encourage cross-sectoral cooperation and assess water and energy tradeoffs
at the regional and national levels, thereby ensuring that future demands will be met.
Technical Opportunities
There is an array of opportunities and technical solutions to reduce water use in power plants and to
exploit the benefits of possible synergies in water and energy. Given the different uses of dams, hydro-
power sustainability can be improved through integrated water and energy planning and management
(see next section). For other power technologies,
the shift towards those that require no water, such
as wind and solar photovoltaic, could reduce both
water requirements and greenhouse gas (GHG)
emissions by the power sector. Since most of the
water used by thermal power plants is for cooling
purposes, the focus there should be on technical
solutions that decrease freshwater needs. This
can be achieved by a) using cooling systems that
require none or very limited amounts of water,
b) decreasing the waste heat of the plant and, as a
result, decreasing the cooling needs, and c) using
alternative water sources, therefore displacing
freshwater needs. These options are described in
the sections that follow.
Alternative Cooling SystemsSince the amount of water required depends on
the cooling system used in the power plant, the
use of alternative cooling technologies, such as
dry cooling or hybrid cooling systems, can sig-
nificantly reduce the power sector’s water needs.
Dry cooling uses air instead of water as the main
heat transfer, and therefore does not consume
nor withdraw water. This type of cooling system
is suited for water scarce regions and is currently
being used in South Africa as well as in several
solar thermal power plant projects in arid areas.
Hybrid cooling uses a combination of dry and wet
cooling systems, thus consuming and withdrawing
less water than conventional systems. However,
regulations or policies are needed to encourage
alternative cooling systems because they are
often more expensive and less efficient than
conventional ones. These systems allow for the
location of power plants away from water sources
but could result in more costly investments.
Decreasing Waste Heat in Power PlantsAnother way to minimize water use in power plants
is by reducing the amount of heat that is dissipated
through the cooling system. This can be done by
improving the efficiency of the fleet or by reusing
some of the heat that is being lost. Some options
for reusing the waste heat are: combined power
and desalination plants, and combined heat and
power plants.
Combined Power and Desalination PlantsCombined power and desalination plants, or
hybrid desalination plants, can simultane-
ously produce drinking water and electricity.
This solution is especially suited for extreme arid
areas such as the Middle East, where there is
almost no water available and where desalination
will likely be implemented. Desalination is more
energy intensive than traditional water treatment.
However, in some regions of the world it might be
the only alternative available to meet the growing
demand for water. Hybrid desalination plants use
an innovative process to integrate desalination
with thermal power generation, which improves
the efficiency and lowers the electricity cost of
desalination processes. The waste heat from the
power plant is used as the heat source for the
desalination process.
Integrated water and energy production
has several benefits: a) the waste heat becomes
a resource, thus decreasing the volume of water
required for cooling purposes, b) the cost of
desalinating water decreases, so the option
becomes more economically attractive,6 and
c) the integrated system is more efficient than the
stand-alone option (a separate power plant and
a separate desalination plant). The disadvantage
is that the integrated system is harder to operate
due to seasonal variability. During winter, demand
for electricity can decrease; however, demand
for water can remain constant all year long. This
demand variability can be managed, but implies
that when the two demands are not constant, the
6 Some studies argue that this is the most feasible way to meet both electricity and water demand in arid areas (Pechtl, 2003).
THIRSTY ENERGY18
Sec
tion
3
to the energy savings, the payback time is usu-
ally quite long. As with combined desalination
and power plants, another disadvantage of CHP
is the seasonal variations that affect the perfor-
mance of the plant. Meeting the demand for heat
and power adds additional complexity to plant
operations. During the summer, it can become
challenging to deal with the extra heat.
Alternative Water SourcesAlternative, non-freshwater sources, such
as brackish water or seawater may be used
as cooling water for thermal power plants.
Although using alternative water sources can
be challenging, and costs vary depending on the
location of the source and water quality, alterna-
tive sources may reduce freshwater demands
and use. One solution widely employed in some
parts of the world is the use of sea water. How-
ever, this is only feasible if the power plant is
located near the coast.
Treated wastewater can be an attractive
cooling water alternative. However, there are
several issues that must be addressed. Waste-
water usually contains polluting substances. As a
result, the water must be treated in order to avoid
system is running below its possible efficiency.
There are different hybrid desalination plants in
the world. Examples include the Fujairah hybrid
plant in United Arab Emirates and the Shoaiba
power and desalination plant in Saudi Arabia.
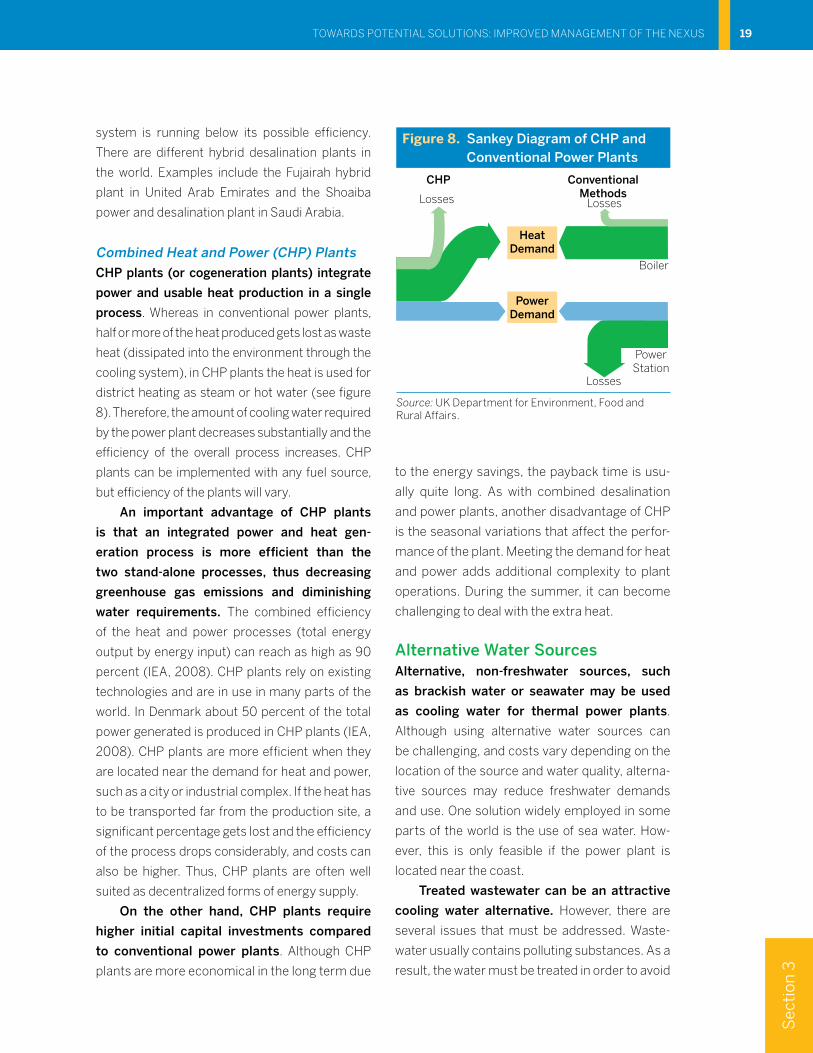
Combined Heat and Power (CHP) PlantsCHP plants (or cogeneration plants) integrate
power and usable heat production in a single
process. Whereas in conventional power plants,
half or more of the heat produced gets lost as waste
heat (dissipated into the environment through the
cooling system), in CHP plants the heat is used for
district heating as steam or hot water (see figure
8). Therefore, the amount of cooling water required
by the power plant decreases substantially and the
efficiency of the overall process increases. CHP
plants can be implemented with any fuel source,
but efficiency of the plants will vary.
An important advantage of CHP plants
is that an integrated power and heat gen-
eration process is more efficient than the
two stand-alone processes, thus decreasing
greenhouse gas emissions and diminishing
water requirements. The combined efficiency
of the heat and power processes (total energy
output by energy input) can reach as high as 90
percent (IEA, 2008). CHP plants rely on existing
technologies and are in use in many parts of the
world. In Denmark about 50 percent of the total
power generated is produced in CHP plants (IEA,
2008). CHP plants are more efficient when they
are located near the demand for heat and power,
such as a city or industrial complex. If the heat has
to be transported far from the production site, a
significant percentage gets lost and the efficiency
of the process drops considerably, and costs can
also be higher. Thus, CHP plants are often well
suited as decentralized forms of energy supply.
On the other hand, CHP plants require
higher initial capital investments compared
to conventional power plants. Although CHP
plants are more economical in the long term due
Figure 8. Sankey Diagram of CHP and Conventional Power Plants
CHP
HeatDemand
PowerDemand
ConventionalMethodsLosses Losses
Losses
Boiler
PowerStation
Source: UK Department for Environment, Food and Rural Affairs.
TOWARDS POTENTIAL SOLUTIONS: IMPROVED MANAGEMENT OF THE NExUS 19
nexus, what the merits of different technical
options are, or the possible outcomes. Exist-
ing publicly available models7 lack the capacity
to address issues surrounding the value of differ-
ent energy investments given likely or potential
future water constraints and competing trends.
Available models also lack the ability to address
the wider social, economic, and environmental
impacts of the energy-water nexus, and are
unable to identify the implications of potential
water and energy policies and investments
intended to address water constraints. These
challenges and complexities can no longer be
addressed in the conventional way, with each
sector taking decisions independently, with
separate regulations, and different goals.
The Conventional Approach in Water and Energy ModelsCurrently, the primary concern in managing
water resources is the distribution of water
over space and time in order to meet specific
objectives or demands. Most water allocation
modeling often assumes adequate energy sup-
plies will be available to divert, pump, and treat the
water. Few, if any, of the water allocation models
quantify the energy consumed in different water
demand scenarios. This isolated assessment of
water resources does not reflect the dynamic
interplay between energy and water, especially
due to the large energy demands required to
transport and treat water to meet an end use.
Water models typically require a high level
of hydrologic detail on a particular watershed,
making them data-intensive as well as complex.
Models can provide great detail of information
corrosion and other undesired effects in the cool-
ing system, which can be expensive. Moreover,
in most countries the use of treated wastewater
requires that power plant operators obtain
additional permits, resulting in higher adminis-
trative costs. However, in those same countries,
wastewater treatment plants are often required
to pre-treat municipal water to at least secondary
treatment standards before discharging it back
to the source.
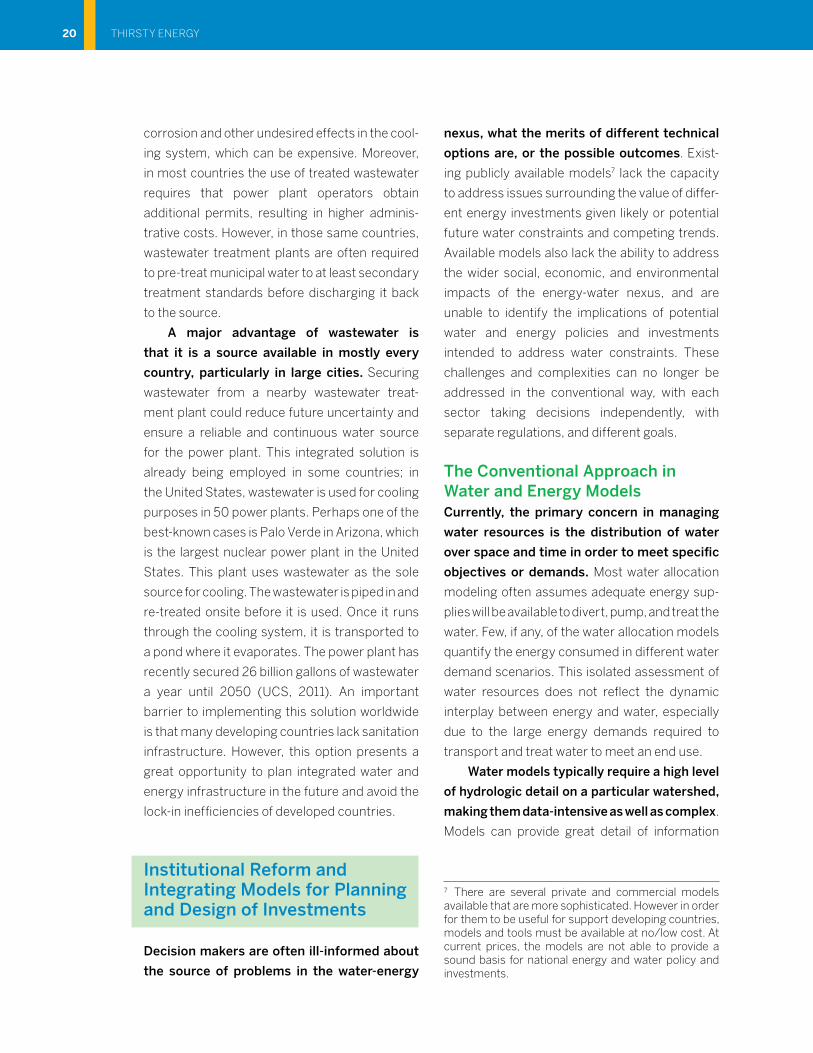
A major advantage of wastewater is
that it is a source available in mostly every
country, particularly in large cities. Securing
wastewater from a nearby wastewater treat-
ment plant could reduce future uncertainty and
ensure a reliable and continuous water source
for the power plant. This integrated solution is
already being employed in some countries; in
the United States, wastewater is used for cooling
purposes in 50 power plants. Perhaps one of the
best-known cases is Palo Verde in Arizona, which
is the largest nuclear power plant in the United
States. This plant uses wastewater as the sole
source for cooling. The wastewater is piped in and
re-treated onsite before it is used. Once it runs
through the cooling system, it is transported to
a pond where it evaporates. The power plant has
recently secured 26 billion gallons of wastewater
a year until 2050 (UCS, 2011). An important
barrier to implementing this solution worldwide
is that many developing countries lack sanitation
infrastructure. However, this option presents a
great opportunity to plan integrated water and
energy infrastructure in the future and avoid the
lock-in inefficiencies of developed countries.
Institutional Reform and Integrating Models for Planning and Design of Investments
Decision makers are often ill-informed about
the source of problems in the water-energy
7 There are several private and commercial models available that are more sophisticated. However in order for them to be useful for support developing countries, models and tools must be available at no/low cost. At current prices, the models are not able to provide a sound basis for national energy and water policy and investments.
THIRSTY ENERGY20
Sec
tion
3
manner. A wide range of models are available,
from fairly basic electricity capacity expansion
models to detailed electricity network models to
economy-wide general equilibrium models with
representations of various types of energy sup-
ply and demand. However, the energy models
do not address total water availability and its
dynamic nature or tradeoffs among water uses.
In some advanced models water availability and
variability are taken into account mainly as they
affect hydropower production. The links between
water availability and variability and other sec-
tors are usually handled by incorporating exog-
enous constraints or parameters into the energy
models (e.g. minimum environmental or naviga-
tion outflows, quotas for irrigations, among
others). The Long Range Energy Alternatives
Planning system (LEAP) is a widely used energy
model because it provides a simple accounting
framework, although it has limited optimizing
capabilities. Other more sophisticated models,
such as MESSAGE and MARKAL/TIMES, apply
least-cost optimization that addresses the com-
plexity of all technology options, especially for
full-sector models that include end-use technol-
ogy options. These models allow for the assess-
ment of a wide variety of policies and technology
options, and provide a consistent framework for
assessing their costs and benefits (annex 3 pro-
vides a detailed assessment of different publicly
available models).
Projected climate change and impacts
on water availability are not commonly fac-
tored into conventional energy planning and
operations. Global warming will likely cause
increased competition for water resources from
sectors such as agriculture and water recreation.
The usual methodological approach to assess
climate impacts on hydropower resource endow-
ments consists of translating long-term climate
on water circulation in the watershed, such as
stream flows, evapotranspiration, return flows,
exchange between surface and ground water.
Yet, scaling up models to assess national water
budgets is data intensive and often too detailed
for first level resource assessments. In addition,
while economic parameters can be combined
with hydrological modeling to analyze the costs
and value of output for a new hydroelectric invest-
ment, economic analysis of water allocation at a
national level requires more economic detail on
competition among alternative water uses.
Similarly, energy planning is primarily
concerned with siting and cost requirements
for energy generation in the context of
transmitting the produced energy to popula-
tion centers. Except for systems dominated
by hydropower, the supply of water necessary
for power generation at the upstream plan-
ning stage is typically assumed to exist and is
often not considered to be a limiting factor in
operations (although it is accepted that potential
constraints will be an important factor). Models
do not consider dynamically the use of water
to generate the energy required by water infra-
structure. In these situations, there is an inherent
multiplier on both energy and water demands
that may be overlooked when employing the
traditional approach to modeling and analysis.
While this effect may be quite marginal in regions
with ample supplies of both water and energy, it
could become a central cross-sector constraint
in regions with resource scarcity and will require
accurate evaluation and analysis.
Although energy models mainly focus
on generation, they have advanced signifi-
cantly over the last 40 years, incorporating
estimates of water demand for energy pro-
duction through simple coefficients of water
utilization per unit of output.8 Several energy
systems models have been specifically devel-
oped to assist resource managers to develop
water and energy resources in a sustainable 8 Mainly for electricity, but can include water for biofuels, mining, and refining as well.
TOWARDS POTENTIAL SOLUTIONS: IMPROVED MANAGEMENT OF THE NExUS 21
eling frameworks, b) incorporate energy pro-
duction and uses into existing water resource
modeling frameworks, or c) build a new inte-
grated framework. Of the existing modeling
frameworks and current approaches to model-
ing energy and water, it appears that the most
promising model is a nested approach that incor-
porates water resources and uses into existing
energy modeling frameworks. This conclusion is
further supported by the fact that energy system
planning models currently exist in many develop-
ing and emerging economies.
There are several publicly available mod-
eling frameworks under development that
aim to provide an integrated energy-water
planning capability. One such model is the inte-
grated LEAP-WEAP model. The linkages between
the two models allows planners to track water
demands for the energy sector as defined by
LEAP, and allows LEAP to track energy demands
for various water processes (drinking water, agri-
culture, etc.) as outlined in WEAP. The priority for
water lies within WEAP, which will “inform” LEAP
when water availability is not sufficient for LEAP’s
proposed energy pathway. The program will then
have to iterate until a balance is reached. While
the combined WEAP-LEAP model represents
each sector in detail, the model must overcome
several differences in order for the systems to be
dynamically linked. First, LEAP must be modified
to include water demands for energy processes,
and WEAP must be modified to include energy
demands for water processes. Secondly, WEAP
and LEAP must produce results for identical time
steps. To achieve this LEAP was recently updated
to include daily, weekly, monthly, and seasonal
time slices. Additionally, WEAP and LEAP must
agree on the spatial boundary for the model.
WEAP applies primarily to watershed boundaries,
while LEAP deals mainly with political boundaries.
variables into runoff, although this involves great
uncertainty.
Integrated Energy-Water Planning ApproachThe tendency for traditional planning is to be
narrowly focused and exclusionary (Grigg,
2008). Risk avoidance and control of resources
is a paramount consideration in traditional plan-
ning for electrical utilities and water resources,
but successful planning requires that govern-
ment agencies and stakeholders participate in
making decision through a coordinated process
that includes conflict resolution. Integrated
resource planning of the energy-water nexus
often emphasizes the importance of establishing
a more open and participatory decision-making
process and coordinating the many institutions
that govern water resources. Therefore, the
energy-water planning approach encourages
the development of new institutional roles and
processes in addition to strengthening existing
planning and analytical tools. It also promotes
consensus building and alternative dispute reso-
lution over conflict and litigation.
Due to the lack of integrated planning
around energy-water management, an inte-
grated energy-water modeling framework
needs to address the shared needs of energy
and water producers, resource managers,
regulators, and decision makers at the fed-
eral, state, and local levels. Ideally, the frame-
work should provide an interactive environment
to explore tradeoffs and potential synergies, and
also evaluate alternative energy/water options
and objectives. In particular, the modeling
framework needs to be flexible in order to facili-
tate tailored analyses over different geographical
regions and scales (e.g., national, state, county,
watershed, interconnection region).9
There are three possible approaches
to address the nexus: a) incorporate water
resources and uses into existing energy mod-9 Annex 3 discusses the requirements of an energy-water integrated model in more detail.
THIRSTY ENERGY22
Sec
tion
3
of risk and uncertainty. Resource cost and avail-
ability are typically defined by supply-cost curves,
which are inputs to the model. Uncertainty in
the cost or availability of specific resources is
traditionally handled through scenario or sensi-
tivity analyses that can determine different model
results when these parameters are changed.
Examples of when it is important to investigate
uncertainty in this area include situations where
the energy system is dependent on a significant
amount of imported fuels, or where environmental
or technological concerns may significantly alter
the cost or availability of extracting or processing
certain resources, and where weather/climate
unpredictability may have extreme impacts on
water for power generation.
Uncertainty in demand projections is
typically only investigated through scenario
analyses, where specific changes in future
energy demands are postulated based on
specific changes in underlying assumptions
behind the original demand projection, such
as a change in gross domestic product (GDP)
or population growth rates. The introduction
of water into energy models introduces new
areas of uncertainty. The biggest of these is
the variable nature of the underlying weather
data projection and its correlation to the energy
service demand projection. Energy system
models do not normally deal with this kind
of variability. Water models are often used to
determine the resilience of the water system
to weather extremes. Energy system models
are more often used to identify economically
optimal investments out of a large variety of
possible options. Integrating water systems
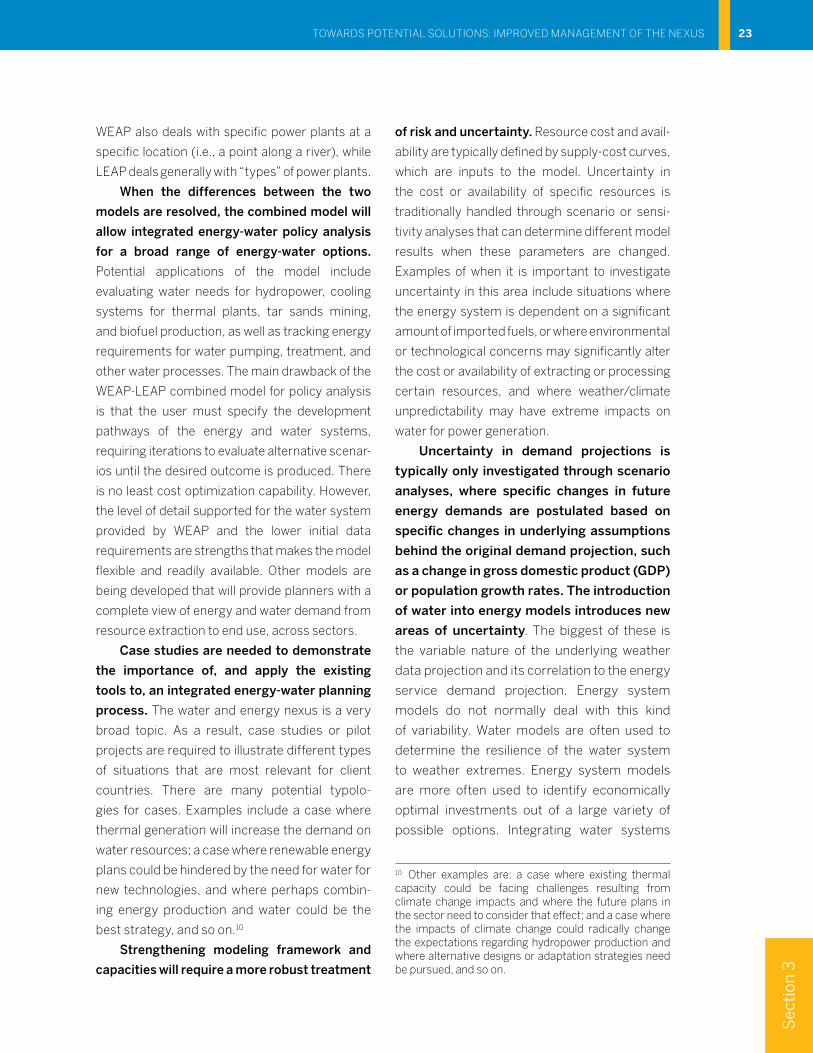
WEAP also deals with specific power plants at a
specific location (i.e., a point along a river), while
LEAP deals generally with “types” of power plants.
When the differences between the two
models are resolved, the combined model will
allow integrated energy-water policy analysis
for a broad range of energy-water options.
Potential applications of the model include
evaluating water needs for hydropower, cooling
systems for thermal plants, tar sands mining,
and biofuel production, as well as tracking energy
requirements for water pumping, treatment, and
other water processes. The main drawback of the
WEAP-LEAP combined model for policy analysis
is that the user must specify the development
pathways of the energy and water systems,
requiring iterations to evaluate alternative scenar-
ios until the desired outcome is produced. There
is no least cost optimization capability. However,
the level of detail supported for the water system
provided by WEAP and the lower initial data
requirements are strengths that makes the model
flexible and readily available. Other models are
being developed that will provide planners with a
complete view of energy and water demand from
resource extraction to end use, across sectors.
Case studies are needed to demonstrate
the importance of, and apply the existing
tools to, an integrated energy-water planning
process. The water and energy nexus is a very
broad topic. As a result, case studies or pilot
projects are required to illustrate different types
of situations that are most relevant for client
countries. There are many potential typolo-
gies for cases. Examples include a case where
thermal generation will increase the demand on
water resources; a case where renewable energy
plans could be hindered by the need for water for
new technologies, and where perhaps combin-
ing energy production and water could be the
best strategy, and so on.10
Strengthening modeling framework and
capacities will require a more robust treatment
10 Other examples are: a case where existing thermal capacity could be facing challenges resulting from climate change impacts and where the future plans in the sector need to consider that effect; and a case where the impacts of climate change could radically change the expectations regarding hydropower production and where alternative designs or adaptation strategies need be pursued, and so on.
TOWARDS POTENTIAL SOLUTIONS: IMPROVED MANAGEMENT OF THE NExUS 23
energy investments given the potential future
constraints and the wider social, environmen-
tal, and economic implications of potential
water and energy policies, including invest-
ments intended to address water constraints.
Existing models do not provide the capacity to
address these questions, and so are not able to
provide a sound basis for national energy and
water policy and investments. This is of par-
ticular concern for countries with strong energy
demand growth, or significant declines in per
capita water supply.
Addressing these shortcomings is not
simply a matter of integrating physical water
use into energy models. Economic analysis is
necessary when assessing tradeoffs. Water and
energy are crucial inputs into economic produc-
tion. Tightening constraints may introduce the
potential for reductions in economic activities.
Increasing water demand and scarcity may
increase market prices for water and energy
and lead to the redistribution of these increas-
ingly scarce resources. In the case of water,
increasing scarcity in one area is likely to result
in the increased purchase of food products
from another area. When this occurs, significant
structural adjustments can take place. These
adjustments need to be managed with sensitiv-
ity in order to forestall short-term increases
in overall economic activity and employment.
Actual outcomes will depend on the capacity of
a community to adjust; the rates of technological
progress in water efficiency in energy and food
production; and knowledge provision, institu-
tional, governance, and planning arrangements
to facilitate efficient investment and synergies
in water and energy planning. One of the more
difficult issues to manage is the fact that the
economic value of water to the energy sector,
at the margin, will generally be greater than its
economic value to agriculture, while the implicit
political power of the agricultural sector can
sometimes be greater than that of the energy
into energy optimization models will require
careful design of the input data sets to avoid or
minimize inconsistencies. Precipitation levels
and temperature data are primary drivers of
water availability, and they also directly affect
the levels of energy services required for space
heating and cooling as well as many other
energy services. Integrated models will require
the development of a coherent set of weather
and energy demand projections.
The proposed modeling framework must
incorporate the long-term effects of climate
change. Climate change has an impact on both
the energy and the water sector. Moreover,
some mitigation policies may exacerbate chal-
lenges presented by the nexus in the future.
Increased energy demand may occur with
decreasing water resources (due to climate
change and other social and environmental
pressures). In combination, this may be a seri-
ous problem that planners are not adequately
considering today. There is a need to explore
the potential technological, social, political, and
economic shifts involved in achieving different
global climate trajectories and account for the
potential impacts of climate change in the water
and energy sectors.
The issue of agriculture, in particular food
production is an integral part of the nexus.
Water and energy are required in the agriculture
sector, and some crops are used for the produc-
tion of biofuels, which compete with food crops
for water and land. However, bringing food into
the mix adds several complexities to the model-
ing framework (e.g., modeling biofuels), which
make such an approach extremely difficult to
address. One possibility is to incorporate agri-
culture indirectly by adding the water demand of
the sector (and other competing uses of water)
into the modeling exercise.
Addressing the water and energy nexus
will require the capacity and modeling tools
to understand the advantages of different
THIRSTY ENERGY24
Sec
tion
3
as by portraying the energy sector as damaging
agricultural interests and threatening food secu-
rity. The output from the different energy and
water planning models will be then incorporated
into an economic model that will make it possible
to look at different policy options.
sector. This implies that the energy sector will
generally be willing and able to pay more for
water than competing agricultural uses. The risk
associated with this is that some agricultural
groups may seek to use their political power to
redress this difference in economic power, such
TOWARDS POTENTIAL SOLUTIONS: IMPROVED MANAGEMENT OF THE NExUS 25
Sec
tion
.4 .
Conclusions and Recommendations
Integrated energy-water modeling allows resource planners to consider whether water supply today and in the future will be sufficient to meet the cooling requirements of different power plants. Today, most of the energy-
water planning efforts are specific to the United States, and the initiatives are in their pilot and research stages. Developing countries lack detailed energy studies and projections, limiting their capacity to fully assess energy-water impacts. There is scant literature regarding energy projections and associated water consumption for developing countries. If an analytical modeling framework is to be employed, several additional steps must be taken, including data collection, model(s) development and verification, and stakeholder involvement. The tools must be reviewed by stakehold-ers and need to clearly identify the tradeoffs associated with different operational and policy decisions. Finally, a decision making process must be developed that incorporates all of the above in order to have practical, real-world applications.
Modeling for integrated energy-water planning and water allocation must have a solid
basis for identifying current and future levels of water availability. The models must incorporate
accurate projections for water demands and consumptive use for all sectors: energy, agriculture
(including biomass), public water supply, and the environment. Accurate projections for water supply
(not availability, but natural water supply) are also needed. The models must address variability in
scale to ensure results are congruent with respective water basin and the corresponding political/
administrative control of the basin/region. Climate change’s impact on supply and demand should
also be considered.
Improved modeling will ensure that power plants are more strategically located and that
they implement technologies that increase energy efficiency. Examples include hybrid desalina-
tion plants, which produce drinking water while generating electricity; combined heat and power
plants that integrate power and usable heat production into one process; and water energy recovery
from sewerage that captures methane and carbon dioxide in the waste to generate energy. Such inte-
grated technologies have several benefits, including that they turn waste products, such as heat, into
an input for another process. Moreover, energy and water planning that optimizes both resources will
result in a more diversified energy mix, including renewables that consume almost no water, such as
wind and solar photovoltaics. Also, shifting from
old (coal) power plants to newer, more efficient
plants, such as natural gas combined cycle
power plants would significantly reduce water
use in the power sector.
Comprehensive approaches that con-
sider the diverse set of factors that influence
energy and water demand and incorporate
those issues into solutions will provide a
robust management framework for the
energy-water nexus. Management capacities
will be strengthened by integrated modeling
approaches that allow governments to adapt
to change, such as population and economic
growth. This will enhance a nation’s resiliency in
the face of uncertainties brought on by climate
change.
Integrated planning will require regula-
tory and political reform. Currently, laws and
regulations governing water use vary, some
are quite complex, while others are vague and
inconsistent. Determining what laws govern
water can be expensive and time consuming,
thus preventing certain stakeholders from
acquiring all the information they need or
understanding their full implication. In addi-
tion, laws determining water rights may further
complicate matters as some may govern an
entire region, while others are basin specific.
Certain groups hold special privileges of prior
appropriation, recognizing their “first right” to
water withdrawals. Thus, in basins where water
rights are fully allocated, transferring water
rights could be difficult or expensive.
The energy-water nexus will be addressed
more effectively through enhanced stake-
holder collaboration. Integrating policy to
respond to challenges presented by the energy-
water nexus will be a difficult. Through the incor-
poration of energy and water policy, existing
synergies may be exploited more effectively. If
policymakers improve coordination, the uncer-
tainties brought on by climate change and the
nexus may be made more manageable. If not,
then they will be forced to address scenarios
with policies that have cross purposes and
deal with crises that could have been mitigated
(Faeth, 2012).
Sustainable solutions require that issues
not be addressed in isolation but through a
systems approach of integrated solutions.
Such solutions can only be achieved if there
is communication between engineers and
scientists in different disciplines as well as with
technical experts and professionals in the social
sciences, and economic and political decisions
makers (Olsson, 2012). Cooperation is also a key
element in integration, whether by formal or by
informal means.
It is critically important to involve the
public affected by the development and
maintenance of a project. Therefore, the
recording and collection of data, and the
development and application of models at the
basin level are needed to illustrate the benefits
of bottom-up (versus top-down) approaches
to integrating energy and water resources
planning. Focusing on smaller basins will help
member states benefit from understanding
the impact of their planning and actions at the
local level. The lessons learned from energy-
nexus planning and implementation will carry
these efforts forward on larger scales, such as
regions.
To enhance these efforts and provide
additional solutions and recommendations,
the World Bank will continue to work with
client countries to develop integrated water
and energy management strategies through
a series of case studies. Different tools and
approaches will be developed and implemented
that will enable countries to address and quan-
tify the impacts of water constraints on the
energy sector and the potential tradeoffs with
other economic sectors. Thus, the initiative will
demonstrate the breadth of benefits that the
THIRSTY ENERGY28
Sec
tion
4
integrated planning of energy and water invest-
ments has on a nation’s long-term economic
stability and well-being. This is the first introduc-
tory report of the initiative. Findings from the
case studies will be disseminated to promote
best practices in integrated water and energy
planning, and means of mitigating pressures
brought on by the nexus.
CONCLUSIONS AND RECOMMENDATIONS 29
AACM and Centre for Water Policy Research.
1995. Enhancing Effectiveness of Catch-
ment Management Planning. Final Report
to the Australian Department of Primary In-
dustries and Energy.
Aguas Andinas, ND. Press release. Retrieved
from: http://www.aguasandinas.cl/la-em-
presa/novedades/aguas-andinas-y-metro-
gas-inauguran-planta-de-biogas?CodTempl
ate=20120213120706
Argonne National Laboratory. 2007. Use of Re-
claimed Water for Power Plant Cooling. For
the US Department of Energy by J.A: Veil,
Environmental Science Division, Argonne
National Laboratory. ANL/EVS/R-07/3.
Babel M.S., Gupta, and Nayak. 2005. “A Model
for Optimal Allocation of Water to Compet-
ing Demands.” Water Resource Manage-
ment 19: 693–712.
Bazilian M., Rogner H., Howells M., Hermann S.,
Arent D., Gielen D., Steduto P., Mueller A.,
Komor P., Tol R.S.J. and K.K. Yumkella. 2011.
“Considering the energy, water, and food
nexus: Towards an integrated modelling ap-
proach.” Energy Policy. Volume 39, Issue 12:
pp. 7896–7906.
Bhatt V., Crosson, Horak and A. Reisman. 2008.
New York City Energy-Water Integrated
Planning: A Pilot Study. Brookhaven Nation-
al Laboratory. NY: USA.
Boston Globe. 2011. Agreement to cut power
plant discharge, send steam heat to Boston.
Retrieved online from: http://www.boston.
com/news/science/articles/2011/02/02/
power_ plant _ plan _to_cut _ discharge _
send_heat_to_boston/?page=1
Brookhaven National Laboratory. 2008. New
York City Energy-Water Integrated Planning:
A Pilot Study. December 2008.
Business Week. 2012. “Asia Risks Water Scarcity
Amid Coal-Fired Power Embrace”. Bloom-
berg News. Found here: http://www.busi-
nessweek.com/news/2012–09-09/asian-
water-scarcity-risked-as-coal-fired-power-
embraced#p1
Dale, Larry. 2011. Lawrence Berkeley National
Laboratory. Modeling Energy Water Use in
California: Overview. November 2011.
Delaquil, Pat, Gary Goldstein, and Justin An-
thony Smith. 2012. Energy-Water Nexus for
Green Growth: Scoping of Key Gaps in Knowl-
edge and Methods. Unpublished document.
Delgado, Anna. 2012. “Water Footprint of Elec-
tric Power Generation: Modeling its use and
analyzing options for a water-scarce future,”
Massachusetts Institute of Technology,
June 2012.
Dethier, Jean-Jacques and Alexander Moore.
2012. Infrastructure in developing coun-
tries: An overview of some economic is-
sues. ZEF – Discussion Papers on Develop-
ment Policy No. 165, Center for Develop-
ment Research, Bonn, April 2012, pp. 51.
ISSN: 1436-9931.
Dinar A., M. Rosengrant, and R. Meinzen-Dick.
1997. Water Allocation Mechanisms. Policy
References
International Atomic Energy Agency (IAEA).
2011. Soils Newsletter. 34 1. July 2011. (in
press). Seeking Sustainable Climate, Land,
Energy and Water (CLEW) Strategies.
International Energy Agency (IEA), 2010. World
Energy Outlook 2010. International Energy
Agency. Paris.
International Energy Agency (IEA). 2008. Com-
bined Heat and Power. Evaluating the Ben-
efits of Greater Global Investments. OECD/
IEA, Paris France.
International Energy Agency (IEA). 2012. World
Energy Outlook 2012. International Energy
Agency, Paris.
International Institute for Applied Systems
Analysis. Model for Energy Supply Strategy
Alternatives and their General Environmen-
tal Impact (MESSAGE). Available online at:
http://www.iiasa.ac.at/Research/ENE/
model/message.html
International Resources Group. MARKAL Inte-
grated Energy System Planning.
Kundzewicz, Z.W., L.J. Mata, N.W. Arnell, P. Doll,
P. Kabat, B. Jimenez, K.A. Miller, T. Oki, Z.
Sen, and I.A. Shiklomanov. 2007. “Freshwa-
ter resources and their management.” In Cli-
mate Change 2007: Impacts, Adaptation and
Vulnerability. Contribution of Working Group
II to the Fourth Assessment Report of the In-
tergovernmental Panel on Climate Change.
Lawrence Berkeley National Laboratory. 2010.
Water-Energy & Climate: Modeling the
Linkages.
Macknick, J., Newmark, R., Heath, G. and Hal-
let, KC. 2011. “A Review of Operational Water
Consumption and Withdrawal Factors for
Electricity Generating Technologies,” Tech-
nical Report No. NREL/TP-6A20-50900.
U.S. DOE National Renewable Energy Labo-
ratory, Boulder, CO.
Margerum, Richard D. 1996. Integrated Water-
shed Management: Comparing Selected Ex-
periences in the U.S. and Australia. Centre
Research Working Paper 1779. Washington,
DC: The World Bank.
Dozier A., Labadie and Zimmerle. 2012. Integrat-
ing River Basin Operations Modeling with
Power System Economic Dispatch. Colora-
do: Colorado State University.
Faeth, P. 2012. “U.S. Energy security and wa-
ter: The challenges we face.” Environment:
Science and Policy for Sustainable Develop-
ment. January-February 2012.
Food and Agricultural Organization (FAO). 2012.
World Agriculture Towards 2030/2050: The
2012 Revision. Nikos Alexandratos and Jelle
Bruinsma. ESA Working Paper No. 12-03.
FAO: Rome, Italy.
Food and Agricultural Organization (FAO). 2011.
Cooling water for energy generation and its
impact on national-level water statistics.
Amit Kohly and Karen Frenken. Aquastat,
FAO: April 2011.
Food and Agricultural Organization (FAO). 2008.
Climate Change, Water and Food Secu-
rity. Technical Background Document from
the Expert Consultation. February 26–28,
2008. FAO: Rome, Italy.
Global CCS Institute (2013) http://www.glo-
balccsinstitute.com/projects/browse.
Grigg, N. S. 2008. Total water management: Prac-
tices for a sustainable future. Denver, Colora-
do: American Water Works Association.
Hermann, S., Rogner, H., Young, C., Welsch, M.,
Ramma, I., Howells, M., Dercon, G., Nguyen,
M., Fischer, G. and H. Veld (Forthcoming)
Seeking CLEWS – Climate, Land, Energy
and Water Strategies – A pilot case study in
Mauritius.
Hoff, H., Bonzi, Joyce, and K. Tielborger. 2011. A
Water Resources Planning Tool for the Jordan
River Basin. Water 2011. ISSN 2073-4441.
Hogner H. Not dated. Climate, Land, Energy and
Water Modeling – an Illustrative Case Study
in Mauritius. Presentation at the Natural Re-
sources Forum. New York: USA.
THIRSTY ENERGY32
for Water Policy Research. University of New
England.
Müller, Christian. 2007. Anaerobic Digestion
of Biodegradable Solid Waste in Low- and
Middle-Income Countries. Overview over
existing technologies and relevant case
studies. Dübendorf, Eawag. www.eawag.
ch. May 2007.
Murray, Doug. 2011. Water-Energy Model-
ing. January 2011. Available at: http://
www.ercot.com/content/meetings/lts/
keyd o c s /2 01 1 /01 10/ Wa te r_ P ro j e c t _
LTSTF_10JAN2011.pdf
Olsson, Gustaf. 2012. Water and Energy Nexus:
Threats and Opportunities. London: IWA
Publishing.
Organisation for Economic Co-operation and
Development (OECD). 2012. Infrastructure
to 2030: telecom, Land, Transport, Water
and Electricity. Paris. OECD Publishing.
Organisation for Economic Co-operation and
Development (OECD). In press. Water, Ener-
gy and Agriculture: Meeting the Nexus Chal-
lenge. OECD: Paris, France.
Pate, Ron, Michael Hightower, Chris Cameron,
and Wayne Einfeld. 2007. Overview of En-
ergy-Water Interferences and the Emerg-
ing Energy Demands on Water Resources.
Sandia National Laboratories. Albuquerque,
New Mexico. March 2007.
Patwardhan, Avinash S., Thomas, Elizabeth,
McLane, Krai, Tyagi, Aditya and Mitch Grif-
fin. 2008. Planning and Managing the Grow-
ing Thirst: Solutions Using Total Water Man-
agement. American Water Works Associa-
tion – Sustainable Water Sources.
Pechtl, Peter, Marco Dieleman, Martin Posch,
Bijan Davari, Michael Erbes and Stefan
Schneeberger. 2003. “Integrated Thermal
Power and Desalination Plant Optimization.”
General Electric Energy Services, Optimiza-
tion Software. PowerGen Middle East, Octo-
ber 2003, Paper No. 110
Pegasys. 2011. Conceptual Framework for As-
sessing Water Use in Energy Generation
with a Focus on Hydropower. Cape Town,
South Africa.
Qureshi, Zia. 2012. Rebalancing, Growth, and
Development in a Multipolar Global Econo-
my. The World Bank, May 2011.
Rockstrom, Johan, Lannerstad, Mats and Ma-
lin Falkenmark. 2007. Assessing the water
challenge of a new green revolution in devel-
oping countries. The National Academy of
Sciences. 104 15, pp. 6253–6260. April 10,
2007.
Rodriguez, Diego, van den Berg, Caroline, and
McMahon, Amanda. 2012. Investing In Wa-
ter Infrastructure: Capital, Operations and
Maintenance. Water Papers. World Bank
Group. November 2012.
Rubbelke and Vogele 2011. Impacts of climate
change on European critical infrastructures:
The case of the power sector, Environ. Sci.
Policy, vol. 14, p. 53–63, 2011.
Sandia National Laboratory. 2011. Energy and
Water in the Great Lakes. Albuquerque, New
Mexico.
Sauer, Amanda, Piet Klop and Sumeet Agrawal.
2010. “Over Heating: Financial Risks from
Water Constraints on Power Generation in
Asia; India, Malaysia, Phillipines, Thailand,
Vietnam.” World Resources Institute.
Schmidt R.D., Stodick L., and R.G. Taylor. 2009.
Modeling Spatial Water Allocation and Hy-
drologic Externalities in the Boise Valley.
United States Department of Interior – Bu-
reau of Reclamation.
Schornagel, Joost, Frank Niele, Ernst Worrell, and
Maike Boggermann. 2012. “Water account-
ing for (agro) industrial operations and its
application to energy pathways.” Resources,
Conservation and Recycling. 61 (2012): 1–15.
Segerstrom, Rebeca. 2011. Building a Wa-
ter-Energy Nexus Modeling Tool for
New York City. Master’s Thesis. Uppsala
REFERENCES 33
Yongbeom Kim, and Claudia Sepulveda. The
World Bank.
United Nations. 2012. UN Water Report. Avail-
able here: http://www.unwater.org/down-
loads/UNW_status_report_Rio2012.pdf
Union of Concerned Scientists (UCS). 2011.
Freshwater use by U.S. power plants: Elec-
tricity’s thirst for a precious resource. A re-
port of the Energy and Water in a Warming
World initiative. Cambridge, MA: Union of
Concerned Scientists. Avery, K., J. Fisher, A.
Huber-Lee, A. Lewis, J. Macknick, N. Mad-
den, J. Rogers, and S. Tellinghuisen. Novem-
ber 2011.
UCS 2010. “How It Works: Water for Power Plant
Cooling.” Union of Concerned Scientists.
N.p., 5 Oct. 2010. http://www.ucsusa.org/
clean_energy/our-energy-choices/energy-
and-water-use/water-energy-electricity-
cooling-power-plant.html.
United States Department of Energy (DOE).
2009. Estimating freshwater needs to meet
future thermoelectric generation require-
ments, 2008 update. Available on <http://
www.netl.doe.gov/technologies/coalpow-
er/ewr/pubs/2008_Water_Needs_Analy-
sis-Final_10-2-2008.pdf>
United States Department of Energy. 2006. En-
ergy Demands on Water Resources. Report
to Congress on the Interdependency of En-
ergy and Water. December 2006.
United States Environmental Protection Agency
(EPA). 2011. Opportunities for Combined
Heat and Power at Wastewater Treatment
Facilities: Market Analysis and Lessons from
the Field. U.S. Environmental Protection
Agency (EPA). Combined Heat and Power
Partnership, October 2011.
United States Geological Survey USGS. 2005.
Estimated Use of Water in the United States
in 2005.
van Vliet. 2012 “Vulnerability of US and European
electricity supply to climate change,” Nature
University: Sweden. Available online at:
http://uu.diva-portal.org/smash/record.
jsf?pid=diva2:467860&rvn=1
Shuster E. 2008. Estimating Freshwater Needs
to Meet Future Thermoelectric Generation
Requirements. National Energy Technology
Laboratory – U.S. Department of Energy.
Sri, Perini Praveena. 2010. Electrical Energy-Wa-
ter Nexus: Managing the Seasonal Linkages
of Fresh Water Use in Energy Sector for Sus-
tainable Future. East Asia Bureau of Econom-
ic Research Working Paper WP-2010-017.
Stewart, Robert, Wilfred Wollheim, Ariel Miara,
Charles Vorosmarty, Balazs Fekete, Richard
Lammers, and Bernice Rosenzweig. 2013.
“Horizontal cooling towers: riverine ecosys-
tem services and the fate of thermoelectric
heat in the contemporary Northeast US.”
Environmental Research Letters.
Stillwell A., King, Webber and Hardberger Dun-
can. 2009. Energy-Water Nexus in Texas.
Austin, Texas: The University of Texas at
Austin and Environmental Defense Fund.
Stockholm Environment Institute (SEI). 2011.
Energy-Water-Climate Planning for Develop-
ment Without Carbon in Latin America and
the Caribbean. Boston, MA: Stockholm Envi-
ronment Institute.
Stockholm Environment Institute (SEI). 2011.
Understanding the Nexus: Background pa-
per for the Bonn 2011 Nexus Conference
The Water, Energy and Food Security Nexus,
Solutions for the Green Economy 16–18 No-
vember 2011.
Stockholm Environment Institute. 2010. Inte-
grating WEAP and LEAP Tools for Modeling
Energy-Water Connections. Boston, MA:
Stockholm Environment Institute.
Toman, Michael, Daniel Benitez, and Stefan Cs-
ordas. 2011. “Infrastructure and Sustain-
able Development.” In Postcrisis Growth
and Development: A Development Agenda
for the G-20 edited by Shahrokh Fardoust,
THIRSTY ENERGY34
and Development; Sustainable Develop-
ment of the Vice Presidency.
World Bank. 2004. Infrastructure Services in De-
veloping Countries: Access, Quality, Costs
and Policy Reform. Cecilia Briceño-Garmen-
dia, Antonio Estache, Nemat Shafik. INFVP.
World Bank Policy Research Working Paper
3468, December 2004.
World Economic Forum in partnership with Cam-
bridge Energy Research Associates. 2008.
Energy Vision Update 2009 – Thirsty Energy:
Water and Energy in the 21st Century. Gene-
va, Switzerland: World Economic Forum.
World Energy Council. 2010. Water for Energy.
London, UK: World Energy Council.
World Health Organization. (2012). WHO/UNI-
CEF. 2012. Joint Monitoring Programme
for Water Supply and Sanitation. New York:
UNICEF.
World Policy Institute. 2011. The Water-Energy
Nexus: Adding Water to the Energy Agen-
da. Diana Glassman, Michele Wucker, Ta-
nushree Isaacman and Corinne Champilou.
New York: World Policy Institute and EBG
Capital, March 2011.
World Resources Institute (WRI). 2011. Aque-
duct and the Water-Food-Energy Nexus.
Accessed online: http://insights.wri.org/
aqueduct/2011/11/aqueduct-and-water-
food-energy-nexus
World Water Assessment Program (WWAP).
2012. The United Nations World Water De-
velopment Report 4. Paris, UNESCO.
Yepes, Tito. 2008. “Investment Needs for Infra-
structure in Developing Countries 2008–
2015.” Latin America and Caribbean Region,
World Bank. Unpublished.
Climate Change, M. van Vliet, J. Yearsley and
et.al., vol. 9, p. 676–681, 2012.
Voinov, Alexey and Hal Cardwell. 2009. “The Ener-
gy-Water Nexus: Why Should We Care?” Uni-
versities Council on Water Resources Journal
of Contemporary Water Research & Educa-
tion. Issue 143, pp. 17–29, December 2009.
Wang, Young-Doa. 2009. “Integrated Policy and
Planning for Water and Energy.” Universities
Council on Water Resources Journal of Con-
temporary Water Research & Education. Is-
sue 142, pp. 1–6, June 2009.
Webber M. 2008. “Water versus Energy”. Scien-
tific American, Earth 3.0. pp. 34–41.
Weiss, Paul. 2012. Energy-Water Nexus for
Green Growth: Scoping of Existing Knowl-
edge. Unpublished.
Wichlacz, Paul. L and Gerald Sehlke (eds.). 2008.
Energy-Water Nexus—Meeting the Energy
and Water Needs of the Snake/Columbia
River Basin in the 21st Century.
World Bank. 2012. Transformation through infra-
structure. World Bank Group Infrastructure
Strategy FY12–15.
World Bank. 2011. World Bank says most devel-
oping countries have recovered from crisis,
projects steady global growth. Press release
No: 2011/288/DEC. Washington, DC, Janu-
ary 12, 2011. Available online here: http://
go.worldbank.org/CM256UUPN1
World Bank. 2011b. Current Debates on Infra-
structure Policy, Commission on Growth
and Development. Estache A. and Fay M.,
2009 from World Bank Infrastructure Strat-
egy Update, 2011.
World Bank. 2009. “Directions in Hydropower.”
2009, International Bank for Reconstruction
REFERENCES 35
ANNEXES
To understand the order of magnitude of the water requirements of power plants, figures 1.1, 1.2, and 1.3 summarize the current knowledge that describes water withdrawals and consumption for different types of power
plants and cooling systems. These figures exclude hydropower. However, it should be noted that given a type of cooling system, the amount of water required will mostly depend on the efficiency of the power plant (and not so much on the fuel type) and to a lesser extent on other factors such as climatic conditions. This also accounts for the disparity in outcomes among the same power plant technologies and using the same cooling system as seen in the graph below. For example, in the category “coal generic” there is a large range due to different power plant efficien-cies: older coal power plants can have efficiencies as low as 25 percent whereas newer power plants can reach 40 percent efficiency.
Once-through cooling technologies withdraw 10 to 100 times more water per unit of electric gen-
eration than cooling tower technologies, yet the latter usually consume at least twice the volume of
water as once-through cooling technologies, depending on climatic conditions. Water consumption
for power plants using dry cooling is an order of magnitude less than for those same plants using
recirculating cooling.
Water consumption factors for renewable and non-renewable electricity generating technologies
vary substantially within and across technology categories, mostly due to their difference in efficiency.
The highest water consumption factors for all technologies result from the use of evaporative cooling
towers. Less efficient power plants such as pulverized coal with carbon capture and CSP technologies
utilizing a cooling tower represent the upper bound of water consumption, at approximately 1,000
gal/MWh of electricity produced. The lowest operational water consumption factors result from wind
energy, PV, and CSP Stirling solar technologies because none of them require water for cooling, and
all the technologies using dry cooling systems. It should be noticed that natural gas combined cycle
power plants have low rates of consumption and withdrawals in all types of cooling systems. Water
11 This annex is based on the work done by Macknick, J., Newmark, R., Heath, G. and Hallet, KC. 2011. “A Review of Operational Water Consumption and Withdrawal Factors for Electricity Generating Technologies,” Technical Report No. NREL/TP-6A20-50900. U.S. DOE National Renewable Energy Laboratory, Boulder, CO..
Ann
ex .1
.
Water Withdrawal and Consumption by Power Plants11
withdrawal factors for electricity generating
technologies show a similar variability within and
across technology categories. It is important to
note that it is the efficiency of the technology
that is the metric that must be assessed.
Taking the example of CSPs, Macknick et al.
(2011) conclude that switching facilities from wet
cooling to dry cooling results in reductions in out-
put of 2 to 5 percent and increases the levelized
cost of electricity by 3 to 8 percent (depending on
local climatic conditions). In addition to the losses
in efficiencies and the increases in costs of pro-
duction, the choice of cooling system can have
environmental impacts on the water resources.
Figure Annex 1.1. Operational water consumption factors for electricity generating technologies
41WATER WITHDRAWAL AND CONSUMPTION BY POWER PLANTS
Figure Annex 1.3. Operational water withdrawal factors for recirculating cooling technologies (zoom-in .from .previous .figure)
0
3,000
2,500
2,000
1,500
500
1,000
Ope
ratio
nal W
ater
With
draw
als
(gal
lons
/MW
h)
Bio
pow
er B
ioga
s
Nat
ural
Gas
Ste
am
Nat
ural
Gas
Com
bine
d C
ycle
Nat
ural
Gas
Com
bine
d C
ycle
with
CC
S
Coa
l Gen
eric
Coa
l Sub
criti
cal
Coa
l Sup
ercr
itica
l
Nuc
lear
Coa
l IG
CC
Coa
l Sup
ercr
itica
l ith
CS
S
Coa
l Sub
criti
cal w
ith C
SS
Coa
l IG
CC
with
CC
S
BiopowerNuclearNatural GasCoal
Source: Macknick et al., 2011.
THIRSTY ENERGY42
Carbon capture and storage (CCS) involves capturing carbon dioxide from large point sources (e.g., fossil fuelled power plants or other industrial sources) before they are emitted to the atmosphere, transporting it to the
injection site and injecting it into deep geological formations for storage. There has been considerable interest in CCS as a supply-side management tool to dramati-cally reduce greenhouse gas emissions with the continued use of fossil fuels (IPCC, 2005; IEA, 2008). In fact, the EIA suggests that the power sector must rapidly adopt CCS over the next 30 years to achieve a 50 percent reduction in GHG emis-sions by 2050.
Although carbon capture technology is commercially available today (IEA, 2009), there are currently
no large-scale commercial CCS power plants projects in operation. This is, in part, due to the high capital
costs of the technology and sustained operating costs. However, as of January 2013, sixteen large-scale
integrated CCS projects are considered “active,” that is, they are being implemented or have secured a
positive financial decision to proceed to construction. Of these, 12 percent are in the power sector and
88 percent are in industrial applications (Global CCS Institute, 2013). There are 75 projects identified
around the world, of which seventeen are in developing countries (Global CCS Institute, 2013).12 The first
two commercial large-scale CCS-fitted power stations will begin operating in Canada and the United
States in 2014 (Sweet, 2012).
However, CCS presents new water challenges, both in the electricity generation process and in
the injection of CO2. Understanding these potential impacts and the conditions under which they arise
is important to ensure the sustainable development of these projects. There are three categories
of carbon dioxide capture processes from power production: (1) flue gas separation; (2) oxy-fuel
combustion in power plants; and (3) pre-combustion separation. Each technology has energy and
economic costs (Herzog and Golomb, 2004), and affects water resources.
12 Eleven projects are in China: seven power plants and four industrial projects.
Ann
ex .2
.
Carbon Capture and Storage
Analyses of the performance of power sta-
tions with CCS have been frequently overlooked
water use. Nevertheless, some detailed estimates
of the water withdrawal and consumption needs
of electricity generation with CCS have been
prodbuced, notably by the US Department of
Energy and the National Energy Technology Labo-
ratory (DOE/NETL, 2009). Figure 2.2 compares
water withdrawal requirements for power genera-
tion with and without CCS (with cooling towers).
It can be observed that water requirements
increase substantially with CCS, more than
doubling in some cases. Moreover, this graph
also shows the relationship between heat rate
and water needs. The more efficient is the plant
(lower heat rate), the less waste heat and the less
water it requires
The use of water in electricity generation
with CCS varies according to the efficiency of the
power station, its cooling system, and the CCS
technology in place. However, most of the water
requirements are for cooling purposes, which
accounts for 71 to 99 percent of the total water
Water Usage
Current forms of conventional thermal electric-
ity generation with fossil fuels use water for fuel
extraction, generation, and cooling. Adding CCS
technology to power stations increases water
requirements, qualified by capture and power
station specifications (DOE, 2009). Power plants
with CCS necessitate additional water for the car-
bon capture processes, especially in IGCC plants.
However, most of the increased water require-
ments are for cooling purposes. Carbon capture
reduces substantially the efficiency of the power
plant (heat rate increases: see figure 2.1). In post-
combustion carbon capture, efficiency is affected
as a result of the extracted heat from the steam
electric cycle that is used to heat the solvent
(amine) and release the captured CO2. In addition,
efficiency suffers when electricity is used to run
auxiliary equipment such as pumps, fans, and
compressors for the CO2 capture stream. Thus,
more fuel inputs are required to achieve the same
electricity output, resulting in additional amounts
of cooling water per kWh generated. This increase
in water needs could more than double water
requirements for CCS power plants compared to
the non-CCS ones with the same cooling system.
Figure Annex 2.1. Comparison of Heat Rates (HHV) with and without CC
0
wo/CCS w/CCS
Heat Rate (kJ/kWh)
2,000
4,000
6,000
8,000
10,000
12,000
14,000
PC IGCC GE IGCC Shell NGCC
Source: DOE/NETL, 2010.
Figure Annex 2.2. Comparison of Water withdrawn of CCS vs. non-CCS power plants with wet cooling towers
0
Heat Rate (kJ/kWh)
0 5,000 10,000 15,000 20,000
Water Withdrawal (L/MWh)
1,000
2,000
3,000
4,000
5,000
6,000
PC FGD PC w/o FGD PC CCS NGCC
NGCC CCS IGCC IGCC CCS
Source: Delgado, 2012.
THIRSTY ENERGY44
Water Quality
Carbon dioxide leakage is a particular concern
with CCS (see figure annex 2.3), which is exac-
erbated due to higher withdrawal and consump-
tion rates. The primary concern regarding the
leakage of CO2-rich fluids into groundwater is the
potential mobilization of hazardous inorganic
constituents (including lead and arsenic) due
to the increased acidity these fluids generate,
which could exceed maximum concentration
limits under some conditions (Newmark et al.,
2010). However, there is general agreement that
the operational risks of CO2 leakage due to CCS
would be no greater (and likely lower) than the
oil and gas equivalents because CO2 is not flam-
mable or explosive. The wealth of experience
accumulated by the natural gas storage and oil
industries can be harnessed for CO2 storage and
risk mitigation. The inherent risks associated
with CO2 injection and storage can be managed.
A crucial element is assessing and identifying an
appropriate injection site based on criteria for
needs of the plant with CCS (Newmark, 2010).
The type of cooling system used will determine
most of the water requirements of the plant.
The Tenaska Trailblazer Post-Combustion CCS
Power Plant being developed in Texas will use
dry cooling systems to reduce the water require-
ments of the plant by 90 percent (Tenaska
Trailblazer Partners, 2011).
Adding CCS to a power plant can increase
the water requirements per kWh up to 100
percent in some cases (depending on the cool-
ing system used). This could be an issue for
local water resources, especially in areas where
the impacts of climate change could decrease
water availability or increase water temperature
(Naughton, 2012). This impact could be mitigated
through the installation of a dry cooling system,
but these systems are more capital intense than
the wet counterparts and affect the efficiency of
the plant. In order to ensure sustainable growth,
the water aspects of CCS cannot be overlooked
and must be incorporated into decision-making
processes.
Figure Annex 2.3. Leakage of CO2 from storage reservoirs into potable aquifers and its impact on the water quality is a potential concern.
Concern for Groundwater Resources
Storage Reservoir
Drinking Water Aquifier
CO2 Injection Well
Increased acidity maymobilize hazardous metals
Dissolved CO2
CO2 Leakage
CaprockInjection of Supercritical CO2
Source: xu et al., 2007.
CARBON CAPTURE AND STORAGE 45
age. Available on <http://www.iea.org/road-
maps/ccs_roadmap.asp>
Ikeda. 2007. Technical Performance of Electric
Power Generation Systems. Technology As-
sesment report 63. Volume 1 of 2. Selected
Flowsheets adapted to Australian Coal and
Conditions. Ikeda, E., Lowe, A., Spero and C.
Stubington, J. Cooperative Research Center
for Coal in Sustainable Development. Aus-
tralia. 2007.
Intergovernmental Panel on Climate Change
(IPCC). 2005. Carbon Dioxide Capture and
Storage. Available on <http://www.ipcc.ch/
publications_and_data/publications_and_
data_reports.shtml>
Moore, S. 2010. The Water Cost of Carbon Cap-
ture. http://spectrum.ieee.org/energy/en-
vironment/the-water-cost-of-carbon-cap-
ture/0
Naughton et al. 2012. Could climate change limit
water availability for coal-fired electricity gen-
eration with carbon capture and storage? A
UK case study. Energy and the Environment,
Energy & Environment, 23(2–3): 265–282.
Newmark et.al. 2010. Water Challenges for Geo-
logic Carbon Capture and Sequestration.
Newmark, R. L.; Friedmann, S. J.; Carroll, S.
A. Environ. Manage. 2010, 45 (4), 651–661.
Sweet, Bill. 2012. Carbon Capture Is Dead, Long
Live Carbon Capture http://spectrum.ieee.
org/energywise/green-tech/clean-coal/
carbon-capture-is-dead-long-live-carbon-
capture.
Tenaska Trailblazer Partners. 2011. Report to the
Global CCS Institute. Cooling Alternatives
Evaluation for a New Pulverized Coal Power
Plant with Carbon Capture.
capacity, injectivity, and effectiveness. Appropri-
ate monitoring of the site will be important to
detect and mitigate any potential leakages.
References:
Delgado, Anna. 2012. “Water Footprint of Elec-
tric Power Generation: Modeling its use and
analyzing options for a water-scarce future,”
Massachusetts Institute of Technology,
June 2012.
DOE/NETL. 2010. Cost and Performance Base-
line for Fossil Energy Plants. Volume 1: Bitu-
minous Coal and Natural Gas to Electricity.
U.S. DOE National Energy Technology Labo-
ratory, Pittsburgh, PA.
DOE/NETL. 2009. Estimating freshwater needs
to meet future thermoelectric generation
requirements, 2008 update. Available on
<http://www.netl.doe.gov/technologies/
coalpower/ewr/pubs/2008_Water_Needs_
Analysis-Final_10-2-2008.pdf>
DOE. 2010. Water Vulnerabilities for Existing
Coal-fired Power Plants. August 2010 DOE/
NETL-2010/1429
EPRI. 2010. Cooling Requirements and Water
Use Impacts of Advanced Coal-fired Power
Plants with CO2 Capture and Storage. Inter-
im Results.
Global CCS Institute. 2013. http://www.glo-
balccsinstitute.com/projects/browse
Herzog and Golomb. 2004. http://sequestra-
tion.mit.edu/pdf/enclyclopedia_of_energy_
article.pdf
International Energy Agency (IEA). 2009. Tech-
nology Roadmap, Carbon capture and stor-
THIRSTY ENERGY46
Review of Energy Models
While there are many energy models available, particularly in the private power sector (such as SDDP,
Ventys, Promod, which are used for investment planning), this section focuses on only those models
that are publicly available.
All the models discussed in this section are built on the principle of the Reference Energy System
(RES), which identifies technologies and process as nodes in a network connected by energy flows.
The models also include material flows that meet demands for energy (and material) services, while
tracking emissions and other commodities based upon how the RES configured over time. This entire
class of models is considered “bottom-up” technology-rich frameworks.
LEAPThe Long Range Energy Alternatives Planning system (LEAP) is an accounting and simulation-based
framework in which the user defines the evolution of an energy system under various policies. It is
developed and maintained by the Stockholm Energy Institute (SEI). The analyst must provide the
allocations at each point in the energy system, indicating the levels of competing technologies and
thereby the flow of energy throughout the system. The user must continually refine these assumptions
until the desired results are reached. An intuitive user-friendly interface makes the model relatively
easy to use. However, since it is an accounting framework, the user must provide “the answer” at
each decision point in the model. Hence, LEAP currently cannot be used to determine the least-cost
optimization of an energy system across policy goals. In addition, LEAP is not meant to handle very
large, complex energy systems.
In attempting to address these shortcomings, an experimental optimization feature was
introduced in the 2011 version of the model, which calculates the least-cost reduced form power
sector capacity expansion scenario, with or without emissions constraints. This feature works with
the Open Source Energy Modeling System (OseMOSYS) developed by SEI, IAEA, and others. The
OseMOSYS project has resulted in a usable but limited representation of the power sector that
can be subject to optimization. Comprehensive full sector (multi-objective) optimization could be
brought to LEAP by constructing a bridge to TIMES. This would result in a way to introduce full
sector optimization to LEAP users. LEAP is the most widely available energy planning tool and
thousands of users have been exposed to it. All components of LEAP and OseMOSYS are provided
Ann
ex .3
.
Assessment of Energy Models
and either MARKAL/TIMES or LEAP consis-
tently prefer the latter alternatives. Therefore,
it is not as widely used as the other modeling
platforms.
MARKAL/TIMESMARKAL/TIMES is the product of over 30 years
of development and use under the auspices
of the International Energy Agency’s Energy
Technology Systems Analysis Programme15
(IEA-ETSAP). The modeling framework enables
a wide range of users to employ least-cost
optimization as an integral part of their plan-
ning process. It is a well-established model in
use in over 70 countries and 200 institutions
world-wide. The MARKAL/TIMES modeling
framework allows users to specify policy and
resource constraints as an input, and the model
determines the optimal make-up of the energy
system to meet that outcome (as is the case with
MESSAGE). A typical national model can solve in
seconds to a couple of minutes. In addition to its
long-standing track record and ongoing develop-
ment and support by IEA-ETSAP, a major advan-
tage of MARKAL/TIMES is the very powerful
model support systems available that oversee
seamless management of all aspects of working
with the model. Another advantage is the ability
to link input and output data to Excel workbooks,
resulting in a “report ready” format. Only LEAP
can boast similar capacities.
MARKAL/TIMES is available through the
IEA-ETSAP at no cost. The GAMS programming
and model management software systems
essential to effectively work with the tool are
available from their developers, at a cost depen-
dent upon the nature of the institution (e.g.,
academic, donor/research, commercial).
at no cost to nonprofit organizations, nonprofit
governmental agencies, and universities based
in developing countries.
ENPEP (BALANCE)The Energy and Power Evaluation Program13
(ENPEP) is a data intensive, complex energy
modeling framework. It is an equilibrium simula-
tion model that requires the placement of elas-
ticities at every node in the network. The energy
sector is treated as consisting of autonomous
producers and consumers of energy, each seek-
ing to optimize their own profits (or reduce costs).
This approach is different from that of optimiza-
tion models such as MESSAGE and MARKAL/
TIMES (see below), which aim to optimize the
entire energy system while achieving a set of
user-defined policy goals. Policy analysis is diffi-
cult when using ENPEP because there is no easy
way to formulate and evaluate alternative sce-
narios. The model is difficult to use because of
a bulky user interface that is made more com-
plex because of the numerous model compo-
nents required. Thus ENPEP is a complete, com-
prehensive energy system model but one that is
very difficult to use and maintain. ENPEP used to
be provided by the International Atomic Energy
Agency (IAEA) to member countries. However,
due to the complexity of working with the model,
the agency no longer promotes its use.
MESSAGEThe Model for Energy Supply Strategy Alterna-
tives and their General Environmental Impacts14
(MESSAGE) is an energy systems optimization
model capable of scenario and policy analysis. It
was developed and is used by the International
Institute for Applied Systems Analysis (IIASA). It
is similar to MARKAL/TIMES, but has some dis-
advantages. Most notably there is a very weak
user interface and it uses a general purpose
solver that can take hours to solve, particularly
for large systems. Users familiar with MESSAGE
13 See http://www.dis.anl.gov/projects/Enpepwin.html.14 See http://www.iiasa.ac.at/Research/ENE/model/message.html.15 See www.etsap.org.
THIRSTY ENERGY48
using it. However, LEAP is primarily an accounting
framework with limited optimization capability,
and the user must provide “the answer” at each
decision point in the model. Therefore, LEAP
is not suitable to handle large, complex energy
systems.
MESSAGE is an energy systems optimiza-
tion model capable of scenario and policy analy-
sis. It has a very weak user interface and uses
a general purpose solver that can take hours
longer to solve large models than MARKAL/
TIMES. Therefore, it is not as widely used as the
other modeling platforms.
MARKAL/TIMES is used widely by agencies
that employ least-cost optimization as an inte-
gral part of their planning process. MARKAL/
TIMES has a very powerful user interface that
supports data entry, scenario management, and
results analysis. The IEA-ETSAP operating agree-
ment sponsors the ongoing development of the
Typical Inputs and Outputs of Energy System Models
The energy system models described above uti-
lize information about both the current and pos-
sible future components of the energy system as
well as demographic and economic information
on resources and energy utilization needed to
forecast future supplies and demands. The key
types of inputs and outputs for an energy system
model are summarized in figure 3.1.
Summary of Energy System Models
LEAP is a strong entry-level modeling framework
that works well in developing countries with
relatively simple energy systems. It is available
at no charge and many developing countries are
Figure Annex 3.1. Typical Energy System Model Inputs and Outputs
Solution Goal • Simulate effects of user-defined expansion pathways by adding flows through a rigid network
• Optimization tool will allow option to calculate least cost energy system over entire time period.
• Simulate response of various segments of the energy system to changes in energy prices and demand levels
• Calculates equilibrium price for intersection of supply and demand
Minimize total system costs under constraints imposed on the energy system
Maximize consumer/producer surplus while minimizing overall total system costs
Data Requirements
Medium: Typically 1 to 6 months of effort depending on the size and complexity of the energy system
Medium-High: Typically 6 to 12 months of effort depending on the size and complexity of the energy system
Medium-High: Typically 6 to 12 months of effort depending on the size and complexity of the energy system
Medium-High: Typically 3 to 9 months of effort depending on the size and complexity of the energy system
Default data included
• Technology Energy Database (TED) with costs, performance, and emissions factors (IPCC)
• National Level “Starter” Data Sets for 104 developing countries: IEA energy balance data, IPCC emissions factors, UN Population projections, WB development indicators, non-energy sector GHG sources/sinks from (WRI), energy resource data (WEC).
• IPCC Emissions Factors
• Technology cost and performance data
• CO2DB with ranged values for technologies
• IPCC emissions factors
Global models from the IEA, EIA, and ETSAP provide a repository of existing data for technologies and emissions
Time Horizon User Controlled Annual Results
Up to 75 years. Annual Results
Up to 120 years. 5 to 10 year time steps
User controlled, any number of years
Other model features
New optimization tool links to OSeMOSYS to calculate least cost energy system. Not suitable for final reports or analysis.
Links with MAED demand services projection module, plus WASP power expansion module, and impacts, requiring additional information
• Links with MACRO model to determine impact of policies on energy costs, GDP, and energy demand.
Integrated MACRO nonlinear programming version allows for coupling with the economy, without iteration
(continued on next page)
THIRSTY ENERGY54
Summary of Characteristics of Existing Energy Modeling Frameworks
• Expanded to include endogenous learning of technologies and include all six Kyoto GHG’s
Current Representation of Water Use
Water requirements can be externally specified for each technology as a form of environmental loading. In the same way that emissions are specified as kg/GJ of energy consumed, water can be specified as liters/GJ.
Water consumption can be entered as an “environmental parameter” such as gal/kWh or gal/kBOE. This information is entered into each node in the network. A price may be placed on the water ($/gal), however, there is no overall constraint for an environmental parameter
Water use is externally estimated. Exact mechanism is unknown.
Water can be modeled as a material flow linked to the energy system, and can be calculated and used as constraints on the energy system solution
Data/Results Handling
Full importing and exporting to Microsoft Excel, Word, and PowerPoint. Flexible reporting in charts, tables, and maps.
Manual data input/Analysis module supporting reporting graphs, tables
ASCII tables and manual input. Standard set of results tables and graphs.
Integrated “smart” Excel input workbooks. Allows full customization of analysis tables, and intelligently links to Excel to automatically update presentation tables/graphs
Representation of policies
Policy analysts must create and then simulate alternative scenarios to determine marginal effects of new policies, or combined effects of multiple policies over time horizon.Optimization tool will allow policies to be represented in form of constraints:• Max annual emissions• Min, Max capacities for
certain plant types
Policy analysts must create and adjust assertions as to how the system will develop over time and review the results, tweaking the assumptions until the desired results are reached.
Policies can be tried by means of constraints in the form of:• emissions targets
on the overall system
• Fuel• Export• shares for
renewable energy
Policies can be introduced by means of flexible user-defined constraints in the form of:• emissions targets
(on plant types, sectors, system)
• energy security goals
• shares for renewable energy
• imposing efficiency standards
(continued on next page)
(continued)
ASSESSMENT OF ENERGY MODELS 55
Summary of Characteristics of Existing Energy Modeling Frameworks