Preliminary Health Analyses California Air Resources Board Staff PRELIMINARY HEALTH ANALYSES: CONTROL MEASURE FOR OCEAN-GOING VESSELS AT BERTH AND AT ANCHOR Public Review Draft Release Date: November 5, 2018 Comments Due: November 26, 2018
Transcript
Preliminary Health Analyses
California Air Resources Board Staff
PRELIMINARY HEALTH ANALYSES: CONTROL MEASURE FOR OCEAN-GOING VESSELS AT BERTH AND AT ANCHOR
Public Review Draft
Release Date: November 5, 2018 Comments Due: November 26, 2018
Preliminary Health Analyses
FORWARD Staff is releasing these preliminary health analyses for public review in advance of the Initial Statement of Reasons (ISOR) for the Control Measure for Ocean-Going Vessels At Berth and At Anchor to support early public review and comment on a draft, and the opportunity for staff to make revisions prior to publication of the ISOR. Please submit any comments on this draft by Monday, November 26, 2018 to the electronic comment log at: https://www.arb.ca.gov/lispub/comm2/bcsubform.php?listname=atberth-atanchor-ws&comm_period=1 Questions and comments may be addressed to: Matthew O’Donnell, Manager Exposure Reduction Section Transportation and Toxics Division California Air Resources Board Matthew may be reached by email at [email protected] or by phone at (916) 327-6888.
1. What does it mean for a vessel to be “at berth” or “at anchor?” ................... ES-1
2. Why is CARB concerned about air pollution from vessels at berth and at anchor? ........................................................................................................ ES-2
3. What regulations are already in place to reduce emissions and community exposure to air pollution from vessels in California today? ........ ES-3
4. What is CARB staff’s new Concept to further reduce vessel emissions? ..... ES-4
5. What types of health analyses did CARB staff perform to assess the impacts of emissions from vessels at berth? ............................................... ES-4
6. What are the key inputs and outputs for the health analyses in this preliminary draft report? ............................................................................... ES-5
7. What ports did CARB staff select to evaluate the localized benefits of the Concept in reducing the impacts from vessels at berth?.............................. ES-5
8. What is the process CARB staff used to assess the localized health risk for the three ports evaluated? ...................................................................... ES-6
9. What are the diesel PM emissions from each vessel type at the ports evaluated? ................................................................................................... ES-6
10. How much would the Concept reduce the number of people exposed to elevated cancer risks from vessels at berth at the ports evaluated? ............ ES-8
11. How much would the Concept reduce the maximum residential cancer risk from vessels at berth at the ports evaluated? ........................................ ES-9
12. What is the process CARB staff used to assess the premature death and illness impacts from regional PM2.5 pollution from vessels at berth? ... ES-11
13. How much would the Concept reduce the premature death and illness impacts from regional PM2.5 pollution from vessels at berth? .................... ES-12
Preliminary Health Analyses
ii
I. OVERVIEW .............................................................................................................. 1
A. Approaches Used in the Health Analyses .......................................................... 1
B. Applicability of the Diesel PM Health Values for Engines Using Marine Gas Oil, Marine Diesel Oil, or Marine Heavy Fuel Oil ............................ 1
II. EMISSIONS INVENTORY ....................................................................................... 3
A. Emission Inventory Summary............................................................................. 3
B. POLA and POLB Emission Inventory ................................................................. 4
C. Richmond Complex Emission Inventory ............................................................. 5
D. Statewide At Berth Emissions by Air Basin ........................................................ 6
III. HEALTH RISK ASSESSMENT FOR THREE CALIFORNIA PORTS ....................... 9
A. Health Risk Assessment Overview .................................................................... 9
3. Noncancer Chronic Health Impacts .............................................................. 46
F. Uncertainty Associated with the HRA Analysis .................................................... 46
1. Uncertainty Associated with Health Values ................................................... 47
2. Uncertainty Associated with Air Dispersion Models ...................................... 47
3. Uncertainty Associated with the Model Inputs .............................................. 48
IV. REGIONAL PM2.5 MORTALITY AND ILLNESS ANALYSIS FOR CALIFORNIA AIR BASINS ..................................................................................... 49
A. PM Mortality and Illness Overview ................................................................... 49
1. Direct Modeling Approach ............................................................................. 50
Table ES-3. Population Impacted by Potential Cancer Risk Levels at POLA and POLB for the Existing Rule and the Draft Regulatory Concept ............ ES-8
Table ES-4. Population Impacted by Potential Cancer Risk Levels at the Richmond Complex ............................................................................. ES-9
Table ES-5. POLA and POLB At Berth MEIR Cancer Risk .................................... ES-10
Table ES-6. Richmond Complex At Berth MEIR Cancer Risk ................................ ES-10
Table ES-7. Statewide Values from Avoided Adverse Health Outcomes between 2021 and 2032 as a Result of the Concept ........................................ ES-13
Table 1. POLA and POLB Estimated At Berth Diesel PM Emissions ............................. 5
Table 9. Summary of Exposure Parameters ................................................................ 27
Table 10. Age Bin Exposure Duration Distribution ....................................................... 27
Table 11. Estimated Population Impacts by Potential Cancer Risk Level at POLA and POLB .......................................................................................... 35
Table 12. Estimated Population Impacts for Disadvantaged Communities by Potential Cancer Risk Level at POLA and POLB ......................................... 35
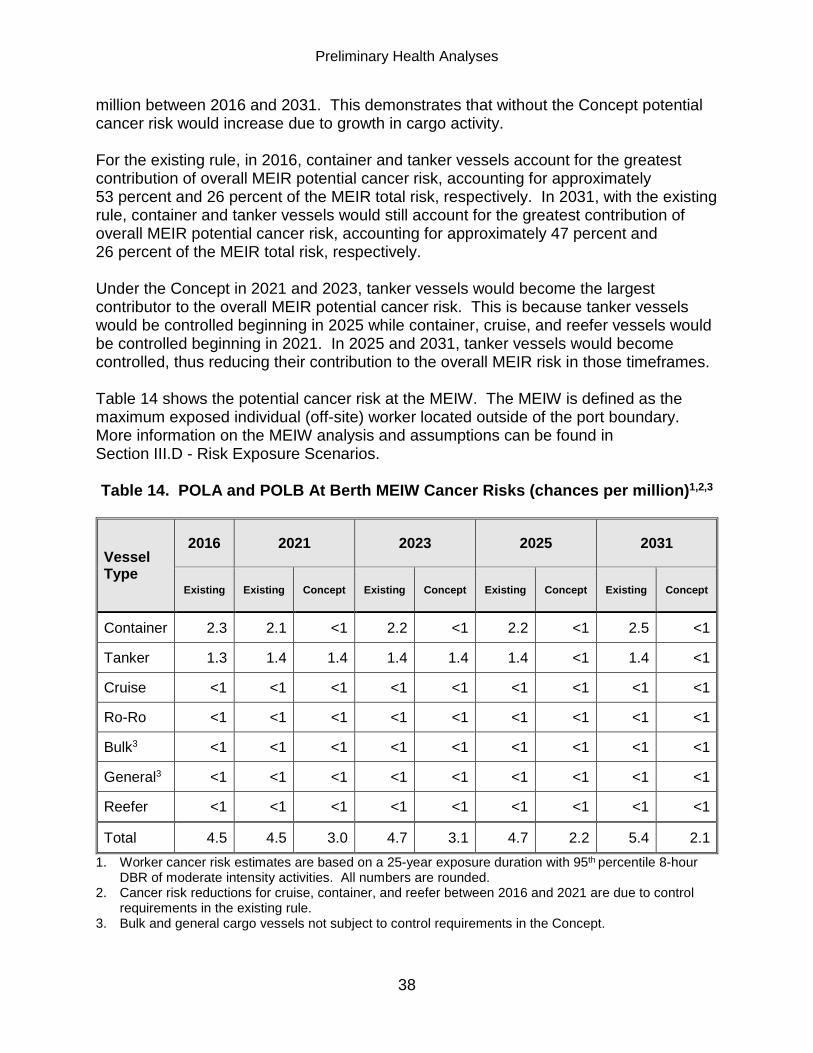
Table 13. POLA and POLB At Berth MEIR Cancer Risks ............................................ 36
Preliminary Health Analyses
v
Table 14. POLA and POLB At Berth MEIW Cancer Risks ........................................... 38
Table 15. Estimated Population Impacts by Potential Cancer Risk Levels at the Richmond Complex ..................................................................................... 43
Table 16. Estimated Population Impacts in Disadvantaged Communities by Potential Cancer Risk Levels at the Richmond Complex ............................. 43
Table 17. Richmond Complex At Berth MEIR Cancer Risks ........................................ 44
Table 18. Richmond Complex At Berth MEIW Cancer Risks ....................................... 46
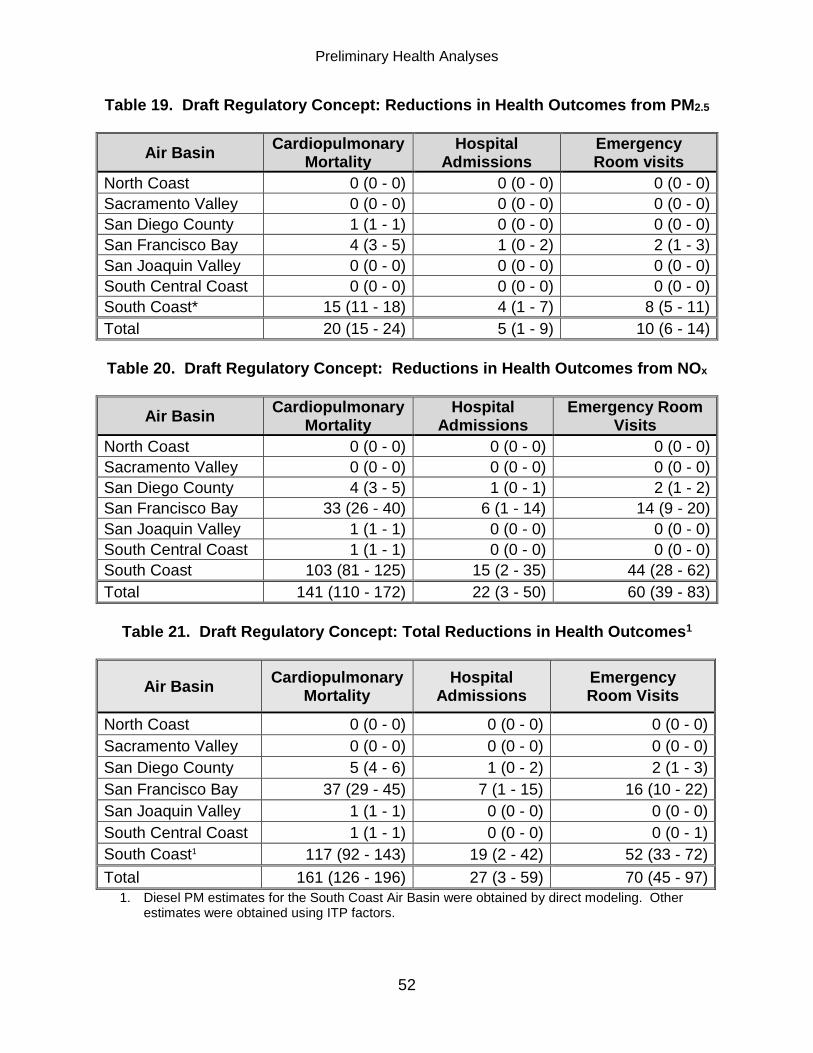
Table 19. Draft Regulatory Concept: Reductions in Health Outcomes from PM2.5 ....... 52
Table 20. Draft Regulatory Concept: Reductions in Health Outcomes from NOx ........ 52
Table 21. Draft Regulatory Concept: Total Reductions in Health Outcomes ................ 52
Table 22. Valuation per Incident Avoided Health Outcomes ........................................ 53
Table 23. Statewide Valuation from Avoided Adverse Health Outcomes between 2021 and 2032 as a Result of the Concept .................................................. 54
LIST OF FIGURES
Figure 1. Affected Northern California Seaports and Marine Terminal Complexes ...... 11
Figure 2. Affected Southern California Seaports and Marine Terminal Complexes ..... 11
Figure 3. Locations of Surface Meteorological Stations and Modeled Sources at POLA and POLB ........................................................................................... 14
Figure 4. Locations of Surface Meteorological Stations and Modeled Sources at the Richmond Complex ....................................................................................... 15
Figure 5. Wind Rose of SODS Station Used for POLA and POLB Modeling ............... 17
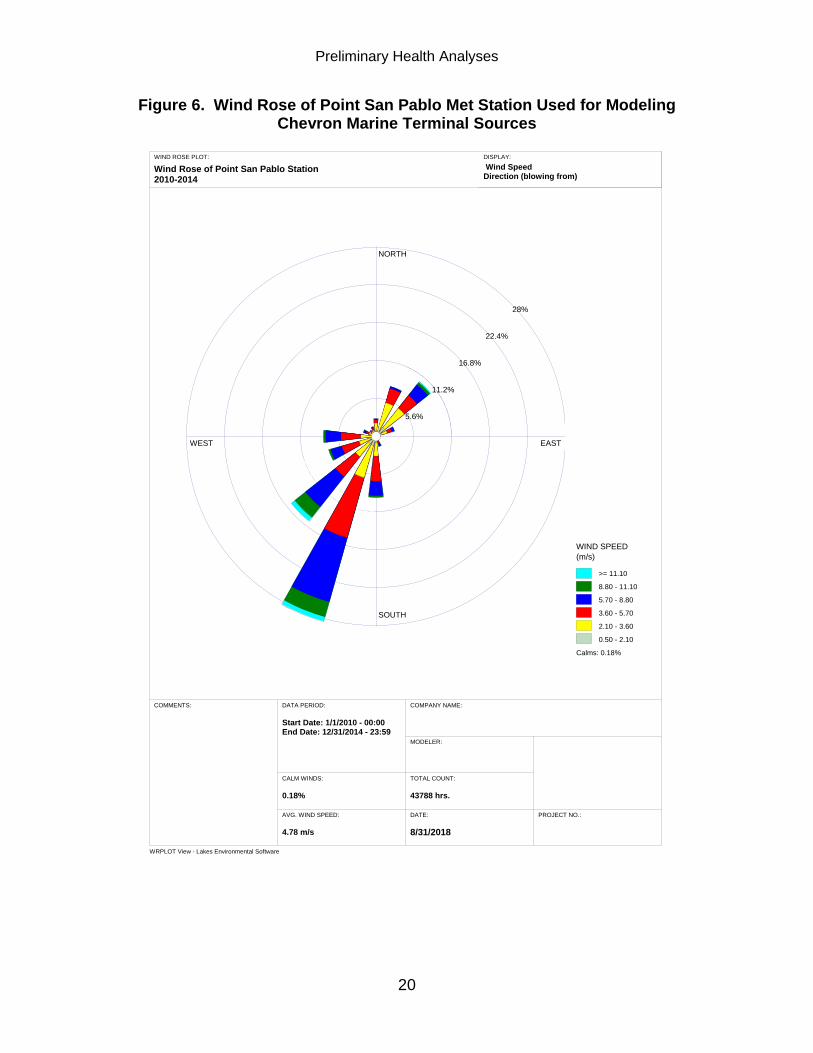
Figure 6. Wind Rose of Point San Pablo Met Station Used for Modeling Chevron Marine Terminal Sources .............................................................................. 20
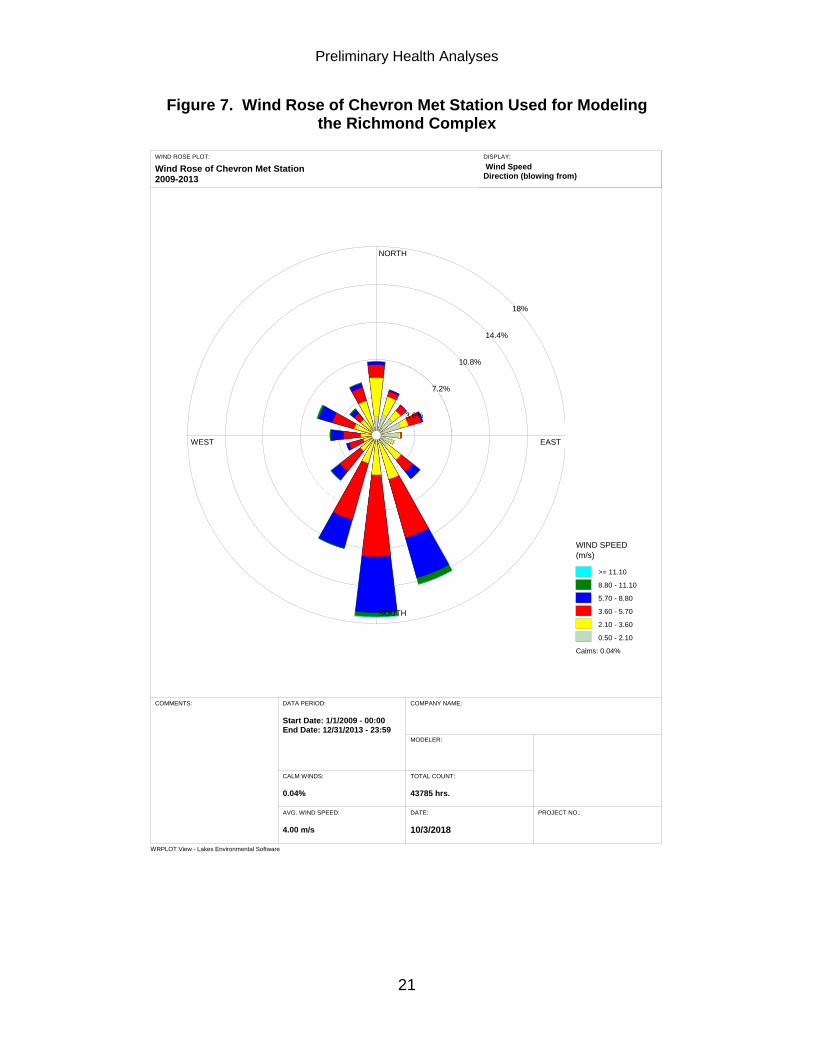
Figure 7. Wind Rose of Chevron Met Station Used for Modeling the Richmond Complex ....................................................................................... 21
Figure 8. Modeling Setup for POLA and POLB ............................................................ 22
Figure 9. Modeling Setup for the Richmond Complex .................................................. 23
Preliminary Health Analyses
vi
Figure 10. 2016 Impacts of Vessels At Berth for Existing Rule – POLA and POLB Potential Cancer Risk Isopleths ................................................................... 29
Figure 11. 2021 Impacts of Vessels At Berth for Existing Rule and Concept – POLA and POLB Potential Cancer Risk Isopleths .................................................. 30
Figure 12. 2023 Impacts of Vessels At Berth for Existing Rule and Concept – POLA and POLB Potential Cancer Risk Isopleths .................................................. 31
Figure 13. 2025 Impacts of Vessels At Berth for Existing Rule and Concept – POLA and POLB Potential Cancer Risk Isopleths .................................................. 32
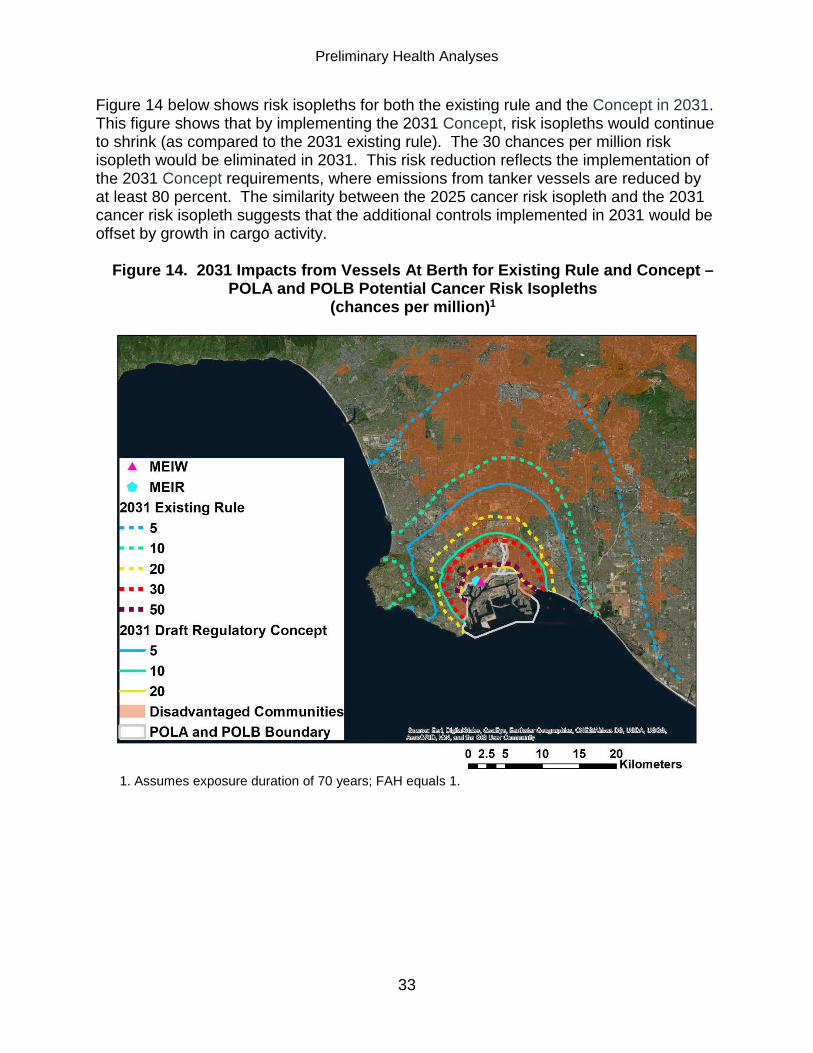
Figure 14. 2031 Impacts from Vessels At Berth for Existing Rule and Concept – POLA and POLB Potential Cancer Risk Isopleths ...................... 33
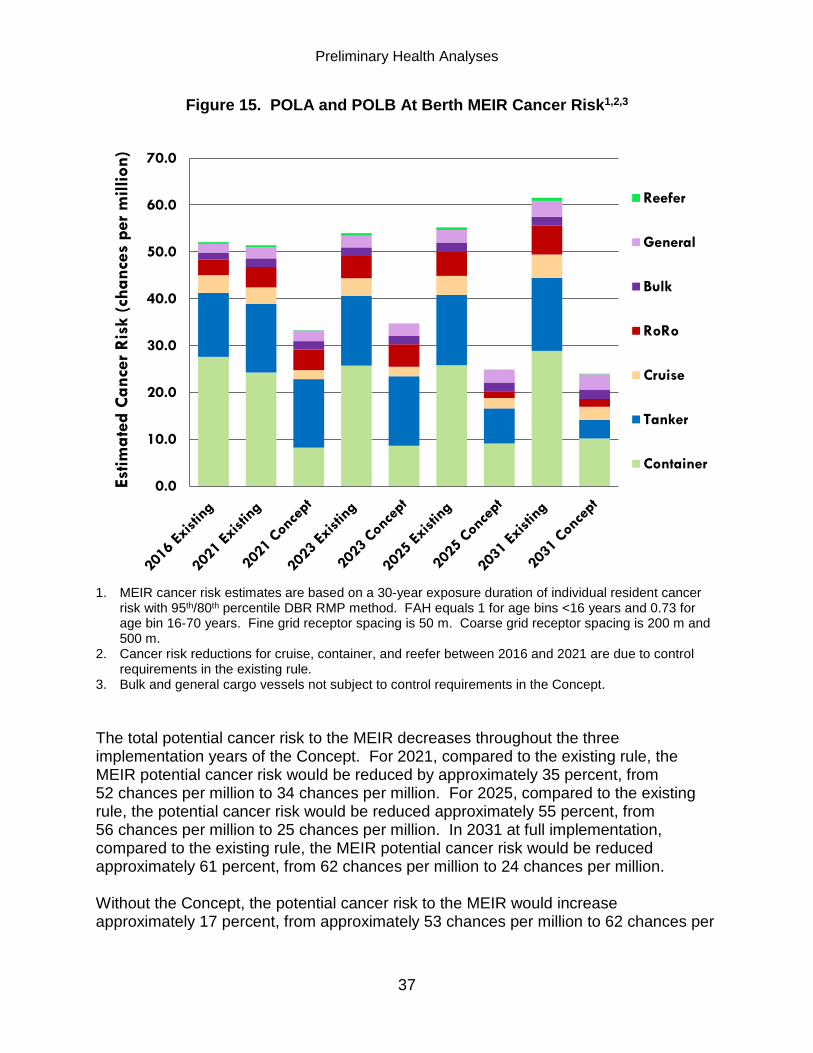
Figure 15. POLA and POLB At Berth MEIR Cancer Risk ............................................. 37
Figure 16. 2016 Impacts from Vessels At Berth Existing Rule – Richmond Complex Potential Cancer Risk Isopleths .................................................................. 40
Figure 17. 2025 Impacts from Vessels At Berth for Existing Rule and Concept – Richmond Complex Potential Cancer Risk Isopleths .................................. 41
Figure 18. 2031 Impacts from Vessels At Berth for Existing Rule and Concept – Richmond Complex Potential Cancer Risk Isopleths .................................. 42
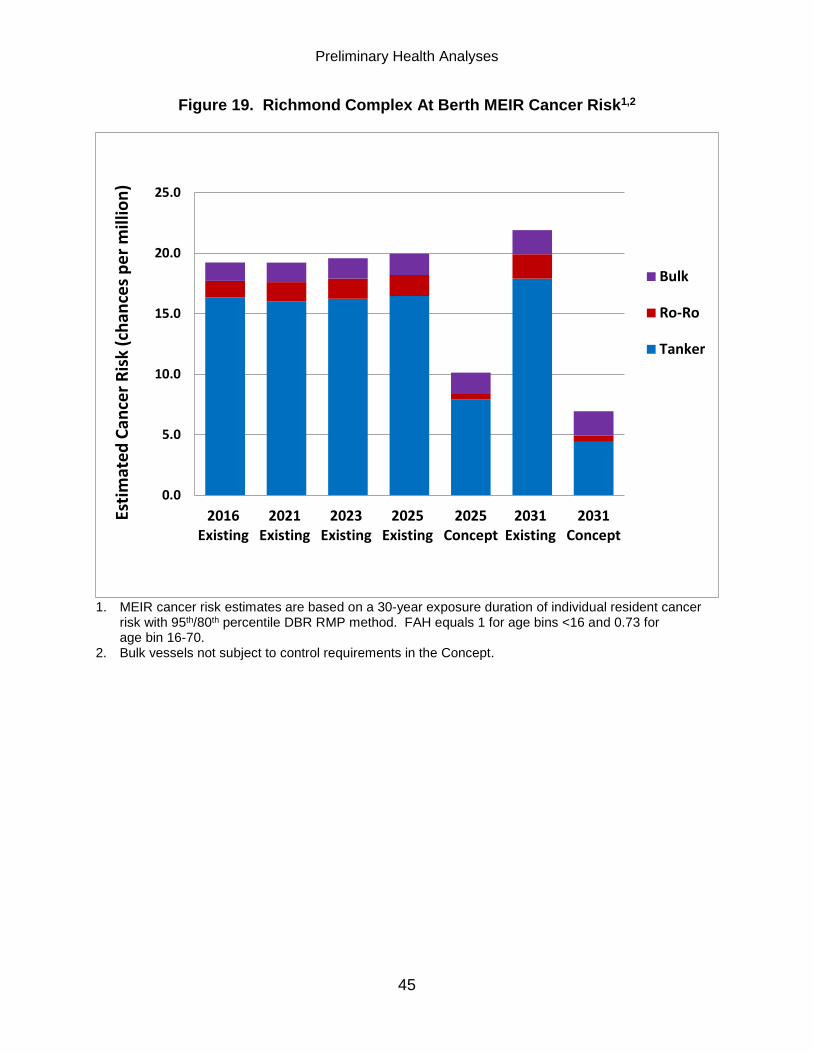
Figure 19. Richmond Complex At Berth MEIR Cancer Risk ......................................... 45
Preliminary Health Analyses
ES-1
EXECUTIVE SUMMARY California Air Resources Board (CARB) staff conducted health analyses to evaluate the health impacts of emissions from ocean-going vessels operating at berth. These health analyses examine the existing impacts now and in future years with adopted regulations in place, as well as the health benefits that would be achieved by implementation of the concepts for the upcoming control measure for ocean-going vessels at berth and at anchor. In late August 2018, CARB staff posted a description of the regulatory concepts (Concept), and informal draft regulatory language, for comment and discussion at public workshops in September 2018. These preliminary draft health analyses evaluate the August 2018 version of staff’s approach. In response to public input and additional evaluation, CARB staff is modifying that approach. The official staff proposal for consideration by the Board at a public hearing will be released in the Initial Statement of Reasons (ISOR) 45 days prior to the Board hearing. That ISOR will include updated analyses of health benefits, costs, and environmental and economic impacts based on the formal regulatory proposal. This section of the document provides an overview and summary of the results in a question and answer format. A more technical discussion on the health analyses follows in the body of this document. 1. What does it mean for a vessel to be “at berth” or “at anchor?” An ocean-going vessel is considered “at berth” when moored to a dock for cargo operations. Once the vessel is securely connected, the main or propulsion engines are turned off, but the auxiliary engines (typically running on a low sulfur distillate fuel) that power the on-board electrical system remain on unless power is supplied from an alternative source. In California, many ships are able to turn off their auxiliary engines and connect to the shoreside electrical grid instead at berth. This is referred to as “shore power” (formerly known as “cold-ironing”). All vessels also run their on-board boilers while at berth, especially tankers carrying crude oil or petroleum products that must be pumped to or from shore based tanks. These boilers typically run on low sulfur distillate fuel. The vessel is considered “at anchor” when stopped and anchored at a location offshore where there is no infrastructure to moor the ship and an anchor must be lowered to secure the vessel. Common reasons for ocean-going vessels to anchor off the California coast include waiting to enter ports, completing cargo operations that cannot be done at berth due to channel depth restrictions, or the loading/offloading of passengers at locations where insufficient port facilities exist (common with passenger (cruise) ships). While at anchor, vessels run their auxiliary engines and boilers. Vessel operations that occur at berth and at anchor are in the closest proximity to communities, compared to emissions from vessels in transit further offshore.
Preliminary Health Analyses
ES-2
2. Why is CARB concerned about air pollution from vessels at berth and at
anchor? Communities around California’s ports and marine terminals bear a disproportionate health burden due to their close proximity to emissions from vessels (at berth, at anchor, during maneuvering, and while in transit) and other emission sources including trucks, locomotives, and terminal equipment serving the port. Many of these communities are classified as disadvantaged by the California Environmental Protection Agency (CalEPA), using the California Communities Environmental Health Screening Tool (CalEnviroScreen), Version 3.01, developed by the Office of Environmental Health Hazard Assessment (OEHHA). CalEnviroScreen uses various factors to score California communities based on environmental pollution burden and socio-economic indicators. Exposure to diesel pollution is a main contributor to many port communities scoring in the top 10th percentile statewide. CARB also identified several neighborhoods near ports as selected communities in the first year of implementation of the Community Air Protection Program developed in response to Assembly Bill (AB) 617. Emissions from ocean-going vessels operating at berth and at anchor are a significant and growing contributor to community air pollution and the associated health impacts. These vessels emit multiple air pollutants, including particulate matter from diesel-fueled engines (diesel PM), plus fine particulate matter (PM2.5), nitrogen oxides (NOx), greenhouse gases (GHG), and black carbon from both auxiliary engines and boilers. Vessels also emit sulfur oxides (SOx), although today’s levels are approximately 95 percent lower than a decade ago due to requirements for cleaner fuels. Diesel PM. In 1998, CARB identified diesel PM as a toxic air contaminant based on its potential to cause lung cancer and other health problems. Localized health risks from diesel PM are typically higher in areas of concentrated emissions, such as near ports, rail yards, freeways, and warehouse distribution centers. These health issues include premature death, increased hospital admissions for heart and lung disease, increased cancer risk, and increased respiratory symptoms like asthma and bronchitis. This is especially true for children, the elderly, outdoor workers, and other sensitive populations. PM2.5, NOx, and SOx. These pollutants are directly emitted from vessels, and can react in the atmosphere with other chemicals to create regional air pollutants over a larger geographic area. For example, NOx emissions contribute to both regional ozone and regional PM2.5 levels. SOx emissions contribute to regional PM2.5 levels. The noncancer health impacts from exposure to PM2.5 are consistent with those described above for diesel PM, with the primary concern being adverse cardiac and respiratory effects.
1 Office of Environmental Health Hazard Assessment, CalEnviroScreen 3.0 (June 25, 2018), https://oehha.ca.gov/calenviroscreen/report/calenviroscreen-30 (last visited Oct. 23, 2018).
GHG and Black Carbon. GHGs and the short-lived climate pollutant black carbon (a subset of PM2.5) from vessels contribute to climate change. Climate scientists agree that global warming and other shifts in the climate system observed over the past century are caused by human activities. These recorded changes are occurring at an unprecedented rate.2 According to new research, unabated GHG emissions could cause sea levels to rise up to 10 feet by the end of this century—an outcome that could devastate coastal communities in California and around the world.3 California is already feeling the effects of climate change, and projections show that these effects will continue and worsen over the coming centuries. The impacts of climate change on California have been documented by OEHHA in the Indicators of Climate Change Report.4 3. What regulations are already in place to reduce emissions and community
exposure to air pollution from vessels in California today? In addition to international and national standards for vessels and fuels, California has its own more health protective requirements. The first CARB regulation requires vessels to switch to lower sulfur fuels when operating within 24 nautical miles of the California coast, whether in port or in transit, to cut harmful emissions that contribute to PM2.5 pollution.5 The Board adopted CARB’s other existing rule, the Airborne Toxic Control Measure for Auxiliary Diesel Engines Operated on Ocean-Going Vessels At-Berth in a California Port in 2007. The regulation protects public health by controlling NOx and diesel PM emissions from distillate-fueled auxiliary engines on container ships, cruise ships, and refrigerated cargo (reefer) ships while at berth (CARB, 2007). For the purposes of the existing rule, all diesel-electric engines, common in most cruise ships and some tankers, are considered auxiliary engines since they provide auxiliary power at berth in addition to propulsion.
2 John Cook, et al., Consensus on consensus: a synthesis of consensus estimates on human-caused global warming (Apr. 13, 2016), Environ. Res. Lett. 11 (2016) 048002, doi:10.1088/1748-9326/11/4/048002, available at http://iopscience.iop.org/article/10.1088/1748-9326/11/4/048002/pdf. 3 California Ocean Protection Council, Rising Seas in California: An Update On Sea-Level Rise Science (Apr. 2017), available at www.opc.ca.gov/webmaster/ftp/pdf/docs/rising-seas-in-california-an-update-on-sealevel-rise-science.pdf (last accessed June 20, 2018). 4 Office of Environmental Health Hazard Assessment (OEHHA), Indicators of Climate Change in California (May 2018), available at https://oehha.ca.gov/media/downloads/climatechange/report/2018caindicatorsreportmay2018.pdf. 5 California Air Resources Board, Initial Statement of Reasons for Proposed Rulemaking - Fuel Sulfur and Other Operational Requirements for Ocean-Going Vessels Within California Waters and 24 Nautical Miles of the California Baseline - June 2008. Available at https://www.arb.ca.gov/regact/2008/fuelogv08/ISORfuelogv08.pdf
4. What is CARB staff’s new Concept to further reduce vessel emissions? CARB staff is developing a new regulation to further reduce emissions from ocean-going vessels at berth and at anchor by including smaller fleets and additional visits by currently regulated vessel types, plus roll-on/roll-off (Ro-Ro) vessels, like car carriers, and tankers. The August 2018 Concept would become effective in three phases. • Phase 1 would begin in 2021 and require at least an 80 percent reduction in
emissions from auxiliary engines used in container vessels, reefer vessels, and cruise ships while at berth.
• Phase 2 would begin in 2025 and require at least an 80 percent reduction in emissions from auxiliary engines used in Ro-Ro vessels and at least a 50 percent reduction in emissions from auxiliary engines used in tanker vessels while at berth. Phase 2 would also require at least a 50 percent reduction in emissions from auxiliary boilers used in tanker vessels that utilize steam-driven pumps to offload cargo.
• Phase 3 would begin in 2031 and would require at least an 80 percent reduction in emissions from auxiliary engines used in tanker vessels while at berth and at least an 80 percent reduction in emissions from auxiliary boilers used in tanker vessels that utilize steam-driven pumps to offload cargo.
5. What types of health analyses did CARB staff perform to assess the impacts
of emissions from vessels at berth? CARB staff evaluated the health impacts attributable to vessel emissions at berth using two different methods: a health risk assessment (HRA) that considers the localized impacts in communities around three ports, and regional assessments of premature death and illness in each air basin. The localized HRA uses air quality modeling to estimate the concentration of diesel PM at specific locations near the ports, estimate diesel PM exposure to people living in those communities, and quantify the health effects (cancer and noncancer) that would be expected to result from that exposure. The HRA further projects how those impacts would change with implementation of the Concept. The regional assessments use the results of the HRA, air quality monitoring and emissions inventory data, and county-specific statistics on health outcomes (premature death due to cardiac or respiratory effects, plus hospitalizations and emergency room visits attributed to those causes) attributable to emissions from ships at berth. This analysis focuses on the impacts of regional PM2.5 pollution, either directly emitted from vessel engines and boilers, or formed in the atmosphere from NOx emissions from the same sources.
Preliminary Health Analyses
ES-5
6. What are the key inputs and outputs for the health analyses in this preliminary draft report?
The major elements include emissions data, air dispersion modeling, and the assessment of cancer and noncancer health impacts. These analyses rely on the following key input and outputs: • Development of a diesel PM emissions inventory from ocean-going vessel auxiliary
engines while at berth for three California ports.
• Calculation of the statewide PM2.5 and NOx emission reduction benefits for the Concept, beyond the benefits of the existing regulation.
• Estimation of the diesel PM concentrations in the communities around the ports using a U.S. Environmental Protection Agency (U.S. EPA) approved air dispersion model.
• Population data at the census tract level for 5-year age brackets, mortality incidence data at the county level, and hospital admissions and emergency room visits at the state level.
• Quantification of the potential near-source cancer and noncancer health effects associated with diesel PM concentrations using the State’s methodology for health risk assessments established by OEHHA in the OEHHA Air Toxics Hot Spots Program Risk Assessment Guidelines: The Air Toxics Hot Spots Program Guidance Manual for Preparation of Health Risk Assessments (OEHHA, 2015) (Guidance Manual).
• Quantification of the potential statewide PM2.5 mortality and illness impacts.
These health analyses evaluate the impacts from vessel emissions at berth, but not at anchor, because of the structure of staff’s Concept for the control measure. The Concept would require vessels at anchor to maintain opacity standards6, but does not include emission reduction requirements due to the numerous technical challenges of controlling emissions offshore while vessels are at anchor in the harbor. 7. What ports did CARB staff select to evaluate the localized benefits of the
Concept in reducing the impacts from vessels at berth? To evaluate the effectiveness of the Concept in reducing health impacts in communities around a port, CARB staff evaluated the health impacts at three ports. Staff selected 6 Consistent with HSC 41701, all ocean-going vessels visiting a California port or terminal or at anchor in California waters shall not discharge or cause the discharge into the atmosphere of visible emissions exceeding Ringelmann 2 (equivalent to 40 percent opacity) based on an average of 12 consecutive readings from any operation on the vessel using United States Environmental Protection Agency Opacity Test Method 9 (40 CFR Pt. 60, App. A-4, effective October 31, 2016).
Preliminary Health Analyses
ES-6
ports based on port size, vessel activity, emissions, and proximity to disadvantaged communities. The Port of Los Angeles (POLA) and the Port of Long Beach (POLB) represent large ports. The Richmond Complex (which is comprised of the public Port of Richmond and the private Chevron Marine Terminal) represents small ports. POLA and POLB combined account for more than half of the at berth emissions in California, while the Richmond Complex has the second largest emissions for tanker vessels in California. 8. What is the process CARB staff used to assess the localized health risk for
the three ports evaluated? CARB staff estimated the amount of diesel PM emitted from ocean-going vessels while operating at berth at each of the three ports, by vessel type. CARB staff generated the exposure estimates with U.S. EPA’s preferred air dispersion computer model, AERMOD7, to estimate the annual average off-site concentration of diesel PM resulting from the activity at the three ports. The key inputs to AERMOD were the diesel PM emissions information (e.g., magnitude, timing, and location), the meteorological data (e.g., wind speed, direction, etc.), and the dispersion coefficients (e.g., consideration of land cover). CARB staff then calculated the potential cancer risks using the annual average concentration of diesel PM predicted by the AERMOD model and a health risk factor (referred to as a cancer potency factor) that correlates cancer risk to the amount of diesel PM inhaled. This HRA is consistent with the methodology presented in the Guidance Manual. The cancer potency factor was developed by OEHHA and approved by the Scientific Review Panel on Toxic Air Contaminants as part of the public process to identify diesel PM as a toxic air contaminant. In a risk assessment, cancer risk is typically expressed as the chance an individual has of developing cancer if a million people were exposed to a toxic air contaminant continuously for a specified duration of exposure (e.g., 30 or 70 years). In this HRA, we present the risk to the broader population near the ports based on a 70-year exposure, as well as the risk to the maximum exposed individual resident (MEIR) based on a 30-year exposure. 9. What are the diesel PM emissions from each vessel type at the ports
evaluated? For the HRA, CARB staff estimated the emissions of diesel PM from at berth activities by vessel type. The diesel PM emissions are based on a vessel’s auxiliary engine operations, which currently utilize a distillate diesel fuel. 7 The American Meteorological Society/Environmental Protection Agency Regulatory Model (AERMOD) is a steady-state plume model that incorporates air dispersion based on planetary boundary layer turbulence structure and scaling concepts, including treatment of both surface and elevated sources, and both simple and complex terrain.
Preliminary Health Analyses
ES-7
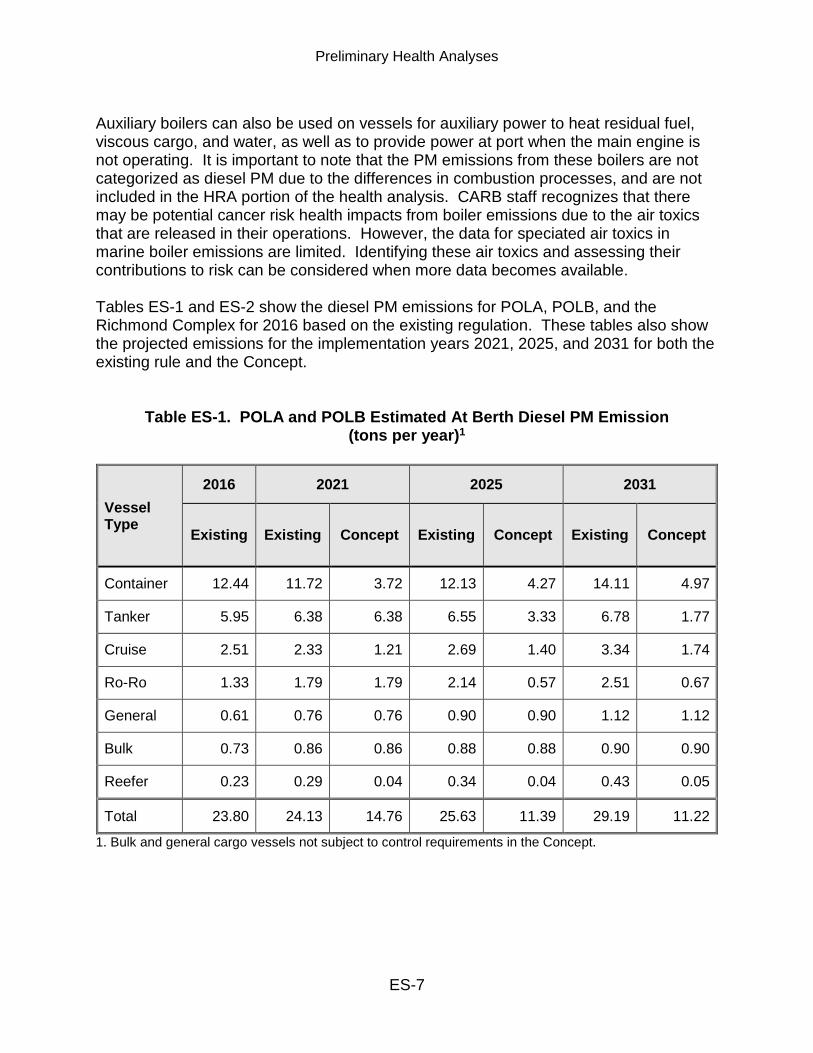
Auxiliary boilers can also be used on vessels for auxiliary power to heat residual fuel, viscous cargo, and water, as well as to provide power at port when the main engine is not operating. It is important to note that the PM emissions from these boilers are not categorized as diesel PM due to the differences in combustion processes, and are not included in the HRA portion of the health analysis. CARB staff recognizes that there may be potential cancer risk health impacts from boiler emissions due to the air toxics that are released in their operations. However, the data for speciated air toxics in marine boiler emissions are limited. Identifying these air toxics and assessing their contributions to risk can be considered when more data becomes available. Tables ES-1 and ES-2 show the diesel PM emissions for POLA, POLB, and the Richmond Complex for 2016 based on the existing regulation. These tables also show the projected emissions for the implementation years 2021, 2025, and 2031 for both the existing rule and the Concept.
Table ES-1. POLA and POLB Estimated At Berth Diesel PM Emission (tons per year)1
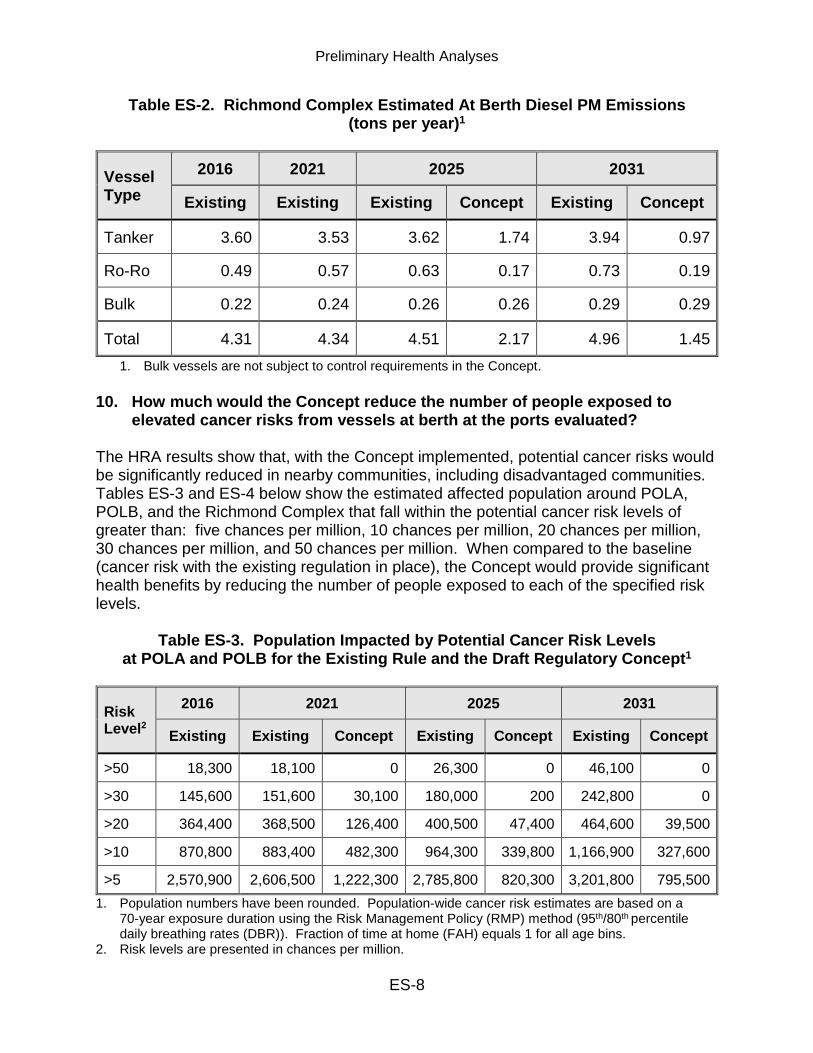
Total 4.31 4.34 4.51 2.17 4.96 1.45 1. Bulk vessels are not subject to control requirements in the Concept.
10. How much would the Concept reduce the number of people exposed to
elevated cancer risks from vessels at berth at the ports evaluated? The HRA results show that, with the Concept implemented, potential cancer risks would be significantly reduced in nearby communities, including disadvantaged communities. Tables ES-3 and ES-4 below show the estimated affected population around POLA, POLB, and the Richmond Complex that fall within the potential cancer risk levels of greater than: five chances per million, 10 chances per million, 20 chances per million, 30 chances per million, and 50 chances per million. When compared to the baseline (cancer risk with the existing regulation in place), the Concept would provide significant health benefits by reducing the number of people exposed to each of the specified risk levels.
Table ES-3. Population Impacted by Potential Cancer Risk Levels
at POLA and POLB for the Existing Rule and the Draft Regulatory Concept1
>5 2,570,900 2,606,500 1,222,300 2,785,800 820,300 3,201,800 795,500 1. Population numbers have been rounded. Population-wide cancer risk estimates are based on a
70-year exposure duration using the Risk Management Policy (RMP) method (95th/80th percentile daily breathing rates (DBR)). Fraction of time at home (FAH) equals 1 for all age bins.
2. Risk levels are presented in chances per million.
Preliminary Health Analyses
ES-9
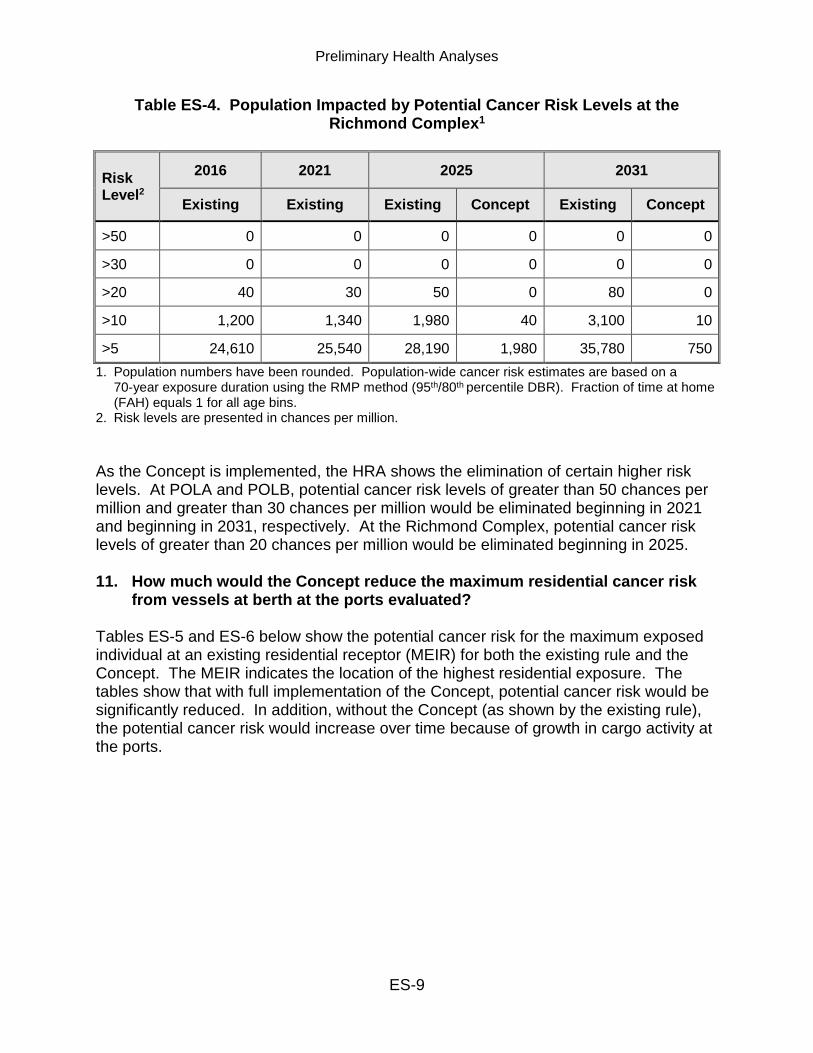
Table ES-4. Population Impacted by Potential Cancer Risk Levels at the Richmond Complex1
>5 24,610 25,540 28,190 1,980 35,780 750 1. Population numbers have been rounded. Population-wide cancer risk estimates are based on a
70-year exposure duration using the RMP method (95th/80th percentile DBR). Fraction of time at home (FAH) equals 1 for all age bins.
2. Risk levels are presented in chances per million. As the Concept is implemented, the HRA shows the elimination of certain higher risk levels. At POLA and POLB, potential cancer risk levels of greater than 50 chances per million and greater than 30 chances per million would be eliminated beginning in 2021 and beginning in 2031, respectively. At the Richmond Complex, potential cancer risk levels of greater than 20 chances per million would be eliminated beginning in 2025. 11. How much would the Concept reduce the maximum residential cancer risk
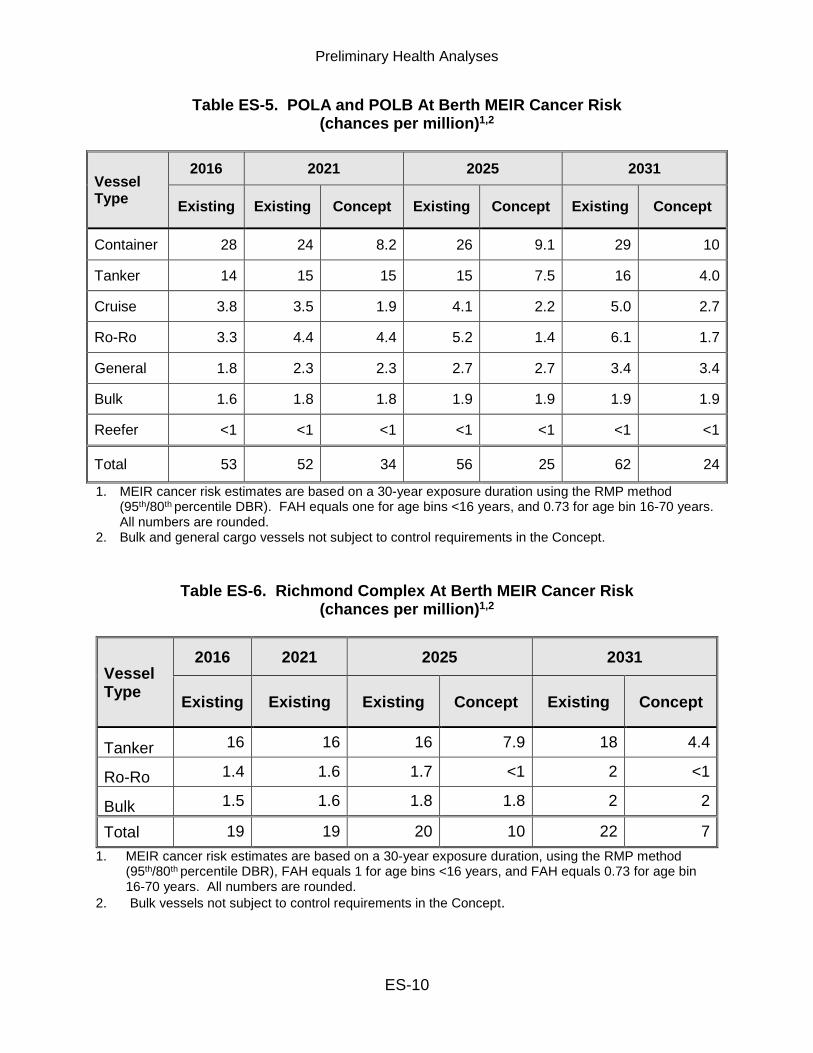
from vessels at berth at the ports evaluated? Tables ES-5 and ES-6 below show the potential cancer risk for the maximum exposed individual at an existing residential receptor (MEIR) for both the existing rule and the Concept. The MEIR indicates the location of the highest residential exposure. The tables show that with full implementation of the Concept, potential cancer risk would be significantly reduced. In addition, without the Concept (as shown by the existing rule), the potential cancer risk would increase over time because of growth in cargo activity at the ports.
Preliminary Health Analyses
ES-10
Table ES-5. POLA and POLB At Berth MEIR Cancer Risk (chances per million)1,2
1. MEIR cancer risk estimates are based on a 30-year exposure duration using the RMP method (95th/80th percentile DBR). FAH equals one for age bins <16 years, and 0.73 for age bin 16-70 years. All numbers are rounded.
2. Bulk and general cargo vessels not subject to control requirements in the Concept.
Table ES-6. Richmond Complex At Berth MEIR Cancer Risk (chances per million)1,2
Total 19 19 20 10 22 7 1. MEIR cancer risk estimates are based on a 30-year exposure duration, using the RMP method
(95th/80th percentile DBR), FAH equals 1 for age bins <16 years, and FAH equals 0.73 for age bin 16-70 years. All numbers are rounded.
2. Bulk vessels not subject to control requirements in the Concept.
Preliminary Health Analyses
ES-11
For POLA and POLB, comparing the potential cancer risk with and without the Concept for the final implementation date of 2031, the MEIR potential cancer risk decreases from approximately 62 chances per million to approximately 24 chances per million. This represents a reduction in potential cancer risk of more than 60 percent. Similarly, for the Richmond Complex, comparing the potential cancer risk with and without the Concept for the final implementation dates of 2031, the MEIR potential cancer risk decreases from approximately 22 chances per million to approximately seven chances per million. This represents a reduction in potential cancer risk of more than 68 percent. 12. What is the process CARB staff used to assess the premature death and
illness impacts from regional PM2.5 pollution from vessels at berth? CARB staff used direct modeling to estimate health impacts from at berth primary PM2.5 emissions in the South Coast Air Basin, and the incidents-per-ton methodology (IPT) to estimate impacts from at berth NOx emissions and primary PM2.5 emissions in other air basins where modeled PM2.5 concentrations are not available. For the direct modeling, CARB staff estimated the PM2.5 concentrations using the air dispersion modeling results of the HRA for the POLA and the POLB. CARB staff then estimated the impacts in each modeled grid cell from the air dispersion analysis using a health model, then aggregated the results over the South Coast Air Basin. To do this, CARB staff assumed that the entire population within each modeling grid was exposed uniformly to modeled concentration for that grid and that baseline rates of premature deaths from heart and lung diseases, hospitalizations, and emergency room visits were uniform across each county. For all other air basins, CARB staff used an IPT methodology. The IPT methodology uses California air basin specific relationships between emission and air quality. In this methodology, the number of premature deaths from heart and lung diseases are estimated by multiplying the PM2.5 emissions from a specific source, in this case, vessels at berth, by a number called an IPT factor. The IPT factor is calculated by taking the estimated number of premature deaths from heart and lung diseases, hospitalizations and emergency room visits, associated with exposure to PM2.5 for a 2009-2011 baseline scenario based on historical air quality data, and dividing them by the emissions of PM2.5 from all sources. The calculation is performed separately for each air basin. The estimated health incidence for the baseline scenario is based on age-stratified population data at the census tract level and incidence data at the county (where available) or state level.
Preliminary Health Analyses
ES-12
13. How much would the Concept reduce the premature death and illness impacts from regional PM2.5 pollution from vessels at berth?
CARB staff estimated the potential statewide PM mortality and illness impacts associated with exposure to PM2.5 from the Concept. These health outcomes include cardiopulmonary mortality, hospital admissions, and emergency room visits. Based on the analysis, staff estimates that the total number of cases that would be reduced from implementation of the Concept are as follows:
• 161 premature deaths8
• 27 hospital admissions9
• 70 emergency room visits10 Monetization of Health Outcomes In accordance with U.S. EPA practice, CARB staff monetized the health outcomes above by multiplying incidence by a standard value derived from economic studies resulting in a valuation per incident.11 This results in valuations for avoided premature mortality, avoided hospitalizations, and emergency room visits. The valuation for avoided premature mortality is based on willingness to pay.12 The valuation for avoided hospitalizations and emergency room visits is based on a combination of typical costs associated with hospitalization and the willingness of surveyed individuals to pay to avoid adverse outcomes that occur when hospitalized. These include hospital charges, post-hospitalization medical care, out-of-pocket expenses, and lost earnings for both individuals and family members, lost recreation value, and lost household protection (e.g., valuation of time-losses from inability to maintain the household or provide childcare).13
8 Range: 126 to 196, 95 percent confidence interval. 9 Range: 3 to 59, 95 percent confidence interval. 10 Range: 45 to 97, 95 percent confidence interval. 11 National Center for Environmental Economics et al., Appendix B: Mortality Risk Valuation Estimates, Guidelines for Preparing Economic Analyses (EPA 240-R-10-001, Dec. 2010) available at https://www.epa.gov/sites/production/files/2017-09/documents/ee-0568-22.pdf. 12 United States Environmental Protection Agency Science Advisory Board (U.S. EPA-SAB), An SAB Report on EPA’s White Paper Valuing the Benefits of Fatal Cancer Risk Reduction (EPA-SAB-EEAC-00-013, July 2000), available at http://yosemite.epa.gov/sab%5CSABPRODUCT.NSF/41334524148BCCD6852571A700516498/$File/eeacf013.pdf. 13 Lauraine G. Chestnut et. al., The Economic Value Of Preventing Respiratory And Cardiovascular Hospitalizations (Contemporary Economic Policy, 24: 127–143. doi: 10.1093/CEP/BYJ007, Jan. 2006), available at http://onlinelibrary.wiley.com/doi/10.1093/cep/byj007/full.
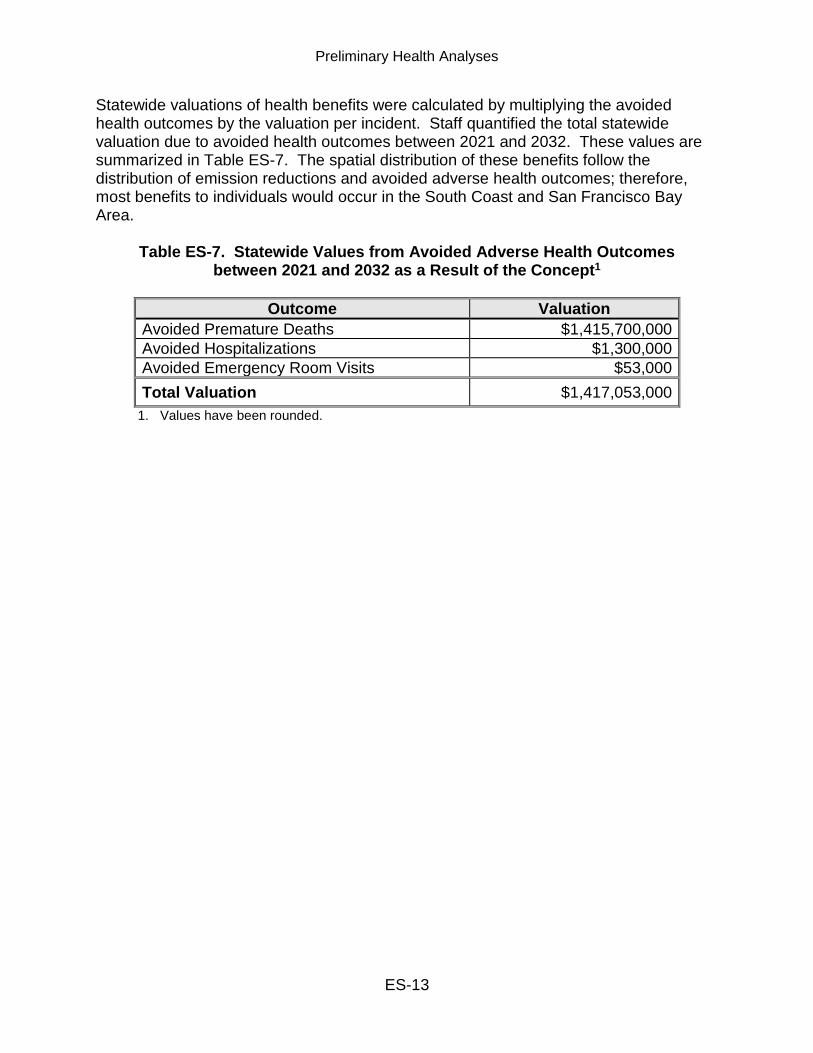
Statewide valuations of health benefits were calculated by multiplying the avoided health outcomes by the valuation per incident. Staff quantified the total statewide valuation due to avoided health outcomes between 2021 and 2032. These values are summarized in Table ES-7. The spatial distribution of these benefits follow the distribution of emission reductions and avoided adverse health outcomes; therefore, most benefits to individuals would occur in the South Coast and San Francisco Bay Area.
Table ES-7. Statewide Values from Avoided Adverse Health Outcomes between 2021 and 2032 as a Result of the Concept1
I. OVERVIEW This document describes two separate analyses, a health risk assessment and a mortality and illness analysis. Each quantifies different health effects and each is equally important. The health risk assessment focuses on diesel PM. Exposure to diesel PM has both cancer and noncancer chronic health impacts. The mortality and illness analysis focuses on PM2.5, both directly emitted and formed from NOx emissions. Exposure to these pollutants can result in health outcomes that include premature death from cardiopulmonary disease, hospital admissions, and emergency room visits.
A. Approaches Used in the Health Analyses The approaches used in each of these health analyses are outlined below: Health Risk Assessment
• Develop a diesel PM emissions inventory based on implementation dates that reflect the anticipated amount of diesel PM released annually from at berth emissions.
• Conduct air dispersion modeling to estimate the ground-level concentrations of diesel PM that result from these emissions.
• Estimate the potential health impacts from the modeled exposures.
Mortality and Illness Analysis
• Develop a PM2.5 and NOx emissions inventory based on implementation dates that reflect the anticipated amount of each pollutant released annually from at berth emissions.
• Estimate statewide PM2.5 noncancer mortality and illness impacts associated with exposure to primary PM2.5 (diesel PM and boiler PM) and secondary PM2.5 from NOx emissions. B. Applicability of the Diesel PM Health Values for Engines Using Marine
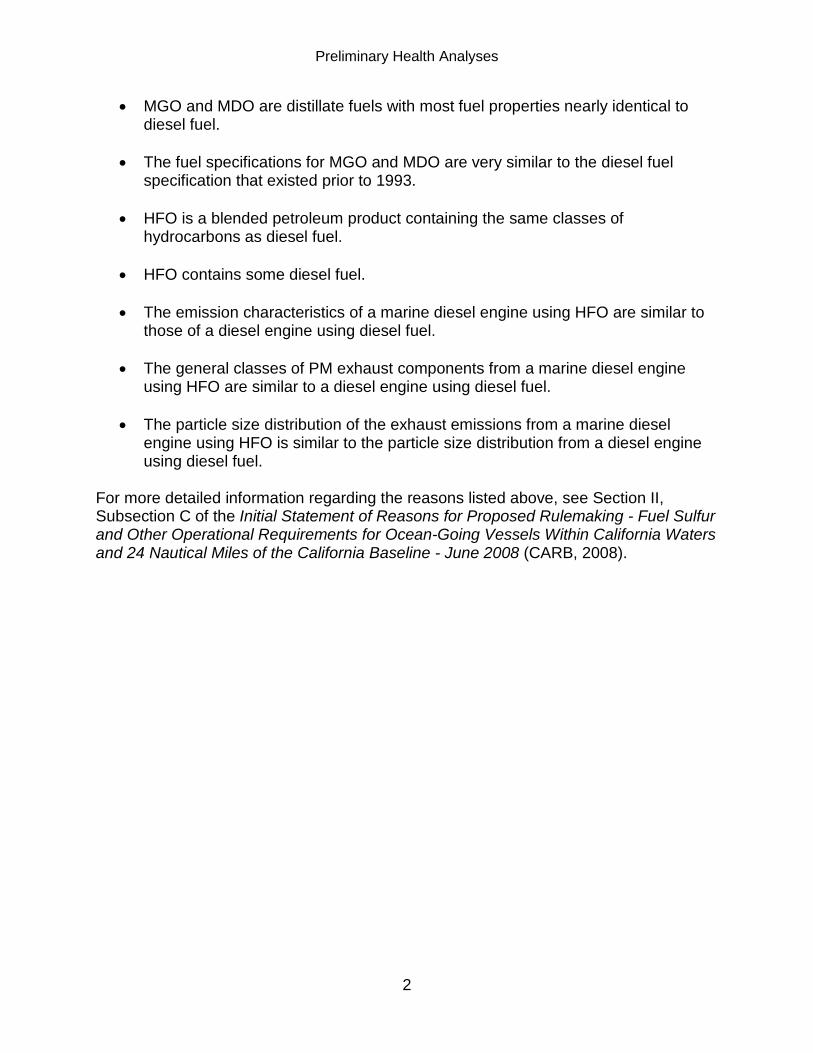
Gas Oil, Marine Diesel Oil, or Marine Heavy Fuel Oil Ocean-going vessel auxiliary engines operating at berth use various diesel fuel types (e.g., marine gas oil (MGO), marine diesel oil (MDO), or marine heavy fuel oil (HFO)). CARB staff, in consultation with OEHHA, has concluded that particulate matter (PM) emissions from ocean-going vessel diesel (compression ignition) engines operating on MGO, MDO, or HFO constitute diesel PM emissions. As such, the CPF and chronic REL for diesel PM are applicable to exhaust emissions from ocean-going vessel diesel engines using MGO, MDO, or HFO. The reasoning used to support these conclusions is summarized below.
Preliminary Health Analyses
2
• MGO and MDO are distillate fuels with most fuel properties nearly identical to diesel fuel.
• The fuel specifications for MGO and MDO are very similar to the diesel fuel specification that existed prior to 1993.
• HFO is a blended petroleum product containing the same classes of hydrocarbons as diesel fuel.
• HFO contains some diesel fuel.
• The emission characteristics of a marine diesel engine using HFO are similar to those of a diesel engine using diesel fuel.
• The general classes of PM exhaust components from a marine diesel engine using HFO are similar to a diesel engine using diesel fuel.
• The particle size distribution of the exhaust emissions from a marine diesel engine using HFO is similar to the particle size distribution from a diesel engine using diesel fuel.
For more detailed information regarding the reasons listed above, see Section II, Subsection C of the Initial Statement of Reasons for Proposed Rulemaking - Fuel Sulfur and Other Operational Requirements for Ocean-Going Vessels Within California Waters and 24 Nautical Miles of the California Baseline - June 2008 (CARB, 2008).
Preliminary Health Analyses
3
II. EMISSIONS INVENTORY To support the health analyses, CARB staff used its latest ocean-going vessel emissions inventory, combined with port-specific data on vessel visits and the following assumptions for implementation of the August 2018 Concept.
• Phase 1: Begins in 2021 and would require at least an 80 percent reduction in emissions from auxiliary engines used in container vessels, reefer vessels, and cruise ships while at berth.
• Phase 2: Begins in 2025 and would require at least an 80 percent reduction in
emissions from auxiliary engines used in Ro-Ro vessels and at least a 50 percent reduction in emissions from auxiliary engines used in tanker vessels while at berth. Phase 2 would also require at least a 50 percent reduction in emissions from auxiliary boilers used in tanker vessels that utilize steam-driven pumps to offload cargo.
• Phase 3: Begins in 2031 and would require at least an 80 percent reduction in
emissions from auxiliary engines used in tanker vessels while at berth and at least an 80 percent reduction in emissions from auxiliary boilers used in tanker vessels that utilize steam-driven pumps to offload cargo.
A. Emission Inventory Summary In order to conduct an HRA, it is necessary to have information regarding the amount of pollutants being emitted by the sources. CARB staff estimated at berth vessel emissions based on the best available information regarding past, current, and projected future at berth activities. The emissions inventory for the three ports in this HRA were calculated using vessel activity data. The emissions inventory uses a base year of 2016, based on data from IHS-Markit and Marine Exchange that provides vessel visits and duration of stay, vessel type and size. Auxiliary engine power and load were derived from POLA and POLB inventories and the vessel boarding program. The base year inventory combines the vessel visits (base population), the vessel durations (base activity), engine power, engine load, and emission factors based on the model year of the engine (based on numerous sources from industry and maritime organizations), along with correction factors, in the follow equation:
Base Population * Base Activity * Power * Load * Emission Factors = Base Year Emissions
This is a highly simplified representation, in reality the data is calculated for each vessel visit and summed to provide final base year emissions. This prevents errors due to averaging. Growth and forecasts are based on the federal Freight Analysis Framework for most of the ports in the State outside of POLA and POLB. The Mercator Group made growth
Preliminary Health Analyses
4
forecasts for POLA and POLB specifically, including container vessel size trends. Growth is specific to vessel type and is reflective of an increase in cargo moved and delivered. For example, a freight forecast that shows bulk cargo increasing by 50 percent by 2030 would result in a growth factor of 150 percent for bulk cargo ships by 2030, or 3 percent annual growth from 2016 to 2030. Growth is applied directly to the base year inventory to project increased vessel visits and the associated increased overall activity and emissions. The following equation provides a simplified version of this operation:
Growth Factor for Future Year * (Base Population * Base Activity) * Power * Load * Emission Factors = Future Year Emissions
The age distribution of vessels within each vessel type (and for container ships, within each container vessel size group, expressed in thousands of twenty-foot equivalent units (TEU)) is assumed to remain consistent in future years. In previous inventories, Tier 3 vessels were assumed to visit California ports as soon as Tier 3 Marine Standards were introduced in 2013 to 2014. This has been updated in the current model to reflect research completed for POLA and POLB that shows Tier 3 engines likely will not arrive until the 2030 timeframe. At this point, emission factors for NOx begin to decrease leading to an overall gradual decrease in NOx emissions from ocean-going vessels. To determine berth-specific emissions in the HRA, CARB used Marine Exchange data for POLA, POLB, and the Richmond Complex. The Marine Exchange data includes vessel visits and time spent at individual berths, along with the vessel IMO number. The IMO number was used with California State Land’s Commission data to determine vessel name, category, and characteristics. The combination of Marine Exchange data and California State Land’s Commission data allows CARB staff to calculate emissions for individual berths, where the annual emissions is simply the sum of vessel visits at that berth in the base year of 2016. For future years at POLA and POLB only, the shift in container vessel size trends (from the Mercator Group) increases or decreases the emissions at a berth relative to the vessel sizes that visit it. For example, if a berth primarily hosted smaller container vessels, the emissions will likely go down over time as smaller container vessel visits are forecast as decreasing over time. Conversely, berths with larger vessel visits will show increased emissions over time as the larger container vessels are forecast to have increased visits over time. Information, including data summaries, all assumptions and methodology, and further data sources are covered in detail in the Emissions Inventory Appendix which will be included in the ISOR. B. POLA and POLB Emission Inventory Table 1 shows the diesel PM auxiliary engine emissions inventory delineated by vessel type at POLA and POLB. The table shows 2016 emissions for the existing rule and projections for four years based on the three implementation phases (2021, 2025, and
Preliminary Health Analyses
5
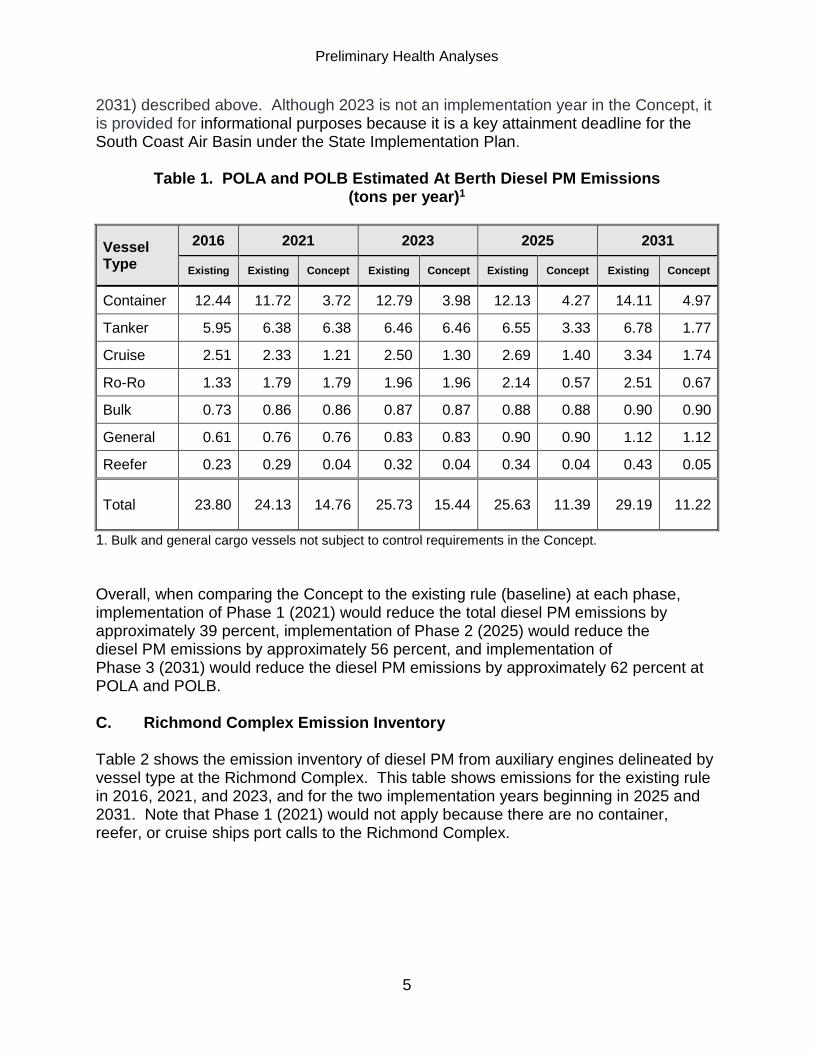
2031) described above. Although 2023 is not an implementation year in the Concept, it is provided for informational purposes because it is a key attainment deadline for the South Coast Air Basin under the State Implementation Plan.
Table 1. POLA and POLB Estimated At Berth Diesel PM Emissions (tons per year)1
Total 23.80 24.13 14.76 25.73 15.44 25.63 11.39 29.19 11.22
1. Bulk and general cargo vessels not subject to control requirements in the Concept. Overall, when comparing the Concept to the existing rule (baseline) at each phase, implementation of Phase 1 (2021) would reduce the total diesel PM emissions by approximately 39 percent, implementation of Phase 2 (2025) would reduce the diesel PM emissions by approximately 56 percent, and implementation of Phase 3 (2031) would reduce the diesel PM emissions by approximately 62 percent at POLA and POLB. C. Richmond Complex Emission Inventory Table 2 shows the emission inventory of diesel PM from auxiliary engines delineated by vessel type at the Richmond Complex. This table shows emissions for the existing rule in 2016, 2021, and 2023, and for the two implementation years beginning in 2025 and 2031. Note that Phase 1 (2021) would not apply because there are no container, reefer, or cruise ships port calls to the Richmond Complex.
Preliminary Health Analyses
6
Table 2. Richmond Complex Estimated At Berth Diesel PM Emissions (tons per year)1
Total 4.31 4.34 4.43 4.51 2.17 4.96 1.45 1. Bulk and general cargo vessels not subject to control requirements in the Concept. Overall, compared to the existing rule, implementation of Phase 2 (2025) and Phase 3 (2031) of the Concept would reduce the total diesel PM emissions by approximately 52 percent and 71 percent, respectively. Tanker vessel emissions would be the largest contributor to the total remaining diesel PM emissions under the Concept, accounting for approximately 80 percent and 67 percent under Phase 2 (2025) and Phase 3 (2031) implementation, respectively. D. Statewide At Berth Emissions by Air Basin
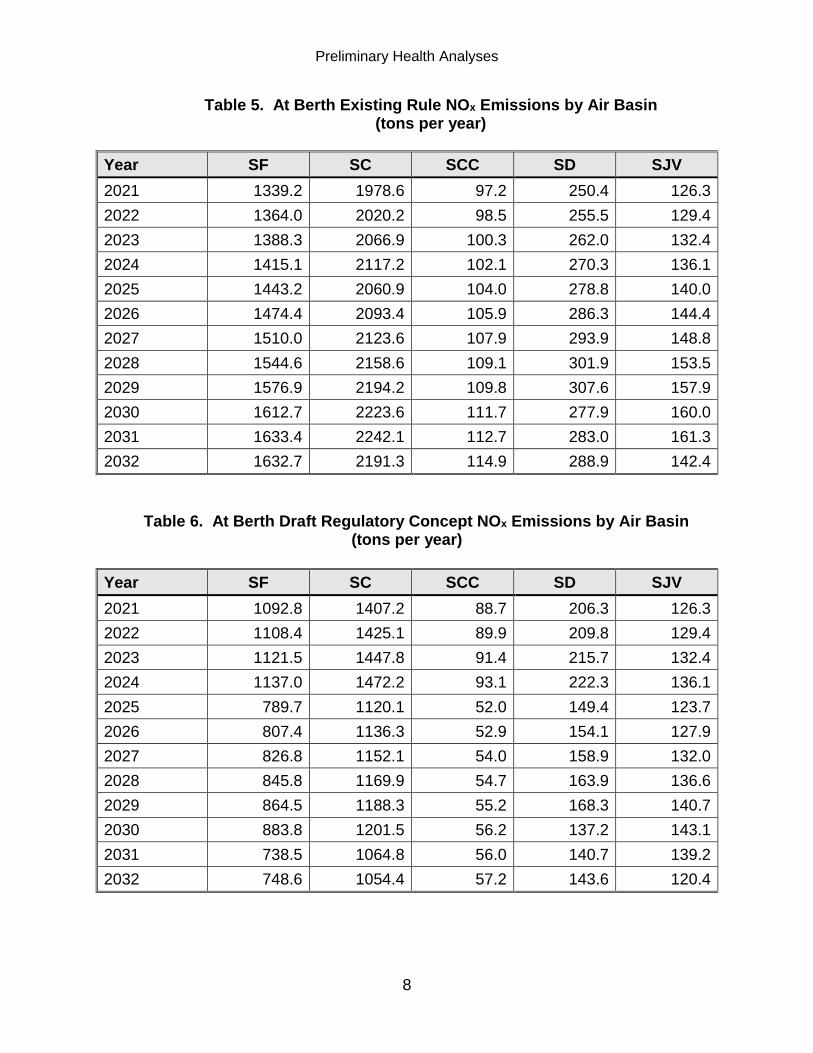
Tables 3 through 6 show the statewide PM2.5 and NOx emission reductions that would result from the Concept. These statewide reductions are used when estimating the ability of the Concept to lower the regional PM2.5 mortality and illness impacts in each air basin. To estimate these benefits, the methodology requires the reductions for each year covered by the Concept for the five air basins where ports and marine terminal complexes covered under the Concept are located. As a result, reductions are shown from 2021-2032 for each of these air basins.
The air basin abbreviations in the following tables mean: SF: San Francisco Bay Area Air Basin SC: South Coast Air Basin SCC: South Central Coast Air Basin SD: San Diego Air Basin SJV: San Joaquin County Air Basin
Preliminary Health Analyses
7
Table 3. At Berth Existing Rule PM2.5 Emissions by Air Basin (tons per year)
III. HEALTH RISK ASSESSMENT FOR THREE CALIFORNIA PORTS
A. Health Risk Assessment Overview Risk assessment is a complex process that requires the analysis of many variables to model real-world situations. The standard approach used for this HRA involves four steps: 1) hazard identification, 2) exposure assessment, 3) dose-response assessment, and 4) risk characterization. These four steps are briefly discussed below.
1. Hazard Identification For this assessment, the pollutant of concern, is diesel PM from internal combustion engines. In 1998, CARB identified diesel PM as a toxic air contaminant based on its potential to cause cancer and other health impacts under the AB 1807 Toxic Air Contaminant Identification and Control Program (CARB, 1998a).
2. Exposure Assessment The risk assessor estimates the extent of public exposure to emitted substances. This involves emissions quantification, modeling of environmental transport, evaluation of environmental fate, identification of exposure routes and exposed populations, and estimation of exposure levels. For at berth operations, the receptors most likely to be exposed include residents and off-site workers located near the port. On-site workers could also be impacted by the emissions; however, they are not included in this HRA because the California Department of Industrial Relations, Division of Occupational Safety and Health (better known as Cal/OSHA) (Cal/OSHA) has jurisdiction over on-site exposure to workers who are employed at the facility. Diesel PM only has health values for the inhalation pathway, as a result, inhalation is the only pathway evaluated. The magnitude of exposure is assessed through diesel PM emission estimates and computer air dispersion modeling, resulting in downwind ground-level concentrations of diesel PM at near-source locations.
3. Dose Response The assessor characterizes the relationship between exposure to a pollutant and the incidence or occurrence of an adverse health effect. This step of the HRA is based on the standardized values developed by OEHHA. OEHHA supplies these dose-response relationships in the form of cancer potency factors (CPFs) for carcinogenic effects and reference exposure levels (RELs) for non-carcinogenic effects. The CPFs and RELs that are used in California can be found in OEHHA guidelines (OEHHA, 2015). The inhalation CPF for diesel particulate from internal combustion engines used for this HRA is 1.1 milligrams per kilogram body weight day (mg/kg-day)-1. The chronic REL for diesel PM from internal combustion engines used for this HRA is 5.0 micrograms per cubic meter (μg/m3). Diesel PM does not have an associated acute REL.
Preliminary Health Analyses
10
4. Risk Characterization Finally, the risk assessor combines information derived from the previous steps. Modeled concentrations, which are determined through exposure assessment, are combined with the CPF for cancer risk and noncancer RELs determined under the dose-response assessment. This step integrates the information used to quantify the potential cancer risk and/or chronic or acute noncancer effects. For this HRA, both individual and population-wide potential cancer risks were quantified, along with the noncancer chronic hazard index.
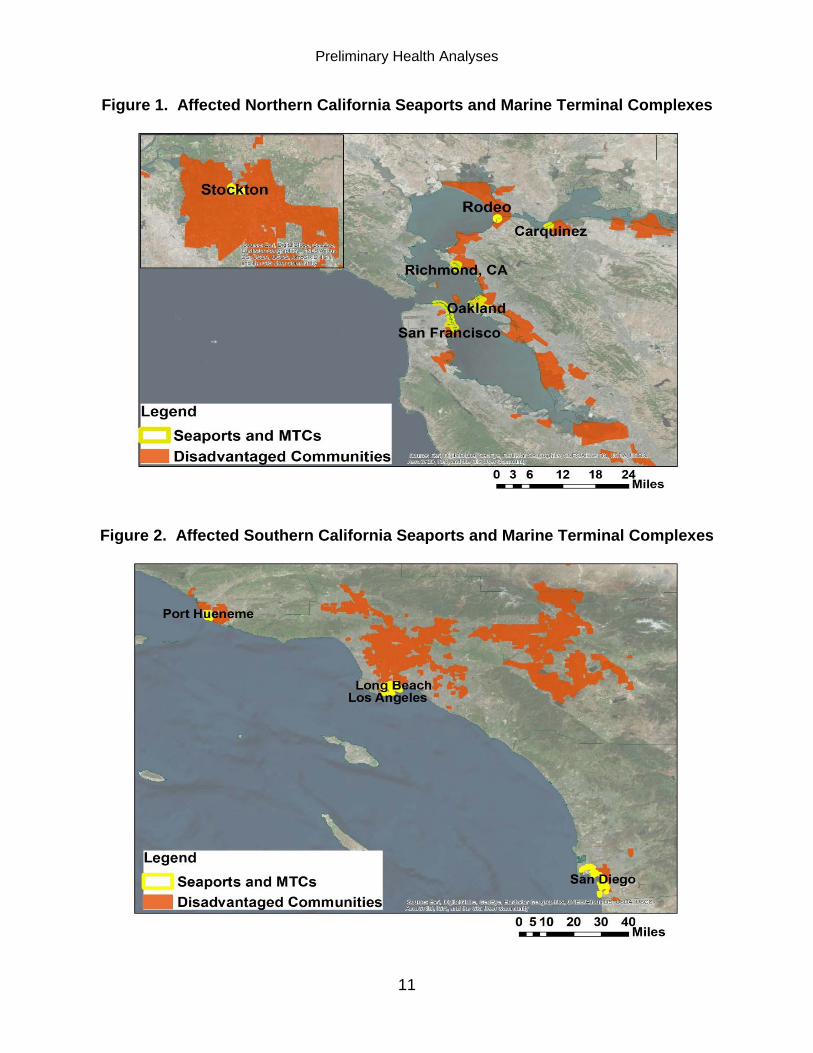
B. Selection of the Three California Ports The Concept would regulate emissions from ocean-going vessels while at berth in most California ports. Figures 1 and 2 show the maps for the Northern and Southern California ports affected by the Concept. The maps also display the disadvantaged communities surrounding the ports, as defined by the 25 percent highest scoring census tracts in CalEnviroScreen3.0 as defined by the California Environmental Protection Agency (OEHHA, 2018). In addition to being surrounded by disadvantaged communities, most of these ports are located in highly-populated urban areas.
Preliminary Health Analyses
11
Figure 1. Affected Northern California Seaports and Marine Terminal Complexes
Figure 2. Affected Southern California Seaports and Marine Terminal Complexes
Preliminary Health Analyses
12
1. Selection of Ports To characterize the existing cancer risk and the effectiveness of the Concept, CARB staff evaluated the health impacts at large and small ports. Staff selected ports based on port size, vessel activity, emissions, and proximity to disadvantaged communities. Staff selected POLA and POLB to represent large ports. The Richmond Complex was selected to represent small ports. POLA and POLB combined represent more than half of the at berth emissions in California while the Richmond Complex represents the second largest emissions for tanker vessels in California. All ports are surrounded by disadvantaged communities that are often disproportionally impacted by higher levels diesel PM. One of CARB’s highest priorities is to reduce exposure to air pollution in disadvantaged communities.
2. Port of Los Angeles and Port of Long Beach POLA and POLB are located next to each other in San Pedro Bay as two separate entities. POLA and POLB are owned by the City of Los Angeles and the City of Long Beach, respectively, and are operated and managed under a State Tidelands Trust that grants local municipalities jurisdiction over ports. Collectively, the two ports encompass approximately 10,700 acres and more than 50 miles of waterfront. Each port has more than 20 terminals for handling all types of vessels and cargo.
3. Richmond Complex The Richmond Complex is a major shipping terminal in the San Francisco Bay, located in the City of Richmond. The Richmond Complex is comprised of two distinct entities, the public Port of Richmond located in the southeastern area of the complex and the private Chevron Marine Terminal associated with the Chevron refinery located in the western area of the complex. The Richmond Complex contains five city-owned terminals and 10 privately-owned terminals for handling bulk liquids, bulk materials, vehicles, and general cargo. The Chevron Marine Terminal is approximately one-half mile in length and connects to the shore with a one-half mile long causeway. This terminal is primarily used for handling crude oil.
Preliminary Health Analyses
13
C. Air Dispersion Modeling In this section, we describe the air dispersion modeling performed to estimate the downwind concentration of diesel PM emitted from the at berth operations at the ports. A description of the air quality modeling parameters, including air dispersion model selection, modeling domain, emission source allocation, model parameters, meteorological data selection, and the model receptor network, is provided.
1. Air Dispersion Model Selection Air quality models can be used to simulate physical and chemical processes that affect air toxics as they disperse and react in the atmosphere. The selection of an air dispersion model depends on many factors, such as: characteristics of emission sources (e.g., point, area, volume, or line), the type of terrain (e.g., flat or complex) at the emission source locations, and the relationship between sources and receptors. For this HRA, CARB staff selected U.S. EPA’s AERMOD, Version 18081 (U.S. EPA, 2018) to simulate the impacts of at berth ocean-going vessel diesel PM emissions on nearby receptors. AERMOD is a steady-state plume model that incorporates air dispersion based on a planetary boundary layer turbulence structure and scaling concepts, including treatment of both surface and elevated sources for distances up to 50 kilometers (km) in both flat and complex terrain.
2. Modeled Source Type and Parameters Since emissions from ocean-going vessels while at berth typically come from the vessel’s stack, CARB staff simulated these emissions as individual point sources. Modeling parameters for point sources include emission rate, stack height, stack diameter, stack exhaust temperature, and stack exhaust exit velocity. The point source parameters used in this HRA are based on the modeling parameters for hoteling from the Diesel Particulate Matter Exposure Assessment Study for the Ports of Los Angeles and Long Beach (CARB, 2006a). The modeling parameters are summarized below.
Figures 3 and 4 show the locations of the modeled point sources at each port. Staff used the following sources to determine the locations of the point sources.
Preliminary Health Analyses
14
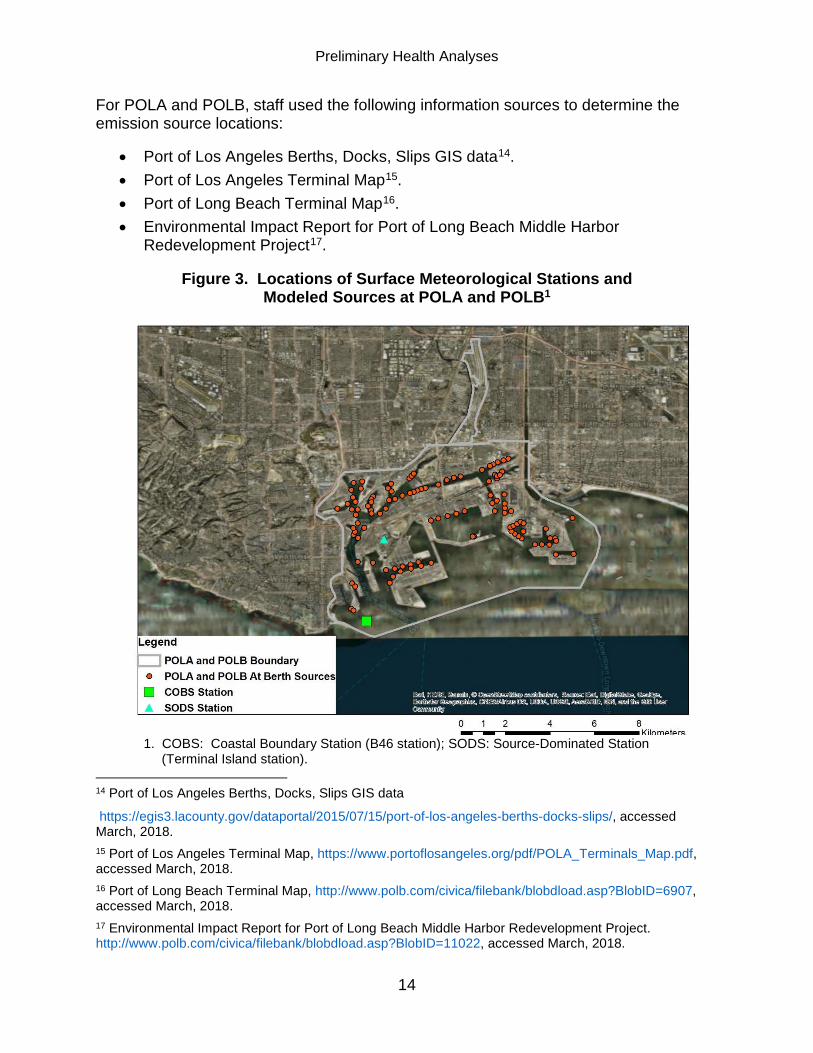
For POLA and POLB, staff used the following information sources to determine the emission source locations:
• Port of Los Angeles Berths, Docks, Slips GIS data14. • Port of Los Angeles Terminal Map15. • Port of Long Beach Terminal Map16. • Environmental Impact Report for Port of Long Beach Middle Harbor
Redevelopment Project17.
Figure 3. Locations of Surface Meteorological Stations and Modeled Sources at POLA and POLB1
1. COBS: Coastal Boundary Station (B46 station); SODS: Source-Dominated Station
(Terminal Island station). 14 Port of Los Angeles Berths, Docks, Slips GIS data
https://egis3.lacounty.gov/dataportal/2015/07/15/port-of-los-angeles-berths-docks-slips/, accessed March, 2018. 15 Port of Los Angeles Terminal Map, https://www.portoflosangeles.org/pdf/POLA_Terminals_Map.pdf, accessed March, 2018. 16 Port of Long Beach Terminal Map, http://www.polb.com/civica/filebank/blobdload.asp?BlobID=6907, accessed March, 2018. 17 Environmental Impact Report for Port of Long Beach Middle Harbor Redevelopment Project. http://www.polb.com/civica/filebank/blobdload.asp?BlobID=11022, accessed March, 2018.
For the Richmond Complex, staff used the following information sources to determine the emission source locations:
• United States (U.S.) Department of Homeland Security, U.S Coast Guard Navigation Center, AIS Encoding Guide and U.S. Destinations Codes18
Figure 4. Locations of Surface Meteorological Stations and Modeled Sources at
the Richmond Complex
3. Meteorological Data AERMOD requires hourly meteorological data as inputs to the model. Meteorological parameters include wind speed, wind direction, atmospheric stability, and ambient temperature. These parameters are recorded by meteorological stations. For this HRA, CARB staff selected meteorological stations based on their representativeness to the modeled port areas.
18 US Department of Homeland Security, United States Coast Guard Navigation Center. AIS Encoding Guide and U.S. Destinations Codes, https://www.navcen.uscg.gov/?pageName=locode, accessed March 2018.
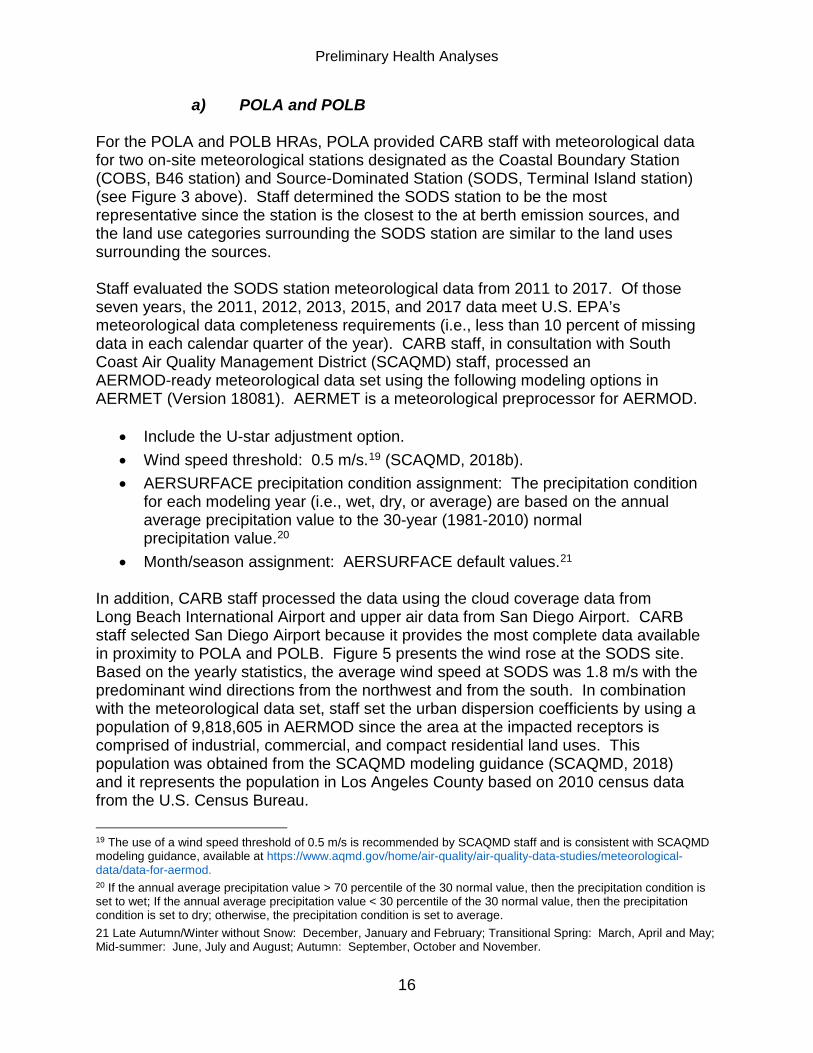
a) POLA and POLB For the POLA and POLB HRAs, POLA provided CARB staff with meteorological data for two on-site meteorological stations designated as the Coastal Boundary Station (COBS, B46 station) and Source-Dominated Station (SODS, Terminal Island station) (see Figure 3 above). Staff determined the SODS station to be the most representative since the station is the closest to the at berth emission sources, and the land use categories surrounding the SODS station are similar to the land uses surrounding the sources. Staff evaluated the SODS station meteorological data from 2011 to 2017. Of those seven years, the 2011, 2012, 2013, 2015, and 2017 data meet U.S. EPA’s meteorological data completeness requirements (i.e., less than 10 percent of missing data in each calendar quarter of the year). CARB staff, in consultation with South Coast Air Quality Management District (SCAQMD) staff, processed an AERMOD-ready meteorological data set using the following modeling options in AERMET (Version 18081). AERMET is a meteorological preprocessor for AERMOD.
• Include the U-star adjustment option. • Wind speed threshold: 0.5 m/s.19 (SCAQMD, 2018b). • AERSURFACE precipitation condition assignment: The precipitation condition
for each modeling year (i.e., wet, dry, or average) are based on the annual average precipitation value to the 30-year (1981-2010) normal precipitation value.20
• Month/season assignment: AERSURFACE default values.21 In addition, CARB staff processed the data using the cloud coverage data from Long Beach International Airport and upper air data from San Diego Airport. CARB staff selected San Diego Airport because it provides the most complete data available in proximity to POLA and POLB. Figure 5 presents the wind rose at the SODS site. Based on the yearly statistics, the average wind speed at SODS was 1.8 m/s with the predominant wind directions from the northwest and from the south. In combination with the meteorological data set, staff set the urban dispersion coefficients by using a population of 9,818,605 in AERMOD since the area at the impacted receptors is comprised of industrial, commercial, and compact residential land uses. This population was obtained from the SCAQMD modeling guidance (SCAQMD, 2018) and it represents the population in Los Angeles County based on 2010 census data from the U.S. Census Bureau. 19 The use of a wind speed threshold of 0.5 m/s is recommended by SCAQMD staff and is consistent with SCAQMD modeling guidance, available at https://www.aqmd.gov/home/air-quality/air-quality-data-studies/meteorological-data/data-for-aermod. 20 If the annual average precipitation value > 70 percentile of the 30 normal value, then the precipitation condition is set to wet; If the annual average precipitation value < 30 percentile of the 30 normal value, then the precipitation condition is set to dry; otherwise, the precipitation condition is set to average. 21 Late Autumn/Winter without Snow: December, January and February; Transitional Spring: March, April and May; Mid-summer: June, July and August; Autumn: September, October and November.
Preliminary Health Analyses
17
Figure 5. Wind Rose of SODS Station Used for POLA and POLB Modeling
Preliminary Health Analyses
18
b) Richmond Complex The at berth emission sources at the Richmond Complex are located in two distinct areas. The Port of Richmond is located in the southeastern area of the complex and the Chevron Marine Terminal (a private marine oil terminal) is located in the western area of the complex. Bay Area Air Quality Management District (BAAQMD) staff provided CARB staff with two AERMOD-ready meteorological data sets located at Point San Pablo and the Chevron Refinery. The Point San Pablo station is located in a coastal area and the Chevron Met Station is located in an inland area (see Figure 4). A third met station is located at Chevron Richmond Long Wharf at the National Oceanic and Atmospheric Administration’s (NOAA) National Buoy Data Center.22 The World Meteorological Organization (WMO) Guide to Meteorological Instruments and Methods of Observation (WMO, 2008), contains general requirements for a meteorological station (section 1.3.3.1 Site Selection), which states: “The site should be well away from trees, buildings, walls or other obstructions. The distance of any such obstacle (including fencing) from the rain gauge should not be less than twice the height of the object above the rim of the gauge, and preferably four times the height.” For the Chevron Richmond Long Wharf Met station, CARB and BAAQMD staff had concerns about meeting the WMO requirements due to the station’s location and physical set-up. For example, the anemometer height is at 7.1 m above pier, while the standard anemometer height should be at 10 m. In addition, the surrounding pier structures and the docked ships would have an impact on the winds observed at the station, given the tower’s height and placement near the pier building structures. For these reasons, this station was not used in this assessment. For the two AERMOD-ready met data sets provided by BAAQMD, staff determined the Point San Pablo station is more representative for modeling the Chevron Marine Terminal since the land use surrounding this station is similar to the land use surrounding the Chevron Marine Terminal. Staff also determined that the Chevron Met Station is more representative for modeling the Richmond Complex because the land use surrounding this station is similar to the land use surrounding the Richmond Complex. In combination with the meteorological data sets, staff ran AERMOD using the rural option, as the area within 3 km of the port facility is considered predominantly rural because it is surrounded on three sides by water.23
22 National Oceanic and Atmospheric Administrations’ (NOAA) National Buoy Data Center, available at: https://www.ndbc.noaa.gov/station_page.php?station=rcmc1 23 40 CFR Appendix W to Part 51, Guideline on Air Quality Models: Land Use Procedure.
Preliminary Health Analyses
19
The Point San Pablo AERMOD-ready meteorological data set includes years 2010 to 2014. The Chevron Met Station AERMOD-ready meteorological data set includes years 2009 to 2013. Figures 6 and 7 present the wind rose at each site. The average wind speed at the Point San Pablo site was 4.8 m/s with the predominant wind directions from the southwest. The average wind speed at the Chevron Met Station was 4.0 m/s with the predominant wind directions from the south. The following information summarizes how BAAQMD processed the meteorological data sets.
• No U-star adjustment option.24
• Wind speed threshold: 0.223 m/s.25
• AERSURFACE precipitation condition assignment: The precipitation condition for the each modeling year (i.e., wet, dry, or average) was based on the annual average precipitation value to the 30-year (1981-2010) normal precipitation value.
• Cloud coverage and upper air data from the Oakland Airport.
24 According to AERMOD guidance ”The ADJ_U* option may be used as a regulatory option in AERMET with NWS data or with site-specific data that does not include turbulence (i.e., sigma-w and/or sigma-theta)”. The turbulence data (Sigma-theta data) was included in the BAAQMD on-site data, so the U-star option was not selected. (2018, U.S. EPA) 25 The use of a wind speed threshold of 0.223 m/s is recommended by BAAQMD staff and is consistent with the BAAQMD met data processing procedure.
Preliminary Health Analyses
20
Figure 6. Wind Rose of Point San Pablo Met Station Used for Modeling Chevron Marine Terminal Sources
4. Model Domain and Receptor Network The modeling domain includes the ports, the ocean surrounding the ports, and nearby residential areas. Cartesian grid receptors were placed around the ports where concentrations were estimated by the model. A number of on-site marina receptors were also included in the modeling. However, the focus of this evaluation was on off-port receptors. The flagpole height option was not applied to any receptors in this HRA because a sensitivity study showed the differences between the concentrations estimated with the flagpole receptors and estimated with the ground-level receptors were negligible.
a) POLA and POLB A coarse 50 km x 40 km Cartesian grid with a grid spacing of 500 m was placed around POLA and POLB. This evaluation indicated that higher off-site potential cancer risks were located adjacent to the ports. Therefore, to better define concentrations in these areas, fine and medium grids were nested within the coarse grid. The fine and medium grid spacing were 50 m and 200 m, respectively (see Figure 8).
Figure 8. Modeling Setup for POLA and POLB
Preliminary Health Analyses
23
b) Richmond Complex A coarse 30 km x 30 km Cartesian grid with a grid spacing of 500 m was centered at the Richmond Complex. Initial screening analyses indicated that higher off-site potential cancer risks were located adjacent to the ports. To better define concentrations in those areas, fine and medium grids were nested within the coarse grid. The fine and medium grid spacing were 50 m and 100 m, respectively (see Figure 9).
Figure 9. Modeling Setup for the Richmond Complex
5. Model Inputs AERMOD requires four types of inputs: control, source, meteorological, and receptor. Control inputs are required to specify the global model options for the model run. The control options include dispersion coefficients, averaging time, terrain, and receptor elevations. The regulatory default options were selected for these HRAs. Source inputs require source identification and source type (e.g., point, area, volume, or open pit). Each source type requires specific parameters to define the source. For example, the required inputs for a point source are emission rate, release height, exhaust exit temperature, exhaust exit velocity, and stack diameter.
Preliminary Health Analyses
24
The requirements for meteorological and receptor inputs have been discussed in the Meteorological Data and Model Domain and Receptors Network Section. Table 7 lists the modeling input parameters used in AERMOD. These parameters are based on hoteling of ocean-going vessels from the Diesel Particulate Matter Exposure Assessment Study for the Ports of Los Angeles and Long Beach (CARB, 2006a).
Table 7. Modeling Input Parameters and Description
Modeling Parameters Values or Description
Model Used AERMOD (Version 18081)
Control Options Regulatory Defaults
Source Type Point
Urban Population 9,818,605 for POLA and POLB (Richmond was run as rural)
Meteorological Data
• SODS (2011, 2012, 2013, 2015 and 2017 ) for POLA and POLB
• Point San Pablo Station (2010-2014) and Chevron Met Station (2009-2013) for the Richmond Complex
Receptor Flagpole Height 0 m
Stack Parameters -
Stack Diameter 0.5 m
Stack Height 43 m
Stack Exhaust Temperature 618 K
Stack Exhaust Flow Rate 16 m/s
Stack Emission Rate
1 gram/second (g/s) (The modeled concentrations are later scaled with the Existing Rule and with Concept years emissions.)
Time Emission Emitted 24 hours per day, 365 days per year
Preliminary Health Analyses
25
D. Risk Exposure Scenarios To analyze the health impacts from the Concept and the existing rule, staff evaluated the MEIR, maximum exposed individual worker (MEIW), population-wide cancer risks, and noncancer chronic risks. Staff calculated the health impacts using the methodology consistent with the Guidance Manual. Since the Concept contains multiple implementation dates, the health impacts were also evaluated for years 2021, 2023, 2025, and 2031. The description of the exposure scenarios and assumptions are presented below.
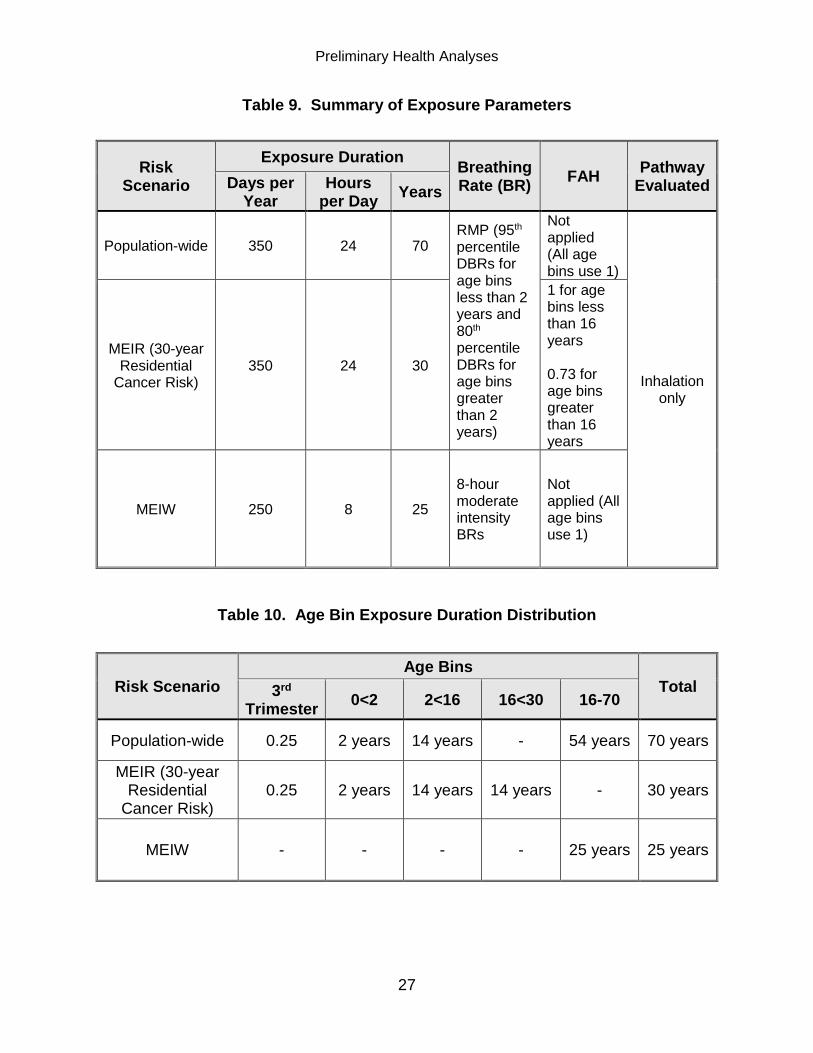
1. Exposure Scenarios for Inhalation Cancer Risk The Guidance Manual provides a description of the risk algorithms, recommended exposure variates, and health values for calculating cancer risk. Cancer risk is calculated by converting an annual average concentration to a dose and then comparing it to a pollutant specific health value. Cancer risk is calculated by age bins (i.e., third trimester, 0<2, 2<9, 2<16, 16<30, and 16-70) and then summed for the exposure duration of interest (e.g., 30 years) to yield a total cancer risk. The bins allow age-specific exposure variates to be applied. Exposure variates include breathing rates, age sensitive factors, fraction of time at home (FAH), and exposure duration. For example, age sensitivity factors will multiply the risk by a factor of 10 for age bins less than two and use a factor of three for age bins between two and 16. For this HRA, staff compared modeling results from the air dispersion analysis to the diesel PM inhalation CPF of 1.1 mg/kg-day-1. In addition, staff also applied the CARB and the California Air Pollution Control Officers Association (CAPCOA) risk management policy (RMP) for inhalation-based cancer risk assessment (RMP, 2015). The policy recommends using a combination of the 95th percentile and 80th percentile daily breathing rates (DBR) as the minimum exposure inputs for risk management decisions. Specifically, the policy recommends using the 95th percentile breathing rates for age bins less than two years old and the 80th percentile breathing rates for age bins greater than or equal to two years old. This policy was used for calculating the MEIR and population wide risks. Table 8 provides a description of the exposure scenarios used in the HRA. Tables 9 and 10 summarize the exposure assumptions for each scenario.
Preliminary Health Analyses
26
Table 8. Exposure Scenario Descriptions
Risk Scenario Descriptions
Population-wide
A population-wide risk scenario estimates the number of individuals that are exposed to various risk levels within a geographic area. Population-wide risk uses a 70-year exposure duration with no other exposure adjustments (i.e., FAH is not applied). To determine the number of people within a given area, staff used census block population data to apply to the risk levels. The data are based on the 2010 U.S. Census.
MEIR
Maximum Exposed Individual Resident - The MEIR represents the highest cancer risk to an individual residential receptor. The MEIR uses a 30-year exposure duration with the FAH of 0.73 applied to age bins greater than 16 years.
MEIW
Maximum Exposed Individual Worker - The MEIW represents the highest cancer risk to an off-site worker. For the purposes of this HRA, only workers who operate off-port or outside the port area will be evaluated. The worker exposure duration is assumed to be 25 years, 8 hours per day, and 250 day per year. Since the emission sources are continuously emitted, no adjustment factor will be applied to the annual concentration. In addition, the Guidance Manual recommends an 8-hour breathing rate for moderate intensity.
Preliminary Health Analyses
27
Table 9. Summary of Exposure Parameters
Table 10. Age Bin Exposure Duration Distribution
Risk Scenario
Exposure Duration Breathing Rate (BR) FAH Pathway
Evaluated Days per Year
Hours per Day Years
Population-wide 350 24 70 RMP (95th percentile DBRs for age bins less than 2 years and 80th percentile DBRs for age bins greater than 2 years)
Not applied (All age bins use 1)
Inhalation only
MEIR (30-year Residential
Cancer Risk) 350 24 30
1 for age bins less than 16 years 0.73 for age bins greater than 16 years
MEIW 250 8 25
8-hour moderate intensity BRs
Not applied (All age bins use 1)
Risk Scenario Age Bins
Total 3rd Trimester 0<2 2<16 16<30 16-70
Population-wide 0.25 2 years 14 years - 54 years 70 years
MEIR (30-year Residential
Cancer Risk) 0.25 2 years 14 years 14 years - 30 years
MEIW - - - - 25 years 25 years
Preliminary Health Analyses
28
2. Exposure Scenarios for Noncancer Chronic Risk The chronic health hazard index is calculated by dividing annual average diesel PM concentration by the diesel PM inhalation chronic REL. If the hazard index yields a value above one, this may indicate a potential health impact and requires further evaluation. The diesel PM inhalation chronic REL presented in the Guidance Manual is 5 μg/m3 with one target organ identified as respiratory.
E. Summary of HRA Results
1. POLA and POLB
a) Population-wide Potential Cancer Risk For POLA and POLB, CARB staff evaluated the potential population-wide cancer risk to the surrounding communities under the existing regulation and the Concept. Figures 10 through 14 present the predicted cancer risk isopleths for diesel PM emissions from ocean-going vessels operating at berth. Isopleths are lines that connect points that have the same risk value. In Figures 10 through 14, dotted lines show the existing rule cancer risk isopleths and solid lines display the Concept cancer risk isopleths. These figures also show how the risk isopleths would be reduced as the Concept is implemented. In addition, the figures display the locations of the MEIR and MEIW for informational purposes. The population impacted within each risk isopleth is shown in Tables 11 and 12. Figure 10 below shows the risk isopleth for 2016 with the existing rule. This risk isopleth is considered the baseline and does not account for any risk reduction from the Concept. This is because the Concept control requirements would begin in 2021.
Preliminary Health Analyses
29
Figure 10. 2016 Impacts of Vessels At Berth for Existing Rule – POLA and POLB Potential Cancer Risk Isopleths
(chances per million)1
1. Assumes exposure duration of 70 years; FAH equals 1.
Preliminary Health Analyses
30
Figure 11 below shows risk isopleths for both the existing rule and the Concept in 2021. This figure shows that with implementation of the Concept in 2021, the risk isopleths would become smaller (as compared to the 2021 existing rule) and the 50 chances per million risk isopleth would be eliminated. This risk reduction is a result of emissions control requirements for container, cruise, and reefer vessels.
Figure 11. 2021 Impacts of Vessels At Berth for Existing Rule and Concept – POLA and POLB Potential Cancer Risk Isopleths
(chances per million)1
1. Assumes exposure duration of 70 years; FAH equals 1.
Preliminary Health Analyses
31
Figure 12 below shows risk isopleths for both the existing rule and the Concept in 2023. This figure shows that risk isopleths would stay relatively the same as compared with the 2021 Concept. This is because there are no additional control requirements between 2021 and 2023.
Figure 12. 2023 Impacts of Vessels At Berth for Existing Rule and Concept – POLA and POLB Potential Cancer Risk Isopleths
(chances per million)1
1. Assumes exposure duration of 70 years; FAH equals 1.
Preliminary Health Analyses
32
Figure 13 below shows risk isopleths for both the existing rule and the Concept in 2025. This figure shows that by implementing the 2025 Concept, risk isopleths would continue to shrink (as compared to the 2031 existing rule). This risk reduction reflects the implementation of the 2025 Concept requirements, where emissions from Ro-Ro vessels are reduced by at least 80 percent and emissions from tanker vessels are reduced by at least 50 percent.
Figure 13. 2025 Impacts of Vessels At Berth for Existing Rule and Concept – POLA and POLB Potential Cancer Risk Isopleths
(chances per million)1
1. Assumes exposure duration of 70 years; FAH equals 1.
Preliminary Health Analyses
33
Figure 14 below shows risk isopleths for both the existing rule and the Concept in 2031. This figure shows that by implementing the 2031 Concept, risk isopleths would continue to shrink (as compared to the 2031 existing rule). The 30 chances per million risk isopleth would be eliminated in 2031. This risk reduction reflects the implementation of the 2031 Concept requirements, where emissions from tanker vessels are reduced by at least 80 percent. The similarity between the 2025 cancer risk isopleth and the 2031 cancer risk isopleth suggests that the additional controls implemented in 2031 would be offset by growth in cargo activity.
Figure 14. 2031 Impacts from Vessels At Berth for Existing Rule and Concept – POLA and POLB Potential Cancer Risk Isopleths
(chances per million)1
1. Assumes exposure duration of 70 years; FAH equals 1.
Preliminary Health Analyses
34
Using the U.S. Census Bureau’s data from the 2010 census, CARB staff estimated the population within the isopleth boundaries. Table 11 shows the estimated affected general population that fall within the potential cancer risk ranges of greater than five chances per million, 10 chances per million, 20 chances per million, 30 chances per million, and 50 chances per million. A similar presentation is provided in Table 12 showing the population affected in the disadvantaged communities26 within the modeling domain.
26 As defined by the 25 percent highest scoring census tracts in CalEnviroScreen3.0
Preliminary Health Analyses
35
Table 11. Estimated Population Impacts by Potential Cancer Risk Level at POLA and POLB1
>50 18,200 18,000 0 24,700 0 26,200 0 45,600 0 >30 133,100 138,000 29,800 160,100 37,500 159,100 200 204,300 0 >20 275,500 278,800 119,400 294,300 131,800 293,100 47,000 318,200 39,200 >10 512,400 519,400 328,800 572,000 337,900 564,600 263,700 672,900 256,800 >5 1,605,600 1,619,200 709,500 1,728,700 767,700 1,726,200 479,200 1,999,800 460,000 1. Population numbers have been rounded. Population-wide cancer risk estimates are based on a 70-year exposure duration with 95th/80th
percentile DBR RMP method. FAH equals 1 for all age bins. 2. Risk levels are presented in chances per million.
Preliminary Health Analyses
36
As shown in Tables 11 and 12, the Concept would be effective at reducing the number of people exposed to each risk level. In addition, as the Concept is implemented, potential cancer risk levels of greater than 50 chances per million would be eliminated beginning in 2021, and the greater than 30 chances per million risk level would be eliminated beginning in 2031. Overall, at POLA and POLB in 2031, when comparing the existing rule to full implementation of the Concept, more than 2.4 million people would have their potential cancer risk reduced, of which about 1.5 million live in disadvantaged communities.
b) Potential cancer risk for MEIR and MEIW The Concept would provide significant risk reductions by reducing the potential cancer risk to the MEIR and MEIW. Table 13 and Figure 15 below show the MEIR potential cancer risk by vessel type for both the existing rule and with the three implementation years of the Concept. Staff also included 2023 for informational purposes since that date is associated with the State Implementation Plan for the South Coast Air Basin. The table and figure show that with full implementation of the Concept, potential cancer risk would be significantly reduced.
Table 13. POLA and POLB At Berth MEIR Cancer Risks (chances per million)1,2
Total 53 52 34 54 35 56 25 62 24 1. MEIR cancer risk estimates are based on a 30-year exposure duration of individual resident cancer
risk with 95th/80th percentile DBR RMP method. FAH equals 1 for age bins <16 years, and FAH equals 0.73 for age bin 16-70 years. Fine grid receptor spacing is 50 m. Coarse grid receptor spacing is 200 m and 500 m.
2. Bulk and general cargo vessels not subject to control requirements in the Concept.
Preliminary Health Analyses
37
Figure 15. POLA and POLB At Berth MEIR Cancer Risk1,2,3
1. MEIR cancer risk estimates are based on a 30-year exposure duration of individual resident cancer
risk with 95th/80th percentile DBR RMP method. FAH equals 1 for age bins <16 years and 0.73 for age bin 16-70 years. Fine grid receptor spacing is 50 m. Coarse grid receptor spacing is 200 m and 500 m.
2. Cancer risk reductions for cruise, container, and reefer between 2016 and 2021 are due to control requirements in the existing rule.
3. Bulk and general cargo vessels not subject to control requirements in the Concept.
The total potential cancer risk to the MEIR decreases throughout the three implementation years of the Concept. For 2021, compared to the existing rule, the MEIR potential cancer risk would be reduced by approximately 35 percent, from 52 chances per million to 34 chances per million. For 2025, compared to the existing rule, the potential cancer risk would be reduced approximately 55 percent, from 56 chances per million to 25 chances per million. In 2031 at full implementation, compared to the existing rule, the MEIR potential cancer risk would be reduced approximately 61 percent, from 62 chances per million to 24 chances per million. Without the Concept, the potential cancer risk to the MEIR would increase approximately 17 percent, from approximately 53 chances per million to 62 chances per
0.0
10.0
20.0
30.0
40.0
50.0
60.0
70.0
Estim
ated
Can
cer R
isk
(cha
nces
per
mill
ion)
Reefer
General
Bulk
RoRo
Cruise
Tanker
Container
Preliminary Health Analyses
38
million between 2016 and 2031. This demonstrates that without the Concept potential cancer risk would increase due to growth in cargo activity. For the existing rule, in 2016, container and tanker vessels account for the greatest contribution of overall MEIR potential cancer risk, accounting for approximately 53 percent and 26 percent of the MEIR total risk, respectively. In 2031, with the existing rule, container and tanker vessels would still account for the greatest contribution of overall MEIR potential cancer risk, accounting for approximately 47 percent and 26 percent of the MEIR total risk, respectively. Under the Concept in 2021 and 2023, tanker vessels would become the largest contributor to the overall MEIR potential cancer risk. This is because tanker vessels would be controlled beginning in 2025 while container, cruise, and reefer vessels would be controlled beginning in 2021. In 2025 and 2031, tanker vessels would become controlled, thus reducing their contribution to the overall MEIR risk in those timeframes. Table 14 shows the potential cancer risk at the MEIW. The MEIW is defined as the maximum exposed individual (off-site) worker located outside of the port boundary. More information on the MEIW analysis and assumptions can be found in Section III.D - Risk Exposure Scenarios. Table 14. POLA and POLB At Berth MEIW Cancer Risks (chances per million)1,2,3
Total 4.5 4.5 3.0 4.7 3.1 4.7 2.2 5.4 2.1 1. Worker cancer risk estimates are based on a 25-year exposure duration with 95th percentile 8-hour
DBR of moderate intensity activities. All numbers are rounded. 2. Cancer risk reductions for cruise, container, and reefer between 2016 and 2021 are due to control
requirements in the existing rule. 3. Bulk and general cargo vessels not subject to control requirements in the Concept.
Preliminary Health Analyses
39
Overall, in 2031 with full implementation of the Concept, the MEIW potential cancer risk would be reduced approximately 60 percent, from about five chances per million to two chances per million. Between 2021 and 2023, with the Concept there would be a slight increase in MEIW risk due to growth in vessel activity. However, in 2025 and 2031 with additional controls implemented, the MEIW potential cancer risk would be reduced.
2. Richmond Complex
a) Population-wide Potential Cancer Risk For the Richmond Complex, CARB staff evaluated the potential population-wide cancer risk to the surrounding communities under the existing rule and the Concept. Figures 16 through 18 present the predicted cancer risk isopleths for diesel PM emissions from vessels operating at berth. Isopleths are lines that connect points that have the same risk value. In Figures 16 through 18, dotted lines show the existing rule cancer risk isopleths and the solid lines display the Concept cancer risk isopleths. These figures show how the risk isopleths would be reduced as the Concept is implemented beginning in 2025. In addition, the figures display the locations of the MEIR and MEIW for informational purposes. The population impacted within each risk isopleth is shown later in this section in Tables 15 and 16. Figure 16 below shows the risk isopleth for the impacts in 2016 under the existing rule. This risk isopleth is considered the baseline and does not account for any risk reduction from the Concept. This is because control requirements for the vessel types that visit the Richmond Complex begin in 2025.
Preliminary Health Analyses
40
Figure 16. 2016 Impacts from Vessels At Berth for Existing Rule – Richmond Complex Potential Cancer Risk Isopleths
(chances per million)1
1. Assumes exposure duration of 70 years; FAH equals 1.
Preliminary Health Analyses
41
Figure 17 shows the risk isopleth for both the existing rule and Concept in 2025. The isopleth for the existing rule would continue to expand if the Concept was not implemented. Under the existing rule, the highest risk isopleth is 30 chances per million. With the Concept, the isopleth becomes smaller and the 20 chances per million isopleth and 30 chances per million isopleths would be eliminated. This is due to the emissions control requirement for vessel types that visit the Richmond Complex beginning in 2025.
Figure 17. 2025 Impacts from Vessels At Berth for Existing Rule and Concept – Richmond Complex Potential Cancer Risk Isopleths
(chances per million)1
1. Assumes exposure duration of 70 years; FAH equals 1.
Preliminary Health Analyses
42
Figure 18 shows the risk isopleth for both the existing rule and Concept in 2031. The isopleth for the existing rule would continue to expand if the Concept was not implemented. Under the existing rule, the highest risk isopleth is 30 chances per million. With the Concept, the isopleth becomes smaller and the 20 chances per million and 30 chances per million isopleths would be eliminated. This is due to the emissions control requirement for vessel types that visit the Richmond Complex.
Figure 18. 2031 Impacts from Vessels At Berth for Existing Rule and Concept – Richmond Complex Potential Cancer Risk Isopleths
(chances per million)1
1. Assumes exposure duration of 70 years; FAH equals 1.
Using the 2010 U.S. Census Bureau’s census data, CARB staff estimated the population within the isopleth boundaries. Table 15 shows the estimated affected general population that fall within the potential cancer risk ranges of greater than five chances per million, 10 chances per million, and 20 chances per million. No population is affected at greater than 30 chances per million and 50 chances per million. A similar presentation is provided in Table 16 showing the population affected in disadvantaged communities within the modeling domain.
Preliminary Health Analyses
43
Table 15. Estimated Population Impacts by Potential Cancer Risk Levels at the Richmond Complex1,2
>5 18,050 19,050 19,720 20,540 1,728 24,740 0 1. Population numbers have been rounded. Population-wide cancer risk estimates are based on a
70-year exposure duration with 95th/80th percentile DBR, RMP method. FAH equals 1 for all age bins. All numbers are rounded.
2. Risk levels are presented in chances per million. As shown in Tables 15 and 16, the Concept would provide significant benefits by reducing the number of people exposed to each impacted risk level. In addition, by full implementation of the Concept in 2031, potential cancer risk levels of greater than 20 chances per million would be eliminated. Potential cancer risk levels greater than 10 chances per million and five chances per million would be eliminated in
Preliminary Health Analyses
44
disadvantaged communities. Overall, at Richmond Complex in 2031, when comparing the existing rule to full implementation of the Concept, more than 35,000 people would have their potential cancer risk reduced, of which about 24,000 live in disadvantaged communities.
b) Potential Cancer Risk for MEIR and MEIW As shown in Tables 17 and 18, the Concept would provide significant risk reductions by reducing the potential cancer risk to the MEIR and MEIW. Table 17 and Figure 19 below show the MEIR potential cancer risk by vessel type for both the existing rule and with the two implementation years for the Concept. The table shows that with full implementation of the Concept potential cancer risk would be significantly reduced. In 2025, compared to the existing rule, the MEIR would be reduced about 50 percent, from 20 chances per million to 10 chances per million. In 2031 with full implementation, the MEIR would be reduced by about 68 percent, from 22 chances per million to seven chances per million. Without the Concept, the potential cancer risk to the MEIR would increase approximately 16 percent between 2016 and 2031, from approximately 19 chances per million to 22 chances per million. This demonstrates that without the Concept potential cancer risk would increase due to growth in cargo activity. Figure 19 graphically demonstrates the contribution of each vessel type to the total MEIR potential cancer risk for the existing rule and the Concept. In all scenarios, tanker vessels account for largest contribution to the MEIR.
Table 17. Richmond Complex At Berth MEIR Cancer Risks (chances per million)1,2
Total 19 19 19 20 10 22 7 1. MEIR cancer risk estimates are based on a 30-year exposure duration of individual resident cancer
risk with 95th/80th percentile DBR RMP method. FAH equals 1 for age bins <16 years and 0.73 for age bin 16-70 years. All numbers are rounded.
2. Bulk vessels not subject to control requirements in the Concept.
Preliminary Health Analyses
45
Figure 19. Richmond Complex At Berth MEIR Cancer Risk1,2
1. MEIR cancer risk estimates are based on a 30-year exposure duration of individual resident cancer
risk with 95th/80th percentile DBR RMP method. FAH equals 1 for age bins <16 and 0.73 for age bin 16-70.
2. Bulk vessels not subject to control requirements in the Concept.
0.0
5.0
10.0
15.0
20.0
25.0
2016Existing
2021Existing
2023Existing
2025Existing
2025Concept
2031Existing
2031Concept
Estim
ated
Can
cer R
isk
(cha
nces
per
mill
ion)
Bulk
Ro-Ro
Tanker
Preliminary Health Analyses
46
Table 18 shows the potential cancer risk at the MEIW. The MEIW is defined as the maximum exposed (off-site) individual worker located outside the port boundary. The MEIW potential cancer risk would be reduced over 66 percent, from about three chances per million in 2016 to less than one chance per million in 2031. In 2031 with full implementation of the Concept, the MEIW potential cancer risk would be reduced over 75 percent, from about four chances per million to less than one chance per million.
Table 18. Richmond Complex At Berth MEIW Cancer Risks
Total 3 3 3 3 2 4 <1 1. Worker cancer risk estimates are based on a 25-year exposure duration with 95th percentile 8-hour
DBR of moderate intensity activities. All numbers are rounded. 2. Bulk vessels not subject to control requirements in the Concept.
3. Noncancer Chronic Health Impacts CARB staff evaluated the noncancer chronic hazard index (HI) of the diesel PM modeled concentrations in the communities surrounding the three ports. The HI is a ratio of annual average concentrations of diesel PM to the chronic inhalation REL. OEHHA has adopted a chronic REL of 5 μg/m3. CARB staff used the highest modeled annual average concentration at POLA/POLB and the Richmond Complex, and determined the HI at the MEIR was 0.02 and 0.006, respectively. Generally, a hazard index below one indicates that adverse chronic health impacts are not expected. Although the HI from diesel PM is below one, additional chronic health impacts may be associated with secondary formation of pollutants from diesel engines. For example, NOx emissions from diesel engines can undergo chemical reactions in the atmosphere leading to the formation of PM2.5 and ozone.
F. Uncertainty Associated with the HRA Analysis HRA is a complex procedure which requires the integration of many variables and assumptions. The estimated diesel PM concentrations and potential health risks produced by a risk assessment are based on several assumptions, many of which are
Preliminary Health Analyses
47
designed to be health protective so that potential risks to individuals are not underestimated.
1. Uncertainty Associated with Health Values The toxicity of toxic air contaminants is often established by available epidemiological studies, or use of data from animal studies where data from humans are not available. The diesel PM CPF is based on long-term studies of railyard workers exposed to diesel exhaust in concentrations approximately ten times greater than typical ambient exposures. The differences within human populations usually cannot be easily quantified and incorporated into risk assessments. Factors including metabolism, target site sensitivity, diet, immunological responses, and genetics may influence the response to toxicants. Human exposures to diesel PM are often based on limited availability of data and are mostly derived based on estimates of emissions and duration of exposure. Different epidemiological studies also suggest somewhat different levels of risk. When the Scientific Review Panel (SRP) identified diesel PM as a toxic air contaminant (CARB, 1998a), the panel members endorsed a range of inhalation CPF (1.3 x 10⁻⁴ to 2.4 x 10³ (μg/m3)-1) and a risk factor of 3x10⁻⁴ (μg/m3)-1, as a reasonable estimate of the unit risk. From the unit risk factor an inhalation CPF of 1.1 (mg/kg-day)-1 was calculated by OEHHA, which is used in this HRA. There are many epidemiological studies that support the finding that diesel exhaust exposure elevates relative risk for lung cancer. However, the quantification of each uncertainty applied in the estimate of cancer potency is very difficult and can be itself uncertain.
2. Uncertainty Associated with Air Dispersion Models As mentioned previously, there is no direct measurement technique to measure diesel PM in ambient air (e.g., ambient air monitoring). This analysis used air dispersion modeling to estimate the concentrations to which the public is exposed. While air dispersion models are based on state-of-the-art formulations using the best science, uncertainties are associated with the models. The air dispersion model predictions have been improved over the years because of better representations in the model structure. In 2006, the U.S. EPA modeling guidance adopted AERMOD as the preferred model for near-field dispersion of emissions for distances up to 50 km. Many updated formulations have been incorporated into the model structure for better predictions from the air dispersion process. The primary purposes of this HRA analysis are to prioritize emission vessel categories for regulation and to quantify the improvement in health impacts that would result from the Concept. The U.S. EPA preferred air dispersion model, AERMOD, was selected for use in this HRA.
Preliminary Health Analyses
48
3. Uncertainty Associated with the Model Inputs The model inputs include emission rates, modeling source parameters, meteorological conditions, and dispersion coefficients. Each of the model inputs has uncertainty associated with it. Among these inputs, emission rates and meteorological conditions have the greatest effect on modeling results. The emission rate for each source was estimated from the emission inventory. The emission inventory has several sources of uncertainty including: emission factors, equipment population and age, equipment activity, load factors, and fuel type and quality. The uncertainties in the emission inventory can lead to over predictions or under predictions in the modeling results. CARB staff estimated at berth vessel emissions based on the best available information regarding past, current, and projected future at berth activities. The modeling source parameters also have several sources of uncertainty including: stack height, stack temperature, stack exit velocity, and building downwash parameters. These parameters vary from vessel to vessel. To be consistent with other HRA analyses for modeling at berth emissions, the source parameters used in this HRA are based on the modeling parameters for hoteling from the Diesel Particulate Matter Exposure Assessment Study for the Ports of Los Angeles and Long Beach (CARB, 2006).
Preliminary Health Analyses
49
IV. REGIONAL PM2.5 MORTALITY AND ILLNESS ANALYSIS FOR CALIFORNIA AIR BASINS
This section describes the summary of findings regarding PM mortality and illness impacts that include premature death from cardiopulmonary disease, hospital admissions, and emergency room visits.
A. PM Mortality and Illness Overview The Concept would reduce NOx and PM2.5 emissions from ocean-going vessels operating at berth, resulting in health benefits for individuals in California. NOx includes nitrogen dioxide, a potent lung irritant, but its most serious impact on human health comes about when atmospheric processes convert NOx to fine particles of ammonium nitrate. PM2.5 formed in this manner is termed secondary PM2.5 to distinguish it from primary PM2.5, which is emitted directly from a source, such as soot from engine exhaust. Fine particles are a major driver of health impacts of air pollution in California (CARB, 2010a). California experiences some of the highest concentrations of PM2.5 in the nation (U.S. EPA, 2013). The majority of California’s population lives in areas that exceed the National Ambient Air Quality Standard for PM2.5 (CARB, 2013a; CARB, 2013b). This standard is set by U.S. EPA and is designed to protect human health and the environment from exposure to harmful levels of PM2.5. As part of the standard setting process, U.S. EPA assesses scientific studies that link exposure to PM2.5 to health effects, including hospitalization due to respiratory illness, and premature death from cardiopulmonary disease (U.S. EPA, 2009). U.S. EPA has determined that both long-term and short-term exposure to PM2.5 plays a “causal” role in premature death, meaning that a substantial body of scientific evidence shows a relationship between PM2.5 exposure and increased mortality, a relationship that persists when other risk factors such as smoking rates and socioeconomic factors are taken into account (U.S. EPA, 2009). These effects are also evidenced by a number of studies that have linked daily exposure to PM2.5 with hospitalization for heart and lung related causes, as well as an increase in emergency room visits, exacerbation of asthma, and other respiratory diseases (U.S. EPA, 2009). Although epidemiological evidence supports a link between PM2.5 and other non-fatal health outcomes such as heart attacks, asthma symptoms, bronchitis, and lost work days (U.S. EPA, 2011), CARB staff’s analysis is limited to those health effects for which there is best support for a quantitative relationship. To estimate the health benefits from emission reductions from the Concept, CARB staff used two related methodologies. Direct modeling was used to estimate health impacts from emission reductions for the Concept in the South Coast Air Basin, and the incidents-per-ton methodology (IPT) was used to estimate impacts from emission reductions for alternative scenarios and other air basins where modeled PM2.5
Preliminary Health Analyses
50
concentrations are not available. The two methodologies are described in more detail below.
1. Direct Modeling Approach A direct modeling approach was used to estimate the health impacts in the South Coast Air Basin. To estimate the health impacts, CARB staff estimated the changes in primary PM2.5 concentrations that would result from the Concept using the same air dispersion modeling analysis as described in Section III.C - Air Dispersion Modeling. Using a methodology developed by U.S. EPA (U.S. EPA, 2017a), CARB staff estimated the impacts in each modeled grid cell from the air dispersion analysis and then aggregated the results over the South Coast Air Basin. Several assumptions were used in our estimation. CARB staff assumed the model-predicted exposure estimates could be applied to the entire population within each modeling grid. That is, the entire population within each modeling grid was assumed to be exposed uniformly to modeled concentrations. This assumption is typical of this type of estimation. Additionally, CARB staff assumed the baseline incidence rates were uniform across each county. This assumption is consistent with methods used by U.S. EPA for its regulatory impact assessments. The incidence rates match those used by U.S. EPA.
2. Incidents-Per-Ton Methodology For the proposed scenario in air basins other than the South Coast, the IPT methodology was used to estimate health impacts of the Concept. It is similar in concept to the methodology developed by U.S. EPA for similar estimations (Fann et al., 2009), but uses California air basin specific relationships between emission and air quality. The basis of the IPT methodology is the approximately linear relationship which holds between changes in emissions and estimated changes in health outcomes. In this methodology, the number of incidents is estimated by multiplying emissions by a scaling factor called an IPT factor. The IPT factor is derived by calculating the number of incidents (premature deaths from heart and lung diseases, hospitalizations, emergency room visits) associated with exposure to PM2.5 from a specific source, using concentration-response functions, described above, and dividing by the emissions of that PM2.5 source. The IPT factors used for primary and secondary PM2.5 in this assessment were originally developed for use with diesel PM emissions from on-road diesel vehicles. In addition to primary PM, ship engines emit NOx, a precursor to secondary ammonium nitrate PM that forms in the atmosphere. For secondary ammonium nitrate PM, the health impacts resulting from the three-year average concentration were calculated and then associated with the basin-specific NOx emissions. Primary PM2.5 from ships at berth is assumed to be equally potent as diesel particulate, on a mass basis, in causing health impacts associated with heart and lung diseases.
Preliminary Health Analyses
51
However, pollutants from vessels at berth are emitted tens of meters above ground and 1 km or more from residential neighborhoods, and are attenuated by loss and dispersion before reaching places where people live. To account for this, the IPT factors for primary PM2.5 were reduced by multiplying them by an attenuation factor. To find the attenuation factor, the more accurate direct modeling estimates were compared with IPT estimates for the South Coast Air Basin. This comparison showed the direct modeling estimates to be approximately one-third as high as the IPT estimates. Therefore, IPT estimates for other air basins were multiplied by an attenuation factor of one-third. This factor is specific to the meteorology and spatial distribution of sources and receptors in the vicinity of POLA and POLB, so estimates for other air basins are only approximate. The actual concentrations and impacts could be higher. IPT results for NOx were not multiplied by an attenuation factor because ammonium nitrate forms downwind from the source. Hence, NOx emissions are assumed to produce health impacts over a wide area extending several kilometers from the source.
B. PM Mortality and Illness: Reduction in Health Outcomes CARB staff estimated the reduction in health outcomes from reduced emissions of PM2.5 from the Concept. These health outcomes include cardiopulmonary mortality, hospital admissions, and emergency room visits. Based on the analysis, staff estimates that the total number of cases statewide that would be reduced due to the implementation of the Concept are as follows:
Tables 19 through 21 show the estimated reductions in health outcomes resulting from the Concept summed over an 11 years period from 2021 to 2032. The values in parenthesis represent the 95th percentile confidence interval for each health outcome.
Preliminary Health Analyses
52
Table 19. Draft Regulatory Concept: Reductions in Health Outcomes from PM2.5
Air Basin Cardiopulmonary Mortality
Hospital Admissions
Emergency Room visits
North Coast 0 (0 - 0) 0 (0 - 0) 0 (0 - 0) Sacramento Valley 0 (0 - 0) 0 (0 - 0) 0 (0 - 0) San Diego County 1 (1 - 1) 0 (0 - 0) 0 (0 - 0) San Francisco Bay 4 (3 - 5) 1 (0 - 2) 2 (1 - 3) San Joaquin Valley 0 (0 - 0) 0 (0 - 0) 0 (0 - 0) South Central Coast 0 (0 - 0) 0 (0 - 0) 0 (0 - 0) South Coast* 15 (11 - 18) 4 (1 - 7) 8 (5 - 11) Total 20 (15 - 24) 5 (1 - 9) 10 (6 - 14)
Table 20. Draft Regulatory Concept: Reductions in Health Outcomes from NOx
Air Basin Cardiopulmonary Mortality
Hospital Admissions
Emergency Room Visits
North Coast 0 (0 - 0) 0 (0 - 0) 0 (0 - 0) Sacramento Valley 0 (0 - 0) 0 (0 - 0) 0 (0 - 0) San Diego County 4 (3 - 5) 1 (0 - 1) 2 (1 - 2) San Francisco Bay 33 (26 - 40) 6 (1 - 14) 14 (9 - 20) San Joaquin Valley 1 (1 - 1) 0 (0 - 0) 0 (0 - 0) South Central Coast 1 (1 - 1) 0 (0 - 0) 0 (0 - 0) South Coast 103 (81 - 125) 15 (2 - 35) 44 (28 - 62) Total 141 (110 - 172) 22 (3 - 50) 60 (39 - 83)
Table 21. Draft Regulatory Concept: Total Reductions in Health Outcomes1
Air Basin Cardiopulmonary Mortality
Hospital Admissions
Emergency Room Visits
North Coast 0 (0 - 0) 0 (0 - 0) 0 (0 - 0) Sacramento Valley 0 (0 - 0) 0 (0 - 0) 0 (0 - 0) San Diego County 5 (4 - 6) 1 (0 - 2) 2 (1 - 3) San Francisco Bay 37 (29 - 45) 7 (1 - 15) 16 (10 - 22) San Joaquin Valley 1 (1 - 1) 0 (0 - 0) 0 (0 - 0) South Central Coast 1 (1 - 1) 0 (0 - 0) 0 (0 - 1) South Coast1 117 (92 - 143) 19 (2 - 42) 52 (33 - 72) Total 161 (126 - 196) 27 (3 - 59) 70 (45 - 97)
1. Diesel PM estimates for the South Coast Air Basin were obtained by direct modeling. Other estimates were obtained using ITP factors.
Preliminary Health Analyses
53
Aside from its role in the formation of secondary PM2.5, NOx is also a precursor to the formation of ozone, However, when the valuations for NOx and PM2.5 are monetized, the monetary impacts of PM2.5 tend to overwhelm the ozone valuations, relative to NOx. As a result, this analysis only monetizes the value of reductions in PM2.5. In accordance with U.S. EPA practice, health outcomes were monetized by multiplying incidence by a standard value derived from economic studies.27 The valuation per incident is provided in Table 22. The valuation for avoided premature mortality is based on willingness to pay.28 This value is a statistical construct based on the aggregated dollar amount that a large group of people would be willing to pay for a reduction in their individual risks of dying in a year. This is not an estimate of how much any single individual would be willing to pay to prevent a certain death of any particular person,29 nor does it consider any specific costs associated with mortality such as hospital expenditures. Unlike premature mortality valuation, the valuation for avoided hospitalizations and emergency room visits is based on a combination of typical costs associated with hospitalization and the willingness of surveyed individuals to pay to avoid adverse outcomes that occur when hospitalized. These include hospital charges, post-hospitalization medical care, out-of-pocket expenses, and lost earnings for both individuals and family members, lost recreation value, and lost household protection (e.g., valuation of time-losses from inability to maintain the household or provide childcare).30
Table 22. Valuation per Incident Avoided Health Outcomes
Outcome Value per Incident Avoided Premature Deaths $8,793,190 Avoided Acute Respiratory Hospitalizations $52,826 Avoided Cardiovascular Hospitalizations $46,078 Avoided ER Department Visits $756
27 National Center for Environmental Economics et al., Appendix B: Mortality Risk Valuation Estimates, Guidelines for Preparing Economic Analyses (EPA 240-R-10-001, Dec. 2010) available at https://www.epa.gov/sites/production/files/2017-09/documents/ee-0568-22.pdf. 28 United States Environmental Protection Agency Science Advisory Board (U.S. EPA-SAB), An SAB Report on EPA’s White Paper Valuing the Benefits of Fatal Cancer Risk Reduction (EPA-SAB-EEAC-00-013, July 2000), available at http://yosemite.epa.gov/sab%5CSABPRODUCT.NSF/41334524148BCCD6852571A700516498/$File/eeacf013.pdf. 29 United States Environmental Protection Agency, Mortality Risk Valuation – What does it mean the place a value on a life?, available at https://www.epa.gov/environmental-economics/mortality-risk-valuation#means (last visited Aug. 14, 2018). 30 Lauraine G. Chestnut et. al., The Economic Value Of Preventing Respiratory And Cardiovascular Hospitalizations (Contemporary Economic Policy, 24: 127–143. doi: 10.1093/CEP/BYJ007, Jan. 2006), available at http://onlinelibrary.wiley.com/doi/10.1093/cep/byj007/full.
Statewide valuation of health benefits were calculated by multiplying the avoided health outcomes by valuation per incident. Staff quantified the total statewide valuation due to avoided health outcomes between 2021 and 2032. These values are summarized in Table 23. The spatial distribution of these benefits follow the distribution of emission reductions and avoided adverse health outcomes; therefore, most benefits to individuals would occur in the South Coast and San Francisco air basins. Table 23. Statewide Valuation from Avoided Adverse Health Outcomes between
C. Uncertainty Associated with Incidents-Per-Ton Factors There are uncertainties associated with the development of the IPT factors used in the estimation of noncancer health impacts. Each component has a certain degree of uncertainty associated with its estimation and prediction due to the assumptions made. Therefore, there are uncertainties and limitations with the results. The reference case used to develop IPT factors reconstructs ambient concentrations of both primary PM2.5 and secondary ammonium nitrate formed in the atmosphere from NOx emissions to estimate population exposure. These datasets were constructed from California ambient monitoring networks, which have limited spatial and temporal coverage. Atmospheric concentrations of PM vary dramatically both spatially and temporally depending on the emission behavior of local sources, the local meteorological conditions, and topographical features. Extrapolating atmospheric concentrations between air quality monitors adds uncertainty to the underlying methodology. Additionally, the concentration-response functions that are also used in the development of IPT factors are difficult to measure and contain inherent uncertainty. However, they are based on the best available science.
Preliminary Health Analyses
55
V. REFERENCES CARB, 1998a. California Air Resources Board, Report to the Air Resources Board on the Proposed Identification of Diesel Exhaust as a Toxic Air Contaminant; Part A, Exposure Assessment; As Approved by the Scientific Review Panel on April 22, 1998. Available at https:/www.arb.ca.gov/toxics/dieseltac/part_a.pdf%20 CARB, 2002. California Air Resources Board and Office of Environmental Health Hazard Assessment, Staff Report: Public Hearing to Consider Amendments to the Ambient Air Quality Standards for Particulate Matter and Sulfates, May 2002. Available at https://www.arb.ca.gov/carbis/research/aaqs/std-rs/pm-final/PMfinal.pdf CARB, 2006. California Air Resources Board, Diesel Particulate Matter Exposure Assessment Study for the Ports of Los Angeles and Long Beach, April 2006. Available at https://www.arb.ca.gov/ports/marinevess/documents/portstudy0406.pdf CARB, 2007. California Air Resources Board, Airborne Toxic Control Measure for Auxiliary Diesel Engines Operated on Ocean-Going Vessels At-Berth in a California Port, 2007. Available at https://www.arb.ca.gov/ports/shorepower/finalregulation.pdf CARB, 2008. California Air Resources Board, Initial Statement of Reasons for Proposed Rulemaking - Fuel Sulfur and Other Operational Requirements for Ocean-Going Vessels Within California Waters and 24 Nautical Miles of the California Baseline - June 2008. Available at https://www.arb.ca.gov/regact/2008/fuelogv08/ISORfuelogv08.pdf CARB, 2010a. California Air Resources Board, Estimate of Premature Deaths Associated with Fine Particle Pollution (PM2.5) in California Using a U.S. Environmental Protection Agency Methodology. Available at https://www.arb.ca.gov/research/health/pm-mort/pm-report_2010.pdf CARB, 2010b. Staff Report: Initial Statement of Reasons for Proposed Rulemaking. Proposed Amendments to the Truck and Bus Regulation, the Drayage Truck Regulation and the Tractor-Trailer Greenhouse Gas Regulation, Appendix J. Methodology for Estimating Ambient Concentrations of Particulate Matter from Diesel-Fueled Engine Emissions And Health Benefits Associated with Reductions in Diesel PM Emissions from In-Use On-Road Heavy-Duty Diesel-Fueled Vehicles. Available at http://www.arb.ca.gov/regact/2010/truckbus10/correctedappj.pdf CARB, 2013a. California Air Resources Board, Area Designations for State Air Quality Standards. Available at http://www.arb.ca.gov/desig/adm/2013/state_pm25.pdf CARB, 2013b. California Air Resources Board, Area Designations for National Air Quality Standards. Available at http://www.arb.ca.gov/desig/adm/2013/fed_pm25.pdf
Fann et. Al, 2009. Fann N, Fulcher CM, Hubbell BJ. 2009. The influence of location, source, and emission type in estimates of the human health benefits of reducing a ton of air pollution. Air Qual Atmos Health. 2009 Sep; 2(3):169-176. https://www.ncbi.nlm.nih.gov/pmc/articles/PMC2770129/ IARC, 2012. International Agency for Research on Cancer, Diesel Engine Exhaust Carcinogenic, June 2012. Available at https://www.iarc.fr/en/media-centre/pr/2012/pdfs/pr213_E.pdf OEHHA, 2015. Office of Environmental Health Hazard Assessment, The Air Toxics Hot Spots Program Guidance Manual for Preparation of Health Risk Assessments, 2015. Available at https://oehha.ca.gov/media/downloads/crnr/2015guidancemanual.pdf OEHHA, 2018. Office of Environmental Health Hazard Assessment, California Communities Environmental Health Screening Tool, Version 3.0 (CalEnviroScreen 3.0). Available at https://oehha.ca.gov/calenviroscreen/report/calenviroscreen-30. Accessed October 2018 RMP, 2015. California Air Resources Board and California Air Pollution Control Officers Association, Risk Management Guidance for Stationary Sources of Air Toxics, July, 2015. Available at https://www.arb.ca.gov/toxics/rma/rmgssat.pdf SCAQMD, 2018a. South Coast Air Quality Management District, SCAQMD Modeling Guidance for AERMOD. Available at https://www.aqmd.gov/home/air-quality/air-quality-data-studies/meteorological-data/modeling-guidance#AERMOD. Accessed October 2018 SCAQMD, 2018b. South Coast Air Quality Management District, SCAQMD Meteorological Data for AERMOD. Available at https://www.aqmd.gov/home/air-quality/air-quality-data-studies/meteorological-data/data-for-aermod. Accessed October 2018 U.S. EPA, 2009. United States Environmental Protection Agency, Integrated Science Assessment for Particulate Matter. Available at http://www.epa.gov/ncea/pdfs/partmatt/Dec2009/PM_ISA_full.pdf U.S. EPA, 2011. United States Environmental Protection Agency, The Benefits and Costs of the Clean Air Act from 1990 to 2020, Final Report – Rev. A. Available at https://www.epa.gov/sites/production/files/2015-07/documents/fullreport_rev_a.pdf U.S. EPA, 2013. United States Environmental Protection Agency, Fine Particle Concentrations Based on Monitored Air Quality from 2009 - 2011. Available at http://www.epa.gov/pm/2012/20092011table.pdf
U.S. EPA, 2017a. United States Environmental Protection Agency, Environmental Benefits Mapping and Analysis Program: Community Edition (BenMAP-CE) User Manual and Appendices. Research Triangle Park, NC. Available at www.epa.gov/benmap U.S. EPA, 2017b. United States Environmental Protection Agency, 40 CFR Part 51, Revisions to the Guideline on Air Quality Models: Enhancements to the AERMOD Dispersion Modeling System and Incorporation of Approaches to Address Ozone and Fine Particulate Matter. Available at https://www3.epa.gov/ttn/scram/appendix_w/2016/AppendixW_2017.pdf. U.S. EPA, 2018. United States Environmental Protection Agency, User's Guide for the AMS/EPA Regulatory Model (AERMOD), April 2018. Available at https://www3.epa.gov/ttn/scram/models/aermod/aermod_userguide.pdf WMO, 2008. World Meteorological Organization, Guide to Meteorological Instruments and Methods of Observation, 2008. Available at https://library.wmo.int/pmb_ged/wmo_8_en-2012.pdf